un-ece 2000 - 1 un/ece timber committee rome, oct. 2000 secondary processed wood products markets in...
TRANSCRIPT

UN-ECE 2000 - 1
UN/ECE Timber Committee
Rome, Oct. 2000
Secondary Processed Wood Products Markets
in ECE countries
P-M. DESCLOSForest Products Consultants

UN-ECE 2000 - 2
Highlights
Trade of secondary processed wood products (SPWPs) is smaller but growing faster than that of primary products in both temperate and tropical species.
The United States and the EU are the world’s major producers, importers and exporters of SPWPs.
Furniture is the most traded SPWP in the ECE region and overall the region is a net importer.
Volumes of SPWPs traded are difficult to assess from trade and production statistics.
P - M D E S C L O SForest Produc ts Consultants

UN-ECE 2000 - 3
IntroductionThe volumes traded of secondary processed wood products (SPWPs) are still small
compared to primary-processed wood products, but they are growing faster than that of primary products in both temperate and tropical species.
P - M D E S C L O SForest Produc ts Consultants
020406080
100120140160180
1991 1992 1993 1994 1995 1996 1997 1998Primary w ood products SPWP, including furniture
Million $ World trade of SPWPs versus primary product
Sources: FAO, 2000; and Comtrade, 2000

UN-ECE 2000 - 4
IntroductionThis trend is not specific to ECE member countries. ITTO trade analysis report similar and
even more accentuated evolution.
ITTO Consumer Imports of Primary and Secondary Tropical Timber Products
P - M D E S C L O SForest Produc ts Consultants
0
5
10
15
91 92 93 94 95 96 97 98Secondary Primary
Sour ce : IT T O, 1 999 Annual r eview
billion $

UN-ECE 2000 - 5
DriversThis evolution is driven by several factors:
the development of consumption in various economic areas of the globe;
a revision of the structure of manufacturing industries, focusing on core-competence, opting for less vertical integration and consequently more out-sourcing ;
the differential of manpower costs between developing and developed nations;
the governmental incentives of many developing countries aiming at adding value locally and the resultant investments;
improved and competitive delivery logistics.
P - M D E S C L O SForest Produc ts Consultants

UN-ECE 2000 - 6
Tracking Secondary Processed Wood
Products Tracking SPWPs is not always an easy thing.
The identification and definition of SPWPs at any intermediate steps of a given manufacturing process, as semi-finished components or as finished parts, are at some stages uncertain.
It is also worth noting that finished, and even semi-finished products, are rarely made only of wood. This should be remembered when analysing and/or comparing the value of various groups of products.
The complexity of analysing all these factors partly explains why the headings “Other products” are frequently so big.
Trade figures can differ vastly from production. This is often the case for packaging.
All the following data refer to ECE member countries.
We will explore the main characteristics of the trade of SPWPs through selected examples.
P - M D E S C L O SForest Produc ts Consultants

UN-ECE 2000 - 7
Furniture: a separate sector In value, the wood furniture sector alone is twice as big as all the other SPWPs together.
P - M D E S C L O SForest Produc ts Consultants
0
5000
10000
15000
20000
Imports Exports
Wood Furniture Other Wood Products
Value in million $
Source: Comtrade 2000

UN-ECE 2000 - 8
FurnitureThe main furniture sub-sectors identified in international statistics are: upholstered
seats, bedroom, kitchen and office furniture and chairs. All others are included in the large “Other Wooden Furniture” heading.
P - M D E S C L O SForest Produc ts Consultants
Source: Comtrade, 2000
Imports and exports of wood furniture by ECE countries, 1998
Imports
15%
8%
8%8%
42%
19%
Other wooden furniture Upholstered seats Bedroom furniture
Kitchen furniture Office furniture Chairs
Exports
14%
11%
9% 4%
22%
40%

UN-ECE 2000 - 9
Furniture
P - M D E S C L O SForest Produc ts Consultants
Furniture is a product with a high value-added ratio.
In some types of furniture, the wood material used is the very core of the value of the piece of furniture,
in others, like some upholstered chairs, the proportion of wood, in value and volume, is minimal.
UN-ECE 2000 - 10
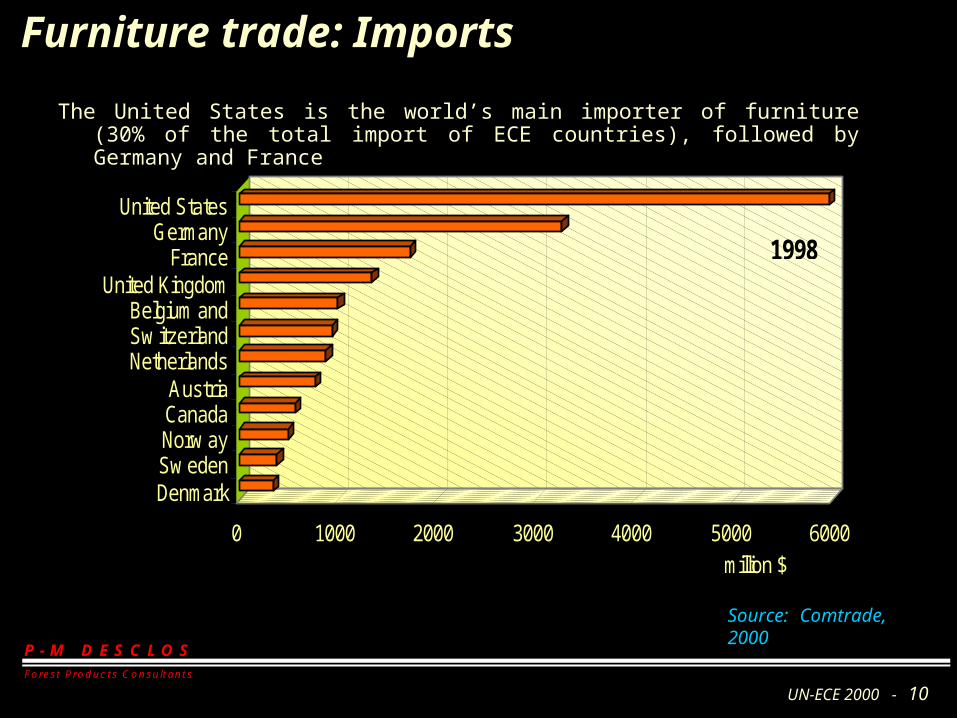
Furniture trade: Imports
P - M D E S C L O SForest Produc ts Consultants
The United States is the world’s main importer of furniture (30% of the total import of ECE countries), followed by Germany and France
Source: Comtrade, 2000
0 1000 2000 3000 4000 5000 6000
DenmarkSw edenNorw ayCanadaAustria
NetherlandsSw itzerlandBelgium and
United KingdomFrance
GermanyUnited States
million $
1998

UN-ECE 2000 - 11
Furniture trade: Exports from ECE Members
P - M D E S C L O SForest Produc ts Consultants
Italy is the leading exporter with 26% of the total exported
Source: Comtrade, 2000
0 1000 2000 3000 4000 5000 6000
AustriaUnited
SwedenSpain
USABelgium,
FrancePoland
DenmarkCanada
GermanyItaly
million $
1998

UN-ECE 2000 - 12
Other wood products traded in the ECE countries
P - M D E S C L O S For e s t P r oduc ts C ons ulta nts
To avoid a confusion we will call “Wood Products” all SPWPs other than furniture.
Wood Products traded by ECE countries, 1998
Within the wood products sector, the value of trade in joinery and carpentry is the highest.
“Joinery and carpentry” includes a wide range of products such as windows, doors, assembled flooring, concrete forms, shingles and shakes.
0 1000 2000 3000 4000 5000
Tools and handlesBarrels, casks
TablewareFrames for pictures
Marquetry
Packing cases, palletsProfiled wood
Other articles of woodJ oinery & carpentry
Exports
Importsmillion
$

UN-ECE 2000 - 13
Wood Products trade: Imports of ECE Countries
P - M D E S C L O SForest Produc ts Consultants
Source: Comtrade, 2000
0 500 1000 1500 2000 2500 3000 3500
SpainSwitzerland
AustriaNetherlands
CanadaBelgium and
ItalyFrance
United KingdomGermany
United States
million $
1998
UN-ECE 2000 - 14
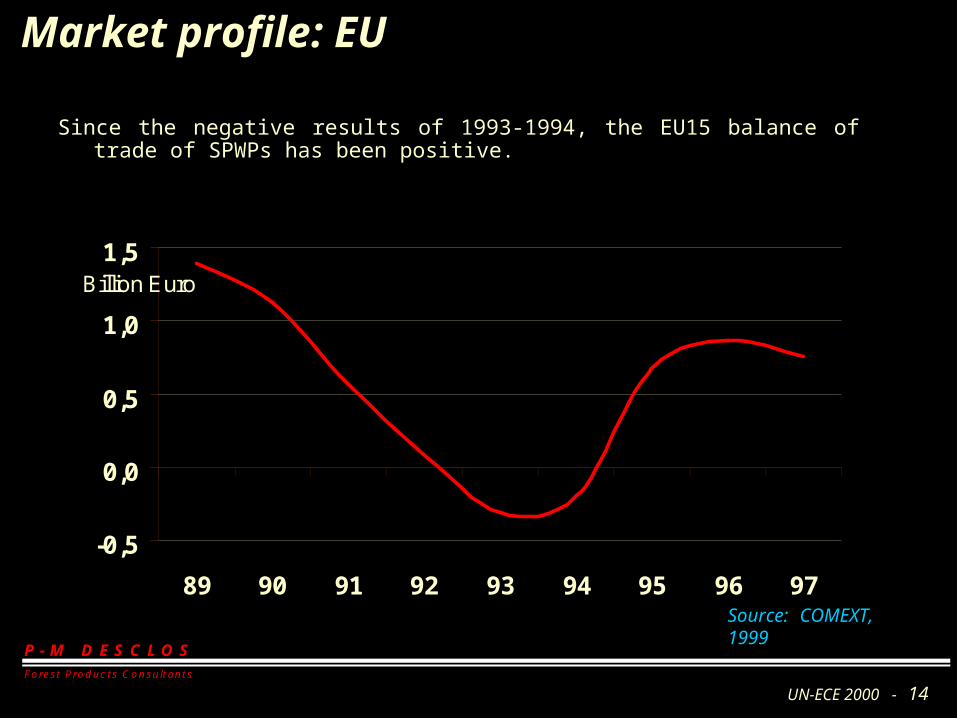
Market profile: EU
P - M D E S C L O SForest Produc ts Consultants
Since the negative results of 1993-1994, the EU15 balance of trade of SPWPs has been positive.
Source: COMEXT, 1999
-0,5
0,0
0,5
1,0
1,5
89 90 91 92 93 94 95 96 97
Billion Euro
UN-ECE 2000 - 15
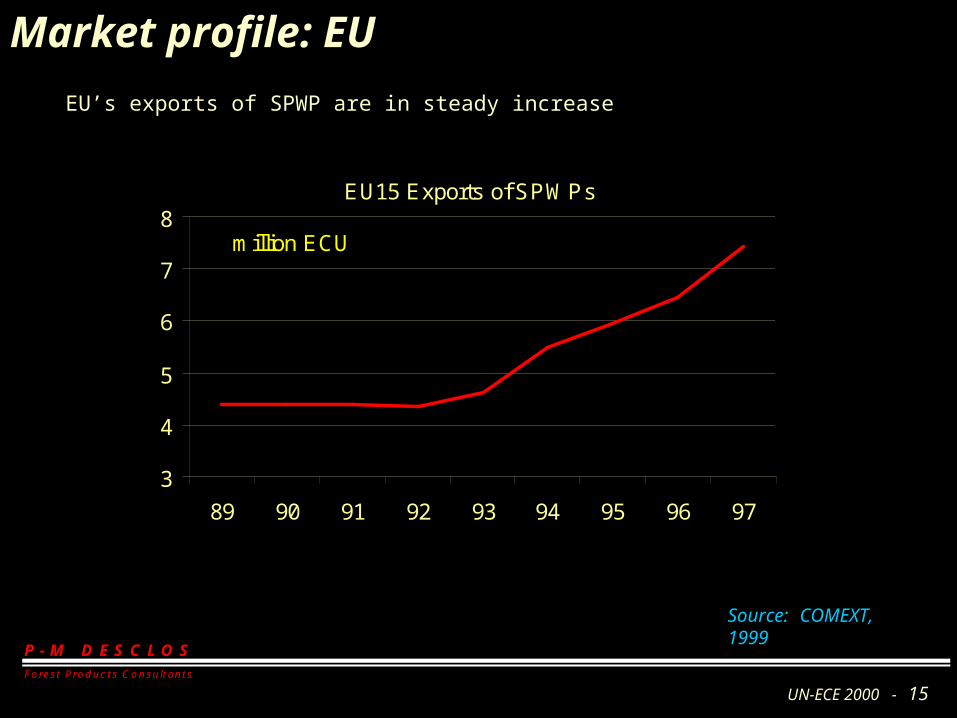
Market profile: EU
P - M D E S C L O SForest Produc ts Consultants
EU’s exports of SPWP are in steady increase
Source: COMEXT, 1999
EU15 Exports of SPWPs
3
4
5
6
7
8
89 90 91 92 93 94 95 96 97
million ECU
UN-ECE 2000 - 16
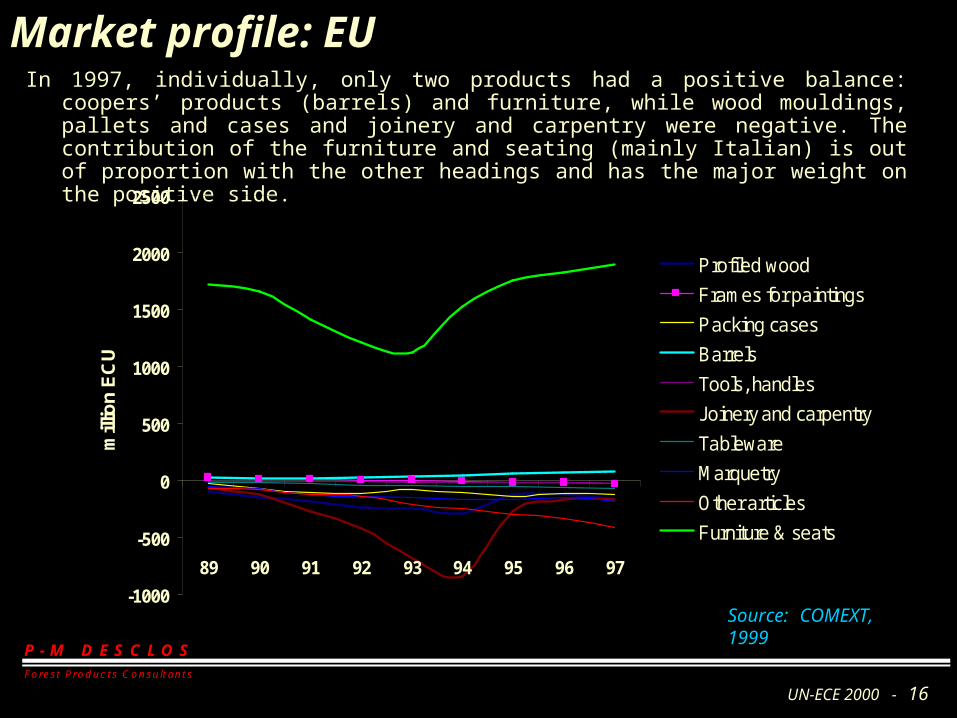
Market profile: EU
P - M D E S C L O SForest Produc ts Consultants
In 1997, individually, only two products had a positive balance: coopers’ products (barrels) and furniture, while wood mouldings, pallets and cases and joinery and carpentry were negative. The contribution of the furniture and seating (mainly Italian) is out of proportion with the other headings and has the major weight on the positive side.
Source: COMEXT, 1999-1000
-500
0
500
1000
1500
2000
2500
89 90 91 92 93 94 95 96 97
mill
ion
EC
U
Profiled wood
Frames for paintings
Packing cases
Barrels
Tools, handles
Joinery and carpentry
Tableware
Marquetry
Other articles
Furniture & seats

UN-ECE 2000 - 17
Market profile: EU
P - M D E S C L O SForest Produc ts Consultants
France and USA make up 90 % of the total ECE coopers’ products export (France 66%, USA 14%). In 1997, the French production represented more than 500.000 barrels.
EU15 trade of cooper’s products (million ECU)
Source: Comext, 1999
0
20
40
60
80
100
120
89 90 91 92 93 94 95 96 97
Imports
Exports

UN-ECE 2000 - 18
Market profile: USA
P - M D E S C L O SForest Produc ts Consultants
As shown before, the United States is the largest importer of SPWPs, including furniture, and the second largest exporter behind Canada.
Since 1991, both imports and exports have been in constant growth, with a negative balance of trade for all SPWPs.
USA trade of SPWPs, excluding furniture
Source: Comtrade, 2000
0
500
1000
1500
2000
2500
3000
3500
1991 1992 1993 1994 1995 1996 1997 1998
mill
ion
$
Imports
Exports
UN-ECE 2000 - 19
Market profile: USA
P - M D E S C L O SForest Produc ts Consultants
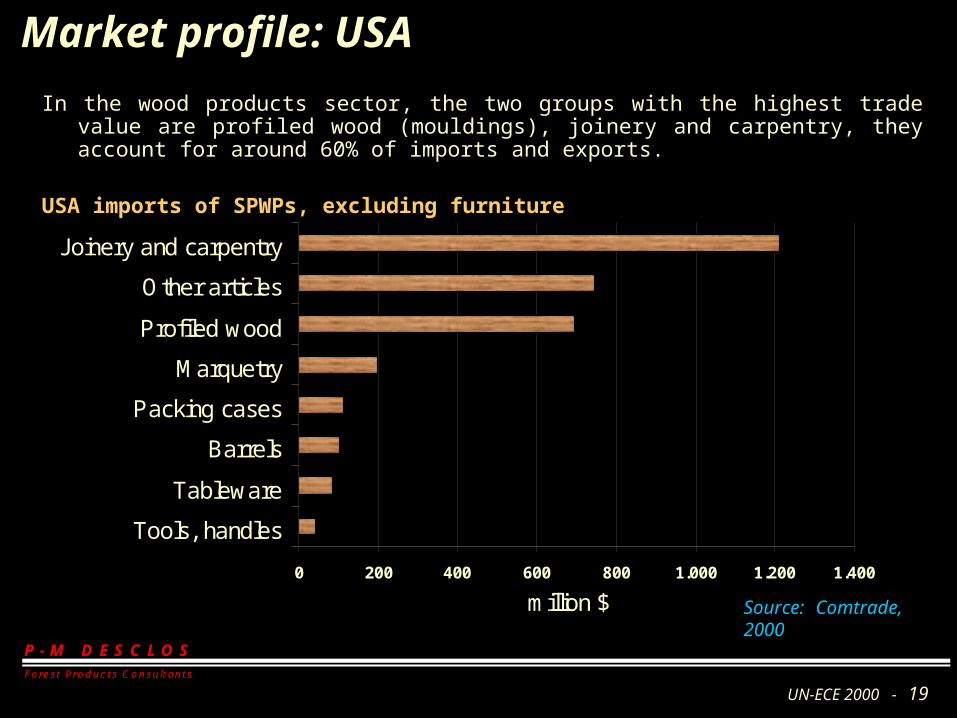
In the wood products sector, the two groups with the highest trade value are profiled wood (mouldings), joinery and carpentry, they account for around 60% of imports and exports.
USA imports of SPWPs, excluding furniture
Source: Comtrade, 2000
0 200 400 600 800 1.000 1.200 1.400
Tools, handles
Tableware
Barrels
Packing cases
Marquetry
Profiled wood
Other articles
Joinery and carpentry
million $

UN-ECE 2000 - 20
Market profile: USA
P - M D E S C L O SForest Produc ts Consultants
US imports of profiled wood were multiplied by 2.2 between 1991 and 1998. Canada is the main supplier.
Source: Comtrade, 2000
0
100
200
300
400
500
600
700
mill
ion
$
1991 1992 1993 1994 1995 1996 1997 1998
USA imports of profiled wood 1991 - 1998
UN-ECE 2000 - 21
Market profile: USA
P - M D E S C L O SForest Produc ts Consultants
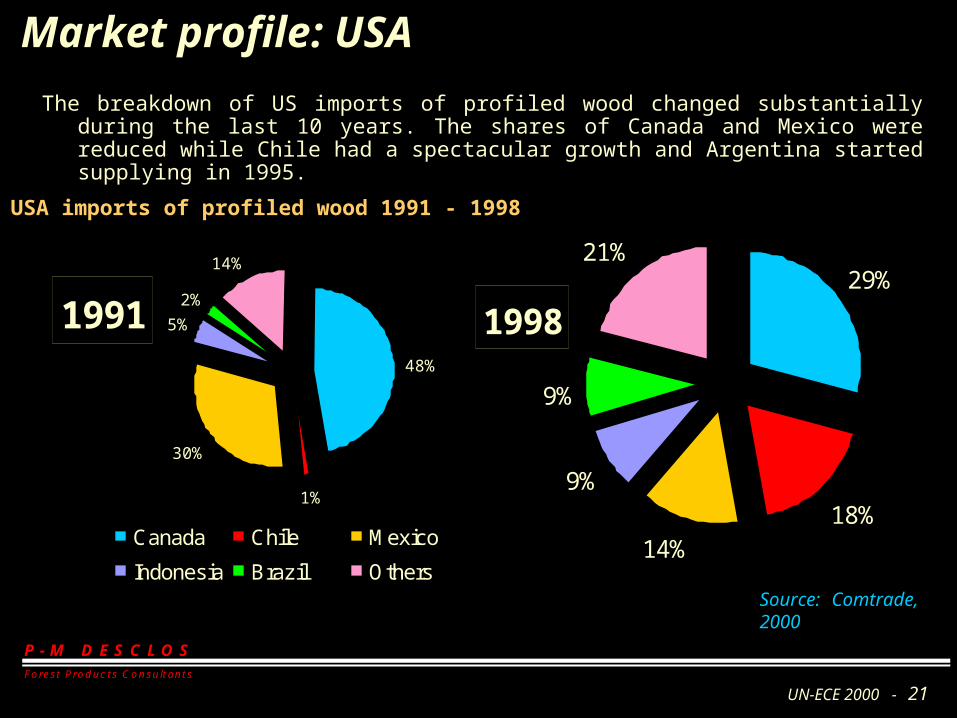
The breakdown of US imports of profiled wood changed substantially during the last 10 years. The shares of Canada and Mexico were reduced while Chile had a spectacular growth and Argentina started supplying in 1995.
Source: Comtrade, 2000
199148%
1%
30%
5%
2%
14%
Canada Chile Mexico
Indonesia Brazil Others
199829%
18%14%
9%
9%
21%
USA imports of profiled wood 1991 - 1998

UN-ECE 2000 - 22
Market profile: USA
P - M D E S C L O SForest Produc ts Consultants
Exports of joinery and carpentry products from the USA are much smaller than imports. Two countries (Canada and Japan) make up 76% of the total export.
Source: Comtrade, 2000
0
200
400
600
800
1000
1200
1400
1991 1992 1993 1994 1995 1996 1997 1998
mill
ion
$
Export Import
USA trade of joinery and carpentry products

UN-ECE 2000 - 23
ConclusionIn the ECE region the trade in SPWPs is growing faster than the trade in primary products. Many
major forest products producers are seeking to maximize value-added processing and minimize exports of primary products. This trend is particularly evident in South-East Asian countries.
The increasing importance of secondary processing merits attention because focus on only primary-processed products gives too narrow a view on wood products production, consumption and trade in the ECE region.
The statistics on primary processing, e.g. sawnwood production, only give a partial picture of reality. Trade and especially production of SPWPs are difficult to measure due to imprecisions in identifying the contribution of wood, in value or volume, in semi-finished or final products.
P - M D E S C L O SForest Produc ts Consultants