ultraviolet radiation changes - nasa · ultraviolet radiation changes scientific summary a major...
TRANSCRIPT
-5//- _SJ
N93.1_ 8
CHAPT Rll
Ultraviolet Radiation Changes
R.L. McKenzie
M. Ilyas
Authors:
J.E. Frederick
V. Filyushkin
Additional Contributors:
A. Wahner
R Muthusubramanian
C.E. Roy
K. Stamnes
M. Blumthaler
S. Madronich
https://ntrs.nasa.gov/search.jsp?R=19930001910 2018-08-31T13:38:40+00:00Z
2 :
Chapter 11
Ultraviolet Radiation Changes
Contents
SCIENTIFIC SUMMARY ................................................................................................... 11.1
11.1 UV MEASUREMENTS AND ANALYSES ............................................................... 11.3
11.1.1
11.1.2
11.1.3
11.1.4
Interpretation of UVB Time Series Data .......................................................... 11.3
Effects of Antarctic Ozone Depletion .............................................................. 11.5
Global Effects ................................................................................................... 11.7
Radiative Amplication Factor Deduced From Measurements ......................... 11.7
11.2 CHANGES IN ULTRAVIOLET RADIATION BASED ON ...................................... 11.11
MEASURED AND COMPUTED OZONE AMOUNTS
11.2.1 Objectives and Limitations ............................................................................... 11.11
11.2.2 Changes in Erythemal Radiation Based on TOMS Ozone Measurements ...... 11.11
11.2.3 Predicted Changes in Erythemal Radiation Based on Computed
Ozone Values .................................................................................................... 11.13
REFERENCES ..................................................................................................................... 11.13
ULTRAVIOLET RADIATION CHANGES
SCIENTIFIC SUMMARY
A major consequence of ozone depletion is an increase in solar ultraviolet CUV) radiation received at the
Earth's surface. This chapter discusses advances that have been made since the previous assessment (WMO,1990) to our understanding of UV radiation. The impacts of these changes in UV on the biosphere are not
included, because they are discussed in the effects assessment (UNEP, 1991). The major conclusions andrecommendations are:
Significant improvements in the UV data base have occurred since the last assessment. Spectralmeasurements are becoming available, but, to determine trends, long-term accurate measurements of UVare required at unpolluted sites.
Biologically damaging UV has been observed to more than double during episodes of ozone depletion inAntarctica. Smaller episodic enhancements have been measured in Australia. The observed enhancements
are consistent with the results of radiative transfer calculations for clear sky conditions.
An erythemal Radiative Amplification Factor (RAF) of 1.25 + 0.20 has been deduced from measurements
of ozone and UV at a clean air site. This is in agreement with the RAF derived from model calculations(RAF = 1.1 at 30 ° N).
There is an apparent discrepancy between observed UV trends from the Robertson-Berger (RB) network
and those calculated from TOMS ozone data. Cloud variability, increases in tropospheric ozone andaerosol extinctions may have masked the UV increase due to ozone depletion. In addition, the data record
available for comparison is short, and the instrument calibration (which is critical) is still in question.
However, at a high-altitude European observatory, the observed positive trends in UV appear to be largerthan expected. Further studies of the effects of cloud and aerosol on UV are required.
Clear-sky radiative transfer calculations using ozone fields measured by the TOMS instrument show that
during the 1980s erythemally active UV has increased significantly at latitudes poleward of 30 °, with largerincreases in the Southern Hemisphere, particularly at high latitudes.
Significant increases in UV effects are most likely to appear first in the Southern Hemisphere where in thesummer, historical ozone levels are lower and the Earth-Sun separation is a minimum. Further, in the
SouthernHemisphere, stratospheric ozone losses ate more severe, tropospheric ozone has not increased,and aerosol concentrations are lower.
• Existing chemical models underestimate the changes in the observed ozone fields. Therefore, they cannotbe used to accurately predict future changes in UV fields.
11.1
=
ULTRAVIOLET RADIATION CHANGES
1 l. 1 UV MEASUREMENTS AND ANALYSES
11.1.1 Interpretalion of Uhraviolet-B (UVB)Time Series Data
The most comprehensive time series of UVBdata are those from the Robertson-Berger (RB)network. However, a study by Scotto et al. (1988)showed no increase in UVB at U.S. observation sites,
despite the decrease in stratospheric ozone.
Investigations to understand the reasons for thissurprising result have continued. Increases in
tropospheric ozone that more than compensated forstratospheric ozone losses were proposed by Brtihl
and Crutzen (1989). However, recent analyses ofTOMS data and tropospheric ozone trends suggest anincrease in UVB should still have been observed
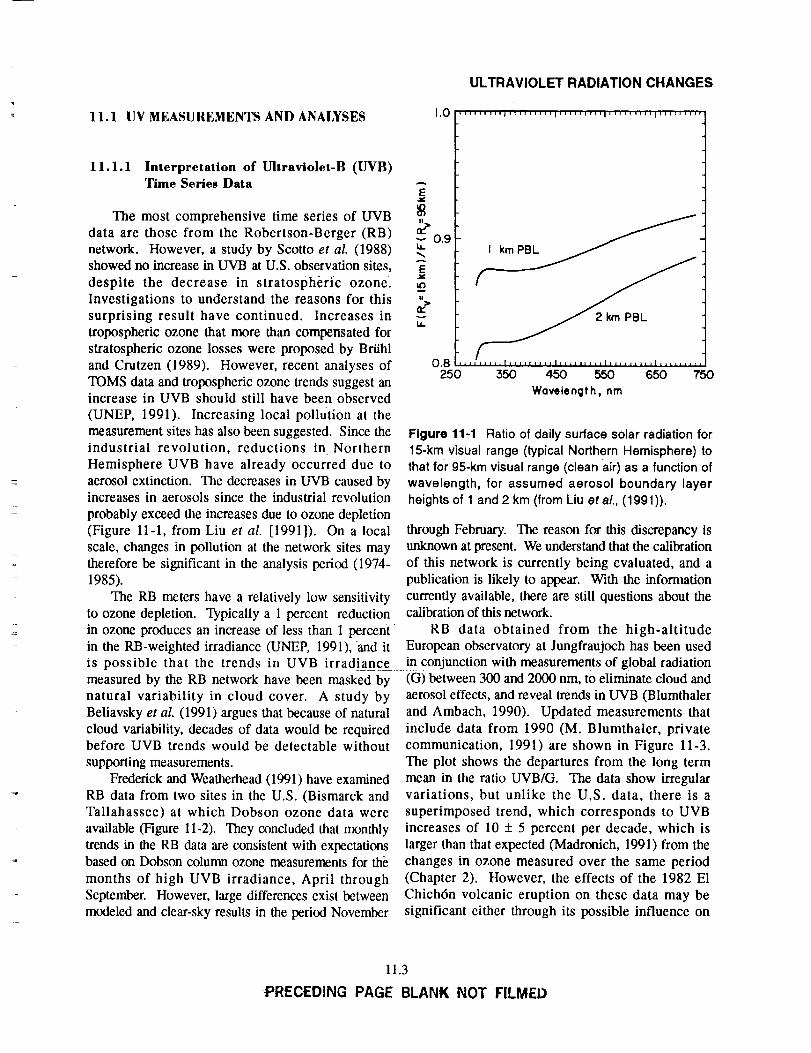
(UNEP, 1991). Increasing local pollution at themeasurement sites has also been suggested. Since theindustrial revolution, reductions in Northern
Hemisphere UVB have already occurred due to
aerosol extinction. The decreases in UVB caused byincreases in aerosols since the industrial revolution
probably exceed the increases due to ozone depletion
(Figure 11-1, from Liu et al. [1991]). On a localscale, changes in pollution at the network sites may
therefore be significant in the analysis period (1974-1985).
The RB meters have a relatively low sensitivityto ozone depletion. Typically a 1 percent reduction
in ozone produces an increase of less than 1 percentin the RB-weighted irradiance (UNEP, 1991), and it
1.0
A
E
0.9v
It.
..to
tt3
It3_
n,,v
t,
0.8250
lll,lllll/_llllllllltllrlllllllllllllrlllll_llllr
350 450 550 650 750Wavelength, nm
Figure 11-1 Ratio of daily surface solar radiation for15-km visual range (typical Northern Hemisphere) tothat for g5-km visual range (clean air) as a function ofwavelength, for assumed aerosol boundary layerheights of 1 and 2 km (from Liu eta/., (lggl)).
through February. The reason for this discrepancy isunknown at present. We understand that the calibration
of this network is currently being evaluated, and a
publication is likely to appear. With the informationcurrently available, there are still questions about thecalibration of this network.
RB data obtained from the high-altitude
European observatory at Jungfraujoch has been usedis possible that the trends in UVB irradiance in conjunction with measurements of global radiation
measured by the RB network have been masked by
natural variability in cloud cover. A study byBeliavsky et al. (1991) argues that because of naturalcloud variability, decades of data would be requiredbefore UVB trends would be detectable without
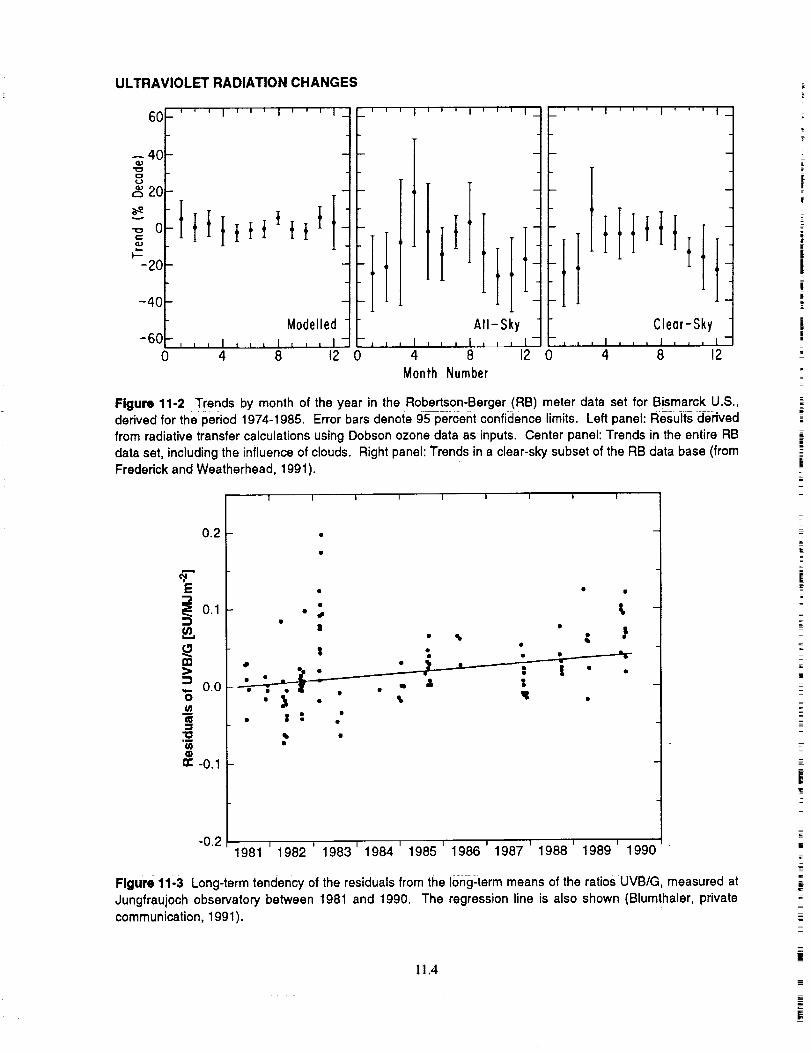
supporting measurements.Frederick and Weatherhead (1991) have examined
RB data from two sites in the U.S. (Bismarck andTallahassee) at which Dobson ozone data were
available (Figure 11-2). They concluded that monthly
trends in the RB data are consistent with expectationsbased on Dobson column ozone measurements for the
months of high UVB irradiance, April throughSeptember. However, large differences exist between
modeled and clear-sky results in the period November
(G) between 300 and 2000 nm, to eliminate cloud and
aerosol effects, and reveal trends in UVB (Blumthater
and Ambach, 1990). Updated measurements that
include data from 1990 (M. Blumthaler, privatecommunication, 1991) are shown in Figure 11-3.
The plot shows the departures from the long termmean in the ratio UVB/G. The data show irregularvariations, but unlike the U.S. data, there is a
superimposed trend, which corresponds to UVB
increases of 10 _+ 5 percent per decade, which islarger than that expected (Madronich, 1991) from the
changes in ozone measured over the same period(Chapter 2). However, the effects of the 1982 El
Chich6n volcanic eruption on these data may besignificant either through its possible influence on
11.3
PRECEDING PAGE BLANK NOT FILMED
ULTRAVIOLETRADIATIONCHANGES
6O
--40
,.-,20
o
'--20
L' ' ' I ' ' ' I ' ' '
-40
" Modelled "
-60 , , , I ,,, , I , , , I-0 4 8
, , , i _ , , i , , , i
I
I
' ' ' I ' ' ' I ' ' ' 1
All-Sky Clear-Sky- _ l i I , , , I , , , I J .L , I , , , I , , , I
12 0 4 8 12 0 4 8 12Month Number
Figure 11-2 Trends by month of the year in the Robertson-Berger (RB) meter data set for Bismarck U.S.,derived for the period 1974-1985. Error bars denote g5 percent confidence limits. Left panel: Results derivedfrom radiative transfer calculationsusing Dobson ozone data as inputs. Center panel: Trends in the entire RBdata set, includingthe influence of clouds. Right panel: Trends in a clear-sky subset of the RB data base (fromFrederick and Weatherhead, 1991).
0.2
0.1m.
_> 0.0"6_m
,'12_u}On,. -0.1
-0.2
I I I I I I I I I
• . _! |• }, • • • • ,
• I = "
I
1981 1982I I I I I I I
1983 1984 1985 1986 1987 1988 1989 1990
Figure 11-3 Long-term tendency of the residuals from the I(mg-term means of the ratios UVB/G, measured atJungfraujoch observatory between 1981 and 1990. The regression line is also shown (Blurnthaler, privatecommunication,1991).
11.4
ULTRAVIOLET RADIATION CHANGES
ozone that was anomalously low at these latitudes in1983 (WMO, 1990), or through changes in thewavelength-dependent aerosol optical depth (Kent et [0 0
aL, 1991).
There has been an increasing awareness thatspectral measurements are required to study the
effects of changes in ozone on UV radiation. The RBresponse does not accurately represent any of thediverse biological action spectra of interest (UNEP,1991), whereas spectral data can be accurately '"-1121
convolved with various action spectra. In addition,
the spectral information enables greater confidence ininstrument calibration, and identification of the
reasons for any changes in UV. For example, spectral I:::measurements have enabled ozone column amounts ""
(Mto be deduced, and facilitated determination of cloud
and aerosol effects (Stamnes et al., 1990). The timeseries of UV spectral measurements is too short at tn
-4,--present to determine trends, but useful insights have -t-
nevertheless been gained already from analyses ofthis type of data.
11.1.2 Effects of Antarctic Ozone Depletion
In 1988 the National Science Foundation
established four sites for monitoring solar UV andvisible radiation in the high-latitude SouthernHemisphere. Three of these sites are on the Antarcticcontinent, at the South Pole, McMurdo, and Palmer
Stations, and one is located at Ushuaia, Argentina.Results from McMurdo (Stamnes et al., 1990), andfrom Palmer Station on the Antarctic peninsula(Lubin et al., 1989; Lubin and Frederick, 1991) have
appeared in the literature. To date the focus has beenon changes in surface ultraviolet irradiance associated
with the springtime depletion in ozone.The UV radiation field over Antarctica varies
with the solar elevation, clouds and haze, and the
atmospheric ozone amount. Over Palmer Station
(latitude 64.8 ° S), clouds, in a monthly averagedsense, reduce the surface UV irradiance to
approximately 50 to 60 percent of the values thatwould prevail under perpetually clear skies. The
springtime depletion in ozone constitutes a relativelyrecent perturbation to the highly variable radiationbackground. The two issues to consider here are (a)
the magnitude of the reduction in ozone and (b) the
,-,,..10-3{:3
C3Ih.,,
lh,.,
I.-.q
1(74
' I ' ' ' I ' ' ' I ' ' '
X
X
t
X
d(
X
X
WK•
• October19(Day293)
x December14(Doy.349]
•X
]0-5 , I , , , I , , _ I , i ,300 320 540 360
Wovelength(nm)
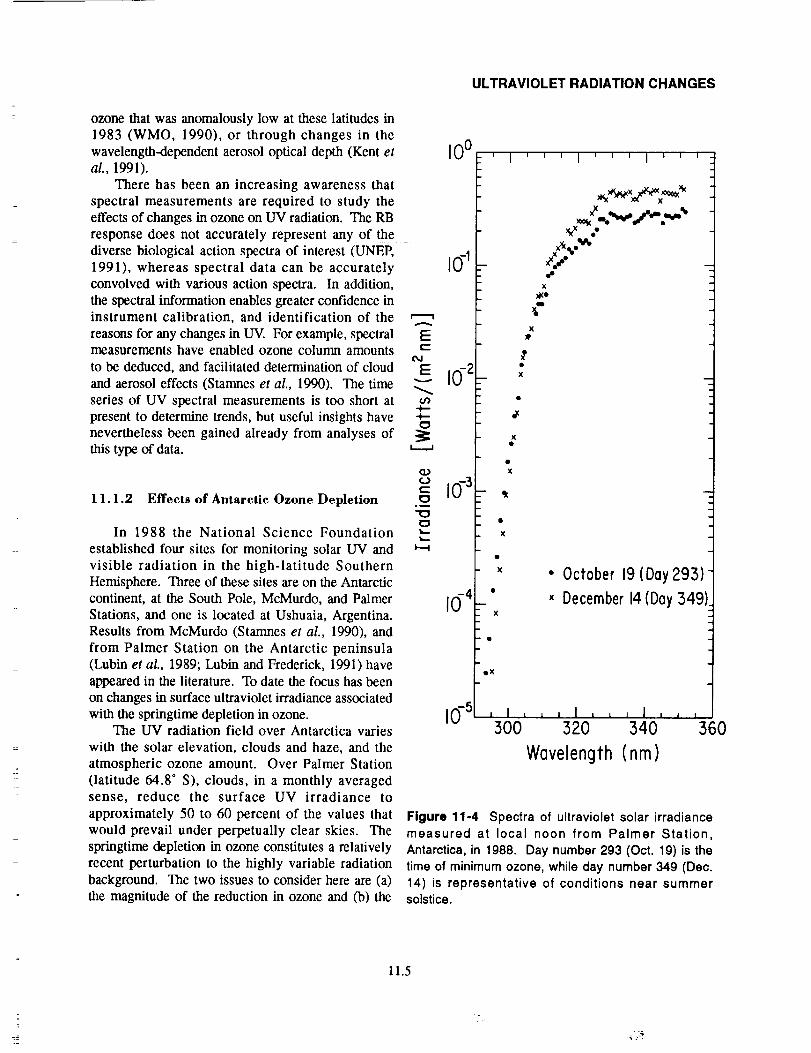
Figure 11-4 Spectra of ultraviolet solar irradiancemeasured at local noon from Palmer Station,Antarctica, in 1988. Day number 293 (Oct. 19) is thetime of minimum ozone, while day number 349 (Dec.14) is representative of conditions near summersolstice.
11.5
ULTRAVIOLET RADIATION CHANGES
timing of the reduction relative to the normal
seasonal cycle in solar radiation.
Figure 11-4 presents two spectra of surface UVirradiance measured at local noon from Palmer Station
on days number 293 (Oct. 19) and 349 (Dec. 14) of1988 (Lubin et al., 1989). The former date was the dayof minimum ozone, while the latter is near summersolstice. Based solely on solar elevation, one would
expect the largest irradiances in December. F!gure 11-4shows this to be the case at wavelengths longer than
315 nm. However, at shorter wavelength, the measuredirradiances for October equal and then exceed those inDecember. This is the manner in which a reduction in
ozone appears in UV radiation at the earth's surface.Although the enhanced irradiances exist at wavelengths
where the absolute energy flux is small, living cells arequite sensitive to damage in the spectral region from300 to 315 nm.
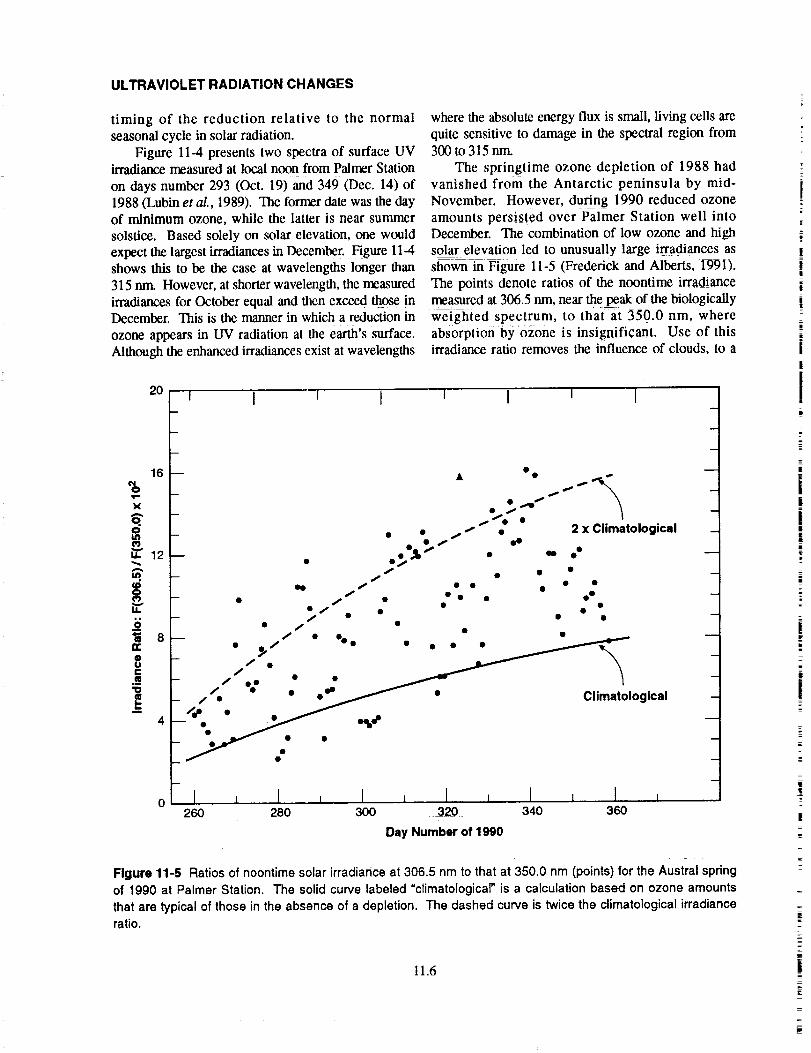
The springtime ozone depletion of 1988 hadvanished from the Antarctic peninsula by mid-November. However, during 1990 reduced ozone
amounts persisted over Palmer Station well intoDecember. The combination of low ozone and high
sol_ elevation led to unusually large irradiances asshown in Figure 11-5 (Frederick and Alberts, I991).
The points denote ratios of the noontime irradiancemeasured at 306.5 nm, near the peak of the biologically
weighted spectrum, to that at 350.0 nm, whereabsorption by ozone is insignificant. Use of thisirrad;ance ratio removes the influence of clouds, to a
20
16
• " 12
G"
g_ 6
!
4
i I i I i I i I
_ • O0 _.,,.
_ • • / 4 "" e" " 2 x Climatological
. ••%:'" . "• .. ..
_ • _ • • • • •o
- • f • • • •
_ ..:....//e • • • _ " Climatological
/o', " _ °5°"
•
I I I I I 1 I I I I I260 280 300 320 340 360
Day Number of 1990
Figure 11-5 Ratios of noontime solar irradiance at 306.5 nm to that at 350.0 nm (points) for the Austral springof 1990 at Palmer Station. The solid curve labeled "climatological" is a calculation based on ozone amountsthat are typical of those in the absence of a depletion. The dashed curve is twice the climatologicalirradianceratio.
11.6
ULTRAVIOLET RADIATION CHANGES
good approximation, so the points indicate variationsassociated with ozone only. The solid line representscomputed ratios based on the ozone climatology of
Nagatani et al. (1988) in which any springtime ozonereduction is small. The dashed line indicates double the
climatological prediction. Approximately 20 percent ofthe days during the spring of 1990 had irradiance ratios
in excess of the climatological prediction bya factor of2 or more, and the enhancement persisted into early
December when the daylight period is long.Measurements from McMurdo Station during 1990
yielded similar results, with ozone depletions persistingin December to give enhancements in biologicallyweighted radiation by a factor of three (Stamnes et al.,1991). The variations in observed UVB irradiances inAntarctica have been shown to be consistent with the
results of radiative transfer calculations (Stamnes et al.,
1990).The minimum ozone levels over Antarctica occur
in October. At this time, solar elevations are
relatively low, so that the maximum UV fluxes occurlater in the year. However, the transmission of sea-
ice has a strong seasonal maximum in spring so thatorganisms that live under the ice sheet may be at risk(Trodahl and Buckley, 1989). In terms of the
potential ecological effects, the duration of the ozonedepletion is likely to be an important quantity. Whenozone amounts remain low into December, the
instantaneous and 24-hour integrated UV irradiancesdiscussed above can be far in excess of the maximum
values experienced in Antarctica prior to the 1980s.
1 1.1.3 Global Effects
UVB perturbations have also been seen at mid-latitudes in the Southern Hemisphere, from episodic
intrusions of ozone-poor air from the Antarctic ozonehole. For example, Roy et al. (1990) showed an
association between high UVB levels in Melbourne,Australia, and ozone-depleted air arriving fromAntarctica in late 1987. Figure 11-6 shows the strong
anticorrelation between UVB (integrated over thewavelength range 285-315 nm) and ozone. The
impacts of the ozone changes on the observed UV areconsistent with model predictions, although
calculated irradiances are 10 percent smaller.
The Southern Hemisphere is where increases inUV stresses are most likely to appear first.
Historically, UV levels there have been high because
of the lower ozone amounts in summer comparedwith the Northern Hemisphere, and because the
Earth-Sun separation is smallest in January. Further,in the Southern Hemisphere stratospheric ozone
losses are more severe, tropospheric ozone has notincreased, and aerosol concentrations are lower(McKenzie, 1991).
In absolute terms, even small percentage
decreases in ozone are important in the tropics, sinceUVB levels there are already large. A 10 percent
decrease in ozone in the tropics would lead to a UVBincrease that is larger than the total UVB at mid-
latitudes (Ilyas, 1989). In view of this sensitivity,more tropical measurements of UV are clearlyrequired, even though the most recent analyses ofTOMS satellite ozone indicate that there have been
no changes of statistical significance at equatoriallatitudes.
1 1.1.4 Radiative Amplification FactorDeduced from Measurements
A suitable long-term data base does not yet existto enable global UV trends due to ozone depletion tobe determined. It has, however, been demonstrated
that under similar observing conditions (i.e., sameozone, sun angle, clear skies), any changes between1980 and 1988 in the measured spectral distributionof UV at Lauder, New Zealand (45°S, 170°E), were
small (Bittar and McKenzie, 1990). Since December
1989, spectral measurements from Lauder have beenmade routinely at fixed Solar Zenith Angles (SZAs)and near local noon, whenever weather conditions
permit. Typical spectra obtained at midday in winter
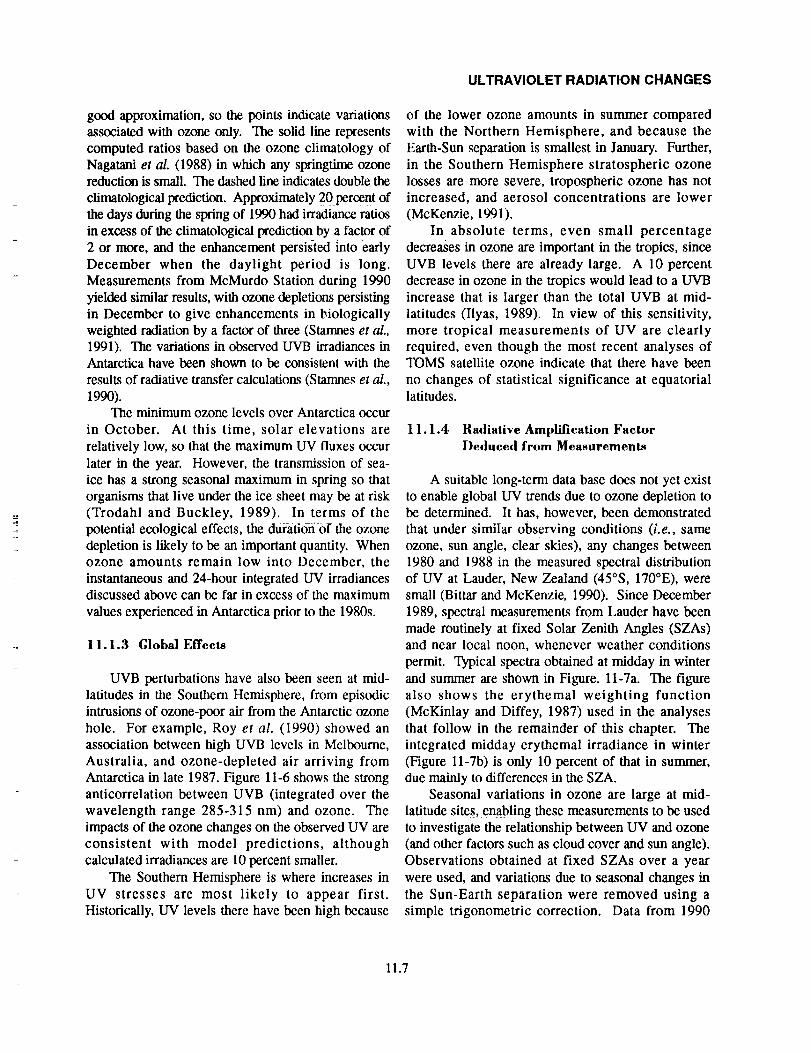
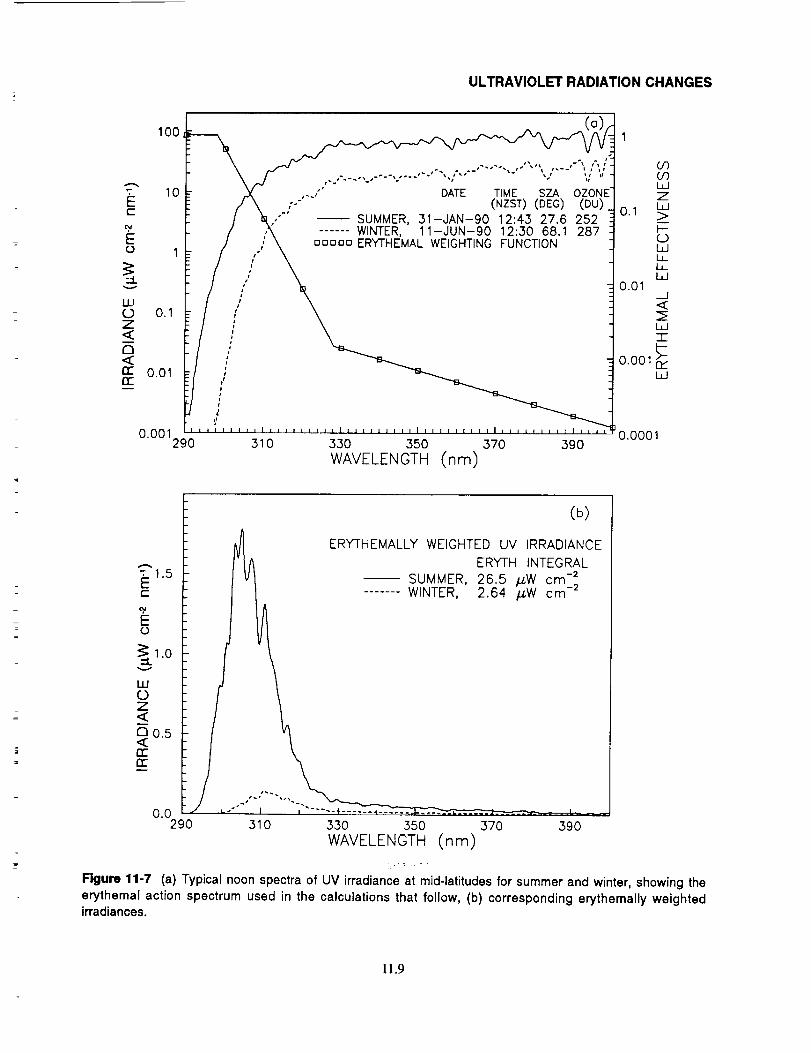
and summer are shown in Figure. 1I-7a. The figure
also shows the erythemal weighting function(McKinlay and Diffey, 1987) used in the analyses
that follow in the remainder of this chapter. Theintegrated midday erythemal irradiance in winter(Figure ll-7b) is only 10 percent of that in summer,
due mainly to differences in the SZA.Seasonal variations in ozone are large at mid-
latitude sites, enabling these measurements to be used
to investigate the relationship between UV and ozone(and other factors such as cloud cover and sun angle).
Observations obtained at fixed SZAs over a year
were used, and variations due to seasonal changes inthe Sun-Earth separation were removed using a
simple trigonometric correction. Data from 1990
11.7

ULTRAVIOLET RADIATION CHANGES
2.67
2.61
2.55
2.49
i 2.43
2.37
_ 2.31
2.25
2.19
2.13
ilililiilltlllli/lll*lltl/lllltilllil"illllltllilililliitllllliil
Melb°urne (38°S) _.
- _
tIIIIIlllllllll_ IIIIlllJ Llllllllllllllllllllllllllll
IDEC 87 JAN 88
DATE
330 i
320
i
310 _ R
300 _g ,
290 =o i•
280 _
J
270 |i
260 --=-|!|
250!
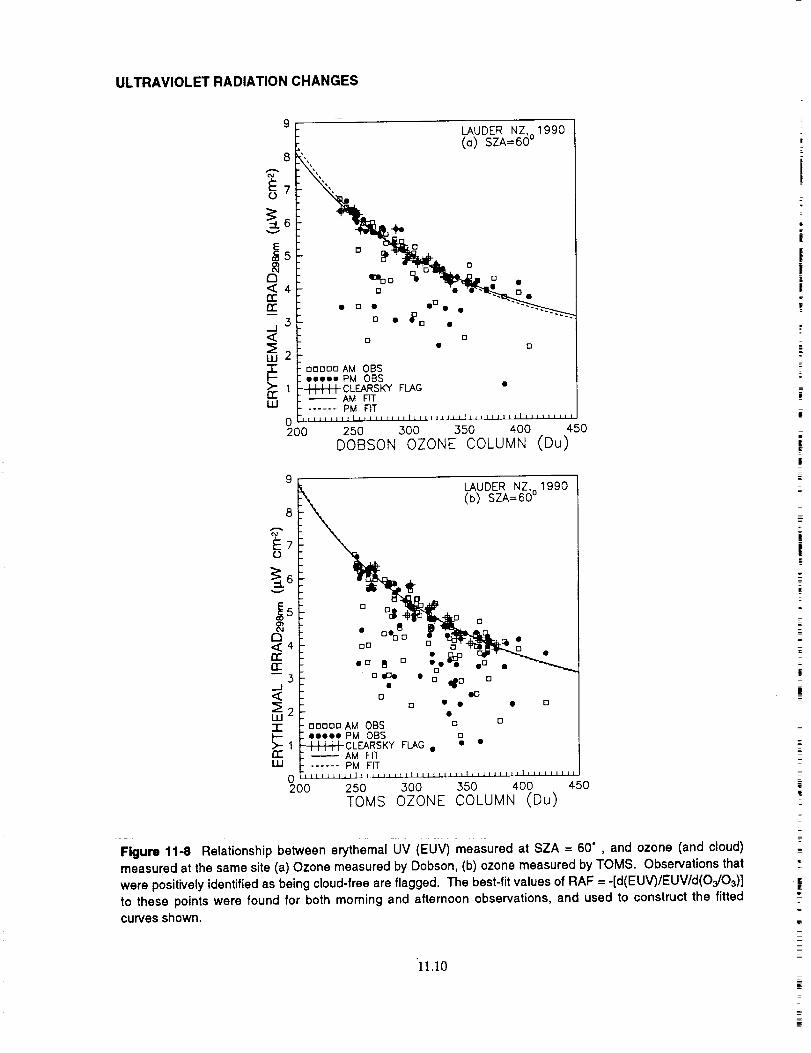
ozone column and erythemally weighted UVB forSZA = 60. The influence of clouds and SZA on
UVB dominate over ozone effects. Clouds frequently
reduce the irradiances by 50-percent or more (noobservations are attempted if rain is imminent). The
clear-sky subset of this data was used to deduce theincrease in erythemal UV (EUV) that would result
Thus the RAFderived from these measurements is1.25 + 0.20 (McKenzie et al., I99I).
The computed daily integrated RAF for this actionspectnma at 30°N is 1.1, and is insensitive to cloud and
tropospheric aerosol variations (UNEP, 1991).However, the calculated effect of an ozone
redistribution from the stratosphere to the troposphere
from a 1 percent decrease in ozone. This RAF: will lead a decrease in UV for small solar zenith angles[RAF = -(d(EUV)/EUV)/(d(O3)/O3)] was then used (Briihl and Crutzen, 1989), but may lead to an increaseto reconstruct the curves in the figure. Similarly, for large solar zenith angles (Tsay and Stamnes,
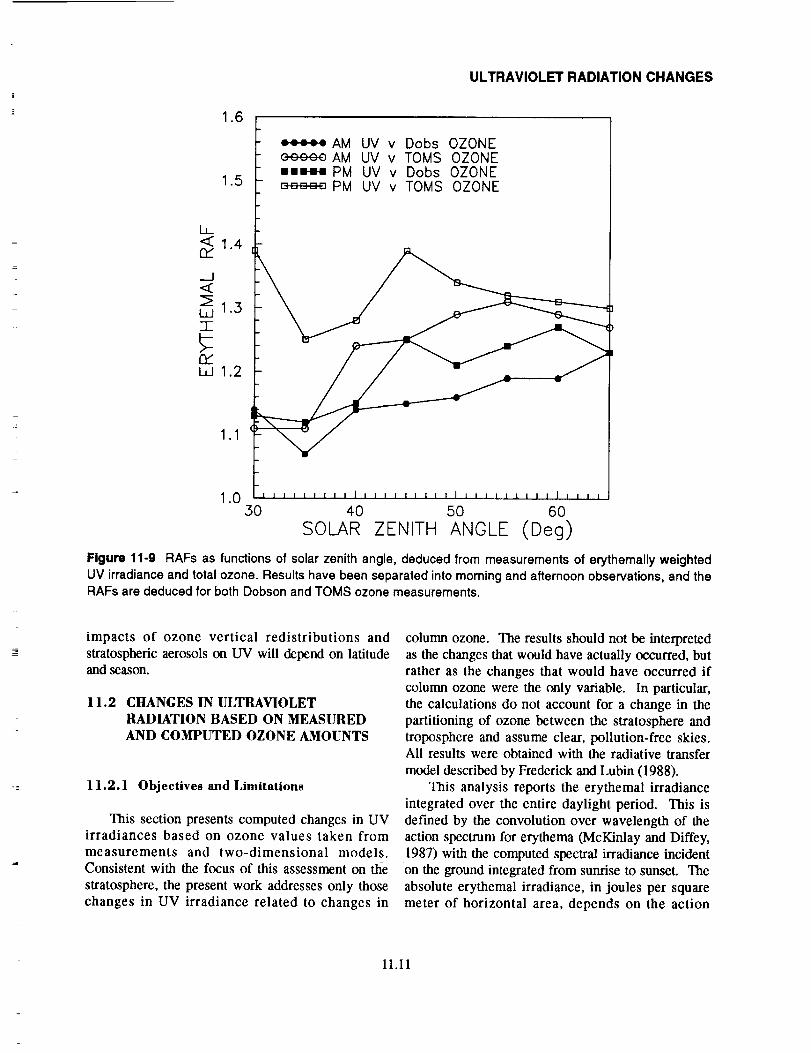
RAFs were derived for other SZAs. Figure 11-9 1991a). Stratospheric aerosols (from volcanos) have a
shows these RAFs as a function of SZA. The spread similar effect (Tsay and Stamnes, 1991b), so that
11.8
340
Figure 11-6 Comparison of solar UVB radiation (285 to 315 nm) and ozone at Melbourne, Australia (38" S),duringthe intrusion of ozone-poor air in December 1987 and January 1988 (from Roy et aL, (1990)).
were used in the analysis. In this period, variations in of results between morning and afternoon UVmeasutel'l'_nts,aerosol extinction were relatively small, and between TOMS and Dobson ozone
Figure il-8 shows-ihe relationship between data, indicates the uncertainty in the measurements.
ULTRAVIOLET RADIATION CHANGES
t-.
Eo
v
LL!OZ<O<rr(T
100
10
,/0.1 /
0.01
:1
0.001290 310
(o)
. . ,-..-....,,,,,._,--,;.,,,"
,..,'" DATE TIME SZA. (NZST) (DEG) (DU)i S
SUMMER, 31-JAN-90 12:43 27.6 252...... WINTER, 11-JUN-90 12:30 68.1 287
ooouu ERYTHEMAL WEIGHTING FUNCTION
330 350 37O 39O
WAVELENGTH (nm)
0.1
0.01
0.001
0.0001
C_O3WZW
F-
WLLLLW
_J<
WT
W
(b)
ERYTHEMALLY WEIGHTED UV IRRADIANCE
ERYTH INTEGRAL
SUMMER, 26.5 M,W crn -2_2....... WINTER, 2.64 ,u,W cm
330 350 370 590WAVELENGTH (nm)
Figure 11-7 (a) Typical noon spectra of UV irradiance at mid-latitudes for summer and winter, showing theerythemal action spectrum used in the calculations that follow, (b) corresponding erythemally weightedirradiances.
11.9
ULTRAVIOLET RADIATION CHANGES
8
5
3.._1<
LU2"l"
LLI
LAUDER NZ, 1990
(o) SZA=60 °
[] 0• 0
ooooo AM OBSenn PM OBS
1 --H-I-H-CLEARSKY FLAG •-- AM FIT...... PM FIT
O IIltlllllllllllllllllllllll'lllllllIlllllllllllll
200 250 300 350 400 450DOBSON OZONE COLUMN (Du)
8
--3_J<_2UJ'r
rrw
0200
LAUDER NZ, 1990
_ (b) SZA=60 °
[] I_:1• J [] []
0 00
0 • • • 0
ooooo AM OBS o oooooe PM OBS o
-{-H-.-_CLEARSKY FLAG • • •-- AM FIT...... PM FITI i i itt:l I ii ltllJ i i|1 i ltll II III I I I 1 I I I I | I I I I I I I I t
250 300 350 400 450
TOMS OZONE COLUMN (Du)
Figure 11-8 Relationship between erythemal UV (EUV) measured at SZA = 60' , and ozone (and cloud)measured at the same site (a) Ozone measured by Dobson, (b) ozone measured by TOMS. Observations thatwere positivelyidentifiedas being cloud-free are flagged. The best-fit values of RAF = -[d(EUV)/EUV/d(03/03)]to these points were found for both morning and afternoon observations, and used to construct the fittedcurves shown.
11.10
i
!I[
=
=
!
_=
!
J
=
il[
|r
=
ULTRAVIOLET RADIATION CHANGES
1.6
1.5
I,<:£ 1.4
__1 1.3
_ 1.2
1.1
_HHH_-oAM UV v Dobs OZONEe_-eeeAM UV v TOMS OZONEIHHH_-apM UV v Dobs OZONEB-_a-_apM UV v TOMS OZONE
1.0 ,i I I I t I I I I I I I J I J t ] I I 1 I I | I I I I I I I I I I
50 40 50 60
SOLAR ZENITH ANGLE (Deg)
Figure 11-9 RAFs as functions of solar zenith angle, deduced from measurements of erythemally weightedUV irradiance and total ozone. Results have been separated into morning and afternoon observations, and theRAFs are deduced for both Dobson and TOMS ozone measurements.
impacts of ozone vertical redistributions andstratospheric aerosols on UV will depend on latitudeand season.
1 1.2 CHANGES IN ULTRAVIOLET
RADIATION BASED ON MEASUREDAND COMPUTED OZONE AMOUNTS
11.2.1 Objectives and Limitations
This section presents computed changes in UVirradiances based on ozone values taken from
measurements and two-dimensional models.Consistent with the focus of this assessment on the
stratosphere, the present work addresses only thosechanges in UV irradiance related to changes in
column ozone. The results should not be interpretedas the changes that would have actually occurred, but
rather as the changes that would have occurred ifcolumn ozone were the only variable. In particular,
the calculations do not account for a change in thepartitioning of ozone between the stratosphere andtroposphere and assume clear, pollution-free skies.All results were obtained with the radiative transfer
model described by Frederick and Lubin (1988).
This analysis reports the erythemal irradiance
integrated over the entire daylight period. This isdefined by the convolution over wavelength of the
action spectrum for erythema (McKinlay and Diffey,1987) with the computed spectral irradiance incidenton the ground integrated from sunrise to sunset. The
absolute erythemal irradiance, in joules per squaremeter of horizontal area, depends on the action
11.I1
ULTRAVIOLET RADIATION CHANGES
spectrum being normalized to unity at wavelengthsless than 298 nm. The extension of the spectrum to
400 nm implies that the weighted irradiance has a Nweaker sensitivity to changes in ozone than was thecase with older action spectra, which terminated at
shorter wavelengths. It is important to recognize that 45the values reported here depend on the actionspectrum adopted. While the action spectrum forerythema is a standard reference, it is not appropriate 25
to all biological responses. For example, using theaction spectrum appropriate for damage to DNA, the 2 5sensitivity to ozone is increased, while for _ 5__Jphotosynthesis inhibition, the RAF is near 1 (UNEP,1991). A biologically weighted irradiance provides 25
an index of the radiation dose received by anorganism, but quantitative predictions must be based 45
on an established relationship between dose andresponse. A large percentage change in irradiance 65may or may not correspond to a large percentage 5
change in biological response. Similarly, small 85
percentage changes in irradiance are not necessarilyinsignificant. Such considerations receive furtherattention in the companion "Effects Assessment"document.
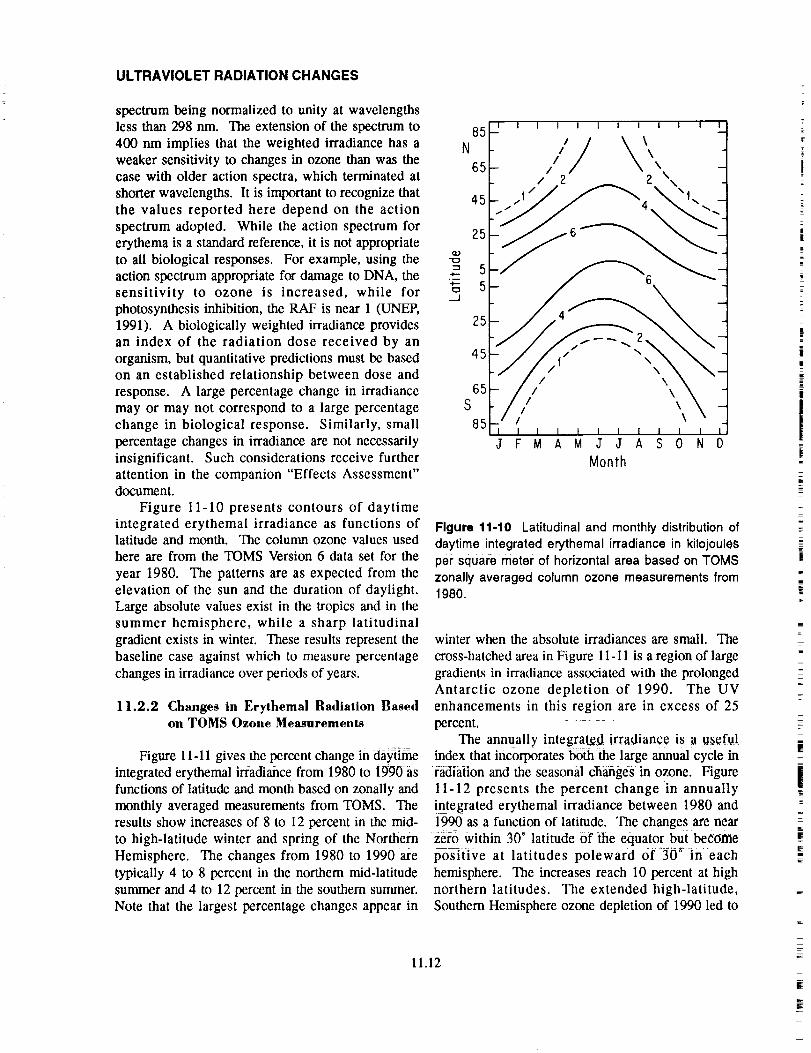
Figure 11-10 presents contours of daytime
l- / "65 /. // 2 2 \\\ .
\-',.
4 -
I iII \\\ x i
I 1 I I I I I I I I I I
J F M A M J J A S 0 N D
Month
integrated erythemal irradiance as functions of Figure 11-10 Latitudinal and monthly distribution oflatitude and month. The column ozone values used
here are from the TOMS Version 6 data set for the
year 1980. The patterns are as expected from theelevation of the sun and the duration of daylight.
Large absolute values exist in the tropics and in thesummer hemisphere, while a sharp latitudinal
gradient exists in winter. These results represent thebaseline case against which to measure percentage
changes in irradiance over periods of years.
1 1.2.2 Changes in Erythemal Radiation Basedon TOMS Ozone Measurements
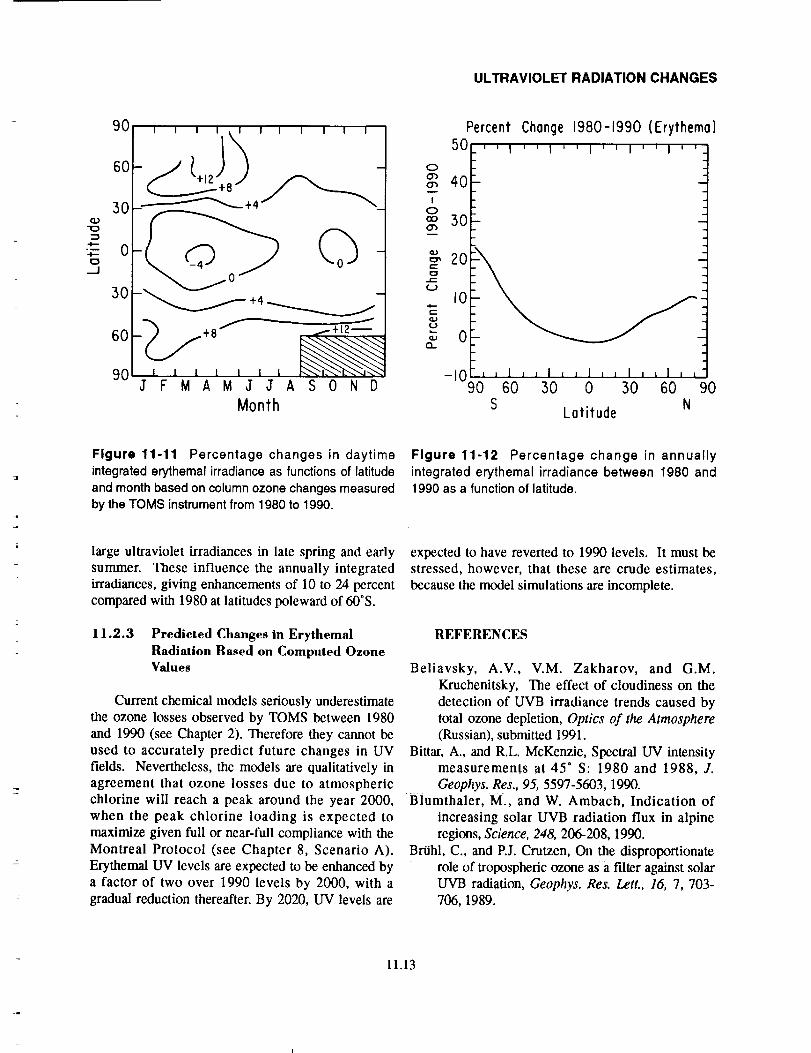
Figure 1i-li gives the percent change in dayiimeintegrated erythemal irradiance from 1980 tO i990 as
functions of latitude and month based on zonally and
monthly averaged measurements from TOMS. Theresults show increases of 8 to t 2 percent in the mid-
to high-latitude winter and spring of the Northern
Hemisphere. The changes from 1980 to 1990 aretypically 4 to 8 percent in the northem mid-latitude
summer and 4 to 12 percent in the southern summer.Note that the largest percentage changes appear in
daytime integrated erythemal irradiance in kilojoulesper square meter of horizontal area based on TOMSzonally averaged column ozone measurements from1980.
winter when the absolute irradiances are small. The
cross-hatched area in Figure 11-11 is a region of large
gradients in irradiance associated with the prolongedAntarctic ozone depletion of 1990. The UV
enhancements in this region are in excess of 25
percent.The annually_ntegratCd irradiance is a useful
index that incorporates _ the large annual cycle in
radiation and the seasonal ch_ges in ozone. Figure
11-12 presents the percent change in annuallyintegrated erythemal irradiance between 1980 and
1990 as a function of latitude. The changes _e nearZero within 30 ° latitude Of the equator but bec0rnepositive at latitudes poleward Of 30 _=in each
hemisphere. The increases reach 10 percent at highnorthern latitudes. The extended high-latitude,
Southern Hemisphere ozone depletion of 1990 led to
11.12
ULTRAVIOLET RADIATION CHANGES
90- , , , , ,, , i , ' ' ' I
._ 30/_ +4/
_30 -
90" ' ' , , , , , K'-e,._-.'-_J F M A M J,T A S 0 N D
Month
Percent Change 1980-1990 (Erytherna)
50}-' ' I ' ' I ' ' I' ' I' ' I ' '
Eo
o_T 40!g 30
Q,)
-I09"'0 i ,, i, , i,, I,, I , ,60 30 0 30 60 90S N
Latitude
Figure 11-11 Percentage changes in daytimeintegrated erythemal irradiance as functions of latitudeand month based on column ozone changes measuredby the TOMS instrument from 1980 to 1990.
large ultraviolet irradiances in late spring and earlysummer. These influence the annually integratedirradiances, giving enhancements of 10 to 24 percent
compared with 1980 at latitudes poleward of 60°S.
l 1.2.3 Predicted Changes in ErythemalRadiation Based on Computed OzoneValues
Current chemical models seriously underestimatethe ozone losses observed by TOMS between 1980
and 1990 (see Chapter 2). Therefore they cannot be
used to accurately predict future changes in UVfields. Nevertheless, the models are qualitatively inagreement that ozone losses due to atmospheric
chlorine will reach a peak around the year 2000,when the peak chlorine loading is expected tomaximize given full or near-full compliance with the
Montreal Protocol (see Chapter 8, Scenario A).Erythemal UV levels are expected to be enhanced by
a factor of two over 1990 levels by 2000, with agradual reduction thereafter. By 2020, UV levels are
Figure 11-12 Percentage change in annuallyintegrated erythemal irradiance between 1980 and1990 as a function of latitude.
expected to have reverted to 1990 levels. It must bestressed, however, that these are crude estimates,
because the model simulations are incomplete.
REFERENCES
Beliavsky, A.V., V.M. Zakharov, and G.M.
Kruchenitsky, The effect of cloudiness on the
detection of UVB irradiance trends caused by
total ozone depletion, Optics of the Atmosphere(Russian), submitted 1991.
Bittar, A., and R.L. McKenzie, Spectral UV intensitymeasurements at 45* S: 1980 and 1988, J.
Geophys. Res., 95, 5597-5603, 1990.i31umthaler, M., and W. Ambach, Indication of
increasing solar UVB radiation flux in alpineregions, Science, 248, 206-208, 1990.
Brtihl, C., and P.J. Crutzen, On the disproportionaterole of tropospheric ozone as a filter against solar
UVB radiation, Geophys. Res. Lett., 16, 7, 703-706, 1989.
11.13
ULTRAVIOLET RADIATION CHANGES
Frederick, J.E., and A.D. Alberts, Prolongedenhancement in surface ultraviolet radiation
during the Antarctic spring of 1990, Geophys.Res. Lett., 18, 10, 1869-1871, 1991.
Frederick, J.E., and D. Lubin, The budget of
biologically active ultraviolet radiation in the
Earth-atmosphere system, J. Geophys. Res., 93,3825-3832, 1988.
Frederick, J.E., and E.C. Weatherhead, Temporal
changes in surface ultraviolet radiation: a study ofthe Robertson-Berger meter and Dobson datarecords, Photochem. Photobiol., submitted 1991.
Ilyas, M. The danger of ozone depletion in the tropics,Search, 20, (5), 148-149, 1989.
Kent, G.S., M.P. McCormick, and S.K. Schaffner,
Global climatology of the free tropospheri caerosol from 1.0 I.tm satellite occultationmeasurements, J. Geophys. Res., 96, 5249-5267,1991.
Liu, S.C., S.A. McKeen, and S. Madronich, Effect of
anthropogenic aerosols on biologically activeultraviolet radiation, Geophys. Res. Lett., 18, 12,2265-2268, 1991.
Lubin, D., J.E. Frederick, C.R. Booth, T. Lucas, and D.Neuschuler, Measurements of enhanced
springtime ultraviolet radiation from PalmerStation, Antarctica, Geophys. Res. Lett., 16, 783-
785, 1989.Lubin, D., and J.E. Frederick, The UV radiation
environment of the Antarctic peninsula: The roles
of ozone and cloud cover, J. Appl. Meteor., 30,478-493, 1991.
Madronich, S., Implications of recent total atmosphericozone measurements for biologically active
radiation reaching the Earth's surface, Geophys.Res. Lett., 18, 12, 2269-2272, 1991.
McKenzie, R.L., Application of a simple model tocalculate latitudinal and hemispheric differencesin UV radiation, Weather and Climate, 11, 3-14,1991.
McKenzie, R.L., W.A. Matthews and P.V. Johnston,
The relationship between erythemal UV andozone, derived from spectral irradiance
measurements, Geophys. Res. Lett., 18,2269-2272, 1991.
McKinlay, A.E, and B.L. Diffey, A reference action
spectrum for ultraviolet induced erythema inhuman skin, in Human Exposure to UltravioletRadiation: Risks and Regulations (Eds. W. R.
Passchler and B. F. M. Bosnajakovic), Elsevier,Amsterdam, 83-87, 1987.
Nagatani, R.M., AJ. Miller, K. W. Johnson, and M.E.
Gelman, An eight-year climatology ofMeteorological and SBUV ozone data, NOAA
Technical Report NWS, 40, Camp Springs, MD,125 pp, 1988.
Roy, C.R., H.P. Gies, and G. Elliot, Ozone depletion,Nature, 347, 235-236, I990.
Scotto J., G. Cotton, F. Urbach, D. Berger, and T.
Fears, Biologically effective ultraviolet radiation:surface measurements in the U.S., Science, 239,
762-764, 1988.Stamnes, K., Z. Jin, J. Slusser, C. Booth and T. Lucas,
Three-fold enhancements of biologically effective
ul_aviolet levels at McMurdo Station, Antarctica,
during the 1990 ozone "hole," Geophys. Res.Lett, submitted 1992.
Stamnes, K., J. Slusser, M. Bowen, C. Booth, and T.
Lucas, Biologically effective ultraviolet radiation,total ozone abundance, and cloud optical depth at
McMurdo Station, Antarctica: September 15,1988 through April 15, 1989, Geophys. Res. Lett.,17, 2181-2184, 1990.
Trodahl, H. J., and R. G. Buckley, UV levels under seaice during the Antarctic spring, Science, 245, 194-
195, 1989.Tsay S.-C., and K. Stamnes, UV radiation in the
Arctic: The impact of potential ozone depletionand cloud effects, J. Geophys. Res., in press1991a.
Tsay, S.-C. and K. Stamnes, The stratosphere as amodulator of UV radiation into the biosphere,
Surveys in Geophysics, in press 1991b.
UNEP Environmental Effects Panel Report, Chapter 1,
Changes in biologically active ultravioletradiation reaching the Earth's surface, s.Madronich, L. O. Bjom, M. Ilyas, and M. M.
Caldwell, 1991.WMO, Scientific assessment of stratospheric ozone:
1989, World meteoroiogical organiZation GlobalOzone: Research and Monitoring Project, Report
N0_ 20, Eds D. L. Albritton and R. T. Watson,1990.
11.14