ultra low flow methods - lachat instruments
TRANSCRIPT

Ultra Low Flow Methods
September 2009
Data Pack

Lachat ULF Datapack Page 1 of 46 September 2009

Table of Contents
Introduction ................................................. 3
Ammonia, Phenolate Method ..................... 6
Chloride, Mercuric Thiocyanate Method .. 14
Nitrate‐Nitrite Cadmium Reduction Method .. 27
Nitrite ........................................................ 35
Orthophosphorus ...................................... 41
Lachat ULF Datapack Page 2 of 46 September 2009

Introduction In developing Lachat’s breakthrough Ultra High Throughput methods, Lachat Applications chemists modified traditional Flow Injection Analysis methods by increasing reagent and carrier stream flow rates. These modifications increased the methods’ throughput while decreasing the reagent consumption per sample. As an end result, the Ultra High Throughput methods provided throughput of over 100 samples (per channel) per hour. However, there are many labs that don’t need this type of throughput but still desire the reduced reagent consumption with their FIA methods. For these labs, Lachat Application Chemists have developed the new Ultra Low Flow methods suite. The Ultra Low Flow methods provide reagent conservation commonly seen with discrete analyzers, while maintaining the superior throughput, performance and support advantages of Lachat’s QuikChem Flow Injection Analysis (FIA) analyzer. And unlike discrete analyzers, the Lachat ULF methods maintain low reagent consumption regardless of the number of reagents needed for a chemistry. By slowing the speed of the reagent pump and optimizing the timing of the sample and reagents, significant reductions in the volume of reagents consumed per sample have been achieved. These reagent consumption savings have been realized without sacrificing the throughput or performance customers expect from FIA methodologies. The ULF methods are compatible with the QC8000, QC8500 and QC8500 Series 2 FIA analyzers. No special equipment is needed, but the ULF methods all use a pump speed of 10 (versus 35 for “standard” Lachat methods), and so must be run together, or by themselves if other Lachat methodologies are also in use. Contained in this Datapack are representative data from the initial suite of ULF methods developed. Additional ULF methods are being developed by the Lachat Applications team, so it is always best to consult Lachat Sales on the most current method portfolio.
Lachat ULF Datapack Page 3 of 46 September 2009

The tables below provide a quick summary of the reagent usage between the new Ultra Low Flow methods and the traditional FIA methods.
Ammonia
Traditional method
10‐107‐06‐1‐J ULF Methods
80‐107‐06‐1‐A, ‐B Cycle Period = 65 sec Cycle Period = 60 sec Flow (mL per cycle period) Carrier 1.38 1.21 Buffer 1.02 0.27 Phenolate 1.02 0.27 Hypochlorite 0.82 0.22 Nitroprusside 0.82 0.22
Chloride
Traditional Method 10‐117‐07‐1‐A
ULF Method 80‐117‐07‐1‐A
Cycle Period = 60 sec Cycle Period = 60 sec Flow (mL per cycle period) Carrier (DI) 1.45 0.98 Color 2.47 0.50
Cyanide
Traditional Methods 10‐204‐00‐1‐A, ‐X
ULF Methods 80‐204‐00‐1‐A, ‐X
Cycle Period = 45 sec Cycle Period = 65 sec Flow (mL per cycle period) Carrier (0.25N NaOH)
2.21 0.77
Buffer 0.96 0.45 Chloramine T 0.96 0.15 Pyridine 1.85 0.40
Nitrate ‐ Nitrite
Traditional Method
10‐107‐04‐1‐J ULF Method 80‐107‐04‐1‐A
Cycle Period = 60 sec Cycle Period = 60 sec Flow (mL per cycle period) Sulfanilamide 0.76 0.42 NH4Cl buffer 1.45 0.42
Lachat ULF Datapack Page 4 of 46 September 2009

Nitrite
Traditional Method
10‐107‐05‐1‐B ULF Method 80‐107‐05‐1‐A
Cycle Period = 45 sec Cycle Period = 60 sec Flow (mL per cycle period) Sulfanilamide 0.57 0.42 NH4Cl buffer 1.09 0.42 Carrier (DI) 1.32 1.55
Orthophosphorus
Traditiional Method 10‐115‐01‐1‐A
ULF Method 80‐115‐01‐1‐A
Cycle Period = 60 sec Cycle Period = 60 sec Flow (mL per cycle period) Molybdate 1.28 0.22 Ascorbic Acid 1.28 0.22 Carrier (DI) 2.95 1.55
Lachat ULF Datapack Page 5 of 46 September 2009

Ammonia (Phenolate) Method
QuikChem Method 80‐107‐06‐1‐A
Ammonia (Phenolate) in Potable, Surface, and Wastewaters
(un‐preserved samples)
0.25‐20 mg N/L 0.1 to 5.0 mg N/L 0.01‐1.0 mg N/L
– Principle –
This method is based on the Berthelot reaction. Ammonia reacts with alkaline phenol, then with sodium hypochlorite to form indophenol blue. Sodium nitroprusside (nitroferricyanide) is added to enhance sensitivity. The absorbance of the reaction product is measured at 630 nm, and is directly proportional to the original ammonia concentration in the sample. If distillation is required, the sample is buffered at a pH of 9.5 with a borate buffer to decrease hydrolysis of cyanates and organic nitrogen compounds, and is distilled into a solution of boric acid.
The ULF series of methods use a pump speed of 10, and so must be run alone or with other ULF methodologies.
– Interferences – 1. Calcium and magnesium ions may precipitate if present in sufficient concentration. EDTA is
added to the sample in‐line in order to prevent this problem.
2. Color, turbidity and certain organic species may interfere. Turbidity is removed by manual filtration. Sample color may be corrected for by running the samples through the manifold without color formation.
3. Cyanate, which may be encountered in certain industrial effluents, will hydrolyze to some extent even at the pH of 9.5 at which distillation is carried out.
4. Residual chlorine must be removed by pretreatment of the sample with sodium thiosulfate or other reagents before distillation.
5. Method interference may be caused by contaminants in the reagent water, reagents, glassware, and other sample processing apparatus that bias analyte response.
6. Eliminate any marked variation in acidity or alkalinity among samples because intensity of measured color is pH dependent. Likewise, ensure that pH of standard ammonia solutions approximates that of samples.
Lachat ULF Datapack Page 6 of 46 September 2009

– Special Apparatus – Please contact Lachat Sales for ordering information
1. Heating Unit Lachat Part No. A85X00 (X=1 for 110V, X=2 for 220V)
2. PVC PUMP TUBES MUST BE USED FOR THIS METHOD.
Calibration Data for Ammonia Range 1
File Name: supp hi 7 28 09.omn Acq. Date: 28 July 2009
Calibration Graph and Statistics
File Name: supp hi 7 28 09.omn Acq. Date: 28 July 2009
Lachat ULF Datapack Page 7 of 46 September 2009

Method Detection Limit for ammonia using 0.25 mg N/L standard MDL= 0.05 mg N/L Standard Deviation (s) = 0.0065 mg N/L, Mean (x) = 0.24 mg N/L, Known value = 0.25 mg N/L File Name: supp hi 7 28 09.omn Acq. Date: 28 July 2009
Precision data for ammonia using 5.0 mg N/L standard % RSD = 0.57 Standard Deviation (s) = 0.029 mg N/L, Mean (x) = 5.004mg N/L, Known value = 5.0 mg N/L File Name: supp hi 7 28 09.omn Acq. Date: 28 July 2009
Carryover Study: 20 mg N/L standard followed by 3 blanks Carryover Passed File Name: supp hi 7 28 09.omn Acq. Date: 28 July 2009
External QC: ERA Simple Nutrients Average Determined Value: 5.77 mg N/L Known: 5.83 mg N/L Acceptance Range: 4.85 ‐ 6.81 mg N/L ERA PN 739 Lot No: 1007739A
Lachat ULF Datapack Page 8 of 46 September 2009

File Name: supp hi 7 28 09.omn Acq. Date: 28 July 2009
Calibration Data for Ammonia Range 2
File Name: supp 3 7 27 09 Mid Range un P.omn Acq. Date: 27 July 2009
Calibration Graph and Statistics
File Name: supp 3 7 27 09 Mid Range un P.omn Acq. Date: 27 July 2009
Lachat ULF Datapack Page 9 of 46 September 2009

Method Detection Limit for ammonia using 0.05 mg N/L standard MDL= 0.006; Claiming 0.015 due to y‐intercept Standard Deviation (s) = 0.0021 mg N/L, Mean (x) = 0.0587 mg N/L, Known value = 0.05 mg N/L File Name: supp 2 7 27 09 Mid Range un P.omn Acq. Date: 27 July 2009
Precision data for ammonia using 1.0 mg N/L standard % RSD = 0.49% Standard Deviation (s) = 0.0049 mg N/L, Mean (x) = 1.0024 mg N/L, Known value = 1.0 mg N/L File Name: supp 3 7 27 09 Mid Range un P.omn Acq. Date: 27 July 2009
Carryover Study: 5.0 mg N/L standard followed by 3 blanks Carryover Passed File Name: supp 3 7 27 09 Mid Range un P.omn Acq. Date: 27 July 2009
Lachat ULF Datapack Page 10 of 46 September 2009

External QC: ERA Simple Nutrients, Diluted 1:2 to bring it within the range of the method. Average Determined Value: 2.897 mg N/L Known: 2.915 mg N/L Acceptance Range: 2.425 ‐3.405 mg N/L ERA PN 739 Lot No: 1007739A File Name: supp 3 7 27 09 Mid Range un P.omn Acq. Date: 27 July 2009
Calibration Data for Ammonia Range 3
File Name: supp 1 7 28 09.omn Acq. Date: 28 July 2009
Lachat ULF Datapack Page 11 of 46 September 2009

Calibration Graph and Statistics
File Name: supp 1 7 28 09.omn Acq. Date: 28 July 2009
Method Detection Limit for ammonia using 0.01 mg N/L standard MDL= 0.0027 mg N/L Standard Deviation (s) = 0.001 mg N/L, Mean (x) = 0.0105 mg N/L, Known value = 0.01 mg N/L File Name: supp 1 7 28 09.omn Acq. Date: 28 July 2009
Lachat ULF Datapack Page 12 of 46 September 2009

Method Detection Limit for ammonia using 0.005 mg N/L standard MDL= 0.0021 mg N/L Standard Deviation (s) = 0.00056 mg N/L, Mean (x) = 0.006 mg N/L, Known value = 0.005 mg N/L File Name: supp 1 7 28 09.omn Acq. Date: 28 July 2009
Precision data for ammonia using 0.25 mg N/L standard % RSD = 0.84 Standard Deviation (s) = 0.0021 mg N/L, Mean (x) = 0.249 mg N/L, Known value = 0.25 mg N/L File Name: supp 1 7 28 09.omn Acq. Date: 28 July 2009
Carryover Study: 1.0 mg N/L standard followed by 10 blanks Carryover Passed File Name: supp 1 7 27 09.omn Acq. Date: 27 July 2009
For acid‐preserved samples, 80‐107‐06‐1‐B (high and mid‐range) and 80‐107‐06‐1‐C (low range) are also available.
Lachat ULF Datapack Page 13 of 46 September 2009

Chloride, Mercuric Thiocyanate Method
QuikChem® Method 80‐117‐07‐1‐A
Chloride in Waters (ULTRA LOW FLOW METHOD)
6.0 to 300.0 mg Cl‐/L 2.5‐100 mg Cl‐/L 0.25‐20 mg Cl‐/L
– Principle – Thiocyanate ion is liberated from mercuric thiocyanate by the formation of soluble mercuric chloride. In the presence of ferric ion, free thiocyanate ion forms the highly colored ferric thiocyanate, of which the absorbance is proportional to the chloride concentration. Ferric thiocyanate absorbs strongly at 480 nm. The calibration curve fits a second order polynomial.
The 80‐ series of methods (Ultra Low Flow) use a pump speed of 10, and so must be run alone or with other ULF methodologies.
– Interferences – 1. Substances which reduce iron (III) to iron (II) and mercury (III) to mercury (II) (e.g. sulfite,
thiosulfate).
2. Halides which also form strong complexes with mercuric ion (e.g. Br‐, I‐) give a positive interference.
Lachat ULF Datapack Page 14 of 46 September 2009

Calibration Data for Chloride, Range 1
File Name: OM_7‐8‐2009_9‐52‐11AM.OMN Acq. Date: 08 July 2009
Calibration Graph and Statistics
File Name: OM_7‐8‐2009_9‐52‐11AM.OMN Acq. Date: 08 July 2009
Method Detection Limit for chloride using 2.5 mg Cl/L standard MDL= 1.0 mg Cl/L (due to y‐intercept) (Calculated value 0.24 mg Cl/L) Standard Deviation (s) = 0.086 mg Cl/L, Mean (x) = 2.85 mg Cl/L, Known value = 2.5 mg Cl/L File Name: OM_7‐8‐2009_9‐52‐11AM.OMN Acq. Date: 08 July 2009
Lachat ULF Datapack Page 15 of 46 September 2009

Precision data for chloride using 250 mg Cl/L standard % RSD = 0.87 Standard Deviation (s) = 2.17 mg Cl/L, Mean (x) = 250.45 mg Cl/L, Known value = 250 mg Cl/L File Name: 6 30 high 2.OMN Acq. Date: 30 June 2009
Precision data for chloride using 30 mg Cl/L standard % RSD = 1.05 Standard Deviation (s) = 0.30 mg Cl/L, Mean (x) = 28.6 mg Cl/L, Known value = 30 mg Cl/L File Name: 6 30 high 2.OMN Acq. Date: 30 June 2009
Precision data for chloride using 10 mg Cl/L standard % RSD = 1.19 Standard Deviation (s) = 0.115 mg Cl/L, Mean (x) = 9.75 mg Cl/L, Known value = 10 mg Cl/L File Name: 6 30 high 2.OMN Acq. Date: 30 June 2009
Lachat ULF Datapack Page 16 of 46 September 2009

Carryover Study: 300 mg Cl/L standard followed by 3 blanks Carryover Passed File Name: 6 30 high 2.OMN Acq. Date: 30 June 2009
Calibration Data for Chloride, Range 2
File Name: supp low 1 6 30 09.OMN Acq. Date: 30 June 2009
Lachat ULF Datapack Page 17 of 46 September 2009

Calibration Graph and Statistic
File Name: supp low 1 6 30 09.OMN Acq. Date: 30 June 2009
Method Detection Limit for chloride using 1.0 mg Cl/L standard MDL= 0.2 mg Cl/L due to y‐intercept (calculated as 0.07 mg Cl/L) Standard Deviation (s) = 0.025mg Cl/L, Mean (x) = 0.94 mg Cl/L, Known value = 2.5 mg Cl/L File Name: ULF Cl low.OMN Acq. Date: 26 June 2009
Lachat ULF Datapack Page 18 of 46 September 2009

Precision data for chloride using 10 mg Cl/L standard % RSD = 0.69 Standard Deviation (s) = 0.068 mg Cl/L, Mean (x) = 9.83 mg Cl/L, Known value = 10 mg Cl/L File Name: ULF Cl low.OMN Acq. Date: 26 June 2009
Precision data for chloride using 50 mg Cl/L standard % RSD = 0.41 Standard Deviation (s) = 0.21 mg Cl/L, Mean (x) = 51.47 mg Cl/L, Known value = 50 mg Cl/L File Name: ULF Cl low.OMN Acq. Date: 26 June 2009
Carryover Study: 100 mg Cl/L standard followed by 3 blanks Carryover Passed File Name: supp low 1 6 30 09.OMN Acq. Date: 30 June 2009
Lachat ULF Datapack Page 19 of 46 September 2009

ERA Measured value: 82.41mg/L Certified value: 78.5 mg/L Acceptable Range: 67.3‐89.7 mg/L ERA PN 698; Lot Number S077698 File Name: supp low 1 6 30 09.OMN Acq. Date: 30 June 2009
Calibration Data for Chloride, Range 3
File Name: low low 3.omn Acq. Date: 07 July 2009
Lachat ULF Datapack Page 20 of 46 September 2009

Calibration Graph and Statistics
File Name: low low 3.omn Acq. Date: 07 July 2009
Method Detection Limit for chloride using 0.25 mg Cl/L standard MDL= 0.13 mg Cl, due to y‐intercept. (Calculated as 0.012 mg Cl/L) Standard Deviation (s) = 0.0042 mg Cl/L, Mean (x) = 0.268 mg Cl/L, Known value = 0.25 mg Cl/L File Name: low low 3.omn Acq. Date: 07 July 2009
Lachat ULF Datapack Page 21 of 46 September 2009

Precision data for chloride using 10 mg Cl/L standard % RSD = 1.24 Standard Deviation (s) = 0.124mg Cl/L, Mean (x) = 10.24 mg Cl/L, Known value = 10 mg Cl/L File Name: low low 3.omn Acq. Date: 07 July 2009
Carryover Study: 20 mg Cl/L standard followed by 3 blanks Carryover Passed File Name: low low 3.omn Acq. Date: 07 July 2009
Lachat ULF Datapack Page 22 of 46 September 2009

Cyanide, Pyridine Barbituric Acid Method
QuikChem® Method 80‐204‐00‐1‐X
Cyanide in Drinking and Wastewaters using MICRO DIST™
(Ultra Low Flow Method) 0.005 to 0.5 mg CN‐/L
– Principle –
By means of a passive miniature distillation device, MICRO DIST, the cyanide in the samples is released by digesting and acidifying cyanide complexes, converting them to hydrocyanic acid (HCN). The cyanide ion is trapped in a 1.0 M sodium hydroxide absorbing solution which is diluted to 0.25 M solution during the distillation. By means of flow injection analysis, the 0.25 M NaOH distillate is converted to cyanogen chloride by reaction with chloramine‐T, pyridine and barbituric acid to give a red‐colored complex. The absorbance of this complex is measured at 570 nm by measuring the peak area resulting from the sample. The peak area is proportional to the concentration of the cyanide in the sample.
The determinative step of this method is described here only so that a complete method is provided. Any approved continuous‐flow method may be used for the determination of cyanide in the 0.25 M NaOH MICRO DIST distillates. Note: Other approved distillation procedures may use different concentrations of NaOH in the absorber or trapping solution. Because the determinative method’s sensitivity is pH dependent, it is important to ensure that the pH of the absorber solution from any distillation procedure is adjusted to match the pH of calibration standards specified in the approved determinative method being used.
USEPA Reference Method “Methods for the Chemical Analysis of Water and Wastes”, EPA‐600/4‐79‐020, Revised March 1983 and 1979, Method 335.2 specifies that absorbance be measured at 578 nm using a batch spectrophotometer. USEPA Reference Method “Methods for the Determination of Inorganic Substances in Environmental Samples”, EPA‐600/R‐93‐100, August 1993, Method 335.4 specifies that absorbance be measured at 570 nm. The latter wavelength is specified in this Modified Method because Method 335.4 uses an automated continuous flow‐through detector similar to that used in the following flow injection method.
The 80‐ series of methods (Ultra Low Flow) use a pump speed of 10, and so must be run alone or with other ULF methodologies.
Lachat ULF Datapack Page 23 of 46 September 2009

– Special Apparatus – Please contact Lachat Sales for ordering information
1. Heating Unit
2. MICRO DIST Block and Cyanide‐1 tubes. The MICRO DIST block is available from Lachat Instruments, Loveland, Colorado as Lachat part number A17100. The Cyanide‐1 tubes are available as Lachat part number A17001
3. Filter paper, No. 2
Calibration Graph and Statistics (Non‐distilled standards)
File Name:092194M1.fdt Acq. Date: 21 September 1994
Lachat ULF Datapack Page 24 of 46 September 2009

Method Detection Limit for Cyanide using Non Distilled Standards
Method Detection Limit for cyanide using 0.005 mg/L standard MDL= 0.001 mg/L Standard Deviation (s) = 0.0001 mg/L, Mean (x) = 0.010 mg/L, Known value = 0.001 mg/L File Name:092194M1.fdt Acq. Date: 21 September 1994
Precision data for Cyanide using 0.250 mg/L standard % RSD = 0.31 % Standard Deviation (s) = 0.00078 mg/L, Mean (x) = 0.253 mg/L, Known value = 0.250 mg/L File Name:ULF CN RUN 2.OMN Acq. Date: 24 June 2009
Precision data for Cyanide using 0.025 mg/L standard % RSD = 1.15 % Standard Deviation (s) = 0.000294 mg/L, Mean (x) = 0.0254 mg/L, Known value = 0.025 mg/L File Name:ULF CN RUN 2.OMN Acq. Date: 24 June 2009
Lachat ULF Datapack Page 25 of 46 September 2009

Carryover test. Two injections of the high standard, followed by three blanks. Carryover passed. File Name:ULF CN RUN 2.OMN Acq. Date: 24 June 2009
(A method for samples that have been prepared using a Macro Distillation, 80‐204‐00‐1‐A, is also available.)
Lachat ULF Datapack Page 26 of 46 September 2009

Nitrate‐Nitrite Cadmium Reduction Method
QuikChem® Method 80‐107‐04‐1‐A
Nitrate/Nitrite in Waters
(ULTRA LOW FLOW METHOD) 0.10 to 10.0 mg N/L as NO3
‐ or NO2‐
0.01 to 1.0 mg N/L as NO3‐ or NO2
‐ 0.001 to 0.10 mg N/L as NO3
‐ or NO2‐
– Principle –
Nitrate is quantitatively reduced to nitrite by passage of the sample through a copperized cadmium column. The nitrite (reduced nitrate plus original nitrite) is then determined by diazotizing with sulfanilamide followed by coupling with N‐(1‐naphthyl)ethylenediamine dihydrochloride. The resulting water soluble dye has a magenta color which is read at 520 nm. Nitrite alone also can be determined by removing the cadmium column.
The 80‐ series of methods (Ultra Low Flow) use a pump speed of 10, and so must be run alone or with other ULF methodologies.
– Interferences – 1. Residual chlorine can interfere by oxidizing the cadmium column. 2. Low results would be obtained for samples that contain high concentrations of iron,
copper or other metals. In this method, EDTA is added to the buffer to reduce this interference.
3. Samples that contain large concentrations of oil and grease will coat the surface of the cadmium. This interference is eliminated by pre‐extracting the sample with an organic solvent.
4. Sample turbidity may interfere. Turbidity can be removed by filtration through a 0.4 μM pore diameter membrane filter prior to analysis
Lachat ULF Datapack Page 27 of 46 September 2009
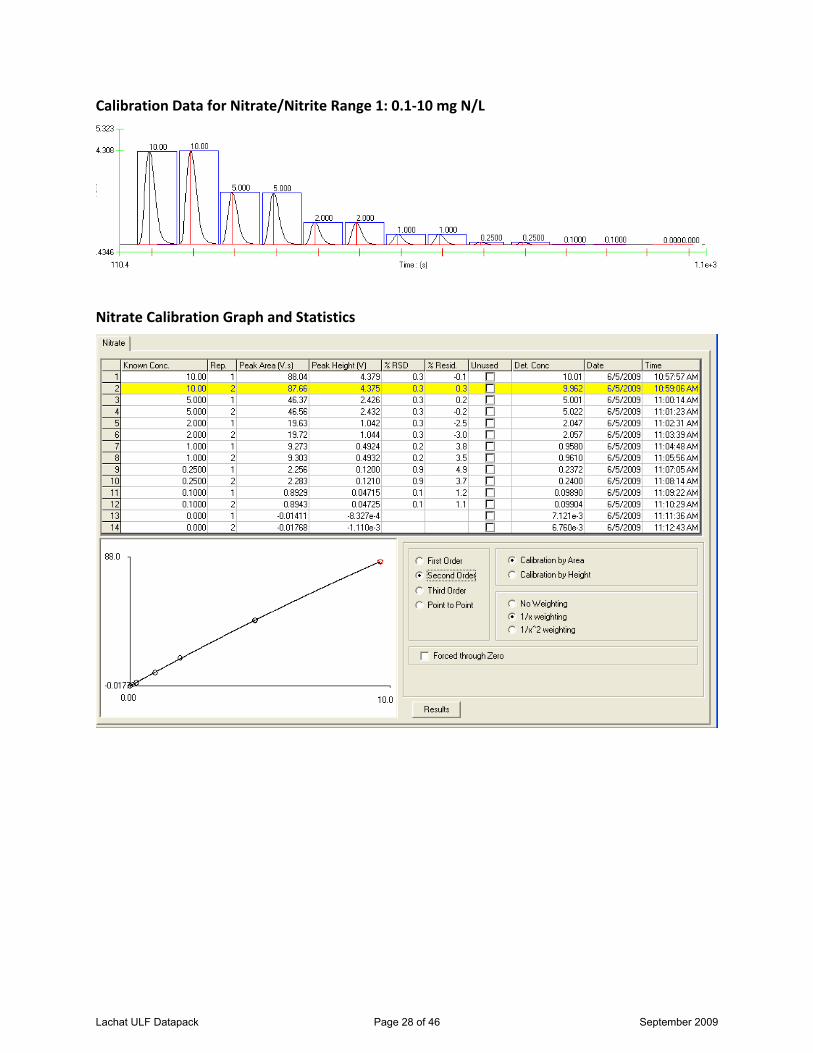
Calibration Data for Nitrate/Nitrite Range 1: 0.1‐10 mg N/L
Nitrate Calibration Graph and Statistics
Lachat ULF Datapack Page 28 of 46 September 2009
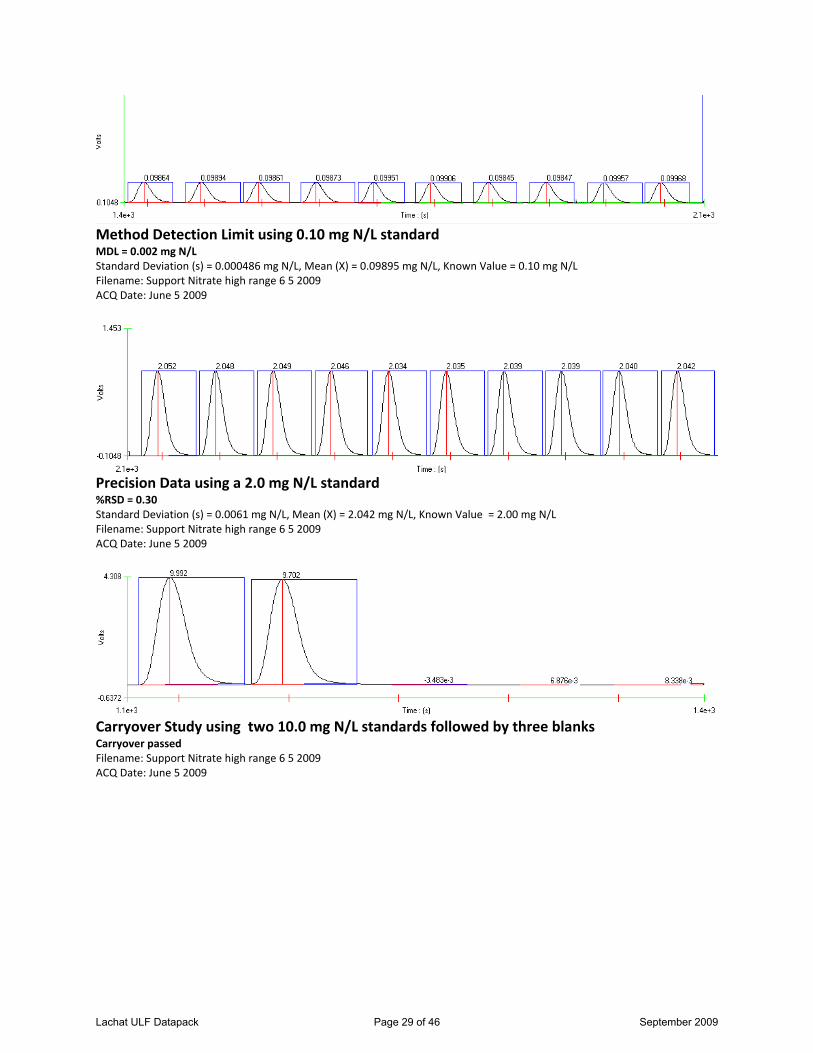
Method Detection Limit using 0.10 mg N/L standard MDL = 0.002 mg N/L Standard Deviation (s) = 0.000486 mg N/L, Mean (X) = 0.09895 mg N/L, Known Value = 0.10 mg N/L Filename: Support Nitrate high range 6 5 2009 ACQ Date: June 5 2009
Precision Data using a 2.0 mg N/L standard %RSD = 0.30 Standard Deviation (s) = 0.0061 mg N/L, Mean (X) = 2.042 mg N/L, Known Value = 2.00 mg N/L Filename: Support Nitrate high range 6 5 2009 ACQ Date: June 5 2009
Carryover Study using two 10.0 mg N/L standards followed by three blanks Carryover passed Filename: Support Nitrate high range 6 5 2009 ACQ Date: June 5 2009
Lachat ULF Datapack Page 29 of 46 September 2009

Filename: Support Nitrate high range 6 5 2009 ACQ Date: June 5 2009 Column Efficiency 2 injections of a 10 mg N/L as nitrite followed by 2 injections of a 10 mg N/L as nitrate standard. % Recovery: 99.6%
Calibration Data for Nitrate/Nitrite Range 2: 0.01‐1.0 mg N/L
Lachat ULF Datapack Page 30 of 46 September 2009

Nitrate Calibration Graph and Statistics
Filename: Mid range nitrate 6 8 09 run 1.omn Acq Date: 08 June 2009
Method Detection Limit using 0.005 mg N/L standard MDL = 0.001 mg N/L Standard Deviation (s) = 0.00012 mg N/L, Mean (X) = 0.0053 mg N/L, Known Value = 0.005 mg N/L Filename: Mid range nitrate 6 8 09 run 1.omn Acq Date: 08 June 2009
Lachat ULF Datapack Page 31 of 46 September 2009

Precision Data using a 0.5 mg N/L standard %RSD = 0.16 Standard Deviation (s) = 0.00081 mg N/L, Mean (X) = 0.4992 mg N/L, Known Value = 0.5 mg N/L Filename: Mid range nitrate 6 8 09 run 1.omn Acq Date: 08 June 2009
External QC Sample, ERA (Diluted 1:30 to bring into method range). Known: 0.72 mg N/L Determined: 0.74 mg N/L Acceptance Range: 0.63 to 0.81 Simple Nutrients, ERA PM 739 Lot No P1000739A Filename: Mid range nitrate 6 8 09 run 1.omn Acq Date: 08 June 2009
Carryover Study using two 1.0 mg N/L standards followed by three blanks Carryover passed Filename: Mid range nitrate 6 8 09 run 1.omn Acq Date: 08 June 2009
Lachat ULF Datapack Page 32 of 46 September 2009

Calibration Data for Nitrate/Nitrite Range 3: 0.1‐0.005 mg N/L
Nitrate Calibration Graph and Statistics
Filename: 6 8 lo sup run 1.omn Acq Date: 08 June 2009
Lachat ULF Datapack Page 33 of 46 September 2009

Method Detection Limit using 0.001 mg N/L standard MDL = 0.0002 mg N/L Standard Deviation (s) = 0.0007 mg N/L, Mean (X) = 0.00172 mg N/L, Known Value = 0.001 mg N/L Filename: 6 8 lo sup run 1.omn Acq Date: 08 June 2009
Precision Data using a 0.05 mg N/L standard %RSD = 1.7% Standard Deviation (s) = 0.0009 mg N/L, Mean (X) = 0.0502 mg N/L, Known Value = 0.05 mg N/L Filename: 6 8 lo sup run 1.omn Acq Date: 08 June 2009
Carryover Study using 0.10 mg N/L standard followed by three blanks Carryover passed Filename: 6 8 lo sup run 1.omn Acq Date: 08 June 2009
Lachat ULF Datapack Page 34 of 46 September 2009

Nitrite
QuikChem® Method 80‐107‐05‐1‐A
Nitrite in Waters (ULTRA LOW FLOW METHOD)
0.10 to 10.0 mg N/L as NO2
‐ 0.01‐1.0 mg N/L as NO2
‐
– Principle – Nitrite is determined by diazotizing with sulfanilamide followed by coupling with N‐(1‐naphthyl)ethylenediamine dihydrochloride. The resulting water soluble dye has a magenta color which is read at 540 nm.
The 80‐ series of methods (Ultra Low Flow) use a pump speed of 10, and so must be run alone or with other ULF methodologies.
– Interferences – 1. Sample turbidity may interfere. Turbidity can be removed by filtration through a 0.45
μM pore diameter membrane filter prior to analysis.
Lachat ULF Datapack Page 35 of 46 September 2009

Calibration Data for Nitrite, 0.1‐10 mg N/L
Nitrite Calibration Graph and Statistics
Acq. Date: June 5 2009 Filename: Support nitrite high range 6 5 09. OMN
Lachat ULF Datapack Page 36 of 46 September 2009

Method Detection Limit using 0.10 mg N/L standard MDL = 0.02 mg N/L Standard Deviation (s) = 0.00035 mg N/L, Mean (X) = 0.099 mg N/L, Known Value = 0.10 mg N/L Acq. Date: June 5 2009 Filename: Support nitrite high range 6 5 09. OMN
Precision Data using a 2.0 mg N/L standard %RSD = 0.144 Standard Deviation (s) = 0.0029 mg N/L, Mean (X) = 2.051 mg N/L, Known Value = 2.00 mg N/L Acq. Date: June 5 2009 Filename: Support nitrite high range 6 5 09. OMN
Carryover Study using two 10.0 mg N/L standards followed by three blanks Carryover passed Acq. Date: June 5 2009 Filename: Support nitrite high range 6 5 09. OMN
Lachat ULF Datapack Page 37 of 46 September 2009

Calibration Data for Nitrite, 0.01‐1.0 mg N/L
Nitrite Calibration Graph and Statistics
Acq. Date: June 5 2009 Filename: Support nitrite low range 6 5 09. OMN
Lachat ULF Datapack Page 38 of 46 September 2009

Method Detection Limit using 0.010 mg N/L standard MDL = 0.002 mg N/L Standard Deviation (s) = 0.00026 mg N/L, Mean (X) = 0.01026 mg N/L, Known Value = 0.010 mg N/L Acq. Date: June 5 2009 Filename: Mid Nitrite Supp. OMN
Method Detection Limit using 0.005 mg N/L standard MDL = 0.001 mg N/L Standard Deviation (s) = 0.0000951 mg N/L, Mean (X) = 0.00594 mg N/L, Known Value = 0.005 mg N/L Acq. Date: June 5 2009 Filename: Mid Nitrite Supp. OMN
Precision Data using a 0.5 mg N/L standard %RSD = 0.74 Standard Deviation (s) = 0.00363 mg N/L, Mean (X) = 0.4894 mg N/L, Known Value = 0.50 mg N/L Acq. Date: June 5 2009 Filename: Mid Nitrite Supp. OMN
Lachat ULF Datapack Page 39 of 46 September 2009

Carryover Study using two 2.0 mg N/L standards followed by three blanks Carryover passed Acq. Date: June 5 2009 Filename: Mid Nitrite Supp. OMN
Lachat ULF Datapack Page 40 of 46 September 2009

Orthophosphorus
QuikChem® Method 80‐115‐01‐1‐A
Orthophosphate in Waters
(Ultra Low Flow Method) 0.25 to 10.00 mg P/L 0.05‐2.0 mg P/L
– Principle –
The orthophosphate ion (PO43‐) reacts with ammonium molybdate and antimony potassium
tartrate under acidic conditions to form a complex. This complex is reduced with ascorbic acid to form a blue complex which absorbs light at 880 nm. The absorbance is proportional to the concentration of orthophosphate in the sample.
The ULF series of methods use a pump speed of 10, and so must be run alone or with other ULF methodologies.
– Interferences – 1. Silica forms a pale blue complex which also absorbs at 880 nm. This interference is
generally insignificant as a silicate concentration of approximately 30 mg SiO2/L would be required to produce a 0.005 mg P/L positive error in orthophosphate.
2. Concentrations of ferric iron (Fe3‐) greater than 50 mg/L will cause a negative error due to precipitation of, and subsequent loss, of orthophosphate. Samples high in iron can be pretreated with sodium bisulfite to eliminate this interference. Treatment with bisulfite will also remove the interference due to arsenates.
3. Glassware contamination is a problem in low level phosphorus determinations. Glassware should be washed with 1:1 HCl and rinsed with deionized water. Commercial detergents should rarely be needed but, if they are used, use special phosphate‐free preparations for lab glassware.
– Special Apparatus – Please contact Lachat Sales for ordering information
1. Heating Unit, Lachat Part No. A85X00 (X=1 for 110V, X=2 for 220V)
Lachat ULF Datapack Page 41 of 46 September 2009

Calibration Data for Orthophosphate Range 1, 0.25‐10 mg P/L
Calibration Graph and Statistics
Filename: 6 3 supp 3.omn Acq date: June 3, 2009
Lachat ULF Datapack Page 42 of 46 September 2009

Method Detection Limit for Orthophosphate using 0.25 mg P/L standard MDL= 0.05 mg P/L Standard Deviation (s) = 0.0124 mg P/L, Mean (x) = 0.2508 mg P/L, Known value = 0.25 mg P/L Filename: 6 3 supp 3.omn Acq date: June 3, 2009
Precision data for Orthophosphate using 1.0 mg P/L standard % RSD = 2.3 Standard Deviation (s) = 0.0233 mg P/L, Mean (x) = 1.018 mg P/L, Known value = 1.0 mg P/L Filename: 6 3 supp 3.omn Acq date: June 3, 2009
Carryover Study: 10 mg P/L standard followed by 3 blanks Carryover Passed Filename: 6 3 supp 3.omn Acq date: June 3, 2009
Lachat ULF Datapack Page 43 of 46 September 2009

External QC Analysis for Orthophosphate Measured value: 2.33 mg P/L Certified value: 2.39 mg P/L Acceptable Range: 2.17‐2.59 mg PL ERA PN 739; Lot Number P100739A Filename: 6 3 supp 3.omn Acq date: June 3, 2009
Calibration Data for Orthophosphate Range 2, 0.05‐2.0 mg P/L
Lachat ULF Datapack Page 44 of 46 September 2009

Calibration Graph and Statistics
Filename: supp op 6 5 09 .omn Acq date: June 5, 2009
Method Detection Limit for Orthophosphate using 0.05 mg P/L standard MDL= 0.005 mg P/L Standard Deviation (s) = 0.0006 units mg P/L, Mean (x) = 0.0458 mg P/L, Known value = 0.05 mg P/L Filename: supp op 6 5 09 .omn Acq date: June 5, 2009
Lachat ULF Datapack Page 45 of 46 September 2009

Precision data for Orthophosphate using 1.0 mg P/L standard % RSD = 0.89 Standard Deviation (s) = 0.0089 mg P/L, Mean (x) = 1.006mg P/L, Known value = 1.0 mg P/L Filename: supp op 6 5 09 .omn Acq date: June 5, 2009
Carryover Study: 2.0 mg P/L standard followed by 4 blanks Carryover Passed Filename: supp op 6 5 09 .omn Acq date: June 5, 2009
Lachat ULF Datapack Page 46 of 46 September 2009