ultra efficient engine technology systems integration and ... · ultra efficient engine technology...
TRANSCRIPT
NASA/CR-2002-211754
Ultra Efficient Engine Technology Systems
Integration and Environmental Assessment
David L. Daggett
Boeing Commercial Airplane Group, Seattle, Washington
July 2002
https://ntrs.nasa.gov/search.jsp?R=20020064732 2018-07-15T06:35:43+00:00Z
The NASA STI Program Office... in Profile
Since its founding, NASA has been dedicated to the
advancement of aeronautics and space science. TheNASA Scientific and Technical Information (STI)
Program Office plays a key part in helping NASA
maintain this important role.
CONFERENCE PUBLICATION.
Collected papers from scientific and
technical conferences, symposia,
seminars, or other meetings sponsored or
co-sponsored by NASA.
The NASA STI Program Office is operated byLangley Research Center, the lead center for NASA'sscientific and technical information. The NASA STI
Program Office provides access to the NASA STIDatabase, the largest collection of aeronautical and
space science STI in the world. The Program Officeis also NASA's institutional mechanism for
disseminating the results of its research and
development activities. These results arepublished by NASA in the NASA STI Report
Series, which includes the following report
types:
TECHNICAL PUBLICATION. Reports ofcompleted research or a major significantphase of research that present the results
of NASA programs and include extensivedata or theoretical analysis. Includes compilations
of significant scientific and technical data andinformation deemed to be of continuing reference
value. NASA counterpart of peer-reviewed formalprofessional papers, but having less stringent
limitations on manuscript length and extent ofgraphic presentations.
TECHNICAL MEMORANDUM.
Scientific and technical findings that are
preliminary or of specialized interest,e.g., quick release reports, working
papers, and bibliographies that containminimal annotation. Does not contain
extensive analysis.
CONTRACTOR REPORT. Scientific and
technical findings by NASA-sponsoredcontractors and grantees.
SPECIAL PUBLICATION. Scientific,technical, or historical information from
NASA programs, projects, and missions,
often concerned with subjects havingsubstantial public interest.
TECHNICAL TRANSLATION. English-
language translations of foreign scientific
and technical material pertinent toNASA's mission.
Specialized services that complement the
STI Program Office's diverse offerings includecreating custom thesauri, building customized
databases, organizing and publishingresearch results.., even providing videos.
For more information about the NASA STI
Program Office, see the following:
• Access the NASA STI Program HomePage at http://www.sti.nastLgov
• Email your question via the lnternet [email protected]
• Fax your question to the NASA STI
Help Desk at (301) 621-0134
• Telephone the NASA STI Help Desk at(301 ) 621-0390
Write to:
NASA STI Help Desk
NASA Center for AeroSpace Information7121 Standard Drive
Hanover, MD 21076-1320
NASA/CR-2002-211754
Ultra Efficient Engine Technology Systems
Integration and Environmental Assessment
David L. Daggett
Boeing Commercial Airpla_te Group, Seattle, Washington
National Aeronautics and
Space Administration
Langley Research Center
Hampton, Virginia 23681-219_
Prepared for Langley Research Centerunder Contract NAS 1-20341
July 2002

Acknowledgments
This document summarizes the efforts of many participants, all of whom were essential to the
successful evaluation of Ultra Efficient Engine Technology as applied to future technologyairplanes. The author gratefully acknowledges the contributions of:
Aerodynamics
Configurations
Performance
Configuration & Engineering Analysis
Noise
Program Administration
Propulsion
Structures
Technology
Weights
Eric Adamson, Chet Nelson
Greg Wyatt
Greg Bucci, Paul Carpenter,Jim Conlin, Laura Marshal
Ed Gronenthal, Jay Huffington
James Reed, Stefan Uellenberg
Mahmood Naimi
Dennis Berry, Ron Kawai
Bill Avery, Wendel Choy
Howard Tang
Kenton Sizer, David Wayman
Available from:
NASA Center for AeroSpace Information (CASt)7 !21 Standard Drive
Hanover, MD 21076-1320
(301) 621-0390
National Technical Information Service (NTIS)5285 Port Royal Road
Springfield, VA 22161-2 ! 71(703) 605-6000

EXECUTIVE SUMMARY
This study documents the design and analysis of four types of advanced
technology commercial transport airplane configurations (small, medium, large and
very large) with an assumed technology readiness date of 2010. These airplane
configurations were used as a platform to evaluate the design concept and installed
performance of advanced technology engines being developed under the NASA
Ultra Efficient Engine Technology (UEET) program.
The four airplane configuration designs were evaluated in two steps; the firstwas to evaluate the performance improvement of the airplanes using advanced
technology airframes with current technology in-production engines. The second
step was to evaluate the advanced technology airframes while using UEET
advanced technology engines. This way, incremental block fuel reductions could
be evaluated for effects of airframe technology improvements alone in step 1 and
then for the effects of engine and airframe technology improvements in step 2.
The configuration chosen for the small, medium and large airplanes was a
high wing (with winglets), "T" tail (with canard), twin engine, body mounted landing
gear, advanced technology tube-and-wing type design as shown in Figure "a".
They employed advanced materials in the fuselage, wing, empennage, landing gear
and nacelle. In addition, advanced technologies were used for aerodynamic flow
control on the wing, fuselage, empennage and nacelles. Other advanced, efficientairframe systems and aerodynamic sensors/antennas were also used on these
configurations. The choice of a high-wing configuration enabled an unconstrained
engine diameter study to be made.
Figure a, Small. Medium & Large UEET Airplane Configurations

For the very large configuration, a Blended Wing Body (BWB) configuration(Figure "b") was chosen in order to evaluate how UEET may benefit otherrevolutionary airplane configurations that NASA is sponsoring. The BWB offers alower wetted area per passenger seat and span loading benefits as compared tothe aforementioned configuration. The BWB also uses advanced materials in theconstruction of the airframe. However, advanced aerodynamic flow controltechnologies were not used in this configuration.
Figure b, Very Large UEET Airplane Configuration
The study results of the UEET advanced technology airframe with currenttechnology engines showed a 3%, 10% and 13% block fuel improvement in the
small, medium and large airplanes respectively over current production airplanes
with the same seating arrangements while operating on similar missions. The small
airplane experienced additional weight, wetted area and Specific Fuel Consumption
(SFC) penalties due to increases in passenger comfort levels and cruise speed.These were included to reflect realistic market drivers and probable evolutionary
design considerations. The airframe technologies used in this study were designedto evaluate the best potentially available block fuel use reductions one could
achieve based on "revolutionary" technologies that may be ready for application in
the year 2010. Their marketability has yet to be determined, but they representworthwhile avenues of exploration.
Upon installation of the UEET engines onto the UEET advanced technologyairframes, the small and medium airplanes both achieved an additional 16%
increase in fuel efficiency when using GE advanced turbofan engines. The large
airplane achieved an 18% increase in fuel efficiency when using the P&W geared
fan engine. The very large airplane (i.e. BWB), also using P&W geared fan
engines, only achieved an additional 16% that was attributed to a non-optimized
airplane/engine combination.
TABLE OF CONTENTS
Executive Summary
Table of Contents
List of Figures
Glossary
1.0 Introduction
2.0 Technical Approach
2.1 Performance Targets
2.2. Airplane Performance Comparisons2.2,1 Baseline Production Airplanes
2.2,2 UEET Airframe with Current Technology Engines
2.2,3 UEET Airframe with UEET Engines
2.3 Airframe Technologies
2.4 Engine Technologies
3.0 Aircraft Configuration Summary
3.1 Small Baseline Airplane (model 737-800)
3.2 Medium Baseline Airplane (model 777-200ER)
3.3 Large Baseline Airplane (model 747-400)
3.4 Small UEET Airframe with Current Technology Engines
3.5 Medium UEET Airframe with Current Technology Engine
3.6 Large UEET Airframe with Current Technology Engine
3.7 Very Large UEET Airframe with Current Technology Engine
3.8 Small UEET Airframe with UEET Engine
3.9 Medium UEET Airframe with UEET Engine
3.10 Large UEET Airframe with UEET Engine
3.11 Very Large UEET Airframe with UEET Engine
4.0 Performance Analysis
4.1 Engine
4.2 Airframe
iii
v
vii
3
3
4
44
5
5
7
9
9
10
11
12
12
13
14
14
15
15
15
16
16
21
III

4.3 Block Fuel Use
4.4 Noise
4.5 Emissions
5.0 Conclusions and Recommendations
References
24
27
32
41
42
iv
LIST OF FIGURES
Figure
Figure
Figure
Figure
Figure
Figure
Figure
Figure
Figure
Figure
Figure
Figure
Figure
Figure
Figure
Figure
Figure
Figure
Figure
Figure
Figure
Figure
Figure
Figure
Figure
Figure
Figure
Figure
Figure
a, Small, Medium & Large UEET Airplane Configurations
b, Very Large UEET Airplane Configuration
1.1, UEET System Integration Program Milestone Schedule
1.2, Engine Airframe Combinations
2.1.1 Engine and Airplane Historical Fuel Efficiency Gains
2.1.2,
2.2.1
2.3.1
2.3.2
2.4.1
3.1.1
3.1.2,
3.2.1
3.2.2
3.3.1
3.3.2
3.4.1
3.5.1
3.6.1
3.7.1
4.1.1,
4.1.2,
4.1.3,
4.1.4,
4.1.5,
4.1.6,
4.1.7,
4.1.8,
4.2.1
UEET Airplane Study Ground Rules
Baseline Performance
Wing & Tube Advanced Airframe Technologies
BWB Advanced Airframe Technologies
Paqei
ii
1
2
3
4
5
6
7
Challenges of Integrating High BPR Engines on Low Wing Airplanes 8
737-800 Basic Configuration
737-800 Seating Configuration
777-200ER Basic Configuration
777-200ER Seating Configuration
747-400 Basic Configuration
747-400 Seating Configuration
Small UEET Airplane Configuration
Medium UEET Airplane Configuration
Large UEET Airplane Configuration
Very Large UEET Airplane Configuration
UEET GEAE Engine Cross Section
UEET Pratt & Whitney Engine Cross Section
Engine Thrust Levels
Engine Fan Diameter and Bypass Ratio Comparison
Engine BPR trades
Engine Overall Pressure Ratio Comparison
Engine Thrust to Weight Ratio
Engine Nacelle Drag Comparison
Relative Aircraft Weight Savings
9
9
10
10
11
11
12
13
13
14
16
16
17
18
18
19
20
21
22
V
Figure
Figure
Figure
Figure
Figure
Figure
Figure
Figure
Figure
Figure
Figure
Figure
Figure
Figure
Figure
Figure
Figure
Figure
Figure
Figure
Figure
Figure
Figure
Figure
Figure
4.2.2,
4.2.3,
4.2.4,
4.2.5,
4.3.1
4.3.2,
4.3.3,
4.4.1
4.4.2,
4.4.3
4.4.4
4.4.5
4.4.6,
4.4.7.
4.5.1
4.5.2.
4.5.3.
4.5.4
4.5.5
4.5.6
4.5.7
4.5.8
4.5.9
Absolute Weight Comparisons 22
Airplane Fuel Use Sensitivity to Weight Increases 23
Airplane Fuel Use Sensitivity to Drag Increases 23
Comparison of Airframe and Engine Technology on AerodynamicProductivity 24
, Airplane Block Fuel Use 25
UEET enables one of most efficient transportation modes 26
UEET provides for a leap in fuel efficiency gains 27
, Improved noise levels are required due to increasing restrictions 27
Conventional airframe with advanced engine used for noiseestimates 28
Noise Definitions 29
Small UEET airplane met noise goals 30
Medium UEET airplane met noise goals 30
Large UEET airplane met noise goals 31
Very Large UEET airplane met noise goals 31
CO2 is an efficient byproduct of combustion 32
1,500 NMI used as the 002 baseline mission length for commonality33
Number of seats affects per passenger efficiency matrix
Seating configuration affects per passenger emissions
UEET enables large reductions in CO2 emissions
NOx is the Airplane Emission of Focus at Airports
Landing Take Off (LTO) is used to measure airport emissions
UEET offers improved NOx emissions
NOx rises precipitously for small increases in pressure ratio
4.5.10, P&W combustor shows significant NOx improvement whennormalized
4.5.11, HC and CO emissions met goal levels
33
34
35
36
37
38
38
39
40
vi
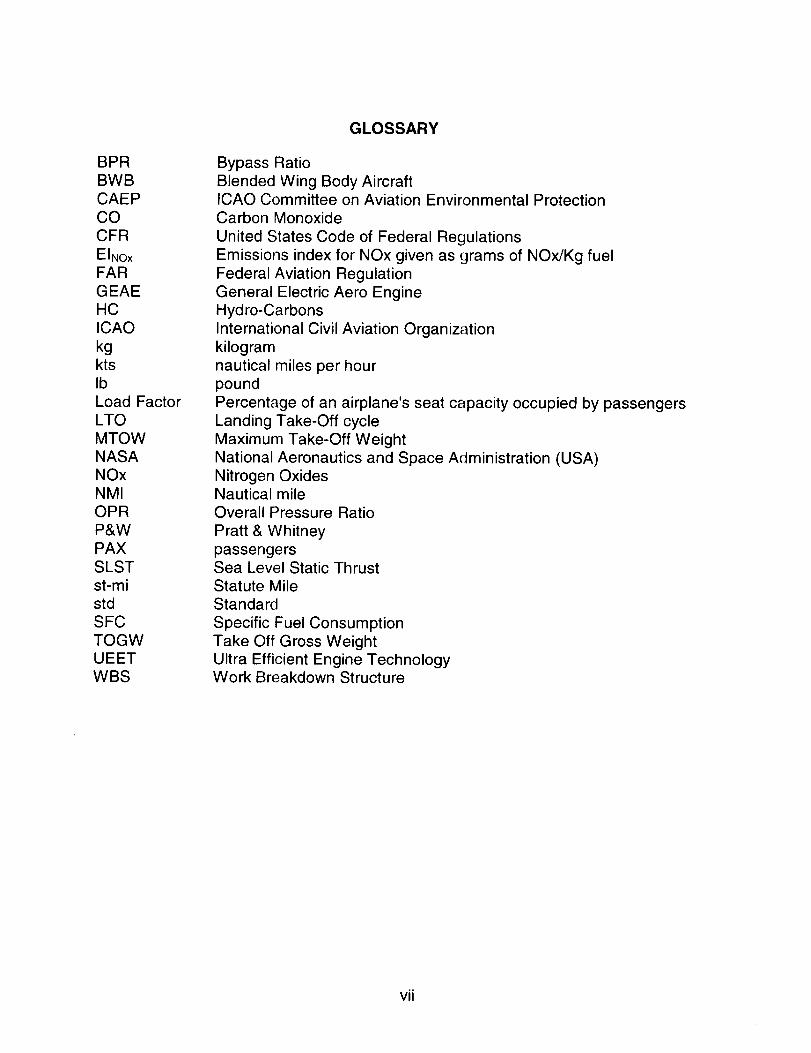
BPRBWBCAEPCOCFREINoxFARGEAEHCICAOkgktsIbLoad FactorLTOMTOWNASANOxNMIOPRP&WPAXSLSTst-mistdSFCTOGWUEETWBS
GLOSSARY
Bypass Ratio
Blended Wing Body AircraftICAO Committee on Aviation Environmental Protection
Carbon Monoxide
United States Code of Federal Regulations
Emissions index for NOx given as grams of NOx/Kg fuelFederal Aviation Regulation
General Electric Aero Engine
Hydro-Carbons
International Civil Aviation Organizationkilogram
nautical miles per hour
pound
Percentage of an airplane's seat capacity occupied by passengersLanding Take-Off cycle
Maximum Take-Off Weight
National Aeronautics and Space Administration (USA)Nitrogen OxidesNautical mile
Overall Pressure Ratio
Pratt & Whitney
passengersSea Level Static Thrust
Statute MileStandard
Specific Fuel Consumption
Take Off Gross WeightUltra Efficient Engine TechnologyWork Breakdown Structure
vii

1.0 INTRODUCTION
This report documents the results from the first year of study on the Ultra
Efficient Engine Technology (UEET) Systems Integration task, WBS 1.1, under the
NASA Ultra Efficient Engine Technology program.
The objective of this study was to quantify the airplane system-level impacts of
UEET engines on future airframes. Additional goals were to provide airplane level
sensitivities to changing engine design criteria, such as the increase in fuel burnwith increasing aircraft weight and drag. Lastly, recommendations were to be
offered as to which technologies and areas of development should be pursued.
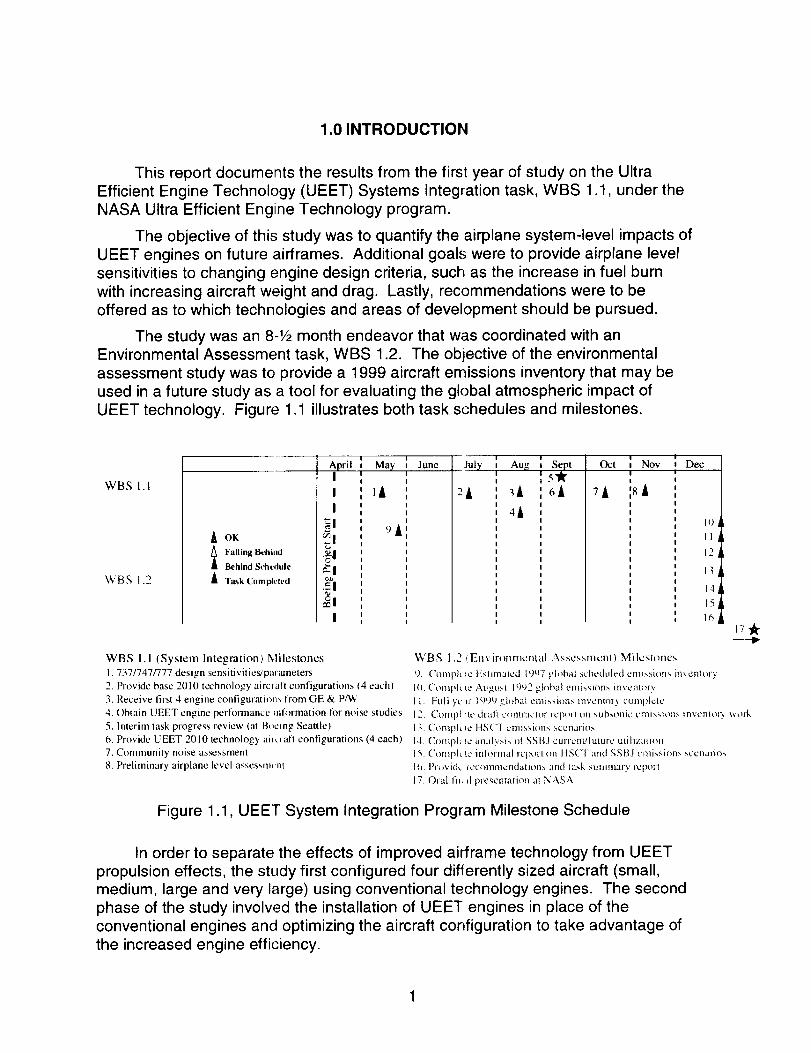
The study was an 8-1/2 month endeavor that was coordinated with anEnvironmental Assessment task, WBS 1.2. The objective of the environmental
assessment study was to provide a 1999 aircraft emissions inventory that may be
used in a future study as a tool for evaluating the global atmospheric impact ofUEET technology. Figure 1.1 illustrates both task schedules and milestones.
WBS 1. l
WBS 1.2
A OK
i Falling BehindBehind Schtalule
T'ask Compiett'd
• ¢ !Apml , May , June
I I I
I _AI
-_,i
.-|
_t!
WBS I. 1 (System Integration)Milestones
I. 737/747//77 design sensitivities/parameters
2. Provide base 2010 technology airc_ aft configurations (4 each]
3. Receive first 4 engine configuration, from GE & P/_'
4. Obtain UEET engine pertomlance reformation tbr noise studies
5. Interim task progress review (at Boeing Seattle)
6. Provide U EET 2010 technology all craft configurations (4 each)
7. Community noise assessment
8. Preliminary airplane level assessment
! !
July i Aug. _ Sept5"A"21 31 61
41
! iOct t Nov t Dec
i!i
7A :8A
lO
II
12
13
14
15
16
WBS 1.2 _Environrncntal Asses._mcnt) Milestones
9. Comph le Eslimaled 19o7 global scheduled en3ission_ inventory
I(l. Complt te August I t)92 global erni_sum_ inxcnt_r'_
I I. Full _?_cdrI-')9_._global emi_qon,, inventor. _,complete
12. Compl 'w draft c(mtraclor I'ep()ll on subsOlliC emissions Jnventol T _aork
13. Comph _e HS("[ emissions scenario_,
14. Com[',l_ tc analysi-, of SSB.I currengfuturc utilizqti4m
15. Complt te inl,)rmal rcp, u t on HSCI" and .<.St].! emissions sccnarm-,
1,'). Providv lec¢)nlmctldalions and task suIIiIIlary repol'|
17. Oral lh_;d presenlation al NASA
Figure 1.1, UEET System Integration Program Milestone Schedule
In order to separate the effects of improved airframe technology from UEET
propulsion effects, the study first configured four differently sized aircraft (small,medium, large and very large) using conventional technology engines. The second
phase of the study involved the installation of UEET engines in place of the
conventional engines and optimizing the aircraft configuration to take advantage ofthe increased engine efficiency.
When considering the installation of the UEET engines onto UEET advancedtechnology airframes, the wing and control surfaces can be re-sized to account forthe engine's improved Specific Fuel Consumption (SFC). Better SFC results in lessblock fuel required for a given range, which results in less Take Off Gross Weight(TOGW) and a corresponding smaller and lighter wing. Therefore, engineefficiency improvements are compounded when the full system design isconsidered (e.g. a 10% improvement in engine SFC can equal a 15% block fuelburn improvement in an optimized airplane design).
Both General Electric Aero Engine (GEAE) and Pratt & Whitney (P&W)engine companies were contractors to NASA under the UEET program. Overseveral years, they will be developing designs and laboratory demonstrations ofadvanced technology aerospace gas turbine engines. For this study, theyparticipated in developing the preliminary definitions and performance estimates offour study engines that were sized to fit four UEET airplane configurations understudy by the New Airplane Product Development team at the Boeing CommercialAirplane Group in Renton, Washington.
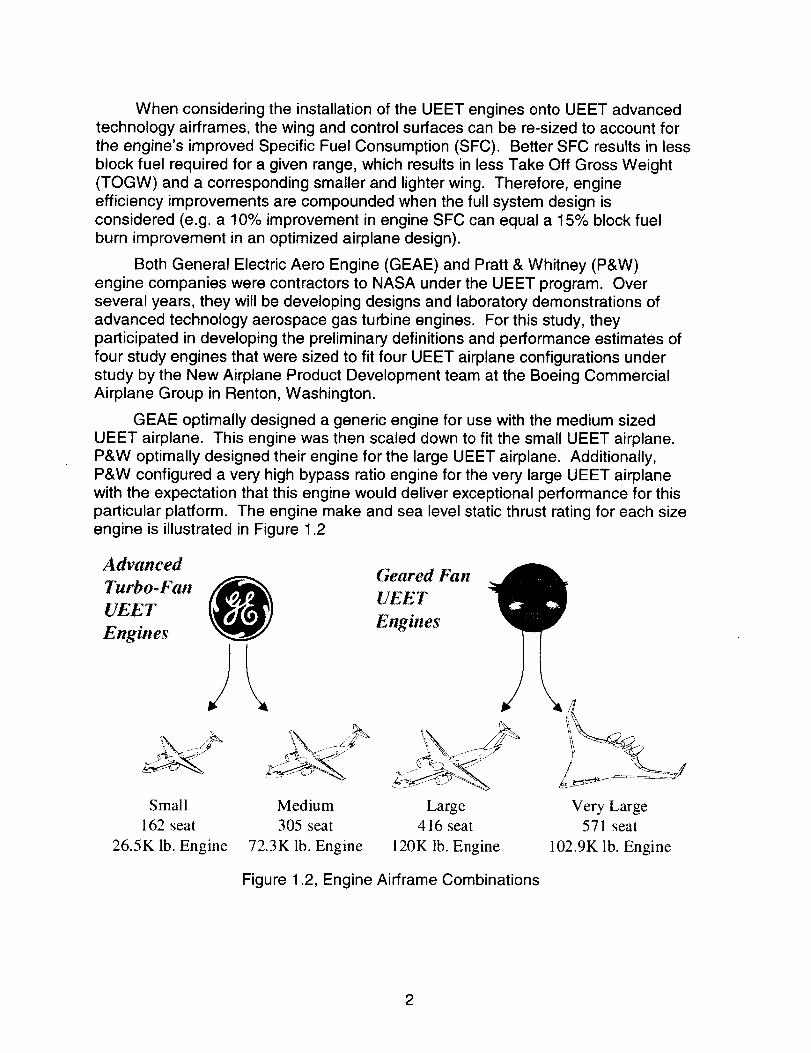
GEAE optimally designed a generic engine for use with the medium sizedUEET airplane. This engine was then scaled down to fit the small UEET airplane.P&W optimally designed their engine for the large UEET airplane. Additionally,P&W configured a very high bypass ratio engine for the very large UEET airplanewith the expectation that this engine would deliver exceptional performance for thisparticular platform. The engine make and sea level static thrust rating for each sizeengine is illustrated in Figure 1.2
Advanced Geared Fan
Turbo-Fan 0 UEETUEET EnginesEngines
Small Medium
162 seat 305 seat
26.5K lb. Engine 72.3K lb. Engine
Large
416 seat
120K lb. Engine
Very Large
571 seat
102.9K lb. Engine
Figure 1.2, Engine Airframe Combinations
2.0 TECHNICAL APPROACH
2.1 Performance Targets
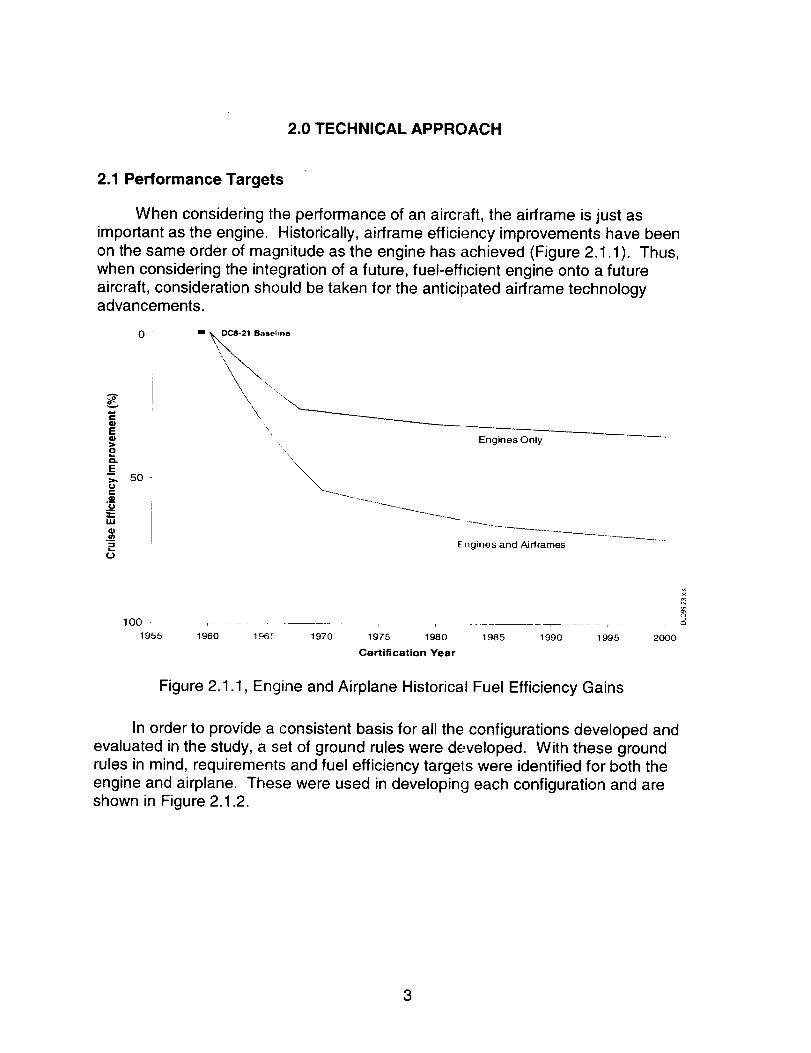
When considering the performance of an aircraft, the airframe is just as
important as the engine. Historically, airframe efficiency improvements have been
on the same order of magnitude as the engine has achieved (Figure 2.1.1). Thus,
when considering the integration of a future, fuel-efficient engine onto a future
aircraft, consideration should be taken for the anticipated airframe technologyadvancements.
A
E
o0.
E>, 500
.__=:uJ
G)
.__
.=0
m _lselirle\
\
Engines Only
Engines and Airframes
1 O0 - •
1955 1960 1_c_ 1970 1975 1980 1985 1990 1995 2000
Ce_ification Year
Figure 2.1.1, Engine and Airplane Historical Fuel Efficiency Gains
In order to provide a consistent basis for all the configurations developed and
evaluated in the study, a set of ground rules were developed. With these groundrules in mind, requirements and fuel efficiency targets were identified for both the
engine and airplane. These were used in developing each configuration and areshown in Figure 2.1.2.
3
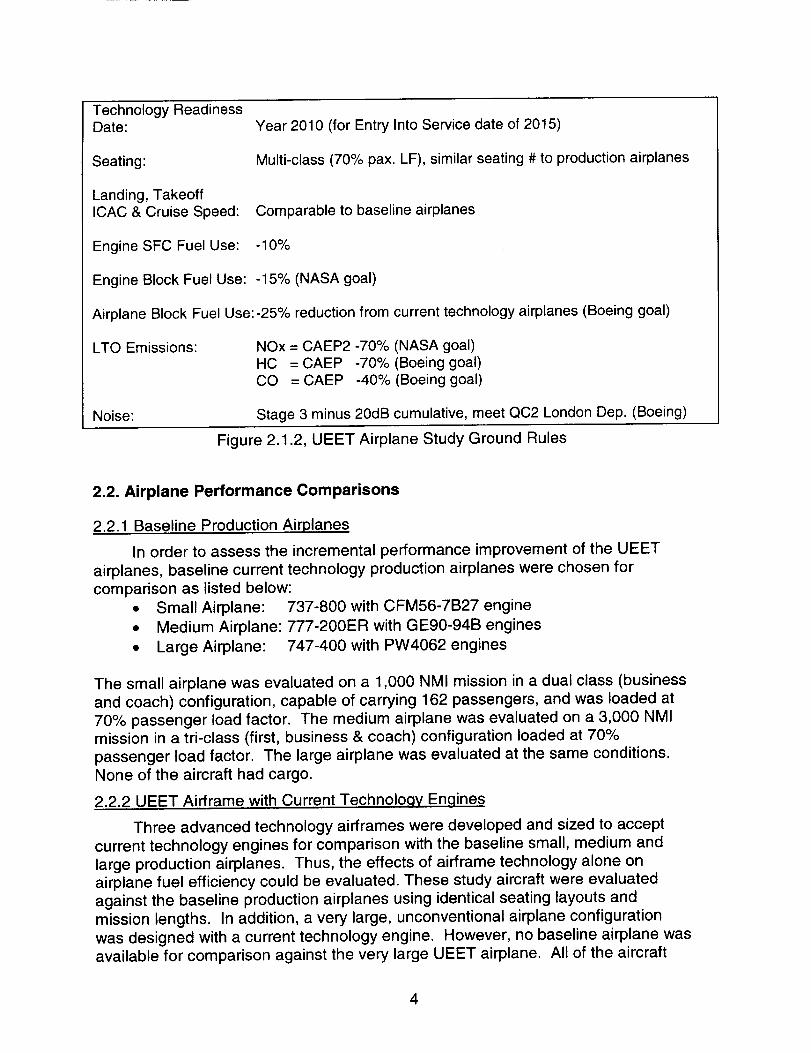
TechnologyReadinessDate:
Seating:
Landing,TakeoffICAC& CruiseSpeed: Comparableto baselineairplanes
EngineSFC FuelUse: -10%
EngineBlockFuelUse: -15% (NASAgoal)
Year2010(for EntryInto Servicedateof 2015)
Multi-class(70%pax.LF), similarseating# to productionairplanes
AirplaneBlockFuelUse:-25%reductionfrom currenttechnologyairplanes(Boeinggoal)
LTOEmissions: NOx= CAEP2-70% (NASAgoal)HC = CAEP -70% (Boeinggoal)CO = CAEP -40% (Boeinggoal)
Noise: Stage3 minus20dBcumulative,meetQC2LondonDep. (Boeing)
Figure 2.1.2, UEET Airplane Study Ground Rules
2.2. Airplane Performance Comparisons
2.2.1 Baseline Production Airplanes
In order to assess the incremental performance improvement of the UEET
airplanes, baseline current technology production airplanes were chosen for
comparison as listed below:
• Small Airplane: 737-800 with CFM56-7B27 engine
• Medium Airplane: 777-200ER with GE90-94B engines
• Large Airplane: 747-400 with PW4062 engines
The small airplane was evaluated on a 1,000 NMI mission in a dual class (business
and coach) configuration, capable of carrying 162 passengers, and was loaded at70% passenger load factor. The medium airplane was evaluated on a 3,000 NMImission in a tri-class (first, business & coach) configuration loaded at 70%
passenger load factor. The large airplane was evaluated at the same conditions.
None of the aircraft had cargo.
2.2.2 UEET Airframe with Current Technolo.qy En.qines
Three advanced technology airframes were developed and sized to accept
current technology engines for comparison with the baseline small, medium and
large production airplanes. Thus, the effects of airframe technology alone onairplane fuel efficiency could be evaluated. These study aircraft were evaluated
against the baseline production airplanes using identical seating layouts and
mission lengths. In addition, a very large, unconventional airplane configuration
was designed with a current technology engine. However, no baseline airplane wasavailable for comparison against the very large UEET airplane. All of the aircraft
4
were to be designed such that they would represent possible future, realisticairplane configurations that offer safe, affordable, high-performing, comfortable,quiet and clean transportation.
2.2.3 UEET Airframe with UEET Enqines
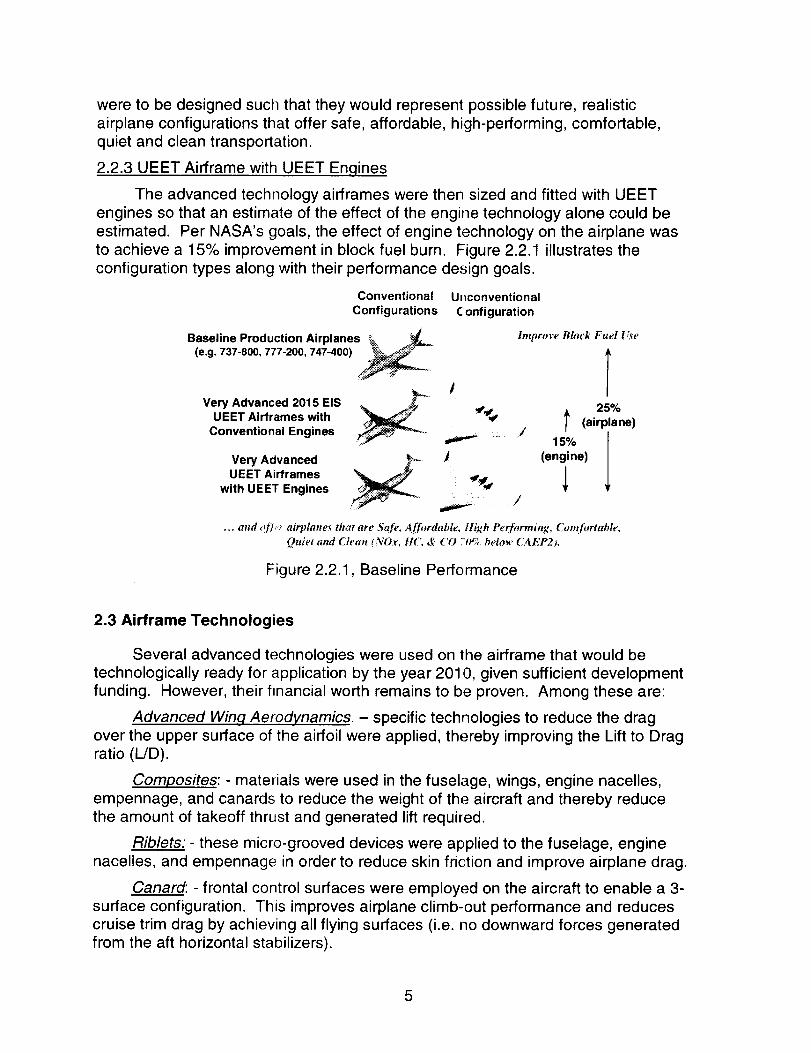
The advanced technology airframes were then sized and fitted with UEET
engines so that an estimate of the effect of the engine technology alone could be
estimated. Per NASA's goals, the effect of engine technology on the airplane was
to achieve a 15% improvement in block fuel burn. Figure 2.2.1 illustrates theconfiguration types along with their performance design goals.
Conventional
Configurations
Baseline Production Airplanes _
(e.g. 737-800, 777-200, 747-400) __
Very Advanced 2015 EIS _
UEET Airframes with _Conventional Engines _
Very Advanced _
UEET Airframeswith UEET Engines
/
t
Unconventional
Configuration
Improve Block Fuel L_e
T25%
_ (airplane)
15%
(engine)
1
.,. and _/_ airplanes that are Safe, Affhrdabte, High Pe.rforming, Comfortable.
Quiet a_td Clean (NOx. IIC, & CO 70% below CAEP2).
Figure 2.2.1, Baseline Performance
2.3 Airframe Technologies
Several advanced technologies were used on the airframe that would betechnologically ready for application by the year 2010, given sufficient development
funding. However, their financial worth remains to be proven. Among these are:
Advanced Winq Aerodynamics. - specific technologies to reduce the drag
over the upper surface of the airfoil were applied, thereby improving the Lift to Dragratio (L/D).
Composites: - materials were used in the fuselage, wings, engine nacelles,
empennage, and canards to reduce the weight of the aircraft and thereby reduce
the amount of takeoff thrust and generated lift required.
Riblets: - these micro-grooved devices were applied to the fuselage, engine
nacelles, and empennage in order to reduce skin friction and improve airplane drag.
Canard: - frontal control surfaces were employed on the aircraft to enable a 3-
surface configuration. This improves airplane climb-out performance and reduces
cruise trim drag by achieving all flying surfaces (i.e. no downward forces generatedfrom the aft horizontal stabilizers).
5
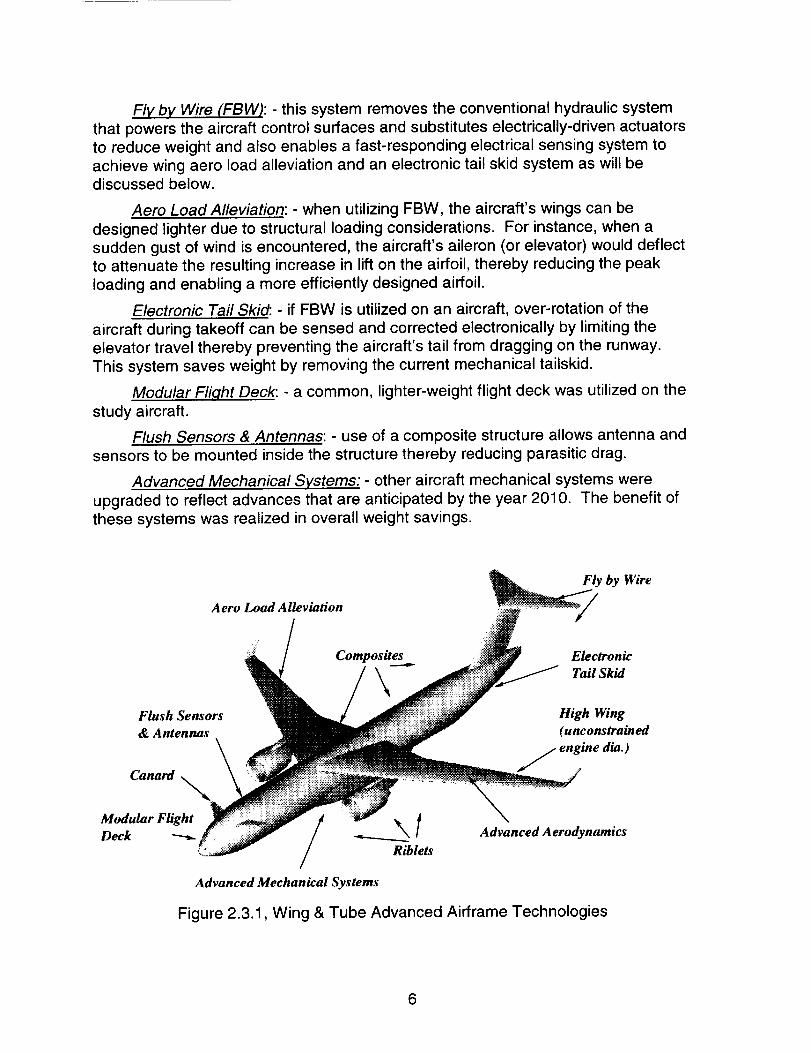
Fly by Wire (FBW): - this system removes the conventional hydraulic system
that powers the aircraft control surfaces and substitutes electrically-driven actuators
to reduce weight and also enables a fast-responding electrical sensing system to
achieve wing aero load alleviation and an electronic tail skid system as will bediscussed below.
Aero Load Alleviation: - when utilizing FBW, the aircraft's wings can be
designed lighter due to structural loading considerations. For instance, when asudden gust of wind is encountered, the aircraft's aileron (or elevator) would deflect
to attenuate the resulting increase in lift on the airfoil, thereby reducing the peak
loading and enabling a more efficiently designed airfoil.
Electronic Tail Ski_ - if FBW is utilized on an aircraft, over-rotation of the
aircraft during takeoff can be sensed and corrected electronically by limiting theelevator travel thereby preventing the aircraft's tail from dragging on the runway.
This system saves weight by removing the current mechanical tailskid.
Modular Fliqht Deck:. - a common, lighter-weight flight deck was utilized on the
study aircraft.
Flush Sensors & Antennas: - use of a composite structure allows antenna and
sensors to be mounted inside the structure thereby reducing parasitic drag.
Advanced Mechanical Systems: - other aircraft mechanical systems were
upgraded to reflect advances that are anticipated by the year 2010. The benefit ofthese systems was realized in overall weight savings.
A ero Load Alleviation
Wire
Flush Sensors
& Antennas
Composites_L"
\Electronic
Tail Skid
High V_ng
(unconstrained
engine dia.)
Canard
Modular Flight /
Deck _____. _ t
Riblets
Advanced Mechanical Systems
Advanced Aerodynamics
Figure 2.3.1, Wing & Tube Advanced Airframe Technologies
6
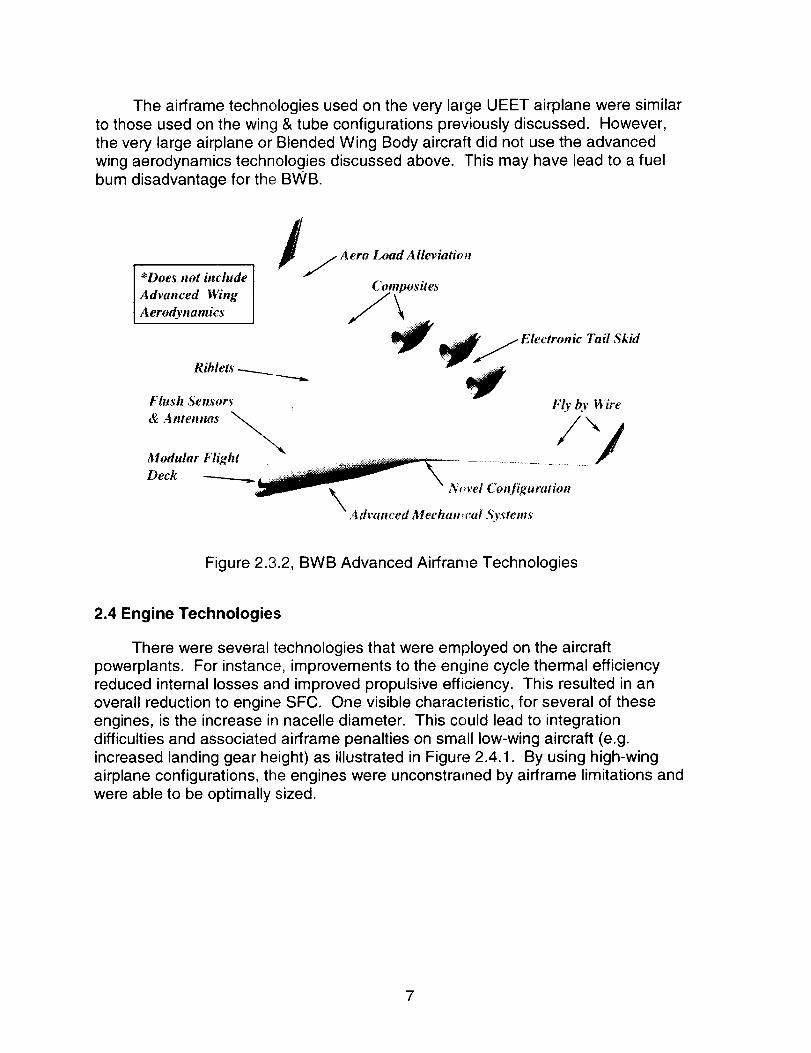
The airframetechnologies used on the very large UEET airplane were similarto those used on the wing & tube configurations previously discussed. However,the very large airplane or Blended Wing Body aircraft did not use the advancedwing aerodynamics technologies discussed above. This may have lead to a fuelburn disadvantage for the BWB.
*'Does not include
Advanced Wing
Aerodynamics
l j A ero Load A lleviatio _t
Composites
J\
Riblets --.__._...__...._._
Fhtsh Sensors
A.te,,,,a;Modular FTight
Deck
j Eleetronic Tail SkM
4Fly by l$'ire
/'/N, vel CoJd_gmution
_X,4 dvanced Mechanical Systems
Figure 2.3.2, BWB Advanced Airframe Technologies
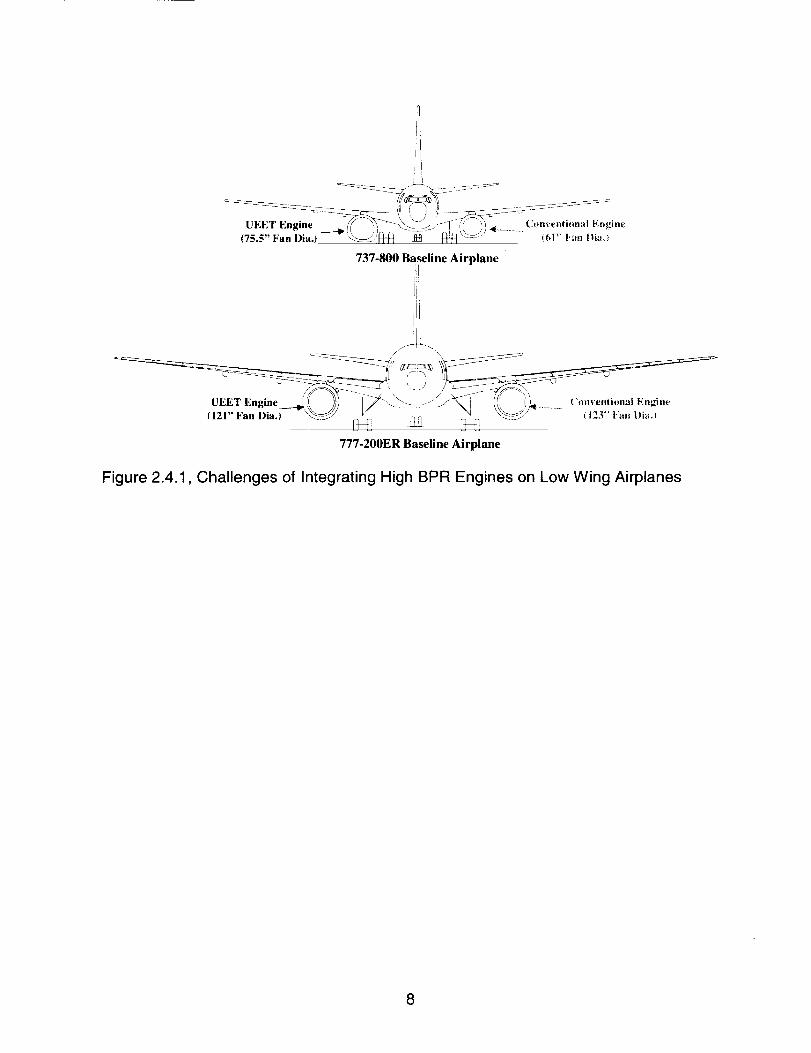
2.4 Engine Technologies
There were several technologies that were employed on the aircraft
powerplants. For instance, improvements to the engine cycle thermal efficiency
reduced internal losses and improved propulsive efficiency. This resulted in an
overall reduction to engine SFC. One visible characteristic, for several of theseengines, is the increase in nacelle diameter. This could lead to integration
difficulties and associated airframe penalties on small low-wing aircraft (e.g.
increased landing gear height) as illustrated in Figure 2.4.1. By using high-wing
airplane configurations, the engines were unconstrained by airframe limitations andwere able to be optimally sized.
7
737-800 Baseline Airplane
UEET Engine ___r{121" Fan Dia.)
777-200ER Baseline Airplane
Figure 2.4.1, Challenges of Integrating High BPR Engines on Low Wing Airplanes
8

3.0 AIRCRAFT CONFIGURATION SUMMARY
3.1 Small Baseline Airplane (model 737-800)
The small baseline airplane was a 737-800 with two CFM56-7B27 engines,each producing 27,300 pounds of sea level static thrust. The maximum takeoff
gross weight (MTOW) was 174,200 Ib with a cruise speed of 0.785 Mach and
maximum range of 2,940 NMI and maximum fuel capacity of 6,875 US Gallons.
Basic dimensions of a typical 737-800 are listed in Figure 3.1.1 below:
117ffSin
Figure 3.1.1,737-800 Basic Configuration
The aircraft was configured in a 2-class seating configuration accommodating162 passengers in a 36" pitch first class and 32" pitch coach arrangement as shownin Figure 3.1.2.
f_ economyclass class
Figure 3.1.2, 737-800 Seating Configuration
9

3.2 Medium Baseline Airplane (model 777-200ER)
The medium baseline airplane was a 777-200ER with two GE90-94B engines,
each producing 94,000 pounds of sea level static thrust. The MTOW was 656,000
Ib with a cruise speed of 0.84 Mach and maximum range of 7,695 NMI with amaximum fuel capacity of 45,220 US Gallons. Basic dimensions of the 777-200ER
used in the study are listed in Figure 3.2.1 below:
1BBft 11 in(eo,_ m)
_. 70 # 7,5 in
', {2t_S m}
3Set 0 k_(11.0 rn) _
.......... ft 7.5 in
Figure 3.2.1,777-200ER Basic Configuration
The aircraft was configured in a 3-class seating configuration accommodating
305 passengers in a 60" pitch first class, 38" pitch business class and 32" pitch
coach arrangement as shown in Figure 3.2.2.
ssnnlIW mUlIII
elm class elm
Figure 3.2.2,777-200ER Seating Configuration
10

3.3 Large Baseline Airplane (model 747-400)
The large baseline airplane was a 747-400 with four PW4062 engines each
producing 63,300 pounds of sea level static thrust. The MTOW was 875,000 Ib
with a cruise speed of 0.85 Mach and maximum range of 7,330 NMI with maximum
fuel capacity of 57,285 US Gallons. Basic dimensions of the 747-400 used in the
study are listed in Figure 3.3.1 below:
='°' </i7/ /7 T
....................................i4..................... .............. ,___..: _ c_ --_,-%,,%
_,,5 It 2 in .,.(68.6 m)
Figure 3.3.1,747-400 Basic Configuration
The aircraft was configured in a 3-class seating configuration accommodating416 passengers in a 61" pitch first class, 39" pitch business class and 32" pitch
coach arrangement as shown in Figure 3.3.2.
_Uilli :|!I|_ J_
lnd busileSS economyclass class class
Figure 3.3.2,747-400 Seating Configuration
11

3.4 Small UEET Airframe with Current Technology Engines
The small UEET airplane with conventional engines utilized two CFM56-7B27
engines, each producing 26,500 pounds of sea level static thrust. The aircraft has
a cruise speed of 0.80 Mach and maximum range of 3,200 NMI. Number and pitchof interior seats was the same as the baseline airplane. Basic shape and interior
layout of the small airplane is shown in Figure 3.4.1 below.
=22-
Figure 3.4.1, Small UEET Airplane Configuration
The small airplane experienced additional weight, wetted area and fuel mileage
penalties due to increases in passenger comfort levels and cruise speed. Thesewere included to reflect realistic market drivers and probable evolutionary design
considerations. Additionally, weight penalties were incurred due to the use of the
"T" tail configuration. Additional wetted area was also seen due to the wing boxspar protrusion above the fuselage and the necessary body landing gear fairings.
3.5 Medium UEET Airframe with Current Technology Engine
The medium UEET airplane with conventional engines utilized two GE90-77B
engines, each producing 79,700 pounds of sea level static thrust. The aircraft hasa cruise speed of 0.85 Mach and maximum range of 7,700 NMI. The count and
pitch of interior seats were the same as the baseline airplane. Basic shape andinterior layout of the small airplane is shown in Figure 3.5.1 below.
12

Figure 3.5.1, Medium UEET Airplane Configuration
The airplane experienced a slight increase in wetted area as compared to thebaseline airplane due to the body landing gear fairings. Even with the increasedfuselage wetted area; L/D declined due to the use of the advanced wingaerodynamics and riblets. Including the "T" weight penalty, the airplane stillexperienced a weight reduction due to the use of composite materials. Theairplane enjoyed a slight increase (0.01 Mach) in cruise speed over the baselineairplane.
3.6 Large UEET Airframe with Current Technology Engine
The medium UEET airplane with conventional engines utilized two GE90-
115B engines, each producing 112,800 pounds of sea level static thrust. The
aircraft has a cruise speed of 0.85 Mach and maximum range of 7,300 NMI. The
count and pitch of interior seats were the same as the baseline airplane. Basic
shape and interior layout of the small airplane is shown in Figure 3.6.1 below.
/
I I
Figure 3.6.1, Large UEET Airplane Configuration
13

The aircraft utilized a single deck architecture that resulted in a large availablespace above the main passenger cabin. This area was able to completely housethe wing box spar and could also be used for passenger work and leisure space.Thus, the airplane experienced an increase in fuselage-wetted area as well assome minor increase due to the landing gear fairings. "T" tail weight penalties werestill incurred.
3.7 Very Large UEET Airframe with Current Technology Engine
The large baseline airplane was a Blended Wing Body aircraft with three
PW4098 engines each producing 96,000 pounds of sea level static thrust. The
aircraft has a cruise speed of 0.855 Mach and maximum range of 7,100 NMI. Basic
layout of the BWB, as used in the study, is shown below in Figure 3.7.1:
Figure 3.7.1, Very Large UEET Airplane Configuration
The aircraft was configured in a 3-class seating configuration accommodating
571 passengers in a 61" pitch, 33 seat first class, 39" pitch, 110 seat business class
and 32" pitch, 428 seat coach arrangement.
3.8 Small UEET Airframe with UEET Engine
The basic layout of the aircraft is the same as discussed under the "SmallUEET Airframe with conventional engine" section 3.4. The aircraft used two GEAE
Advanced turbofan engines each producing 26,500 pounds of sea level staticthrust. The aircraft has a cruise speed of 0.80 Mach and maximum range of 3,200NMI.
The following performance comparisons are measured against the baseline
737-800 airplane. The airplane saw a 30% reduction in wing area due to
improvements in wing aerodynamics and engine fuel burn, requiring less fuel to be
carried and a smaller resulting wing. Payload capacity increased 17%. Theincreased comfort level fuselage primarily resulted in a 23% increase in wetted area
14
with a corresponding 5% loss in L/D and 6% increa.':;ein Operating Empty Weight(OEW).
3.9 Medium UEET Airframe with UEET Engine
The basic layout of the aircraft is the same as discussed under the "Medium
UEET Airframe with conventional engine" section 3.5. The aircraft used two GEAE
Advanced turbofan engines each producing 72,300 pounds of sea level static
thrust. The aircraft has a cruise speed of 0.85 Mach and maximum range of 7,700NMI.
The following performance comparisons are measured against the baseline
777-200ER airplane. The airplane's wing area decreased 13% due to reduced
weight, improved aerodynamics and more efficient engines. Payload capability
increased 34% due to weight reduction. L/D improved 3% due to aerodynamicconsiderations, and OEW decreased 16% due to the use of composite materials.
3.10 Large UEET Airframe with UEET Engine
The basic layout of the aircraft is the same as discussed under the "LargeUEET Airframe with conventional engine" section 3.6. The aircraft used two P&Wgeared fan engines each producing 108,300 pounds of sea level static thrust. The
aircraft has a cruise speed of 0.85 Mach and maximum range of 7,300 NMI.
The following performance comparisons are measured against the baseline
747-400 airplane. The airplane's wing area decreased 11% due to improvedaerodynamics and more efficient engines. However, the fuselage-wetted area
increased 20% due to the single deck design. L/D still managed to see a 3%
improvement due to the use of a twin engine configuration versus quad, improved
aerodynamics and a 16% decrease in OEW due to the use of composites.
Payload capability decreased 10% due to a decrease in available enginethrust.
3.11 Very Large UEET Airframe with UEET Engine
The basic layout of the aircraft is the same as discussed under the "VeryLarge UEET Airframe with conventional engine" section 3.7. The aircraft used three
P&W geared fan engines each producing 102,900 pounds of sea level static thrust.
The aircraft has a cruise speed of 0.855 Mach and maximum range of 7,100 NMI.
The following performance comparisons are measured against the BWB with
conventional engines. The improvements represent "engine-only" impacts. Theairplane's wing area remained the same, but start of cruise L/D improved 4% due
the use of more efficient engines and resulting lower fuel load for the 3,000 NMI
mission which results in lower weight and less induced drag. Aircraft weight
remained essentially the same due to the use of a non-optimized engine, which hadan extremely high engine by pass ratio with resulting high fan, nacelle and gearbox
weights thereby offsetting the other weight reductions presumably gained in theengine core.
15
4.0 PERFORMANCE ANALYSIS
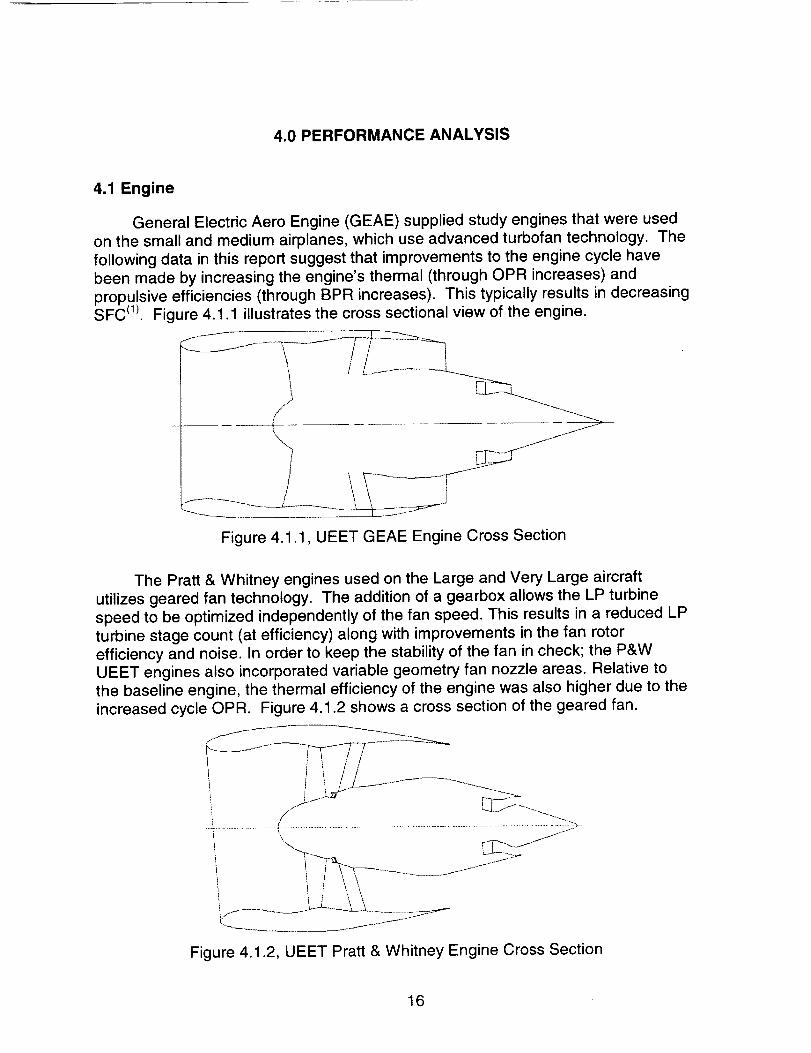
4.1 Engine
General Electric Aero Engine (GEAE) supplied study engines that were usedon the small and medium airplanes, which use advanced turbofan technology. The
following data in this report suggest that improvements to the engine cycle havebeen made by increasing the engine's thermal (through OPR increases) and
propulsive efficiencies (through BPR increases). This typically results in decreasingSFC (1). Figure 4.1.1 illustrates the cross sectional view of the engine.
\l _ JJJ
' i t
Figure 4.1.1, UEET GEAE Engine Cross Section
The Pratt & Whitney engines used on the Large and Very Large aircraft
utilizes geared fan technology. The addition of a gearbox allows the LP turbinespeed to be optimized independently of the fan speed. This results in a reduced LP
turbine stage count (at efficiency) along with improvements in the fan rotor
efficiency and noise. In order to keep the stability of the fan in check; the P&W
UEET engines also incorporated variable geometry fan nozzle areas. Relative tothe baseline engine, the thermal efficiency of the engine was also higher due to the
increased cycle OPR. Figure 4.1.2 shows a cross section of the geared fan.
t' i i /
,./.>.t L.;...f....................1..............................,S...........................................................................................................................................{3":_.-,......
Figure 4.1.2, UEET Pratt & Whitney Engine Cross Section
16

Figure 4.1.3 shows the thrust levels for the various UEET engines. Airframeimprovements resulted in a lower required thrust for the medium and largeairplanes. The small airplane required the same thrust level due to the previouslydiscussed increases in cabin comfort and resulting higher thrust requirements. Thevery large airplane shows anincrease in Sea Level Static (SLS) thrust. This is dueto the high BPR design of that particular engine and resulting higher SLS thrustlevel.
120,000
'_. 100,000,,Q
_.180,000
I,._
,,CI- 60,000
C,m
O'Jt-
Ill 40,000
O
I- 20,000
04
B Baseline EnginesUEET Engnes /
Increasedairframe
requirement
SmallGE Turb,_faa
Improvedairframe
Improvedairframe
-4%
Higher Lapse
Rate Engine
+7%
18
Medium Large Very LargeGE Turbofan P&W Geared Fan P&W Geared Fan
UEET Airplane
Figure 4.1.3, Engine Thrust Levels
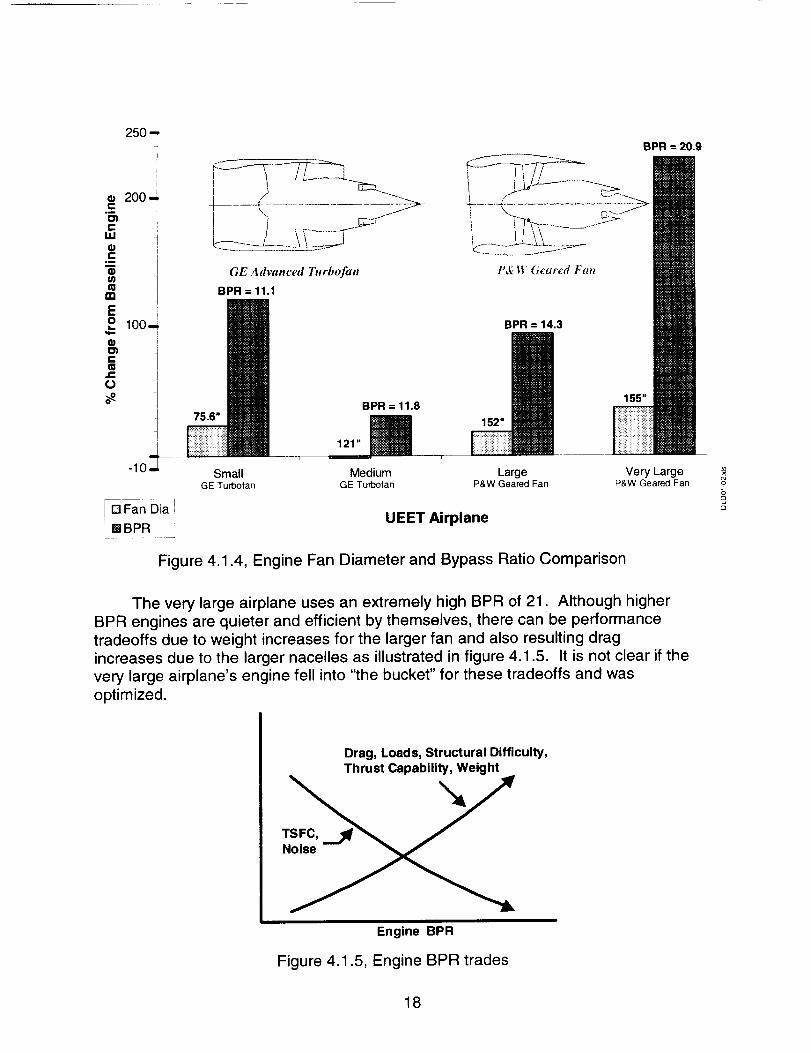
Fan diameter is the physical measurement, from blade tip to blade tip, across
an engine's fan face. By Pass Ratio (BPR) is the ratio of secondary and primaryairflows. For a given core size, the engine bypass ratio increases in concert with
increases to the fan diameter. Alternatively, and for a given fan diameter, engine
bypass ratio increases by reducing the core flow size. A further consequence of the
higher BPR engines is that effective jet velocities tend to be lower. Figure 4.1.4
shows the fan diameter and bypass ratio characteristics of the UEET engines.Large increases in BPR were achieved with nominal increases, or in some casesno increases, to the fan diameter.
17
250 --
I
• 200--C
c !
1
I1)
_ lOO.
• 4
® !i- l
o 1
.J
! D Fan Dia 1i
BBPR ]
GE Advanced Turbofan
BPR = 11.1
BPR = 20.9
75.6"
SmallGE Turbofan
BPR = 11.8
121" _
MediumGE Turbofan
BPR = 14.3
152"
LargeP&W Geared Fan
155"
Very LargeP&W Geared Fan
UEET Airplane
Figure 4.1.4, Engine Fan Diameter and Bypass Ratio Comparison
The very large airplane uses an extremely high BPR of 21. Although higherBPR engines are quieter and efficient by themselves, there can be performance
tradeoffs due to weight increases for the larger fan and also resulting dragincreases due to the larger nacelles as illustrated in figure 4.1.5. It is not clear if the
very large airplane's engine fell into "the bucket" for these tradeoffs and was
optimized.
TSFC,Noise
Drag, Loads, Structural Difficulty,Thrust Capability, Weight
Engine BPR
Figure 4.1.5, Engine BPR trades
18
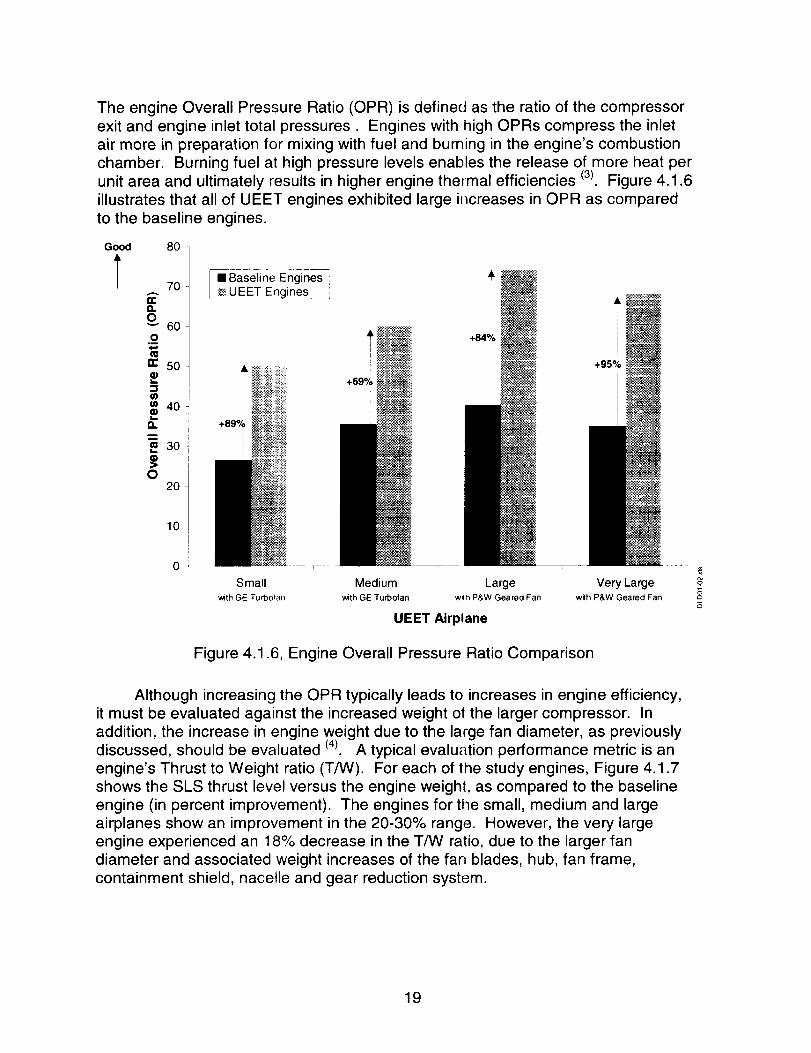
The engine Overall Pressure Ratio (OPR) is defined as the ratio of the compressorexit and engine inlet total pressures. Engines with high OPRs compress the inletair more in preparation for mixing with fuel and burning in the engine's combustionchamber. Burning fuel at high pressure levels enables the release of more heat perunit area and ultimately results in higher engine thermal efficiencies (3). Figure 4.1.6illustrates that all of UEET engines exhibited large increases in OPR as comparedto the baseline engines.
Good
T80
70A
D,,0
60O
om
0C 50
_ 4oL,.
0-
o20
10
0
mBaseline E ngin_-UEET Engines
&
I
i
+89%
i
Small
with GE Turbofa_
+84%
Mediumwith GE Turbofan
Largew,h P&W GearedFan
UEET Airplane
Very Largewith P&WGearedFan
..... 7
Q
Figure 4.1.6, Engine Overall Pressure Ratio Comparison
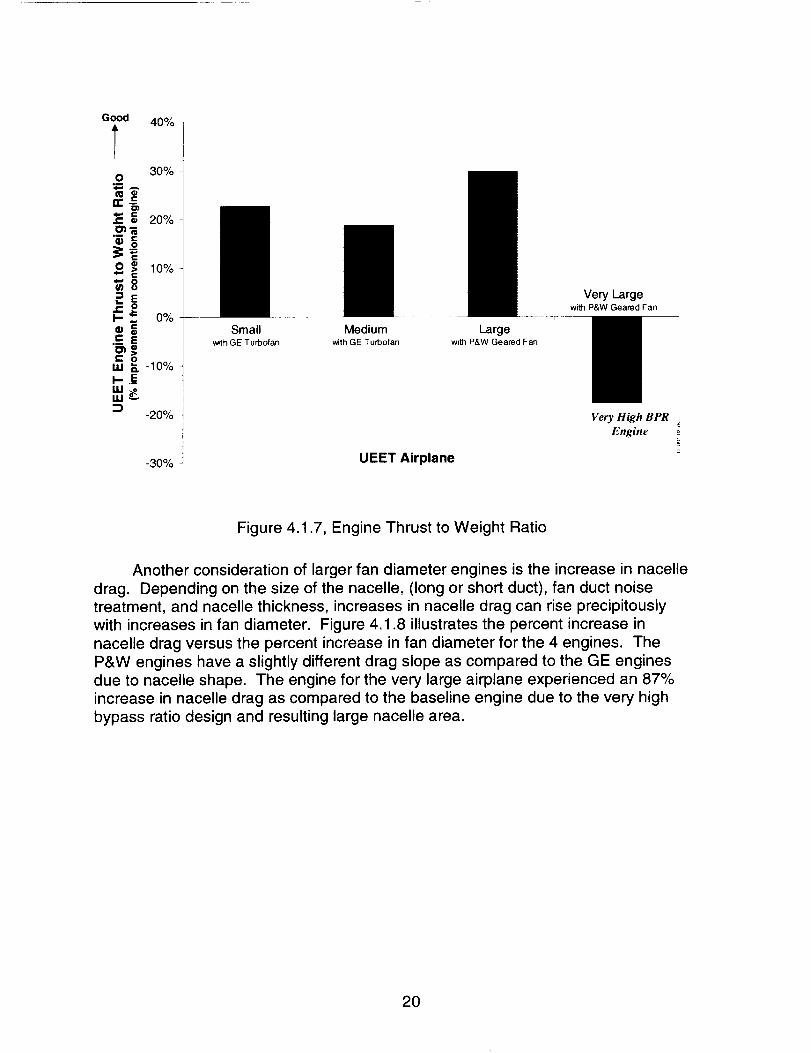
Although increasing the OPR typically leads to increases in engine efficiency,
it must be evaluated against the increased weight ot the larger compressor. In
addition, the increase in engine weight due to the large fan diameter, as previouslydiscussed, should be evaluated (4). A typical evaluation performance metric is an
engine's Thrust to Weight ratio (T/W). For each of the study engines, Figure 4.1.7
shows the SLS thrust level versus the engine weight, as compared to the baseline
engine (in percent improvement). The engines for the small, medium and largeairplanes show an improvement in the 20-30% range. However, the very large
engine experienced an 18% decrease in the T/W ratio, due to the larger fan
diameter and associated weight increases of the fan blades, hub, fan frame,
containment shield, nacelle and gear reduction system.
19
Good 40%
30%O
,,_ e-• 20%
_ 10%c
'_ 0
2E¢-
p. _ 0%
.__ E
e,- om _. -10%p.._Em_W_
-20%
Small Medium Largev_th GE Turbofan with GE Turbofan with P&W Geared Fan
i UEET Airplane-30% =
Very Largewith P&W Geared Fan
Very High BPR
Engine
Figure 4.1.7, Engine Thrust to Weight Ratio
Another consideration of larger fan diameter engines is the increase in nacelle
drag. Depending on the size of the nacelle, (long or short duct), fan duct noisetreatment, and nacelle thickness, increases in nacelle drag can rise precipitously
with increases in fan diameter. Figure 4.1.8 illustrates the percent increase in
nacelle drag versus the percent increase in fan diameter for the 4 engines. The
P&W engines have a slightly different drag slope as compared to the GE engines
due to nacelle shape. The engine for the very large airplane experienced an 87%increase in nacelle drag as compared to the baseline engine due to the very high
bypass ratio design and resulting large nacelle area.
20

W
t,,)
.E
.oo
100% 1
90%
80%
70%
60%
5O%
40%
3O%
20%
Lm'ge
Airplml_ _'
Jr
_" .o
_ S
,._J" S
10% ,..,.,. "" .,, ,.. ,- "
-5% O% 5%
P& _ (;earedFan
J
t#
4
f
%cry l_ar_zeAirplane
J
d
Jt
tI
J
a'
,d
#
Small i _:L_--L• ) -['¢':_.._.
Airplane [r E i>
(IF. Advanced
"]'llrbofan
T ........ 7 .....
10% 15% 20% 25% 30% 35% 40%
Increase in Fan Dia (%)
Figure 4.1.8, Engine Nacelle Drag Comparison
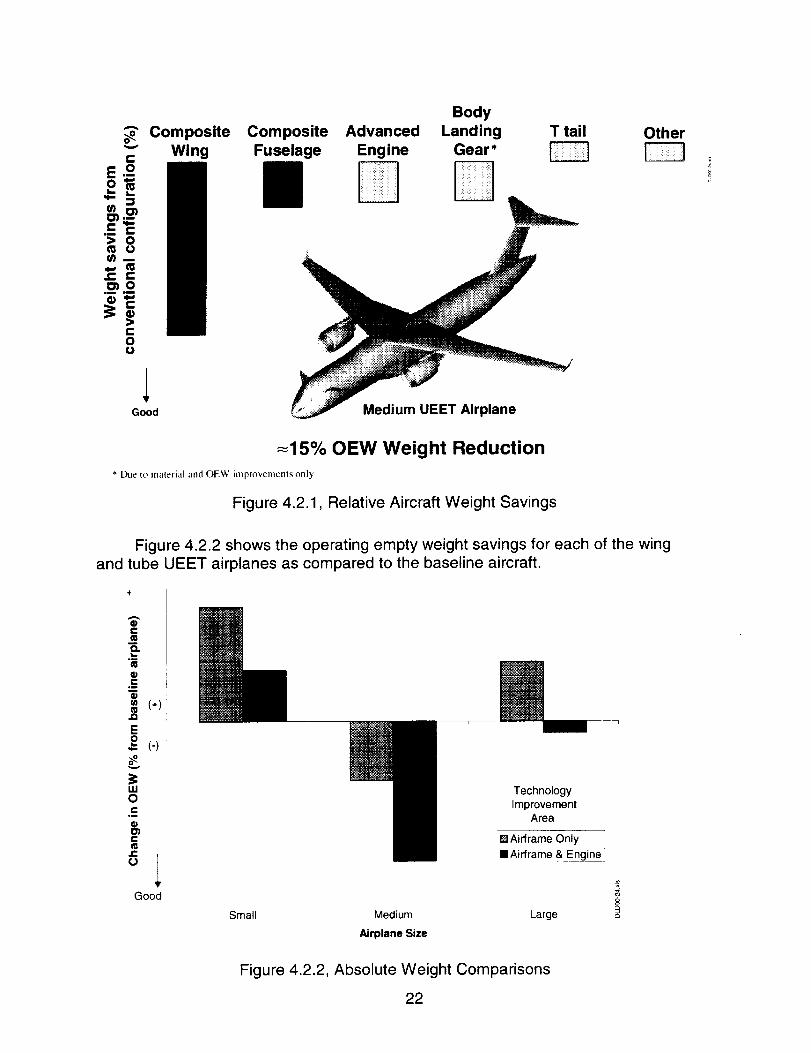
4.2 Airframe
Weight is a crucial factor in evaluating an airplane's performance. As the
weight of an aircraft increases, increased lift must be generated which results inincreases to induced drag which must be overcome with increased thrust and
associated fuel burn (5). The UEET airplane used composite materials in the engine
and airframe to reduce weight. Figure 4.2.1 shows that the greatest percentage
weight reduction (as compared to a baseline airplane) was obtained by the use ofcomposites in the wing construction. The fuselage played a lesser role. Figure
4.1.7 showed an improvement in the thrust to weight ratio and is also reflected in
Figure 4.2.1. A body-mounted landing gear iS(s)nOrmally heavier than a wing-mounted landing gear on a low-wing airplane . However, the use of metal matrix
composites resulted in a net decrease in landing gear weight. The use of a "T" tail
configuration resulted in weight increases in all of the wing and tube UEET
airplanes. Increased passenger amenities (e.g. entertainment systems) slightlyincreased the weight of all the airplanes from the baseline.
21
Composite,. Wing
E.2o_
> O
j= *--O_O
II ii
>c-Ou
,lGood
Body
Composite Advanced Landing
Fuselage Engine Gear*
Medium UEET Airplane
T tail
--15% OEW Weight Reduction
* Due to material and OEW improvemenls only
Figure 4.2.1, Relative Aircraft Weight Savings
Other
andFigure 4.2.2 shows the operating empty weight savings for each of the wing
tube UEET airplanes as compared to the baseline aircraft.
v
uJOt-
°i
O)C
t.-
°tGood
TechnologyImprovement
Area
[] Airframe Only[]A rframe & Engine:
Small Medium Large
Airplane Size
Figure 4.2.2, Absolute Weight Comparisons
22
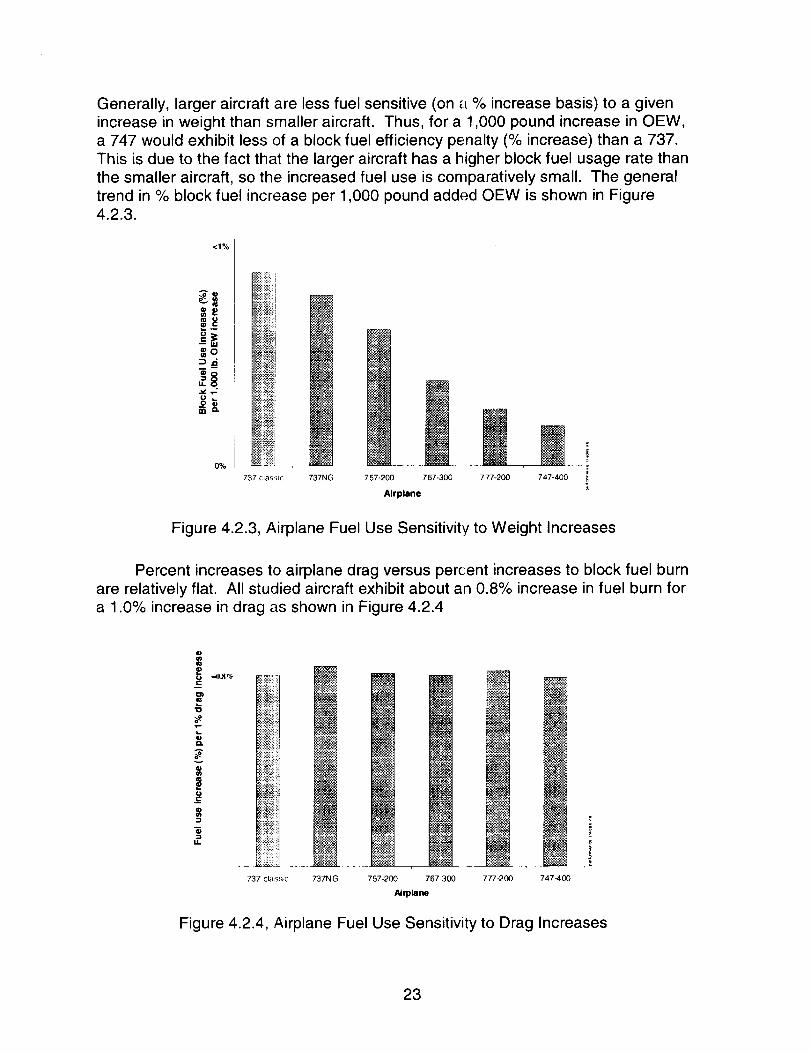
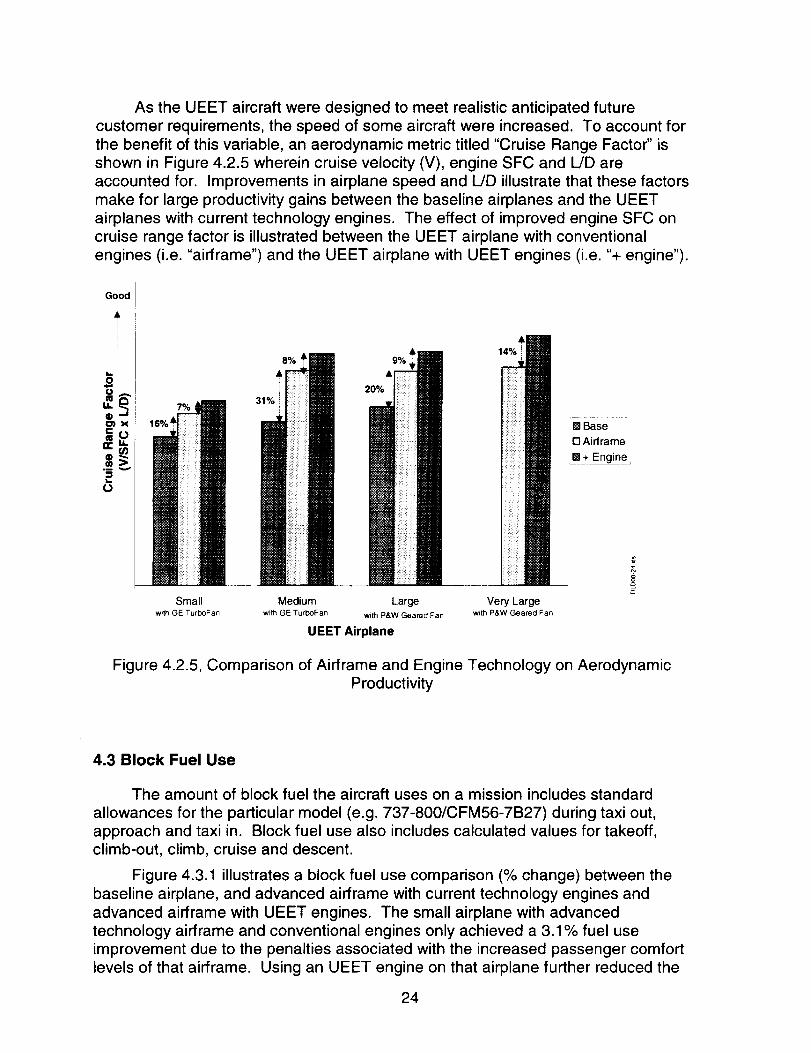
Generally, larger aircraft are less fuel sensitive (on a % increase basis) to a givenincrease in weight than smaller aircraft. Thus, for a 1,000 pound increase in OEW,a 747 would exhibit less of a block fuel efficiency penalty (% increase) than a 737.This is due to the fact that the larger aircraft has a higher block fuel usage rate thanthe smaller aircraft, so the increased fuel use is comparatively small. The generaltrend in % block fuel increase per 1,000 pound added OEW is shown in Figure4.2.3.
<1%
•_ _ ,.
g _ "_i,.. -- i_: !
_ __
_ NNiOO/o NI
737 clas_;_c 737NG 757-200 767-300
Airplane
777-200 747-400
i
Figure 4.2.3, Airplane Fuel Use Sensitivity to Weight Increases
Percent increases to airplane drag versus percent increases to block fuel burn
are relatively flat. All studied aircraft exhibit about an 0.8% increase in fuel burn for
a 1.0% increase in drag as shown in Figure 4.2.4
t,o.
o._=
#.
,,,0.8'7,-
737 cla s._c 737N G 757-200 767_300 777-200 747-400
Figure 4.2.4, Airplane Fuel Use Sensitivity to Drag Increases
23
As the UEET aircraft were designed to meet realistic anticipated future
customer requirements, the speed of some aircraft were increased. To account for
the benefit of this variable, an aerodynamic metric titled "Cruise Range Factor" is
shown in Figure 4.2.5 wherein cruise velocity (V), engine SFC and L/D areaccounted for. Improvements in airplane speed and L/D illustrate that these factors
make for large productivity gains between the baseline airplanes and the UEETairplanes with current technology engines. The effect of improved engine SFC on
cruise range factor is illustrated between the UEET airplane with conventional
engines (i.e. "airframe") and the UEET airplane with UEET engines (i.e. "+ engine").
Good
I
16%'
7%
8% 9%
Small Medium Large
with GE TurboFan with GE TurboFan with P&W Geared Fan
UEET Airplane
14.Jo_i
ii
iii
Very Largewith P&W Geared Fan
-"--Ba_e.....[2] Airframe
!! + Engine
Figure 4.2.5, Comparison of Airframe and Engine Technology on Aerodynamic
Productivity
4.3 Block Fuel Use
The amount of block fuel the aircraft uses on a mission includes standard
allowances for the particular model (e.g. 737-800/CFM56-7B27) during taxi out,
approach and taxi in. Block fuel use also includes calculated values for takeoff,climb-out, climb, cruise and descent.
Figure 4.3.1 illustrates a block fuel use comparison (% change) between the
baseline airplane, and advanced airframe with current technology engines andadvanced airframe with UEET engines. The small airplane with advanced
technology airframe and conventional engines only achieved a 3.1% fuel use
improvement due to the penalties associated with the increased passenger comfort
levels of that airframe. Using an UEET engine on that airplane further reduced the
24
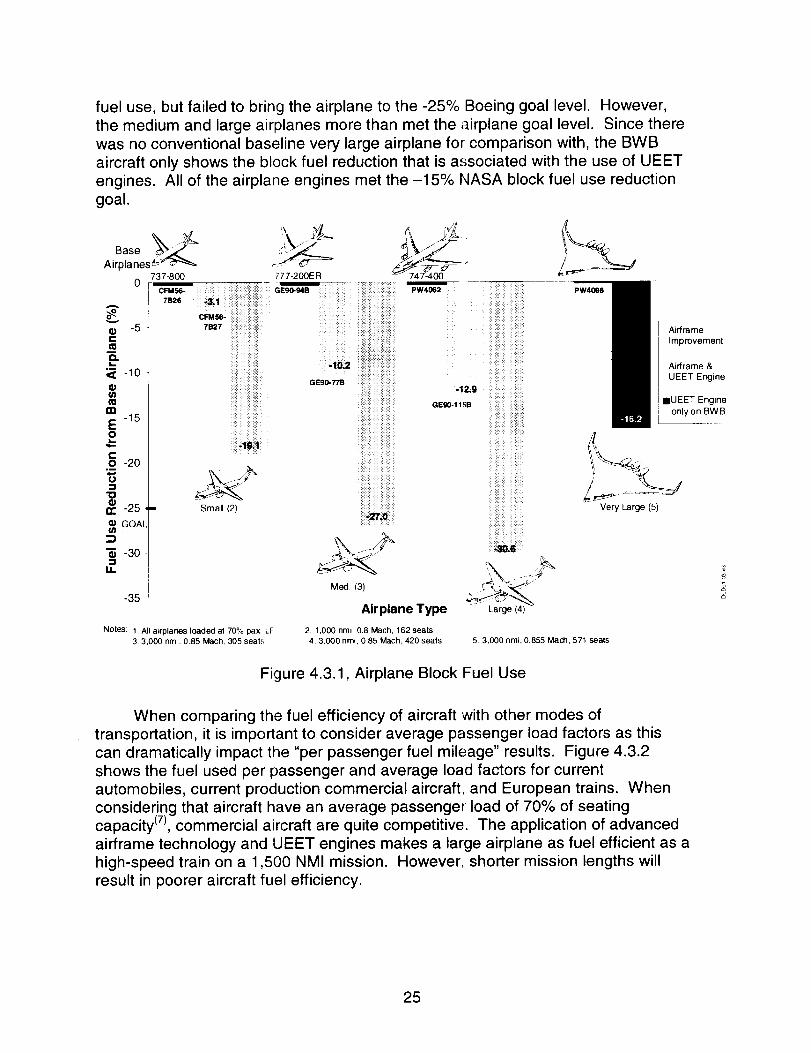
fuel use, but failed to bring the airplane to the -25% Boeing goal level. However,the medium and large airplanes more than met the airplane goal level. Since therewas no conventional baseline very large airplane for comparison with, the BWBaircraft only shows the block fuel reduction that is associated with the use of UEETengines. All of the airplane engines met the -15% NASA block fuel use reductiongoal.
-35'
Notes: 1. All airplanes loaded at 70% pax, LF
3.3,000 nm, 0.85 Mach, 305 seat.';
Med, (3)
Airplane Type Large(4)
PW4098
Airframe
Improvement
2. 1.000 nmi, 0.8 Mach, 162 seats
4.3.000 nmi, 0.85 Mach, 420 seats 5.3.000 nmi. 0.855 Mach, 571 seats
Airframe &
UEET Engine lI
! IUEET Engine ionly on BWBI
Very Large (5)
Figure 4.3.1, Airplane Block Fuel Use
When comparing the fuel efficiency of aircraft with other modes oftransportation, it is important to consider average passenger load factors as this
can dramatically impact the "per passenger fuel mileage" results. Figure 4.3.2
shows the fuel used per passenger and average load factors for current
automobiles, current production commercial aircraft, and European trains. Whenconsidering that aircraft have an average passenger load of 70% of seatingcapacity (7), commercial aircraft are quite competitive. The application of advanced
airframe technology and UEET engines makes a large airplane as fuel efficient as a
high-speed train on a 1,500 NMI mission. However, shorter mission lengths willresult in poorer aircraft fuel efficiency.
25

Large SUV in City __J
Good
IS 1 6 people
per vehicle \
\
"Average" 1996 Vehid e 12_ \
'\, \\\,
Largeplane
• = Typical Load Factors
Figure 4.3.2, UEET enables one of most efficient transportation modes
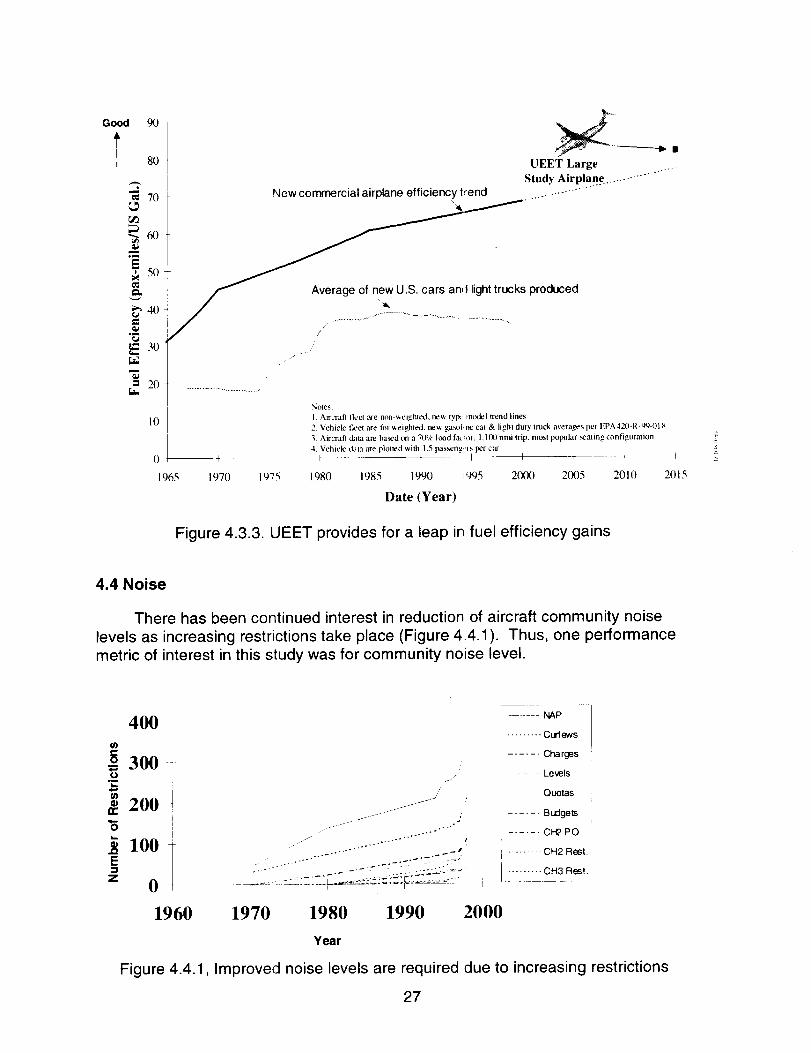
Figure 4.3.3 shows the historical fuel efficiency trend for combined new
automobile and light truck fleets as well as the trend of newly certified commercial
aircraft. The automobile trend line represents the average new fleet's measured
fuel efficiency accounting for make and number of models sold (i.e. weighted) over
time for combined city/highway fuel mileage. The aircraft trend line represents the
calculated average fuel efficiency of each newly certified aircraft (i.e. non-weighted)over time assuming a 1,100 NMI mission length at 70% passenger load factor for
the aircraft's most popular seating configuration (e.g. 305 seats in a 777-200ER tri-class configuration).
The figure shows that since 1965, average Boeing aircraft have had higher
"per passenger" fuel efficiencies than cars and have shown continuous
improvement while the US car and light truck fleet has actually experienced
declines in recent years. This is primarily due to the recent popularity of light trucks
and sport utility vehicles that are bringing the average US fleet fuel efficiency down.In the last 15 years, newly certified commercial aircraft have experienced roughly a
1% per year improvement in fuel efficiency when compared to their predecessoraircraft. If this trend were to continue to the year 2015, the UEET airplane is seen
to achieve better fuel efficiency gains than would otherwise be experienced.
26
Good
T
.-=
80 UEET Large
Study Airplane .................°-
70 New commercial airplane efficiency trend .... ..._ .........\,
50
produced
,.)2o30i ................................:_ ......................./" ................................i:_.....................................................................
Notes:
]0 I. Aircraft fleet are non weighred, nev,. tyF*. m,_det trend lines
2. Vehicle/],.!el are lc, r weighled, new gasohne car & lighl duly lruck averages pel EPA420-R-99-018
I 3. Aircraft data are based on a 70% load fa_ _m. 1,100 nmi Irip, most pop_dar sealing configuration4. Vehicle dala are plotted with 1.5 passen_ "is pet c_u
0 _ + - _ - _ _ -- I t
1965 1970 1975 1980 1985 1990 i995 2000 2005 2010 2015
Date (Year)
Figure 4.3.3. UEET provides for a leap in fuel efficiency gains
4.4 Noise
There has been continued interest in reduction of aircraft community noise
levels as increasing restrictions take place (Figure 4.4.1). Thus, one performancemetric of interest in this study was for community noise level.
400
/,/
f_
/j_J
j lj .......-°'-'°
NAP
......... Curfews
...... Charges
Levels
Quotas ]
...... Budgets
...... CI_ PO
.......... CH2 Rest.I
, i ......... es,.
1960 1970 1980 1990 12000
Year
Figure 4.4.1, Improved noise levels are required due to increasing restrictions
27
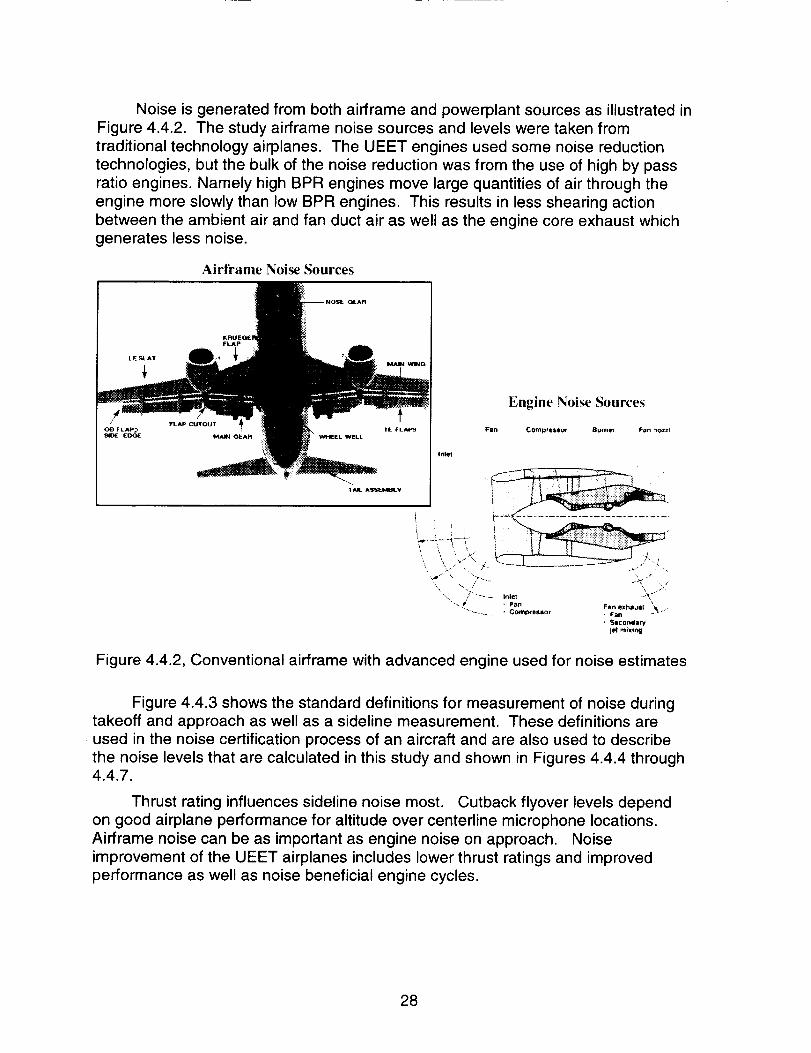
Noise is generated from both airframe and powerplant sources as illustrated in
Figure 4.4.2. The study airframe noise sources and levels were taken from
traditional technology airplanes. The UEET engines used some noise reduction
technologies, but the bulk of the noise reduction was from the use of high by pass
ratio engines. Namely high BPR engines move large quantities of air through the
engine more slowly than low BPR engines. This results in less shearing actionbetween the ambient air and fan duct air as well as the engine core exhaust which
generates less noise.
Airframe Noise Sources
Engine Noise Sources
inlet
Fan Compres$o¢ Burner F_n _Ozzl
Figure 4.4.2, Conventional airframe with advanced engine used for noise estimates
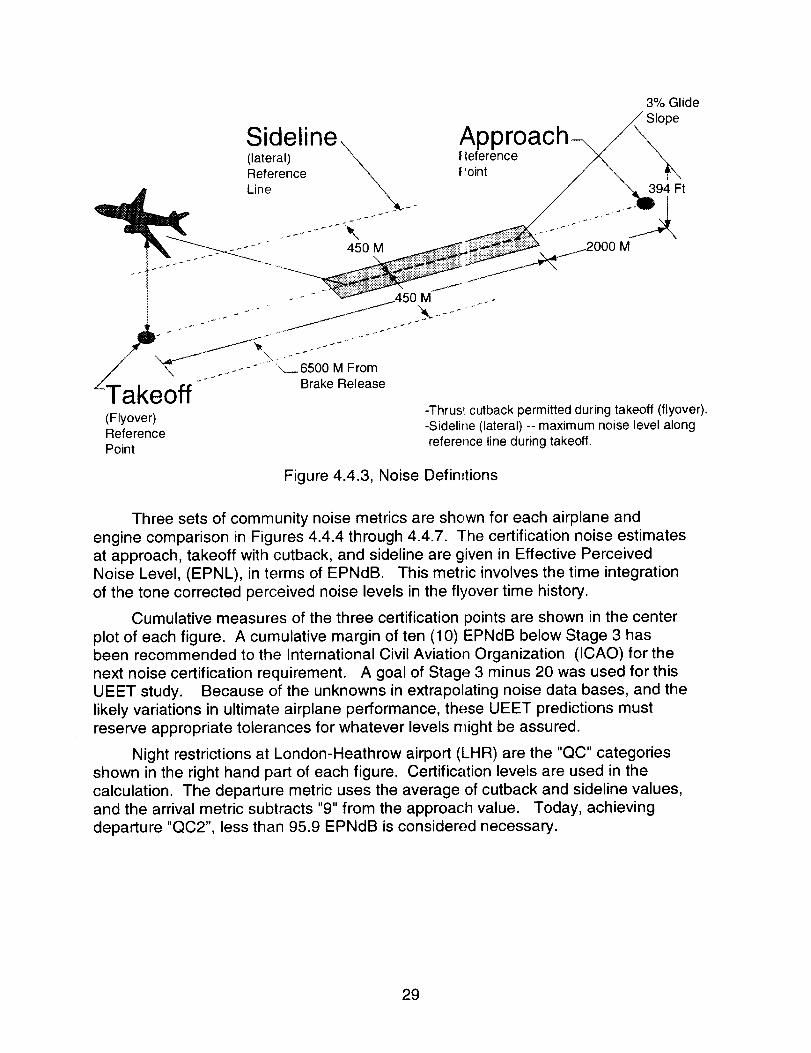
Figure 4.4.3 shows the standard definitions for measurement of noise duringtakeoff and approach as well as a sideline measurement. These definitions are
• used in the noise certification process of an aircraft and are also used to describe
the noise levels that are calculated in this study and shown in Figures 4.4.4 through4.4.7.
Thrust rating influences sideline noise most. Cutback flyover levels dependon good airplane performance for altitude over centerline microphone locations.
Airframe noise can be as important as engine noise on approach. Noise
improvement of the UEET airplanes includes lower thrust ratings and improved
performance as well as noise beneficial engine cycles.
28
3% GlideSlope
Sideline, A
(lateral) _ ,leference
Reference f'ointLine _ 394 Ft
-_ " 450 M M
J"
..... _....A50M _.-
Takeoff-"Z Brake Release
(Flyover) -Thrusl cutback permitted during takeoff (flyover).Reference -Sideline (lateral) -- maximum noise level alongPoint reference line during takeoff.
Figure 4.4.3, Noise DefinItions
Three sets of community noise metrics are shown for each airplane and
engine comparison in Figures 4.4.4 through 4.4.7. fhe certification noise estimates
at approach, takeoff with cutback, and sideline are given in Effective PerceivedNoise Level, (EPNL), in terms of EPNdB. This metric involves the time integration
of the tone corrected perceived noise levels in the flyover time history.
Cumulative measures of the three certification points are shown in the center
plot of each figure. A cumulative margin of ten (10) EPNdB below Stage 3 hasbeen recommended to the International Civil Aviation Organization (ICAO) for the
next noise certification requirement. A goal of Stage 3 minus 20 was used for this
UEET study. Because of the unknowns in extrapolating noise data bases, and the
likely variations in ultimate airplane performance, these UEET predictions must
reserve appropriate tolerances for whatever levels might be assured.
Night restrictions at London-Heathrow airport (LHR) are the "QC" categories
shown in the right hand part of each figure. Certification levels are used in the
calculation. The departure metric uses the average of cutback and sideline values,and the arrival metric subtracts "9" from the approach value. Today, achieving
departure "QC2", less than 95.9 EPNdB is considered necessary.
29
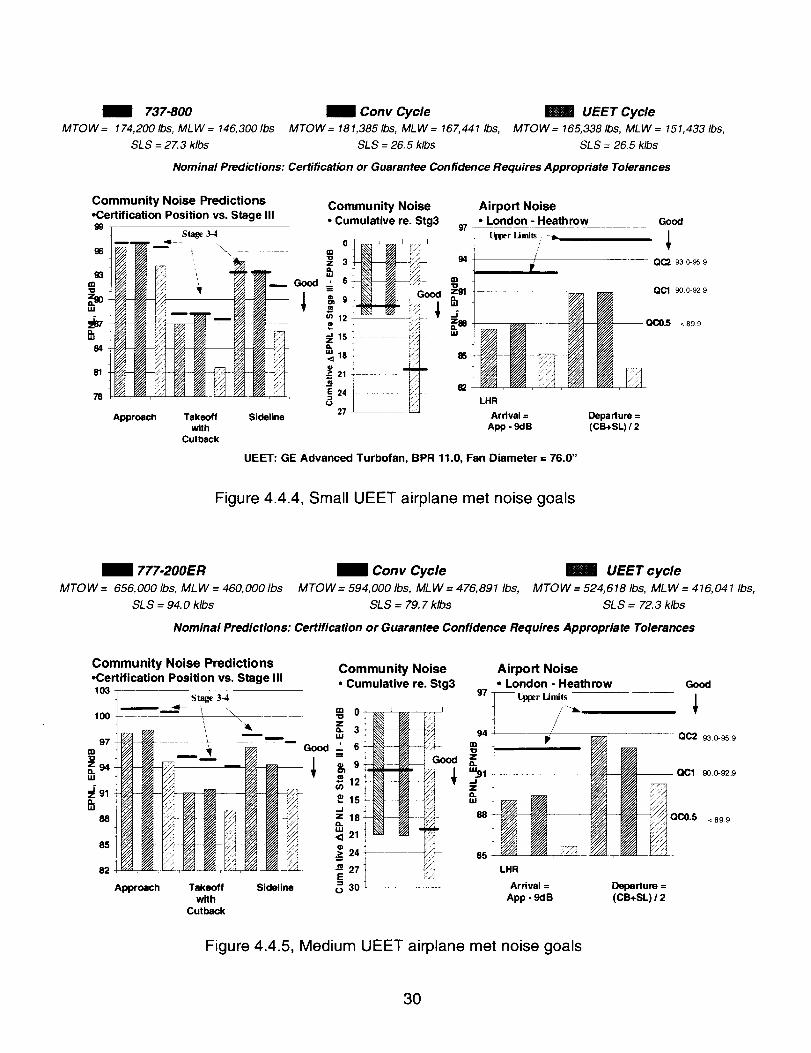
737-800 _ Conv Cycle _ UEET Cycle
MTOW= 174,200/bs, MLW = 146,300/bs MTOW= 181,385 Ibs, MLW= 167,441/bs, MTOW= 165,338 Ibs, MLW = 151,433 Ibs,
SLS = 27.3 klbs SLS = 26.5 k/bs SLS = 26.5 klbs
Nominal Predictions: Certification or Guarantee Confidence Requires Appropriate Tolerances
Community Noise Predictions•Certification Position vs. Stage IIIg9
96
g3m13
uJ
84
81
78
Community Noise• Cumulative re. Stg3
I Stage 3-4
Approach Takeoffwith
Cutback
Airport Noise° London - Heathrow Good
97_Upper IJmits ,'_h. |
/
/'
_ _ 93.0_ 95.9/
_1_1_ OC'I 90.0-92,9
Z{l_ -- QCO.5 < 89,9
85
_o
LHR
Ardval= Departure =
App - 9dB (CB+SL) / 2
UEET: GE Advanced Turbofan, BPR 11.0, Fan Diameter = 76.0"
Figure 4.4.4, Small UEET airplane met noise goals
777-200ER _ Conv Cycle _ UEET cycleMTOW= 656,0001bs, MLW=460,OOOIbs MTOW=594,0001bs, MLW=476,8911bs, MTOW=524,6181bs, MLW=416,0411bs,
SLS = 94.0 klbs SLS = 79.7 klbs SLS = 72.3 klbs
Nominal Predictions: Certification or Guarantee Confidence Requires Appropriate Tolerances
Community Noise Predictions•Certification Position vs. Stage III103
100
m 97
W
m
85
82
Stage 3-4
m _ \ _ 0
_i_!_ _ v .
E
Approach Takeoff Sideline t_ 30with
Cutback
Community Noise Airport Noise• Cumulative re. Stg3 • London - Heathrow Good
97 -- _r Limits
/
m94 i p_
88 _ QCO.5 <89.9
. Arrival = Departure =
App - 9dB (CB+SL) 12
Figure 4.4.5, Medium UEET airplane met noise goals
3O
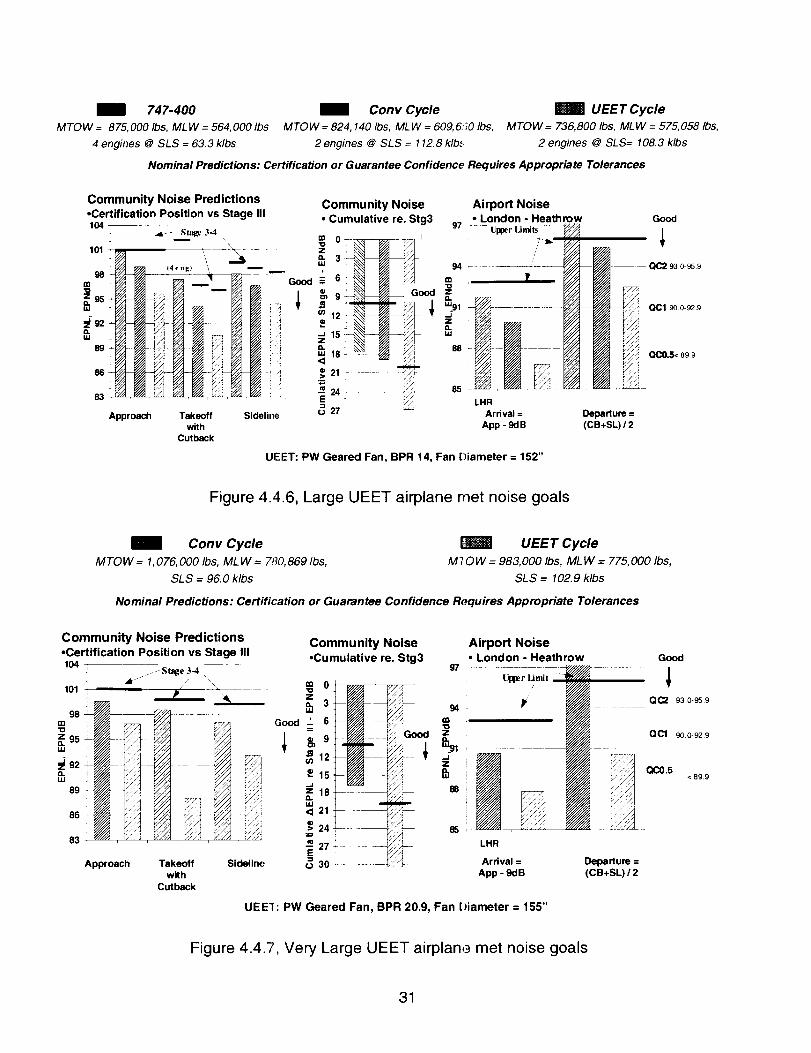
747-400 l Conv Cycle _ UEET Cycle
MTOW = 875,000 Ibs, MLW = 564,000 Ibs MTOW = 824,140 Ibs, MLW = 609,650 Ibs, MTOW = 736,800 Ibs, MLW = 575,058 Ibs,
4 engines @ SLS = 63.3 klbs 2 engines @ SLS = 112.8 klb,_; 2 engines @ SLS= 108.3 klbs
Nominal Predictions: Certification or Guarantee Confidence Requires Appropriate Tolerances
101
98mIo
=_86uJ
D.ill
89
Community Noise Predictions Community Noise•Certification Position vs Stage III • Cumulative re. Stg3104
Takeoffwith
Cutback
86
83
Approach Sideline
97
94 *
"o
.=
88 ......
LHRArrival =
App - 9d B
Airport Noise• London - Heathrow Good
I_11_r Limits I_
Departure =(CB+SL) ! 2
UEET: PW Geared Fan, BPR 14, Fan Diameter = 152"
Figure 4.4.6, Large UEET airplane met noise goals
Conv Cycle UEET Cycle
MTOW = 1,076,000 Ibs, MLW = 780,869 Ibs, M70W = 983,000 Ibs, MLW = 775,000 Ibs,
SLS = 96.0 klbs SLS = 102.9 klbs
Nominal Predictions: Certification or Guarantee Confidence Requires Appropriate Tolerances
Community Noise Predictions•Certification Position vs Stage III
104 _ ,_ .._ Stage 3-4 ,
101 _ / - _ •
----///
z_ 95 -- --
y._-/.....
83 ...........
Approach Takeoff Sidelinewith
Cutback
Good
Community Noise•Cumulative re. Stg3
Airport Noise• London - Heathrow Good
97 ---- UpperLindt _
®941 _"" _ oc2 9a0-9_.9
_._:_1 _ _ 0Cl 90.0-92.9
_1 0C0.5 < 89.9
LHR
Arrival = Departure =
App - 9dB (CB+SL) / 2
UEET: PW Geared Fan, BPR 20.9, Fan Diameter = 155"
Figure 4.4.7, Very Large UEET airplane met noise goals
31

Only general aspects of the engine and nacelle configuration and design were
considered for community noise estimates in this phase. The very high bypass
ratio and some unique turbomachinery operating points are outside the
conventional engine noise database. As major noise sources such as jet noise isreduced, the acoustic design features for secondary noise sources become more
important.
4.5 Emissions
One of the objectives of the study was to achieve lower NOx emissions whilealso decreasing fuel use. The burning of fossil fuels produces CO2, which is also a
gaseous emission. For jet fuel, a direct relationship exists between the amount of
fuel burned and the amount of CO2 and water vapor generated. For every pound of
jet A fuel burned, 3.16 pounds of CO2 and 1.24 pounds of water are generated as
illustrated in Figure 4.5.1. Thus, the amount of CO2 generated is a function of theamount of fuel consumed and the amount of carbon atoms in the fuel's molecular
makeup. Low emissions combustor designs exhibit nearly 100% combustionefficiency and are able to reduce other emissions, but they are unable to reduce
CO2 because this is a fuel phenomenon.
C 12.5H 24.1
mJet A
0 2
+ 3.40 lb.H20
1.24 lb.
Figure 4.5.1,002 is an efficient byproduct of combustion
Recently, there has been increasing emphasis on reducing CO2 emissions
because they have been suggested to be responsible for an increase in globalwarming. Thus, part of this study emphasizes the reduction in CO2 emissions (fuel
use).
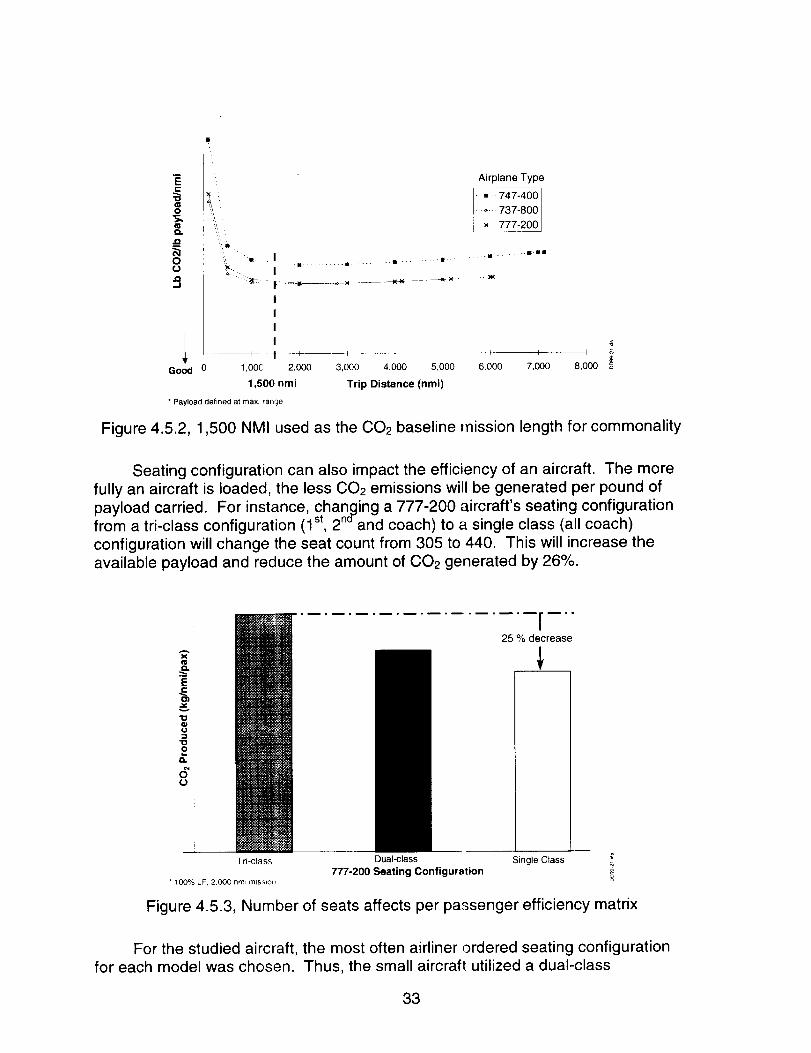
In order to evaluate the absolute amount of CO2 emissions reduction, some
airplane performance guidelines need to be understood. The absolute amount of
CO2 generated increases with the aircraft mission length; it also increases with the
amount of payload carried. Thus, when considering payload and mission length, it
can be seen in Figure 4.5.2 that the study aircraft have a similar efficiency trend
wherein mission lengths in the 1,500-3,000 NMI range are the most efficient. A1,500 NMI mission length was used as the standard comparison point. In the past,
this has allowed comparison of aircraft with shorter ranges.
32
t-
o
12.
o_j.,Q...I
!
4 ,,k . I_. i
I
II
I-- ÷ | --_ I-
1,00C 2,000 3,000
1,500 nmi
Airplane Type
I n 747-400i 737-800
i _ 777-fl00
.... • ........ u. nail
.... ÷- I
4,000 5,000 6,000 7,000
Trip Distance (nmi)
8,000
• Payload defined at max. ran :_e
Figure 4.5.2, 1,500 NMI used as the C02 baseline mission length for commonality
Seating configuration can also impact the efficiency of an aircraft. The more
fully an aircraft is loaded, the less CO2 emissions will be generated per pound of
payload carried. For instance, changing a 777-200 aircraft's seating configurationfrom a tri-class configuration (1 st, 2n°and coach) to a single class (all coach)
configuration will change the seat count from 305 to 440. This will increase theavailable payload and reduce the amount of CO2 generated by 26%.
AX
Q.
EI::
-i"O
o
(J
25%decrease
¥
Tri-ctass Dual-class Single Ctass _
777-200 Seating Configuration• 100% LF, 2,000 nml mis:_lor,
Figure 4.5.3, Number of seats affects per pa.,_senger efficiency matrix
For the studied aircraft, the most often airliner ordered seating configuration
for each model was chosen. Thus, the small aircraft utilized a dual-class
33
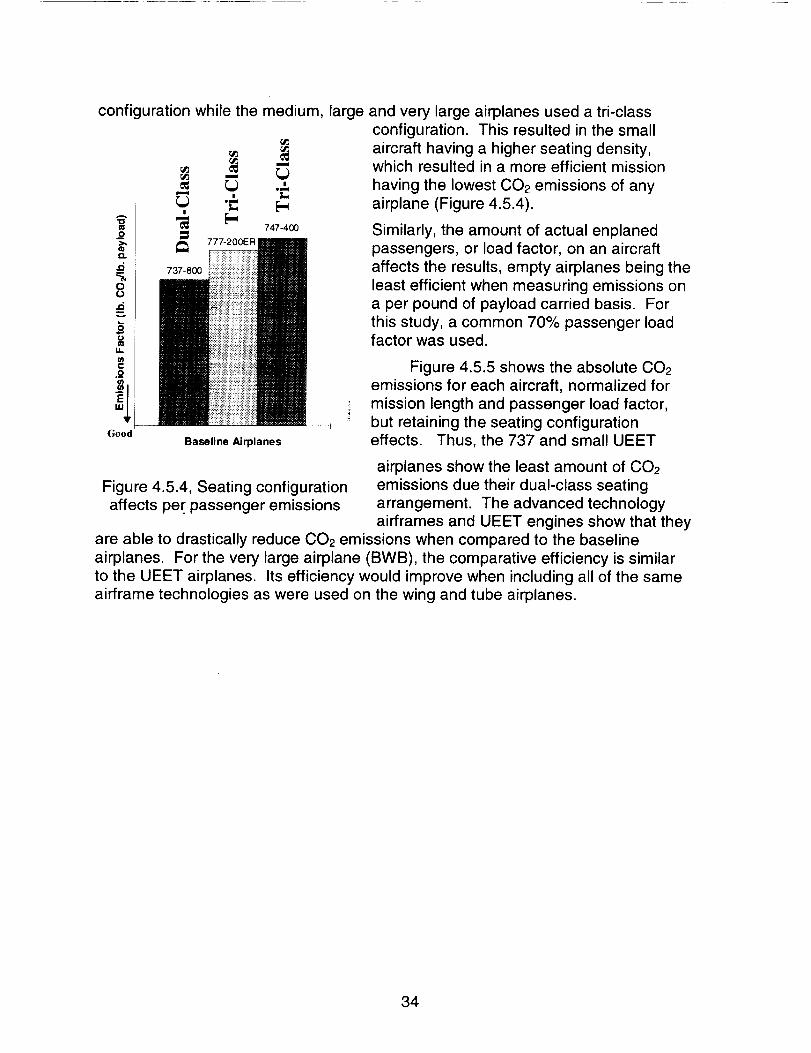
configuration while the medium, large and very large airplanes used a tri-class
737-800
777-200ER
"o
o>,
O.
.0
0U
.0m
t,,}mI.L
C.o
Good
configuration• This resulted in the small
aircraft having a higher seating density,which resulted in a more efficient mission
having the lowest C02 emissions of any
airplane (Figure 4.5.4).
Similarly, the amount of actual enplanedpassengers, or load factor, on an aircraft
affects the results, empty airplanes being the
least efficient when measuring emissions on
a per pound of payload carried basis. For
this study, a common 70% passenger loadfactor was used.
Baseline Airplanes
Figure 4.5.5 shows the absolute 002
emissions for each aircraft, normalized for
mission length and passenger load factor,
but retaining the seating configurationeffects. Thus, the 737 and small UEET
airplanes show the least amount of 002
Figure 4.5.4, Seating configuration emissions due their dual-class seatingaffects per passenger emissions arrangement. The advanced technology
airframes and UEET engines show that theyare able to drastically reduce C02 emissions when compared to the baseline
airplanes. For the very large airplane (BWB), the comparative efficiency is similar
to the UEET airplanes. Its efficiency would improve when including all of the sameairframe technologies as were used on the wing and tube airplanes.
34

Good
A
"1om0
ma.
o0
0
14.
t-O
om
w
747-400
777-200ER
737-800 (3)
with
current
technology
engines
Baseline Airplanes (1_,(z) UEET Airplanes {I). (2)
Notes:l. Loaded at 70% passenger _oad facto_ at each airplane's mosl popular seatin_ configuration
2_ Flown at optimum profile for 1,500 nmi Mission
3. Lower emissions factor is clue to dual class seating vs. tri-class on other 3 air planes
4. Current confouration (does not include many UEET airframe technologies)
Figure 4.5.5, UEET enables large reductions in 002 emissions
Although aircraft are calculated to typically produce less total emissions than
cars at airports, airplane Oxides of Nitrogen (NOx) emissions are under scrutinydue to their relative contribution amount (Figure 4.5.6). Aircraft produce larger
amounts of NOx than Hydrocarbon (HC) or Carbon Monoxide (CO) emissions due
to their high power operation during takeoff. Surface vehicles (e.g. cars) arecalculated to produce larger amounts of CO and HC because of the many idling
automobiles waiting to drop off or pick up passengers at the airport.
35

8O 7
70
v
t-
Ooi
°_
P,
t-o
.__E
6O
50
4O
3O
2O
10
0
HC
i
! i co
Airplane
I
i{ I
* Boeing Estimated for 1992 at SeaTac using EDMS
GSE Car
Source
_
Parking
Figure 4.5.6, NOx is the Airplane Emission of Focus at Airports
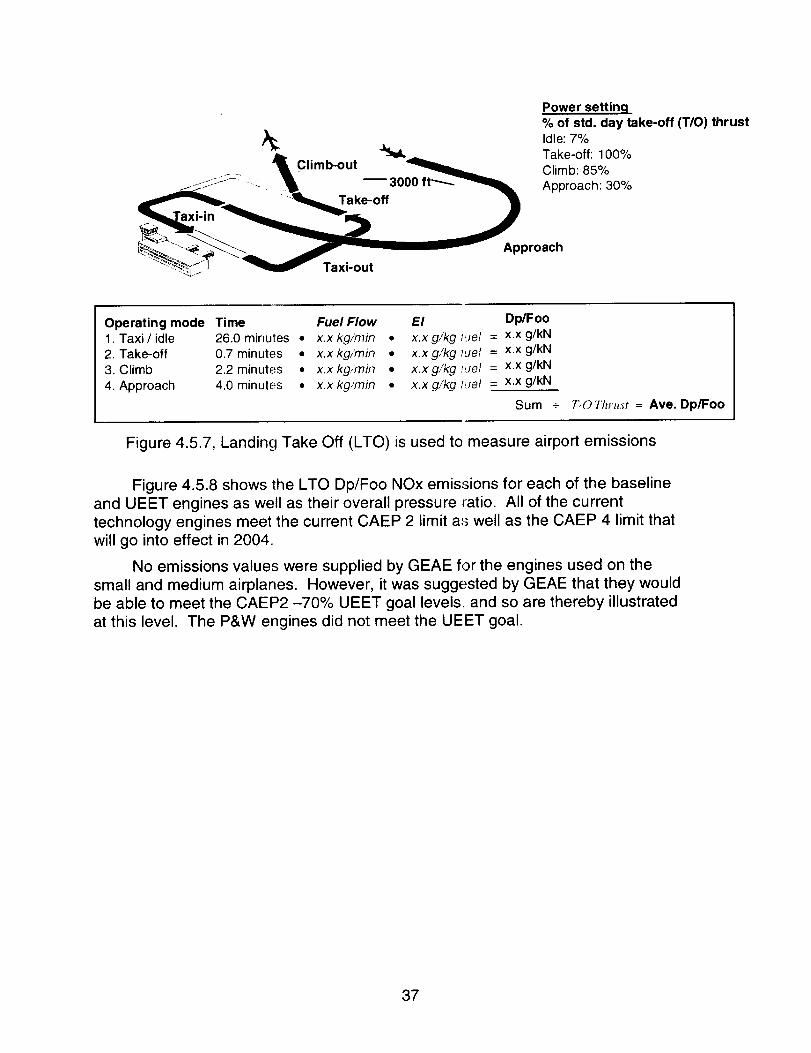
The standard method of calculating airport emissions for aircraft is theLanding Take Off (LTO) cycle (8). Established times in modes are set for each
operating condition (idle, taxi, takeoff and approach). The fuel flow (kg./min.) and
emissions index (grams of emission per kg of fuel consumed) at each operatingcondition is measured during the certification process of the engine model.Summing up these values and dividing by the engine's SLS takeoff thrust producesa result titled "Dp/Foo". This is used in evaluating the UEET emissions result.
36
Power setting
% of std. day take-off (T/O) thrust
/_ Idle: 7%• b . J_ Take-off: 100%
_/- .... . "_ Cl'mb'°ut _ Climb: 85%__S_ t .... :__: _,, _ 3000 ft_ _ Approach: 30%
'_ Take-off 11,
j' Taxi-out
Operating mode Time Fuel Flow El Dp/Foo1. Taxi/idle 26.0 minutes , x.xkg/min ° x.xg/'kg iuel = x.x g/kN
2. Take-off 0.7 minutes • x.xkg/min ° x.xg/kg y,Jel = x.x g/kN
3. Climb 2.2 minutes • x.xkg/min • x.xg/kg luel = x.x g/kN
4. Approach 4.0 minutes • x.x kg,'min • x.x g/kg me/ = x.x g/kN
Sum + 7",0 77u,._t = Ave. Dp/Foo
Figure 4.5.7, Landing Take Off (LTO) is used to measure airport emissions
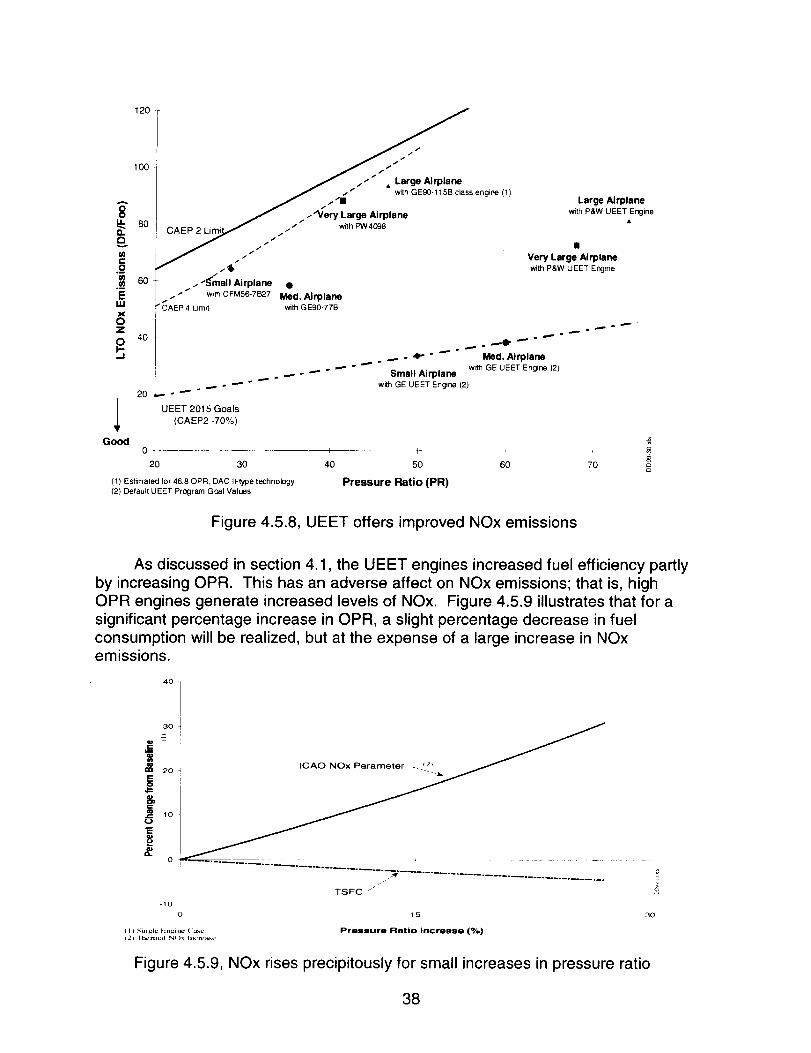
Figure 4.5.8 shows the LTO Dp/Foo NOx emissions for each of the baseline
and UEET engines as well as their overall pressure ratio. All of the current
technology engines meet the current CAEP 2 limit as well as the CAEP 4 limit that
will go into effect in 2004.
No emissions values were supplied by GEAE for the engines used on the
small and medium airplanes. However, it was suggested by GEAE that they wouldbe able to meet the CAEP2 -70% UEET goal levels, and so are thereby illustrated
at this level. The P&W engines did not meet the UEET goal.
37
A
8
o.Qv
u}c.o.!E
uJxoz
oI-,_1
Good
IO01.oJ ,, ,, ,1_ I - wrlhGEg0-115B class engine (1)
. ,-'3/ery Large Airplane
80 CAEP_ ,...,,-"""_ - with I_W4098
I 1 1
J ,.i"""
"_ .-_mall Airplane •60
.. _ _ w,_ CFM56qB27 Med. Airplane"" _AEP 4 Limit with GE90-77B
4O
I
20' "_':G':_UEET 201 oa
/ (CAEP2 -70%)
0_
20 30
Large Airplanewith P&W UEET Engine
Very Large Airplanewith P&W UEET Engine
(1) Est.'hated for 46.80PR, DAC II-type technology
(2) Default UEET Program Goal Values
..... °
..-- . .... 4- " Med. Airplane.-," " w_ GE UEET Engine (2)
.... - "" " Small Airplanewith GE UEET En_ne (2)
I
4O 50 60 70
Pressure Ratio (PR)
Figure 4.5.8, UEET offers improved NOx emissions
As discussed in section 4.1, the UEET engines increased fuel efficiency partlyby increasing OPR. This has an adverse affect on NOx emissions; that is, highOPR engines generate increased levels of NOx. Figure 4.5.9 illustrates that for asignificant percentage increase in OPR, a slight percentage decrease in fuelconsumption will be realized, but at the expense of a large increase in NOxemissions.
4O
i3O
J,.=
_j lO
Io
,.JTSFC " ,_
-1o -
o 1 5 30
( I __;i._l_.li._.i,_ (:_.c Pressure Ratio Increase (%)(2) ll_'nn;ll N( )x Iil_-n.-_L_c
Figure 4.5.9, NOx rises precipitously for small increases in pressure ratio
38
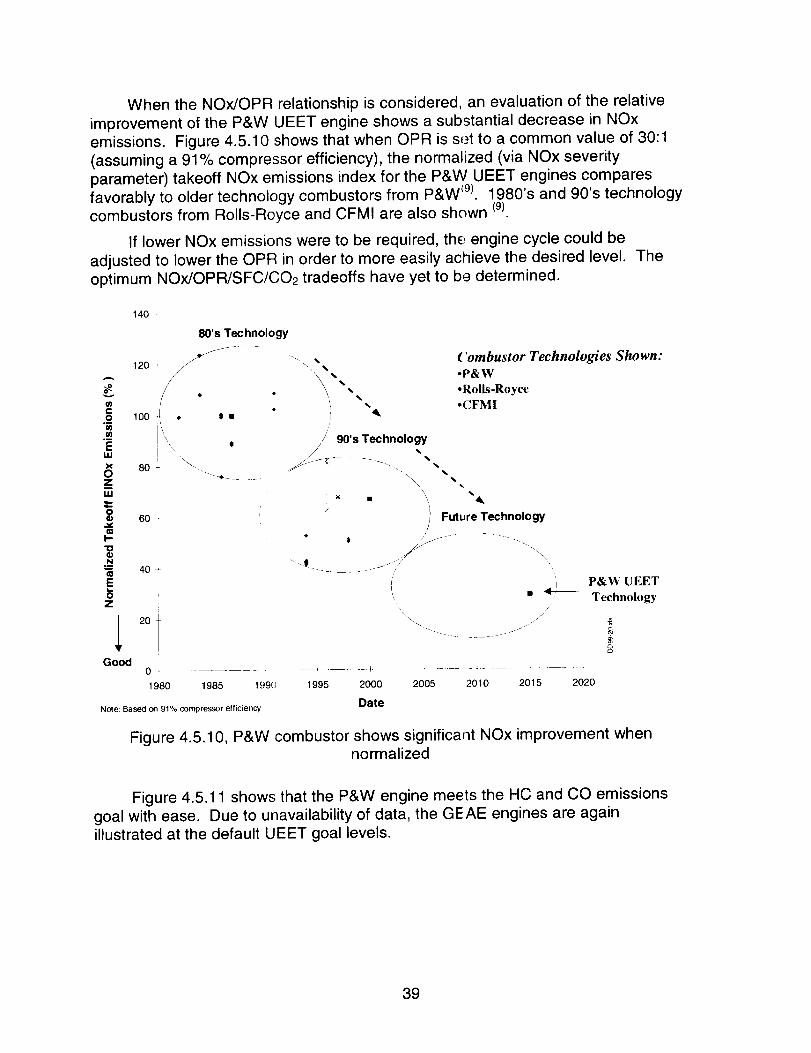
When the NOx/OPR relationship is considered, an evaluation of the relative
improvement of the P&W UEET engine shows a substantial decrease in NOx
emissions. Figure 4.5.10 shows that when OPR is set to a common value of 30:1
(assuming a 91% compressor efficiency), the normalized (via NOx severity
parameter) takeoff NOx emissions index for the P&W UEET engines comparesfavorably to older technology combustors from P&W _9). 1980's and 90's technology
combustors from Rolls-Royce and CFMI are also shown (9)
If lower NOx emissions were to be required, the engine cycle could be
adjusted to lower the OPR in order to more easily achieve the desired level. The
optimum NOx/OPR/SFC/CO2 tradeoffs have yet to be determined.
A
CO
.I
EI,I,JX
oZi
8m
I--"ID
N
t_
E
Z
Good
140 -
120
100 ,!
80's Tec hnology
'\ %\ %
• ° \
. '/. $ •
80 - \-..
Ii "
60 _ ,I
40_
i
04
1980 1985 199_
Note: Based on 91% compressor efficiency
%
%
4k
/90's Technology
/./ %
\ _, • \ %
Future Technology/
\ _! _/ x
!I .r P&W UEETq_
' ,,, Technology
('ombustorTechnologies Shown:.P&W
.Rolls-Royce
.CFMI
1995 2000 2005 2010 2015 2020
Date
Figure 4.5.10, P&W combustor shows significant NOx improvement whennormalized
Figure 4.5.11 shows that the P&W engine meets the HC and CO emissionsgoal with ease. Due to unavailability of data, the GEAE engines are again
illustrated at the default UEET goal levels.
39

Smallwith GE TurboFan *
* GE Engines shown at default UEET goal levels
UEET Emissions Goal Level
Mediumwith GE TurboFan °
T
Large Very Largew_th P&W Geared Fan with P&W Geared Fan
UEET Airplane
Figure 4.5.11, HC and CO emissions met goal levels
40

5.0 CONCLUSIONS AND RECOMMENDATIONS
In conclusion, the small, medium and large aircraft with advanced airframe
technology and UEET powerplants achieved better block fuel burn reductions than
the Boeing goal (-25% from baseline airplanes). The small aircraft did not meet thegoal due to increases in aircraft speed and passenger comfort levels. All engines
achieved the NASA goal of -15% block fuel improvement.
All of the aircraft met the Boeing airplane Noise goals of Chapter 3 minus20dB cumulative.
The Pratt & Whitney engines met the HC and CO emissions goals, but did notmeet the NOx goals. This is partly due to the tradeoffs associated with very high-
pressure ratio engines. An emissions assessment was not possible for the GEAE
engines due to unavailability of data.
Commercia/ization of UEET powerp/ants witl enable the production of morefuel-efficient future commercial aircraft than would otherwise occur.
It is recommended to conduct an engine sizing tradeoff study to find the
optimal design conditions for each of the two UEET architectures that are employedby Pratt and Whitney and GEAE. This will enable airframe manufacturers, and
engine companies, to focus on the development of optimally sized engines and
appropriate airframe configurations. Once engine sizing tradeoff studies areconcluded, the benefits of engine installation on low-wing versus high-wing aircraft
can be evaluated. Thus, an optimally designed engine may drive airframe
configuration.
Efficient engines are only half the fuel efficiency solution. Airframe technology
must also be developed. It is recommended to select the best engine and airframeconfiguration(s) for further development of high-risk, high-payoff technologies.
41
REFERENCES
1. Zucrow, M.J. Jet Propulsion and Gas Turbines, John Wiley & Sons, 1948.
2. Anderson, J. D. Introduction to Flight, McGraw-Hill, 1978.
3. Lefebvre, A. H. Gas Turbine Combustion, Taylor & Francis, 1999.
4. Rolls-Royce plc, The Jet Engine, 1986.
5. Padilla, C.E. Optimizing Jet Transport Efficiency, McGraw-Hill, 1996.
6. Freitas, J.M., Daggett, D.L., et. al. Emissions Optimized Transport AirplaneStudy, Boeing report BA000-M98-038AD, November 1998.
7. Daggett, D.L., et. al. An Evaluation of Aircraft Emissions Inventory Methodologyby Comparisons with Reported Airline Data, NASA CR-1999-209480.
8. International Civil Aviation Organization (ICAO), International Standards andRecommended Practices, Environmental Protection, Annex 16 to the Convention
on International Civil Aviation, Volume II, Aircraft Engine Emissions, 2nd Edition,Montreal 1993
9. International Civil Aviation Organization (ICAO), ICAO Engine Exhaust
Emissions Data Bank, 1st Internet Edition, http://www.qinetiq.com/aviation-emissions-databank, 2000.
42

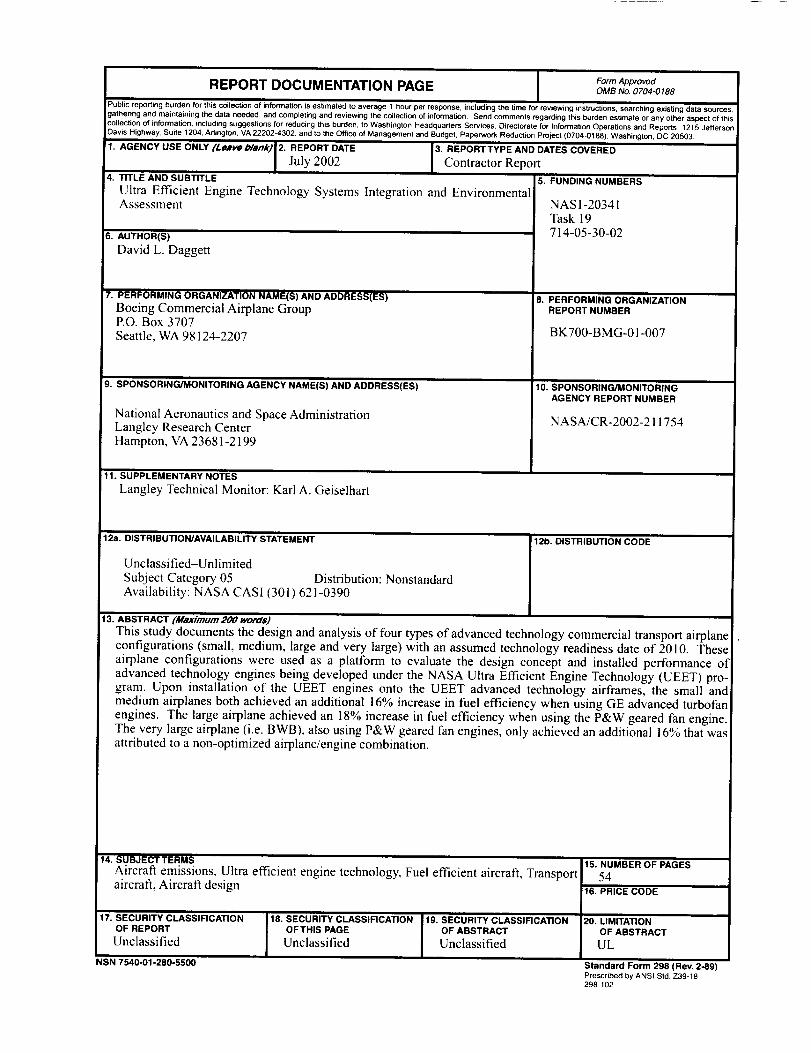
Form ApprovedREPORT DOCUMENTATION PAGE OMBNO.0704-0188
Public reporting burden for this collection of information is estimated to average I hour per response, including the time for reviewing instructions, searching existing data sourcesgathering and maintaining the data needed, and completing and reviewing the collection of information Send comments regarding this burden estimate or any other aspect of thi_collection of information, inCluding suggestions for reducing this burden, to Washington Headquarters Services, Directorate for Information Operations and Reports, 1215 JeffersorDavis Highway, Suite 1204, Adington, VA 222024302, and to the Office of Management and Budget, Paperwork Reduction Project (0704-0188), Washington, DC 20503.
1. AGENCY USE ONLY (Leaveblank)12. REPORT DATE 3. REPORTTYPE AND DATES COVERED
I July 2002 Contractor Report
4. TITLE AND SUBTITLE 5. FUNDING NUMBERS
Ultra Efficient Engine Technology Systems Integration and EnvironmentalAssessment
6. AUTHOR(S)
David L. Daggett
7. PERFORMING ORGANIZATION NAME(S) AND ADDRESS(ES)
Boeing Commercial Airplane GroupP.O. Box 3707Seattle, WA 98124-2207
9. SPONSORING/MONITORING AGENCY NAME(S) AND ADDRESS(ES)
National Aeronautics and Space AdministrationLangley Research CenterHampton, VA 23681-2199
11. SUPPLEMENTARY NOTES
Langley Technical Monitor: Karl A. Geiselhart
NAS1-20341Task 19714-05-30-02
8. PERFORMING ORGANIZATION
REPORT NUMBER
BK700-BMG-01-007
10. SPONSORING/MONITORING
AGENCY REPORT NUMBER
NASA/CR-2002-211754
12a. DISTRIBUTION/AVAILABILITY STATEMENT
Unclassified-Unlimited
Subject Category 05 Distribution: NonstandardAvailability: NASA CASI (301) 621-0390
12b. DISTRIBUTION CODE
13. ABSTRACT (Maximum 200 words)
This study documents the design and analysis of four types of advanced technology commercial transport airplaneconfigurations (small, medium, large and very large) with an assumed technology readiness date of 2010. Theseairplane configurations were used as a platform to evaluate the design concept and installed performance ofadvanced technology engines being developed under the NASA Ultra Efficient Engine Technology (UEET) pro-gram. Upon installation of the UEET engines onto the UEET advanced technology airframes, the small andmedium airplanes both achieved an additional 16% increase in fuel efficiency when using GE advanced turbofanengines. The large airplane achieved an 18% increase in fuel efficiency when using the P&W geared fan engine.The very large airplane (i.e. BWB), also using P&W geared fan engines, only achieved an additional 16% that wasattributed to a non-optimized airplane/engine combination.
14. SUBJECT TERMS
Aircraft emissions, Ultra efficient engine technology, Fuel efficient aircrat_, Transportaircraft, Aircraft design
17. SECURITY CLASSIFICATIONOF REPORT
Unclassified
NSN 7540-01-280-5500
18. SECURITY CLASSIFICATION
OFTHIS PAGE
Unclassified
19. SECURITY CLASSIFICATION
OF ABSTRACT
Unclassified
15. NUMBER OF PAGES
5416. PRICE CODE
20. LIMITATION
OF ABSTRACT
UL
Standard Form 298 (Rev. 2-89)Prescribed by ANSI Sld. Z39-18298-102