ulm2013 foca report - limnc.epfl.ch · the water vapour content can be also measured through...
TRANSCRIPT
1
Léman-Baikal Project
Annual report 2013
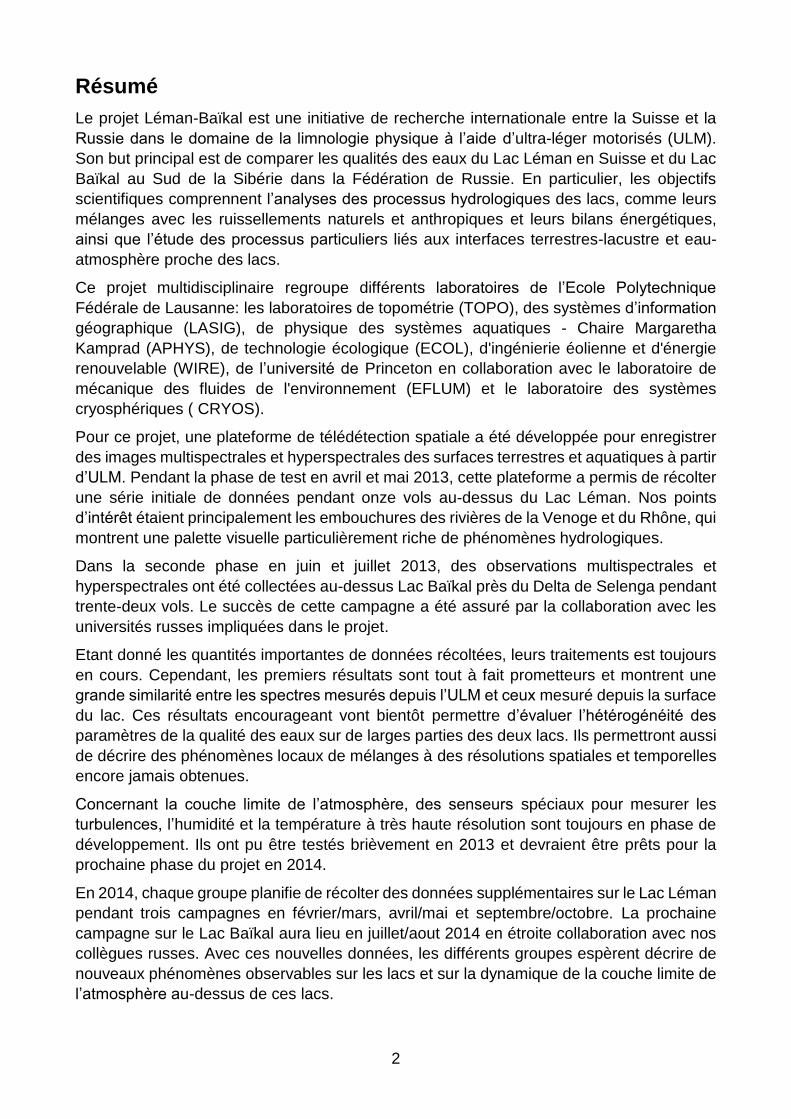
RGB and hyperspectral images of the Venoge (Lake Léman) outflow
Publisher: Ecole Polytechnique Fédérale de Lausanne, Limnology Centre, CH-1015
Lausanne, 21 October 2013
Sponsored by:
Coordinated by: Limnology Centre and
2
Résumé
Le projet Léman-Baïkal est une initiative de recherche internationale entre la Suisse et la
Russie dans le domaine de la limnologie physique à l’aide d’ultra-léger motorisés (ULM).
Son but principal est de comparer les qualités des eaux du Lac Léman en Suisse et du Lac
Baïkal au Sud de la Sibérie dans la Fédération de Russie. En particulier, les objectifs
scientifiques comprennent l’analyses des processus hydrologiques des lacs, comme leurs
mélanges avec les ruissellements naturels et anthropiques et leurs bilans énergétiques,
ainsi que l’étude des processus particuliers liés aux interfaces terrestres-lacustre et eau-
atmosphère proche des lacs.
Ce projet multidisciplinaire regroupe différents laboratoires de l’Ecole Polytechnique
Fédérale de Lausanne: les laboratoires de topométrie (TOPO), des systèmes d’information
géographique (LASIG), de physique des systèmes aquatiques - Chaire Margaretha
Kamprad (APHYS), de technologie écologique (ECOL), d'ingénierie éolienne et d'énergie
renouvelable (WIRE), de l’université de Princeton en collaboration avec le laboratoire de
mécanique des fluides de l'environnement (EFLUM) et le laboratoire des systèmes
cryosphériques ( CRYOS).
Pour ce projet, une plateforme de télédétection spatiale a été développée pour enregistrer
des images multispectrales et hyperspectrales des surfaces terrestres et aquatiques à partir
d’ULM. Pendant la phase de test en avril et mai 2013, cette plateforme a permis de récolter
une série initiale de données pendant onze vols au-dessus du Lac Léman. Nos points
d’intérêt étaient principalement les embouchures des rivières de la Venoge et du Rhône, qui
montrent une palette visuelle particulièrement riche de phénomènes hydrologiques.
Dans la seconde phase en juin et juillet 2013, des observations multispectrales et
hyperspectrales ont été collectées au-dessus Lac Baïkal près du Delta de Selenga pendant
trente-deux vols. Le succès de cette campagne a été assuré par la collaboration avec les
universités russes impliquées dans le projet.
Etant donné les quantités importantes de données récoltées, leurs traitements est toujours
en cours. Cependant, les premiers résultats sont tout à fait prometteurs et montrent une
grande similarité entre les spectres mesurés depuis l’ULM et ceux mesuré depuis la surface
du lac. Ces résultats encourageant vont bientôt permettre d’évaluer l’hétérogénéité des
paramètres de la qualité des eaux sur de larges parties des deux lacs. Ils permettront aussi
de décrire des phénomènes locaux de mélanges à des résolutions spatiales et temporelles
encore jamais obtenues.
Concernant la couche limite de l’atmosphère, des senseurs spéciaux pour mesurer les
turbulences, l’humidité et la température à très haute résolution sont toujours en phase de
développement. Ils ont pu être testés brièvement en 2013 et devraient être prêts pour la
prochaine phase du projet en 2014.
En 2014, chaque groupe planifie de récolter des données supplémentaires sur le Lac Léman
pendant trois campagnes en février/mars, avril/mai et septembre/octobre. La prochaine
campagne sur le Lac Baïkal aura lieu en juillet/aout 2014 en étroite collaboration avec nos
collègues russes. Avec ces nouvelles données, les différents groupes espèrent décrire de
nouveaux phénomènes observables sur les lacs et sur la dynamique de la couche limite de
l’atmosphère au-dessus de ces lacs.
3
Summary
The Léman-Baikal project constitutes an international Swiss-Russian collaborative research
initiative in the field of physical limnology using ultralight aircraft. The primarily aim of the
project is to conduct a comparative study of the functioning of Lakes Léman (Switzerland)
and Baikal (Southern Siberia region of Russian Federation). The scientific objectives of the
project include the analysis of hydrological processes, such as the runoff dynamics of both
natural and anthropogenic origin, lake energy balance, and the study of processes
pertaining to the land-water and air-water interfaces in lakes.
This multidisciplinary project regroups different laboratories within EPFL: Geodetic
Engineering Laboratory (TOPO) / Laboratory of Geographic Information Systems (LASIG),
Physics of Aquatic Systems Laboratory - Margaretha Kamprad Chair (APHYS), Ecological
Engineering Laboratory (ECOL), Wind Engineering and Renewable Energy Laboratory
(WIRE), Princeton University in collaboration with the Environmental Fluid Mechanics and
Hydrology Laboratory (EFLUM) and the Laboratory of Cryospheric Sciences (CRYOS).
For this project, a remote sensing platform was developed to collect multispectral and
hyperspectral observations of both land and water surfaces from ultralight aircraft. During
the test phase in April and May 2013, this platform was used to collect an initial dataset
during a series of flights above Lake Léman. The fights focussed on the mouths the Venoge
and Rhône Rivers, which exhibit a particularly rich range of visually observable
hydrodynamic phenomena.
In the second phase carried out in June and July 2013, multispectral and hyperspectral
observations were collected above Lake Baikal near the Selenga delta during thirty-two
flights. The success of this campaign was ensured by the collaboration of the Russian
universities implicated in the project.
Given the massive dataset, data processing is still underway. However, preliminary results
look promising. They showed a high similarity of the spectra measured from the air and in
situ from the lake surface. These encouraging results will soon allow assessment of the
heterogeneity of water quality parameters on large portions of the two lakes, and to describe
local mixing phenomena at a higher spatial and temporal resolution than ever achieved.
Concerning the atmospheric boundary layer, special sensors to measure turbulence,
humidity and temperature at high resolution are still under development. They could only be
tested briefly in 2013, but will be ready for the next phase of the project in 2014.
In 2014, each group plans to collect additional data on Lake Léman during three campaigns
in February/March, April/May and September/October. Another campaign on Lake Baikal is
planned in July/August 2014 in close collaboration with Russian colleagues. With such a
large dataset, the different groups hope to discover new findings on the limnology of both
lakes as well as on the dynamics of the atmospheric boundary layer above lakes.
4
Table of Content
Résumé ............................................................................................................................... 2
Summary ............................................................................................................................. 3
1. Remote sensing platform – TOPO / LASIG laboratory .................................................. 5
1.1. Methodology ........................................................................................................... 5
1.1.1. Airborne remote sensing platform and operations ............................................ 6
1.1.2. Data acquisition ................................................................................................ 7
1.1.3. Data processing ............................................................................................. 10
1.2. Preliminary results ................................................................................................ 11
2. Thermal images – ECOL Laboratory ........................................................................... 12
2.1. Surface temperatures from remote sensing .......................................................... 13
2.2. Development of equipment and data handling for ground truthing ....................... 14
2.2.1. Catamaran – actual state and next steps ....................................................... 14
2.2.2. Data visualization ........................................................................................... 15
3. Water Quality - Margaretha Kamprad Chair (APHYS) ................................................. 16
3.1. Methodology ......................................................................................................... 17
3.1.1. Summary of ground truthing points ................................................................ 17
3.2. Preliminary results ................................................................................................ 19
3.2.1. Water quality parameters ............................................................................... 19
3.2.2. Comparison of remote sensing and in-situ spectrums ................................... 21
3.3. Perspectives ......................................................................................................... 22
4. Atmospheric Boundary Layer over Lake Léman - WIRE ............................................. 23
4.1. Introduction ........................................................................................................... 23
4.1.1. Experimental setup ........................................................................................ 23
4.2. Field campaign in 2013 ......................................................................................... 24
4.3. Assessment of the existing setup and upgrade for 2014 ...................................... 24
5. Princeton effort in collaboration with EFLUM/CRYOS ................................................. 24
5.1. Objective ............................................................................................................... 24
5.2. Sensor development ............................................................................................. 25
5.3. Outlook and Proposal for 2014 ............................................................................. 26
5
1. Remote sensing platform – TOPO / LASIG laboratory
Dr. Y Akhtman, D Constantin, Prof. B Merminod, Prof. F Golay, M Parkan, M Rehak, Dr. D
Tuia
1.1. Methodology
Over eight months starting in October 2012, we developed and deployed a remote sensing
platform optimised for collection of multispectral and hyperspectral observations of both land
and water surfaces from an ultralight aircraft. The platform is comprised of four cameras,
auxiliary position and orientation sensors, as well as data recording equipment.
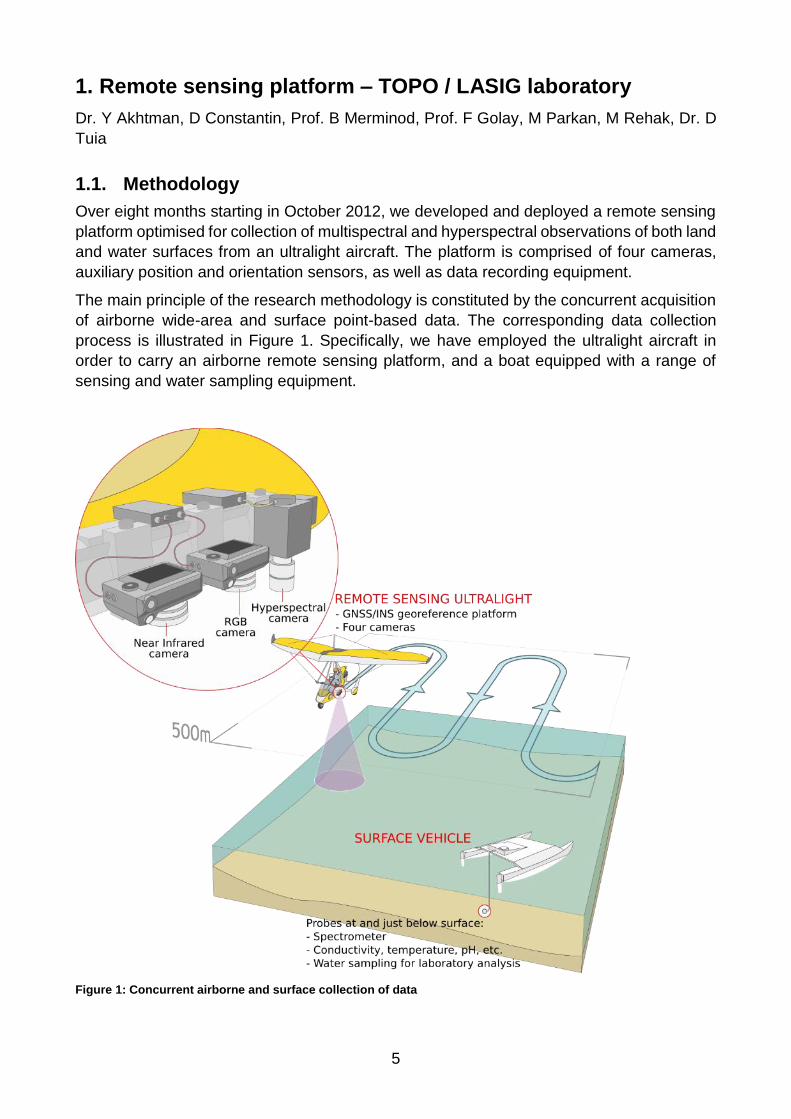
The main principle of the research methodology is constituted by the concurrent acquisition
of airborne wide-area and surface point-based data. The corresponding data collection
process is illustrated in Figure 1. Specifically, we have employed the ultralight aircraft in
order to carry an airborne remote sensing platform, and a boat equipped with a range of
sensing and water sampling equipment.
Figure 1: Concurrent airborne and surface collection of data
6
The surface-based samples, measured in collaboration by APHYS and ECOL laboratories,
are used to produce a detailed characterisation of the water properties at sampling locations.
Additionally, the reflected spectral response of the water surface at each sampling point is
registered. The reflectance properties are correlated with the various water characteristics
and the spectral response-based indicators for the various chemical and biological water
properties are derived. The resultant spectral signature-based indicators are subsequently
utilised in order to derive a wide-area maps of water properties using the multispectral and
hyperspectral data collected with the use of the airborne remote sensing platform.
In this context, the concurrent airborne and surface based data acquisition is essential for
the sake of calibration of the airborne data, as well as the data quality and the
methodological accuracy analysis.
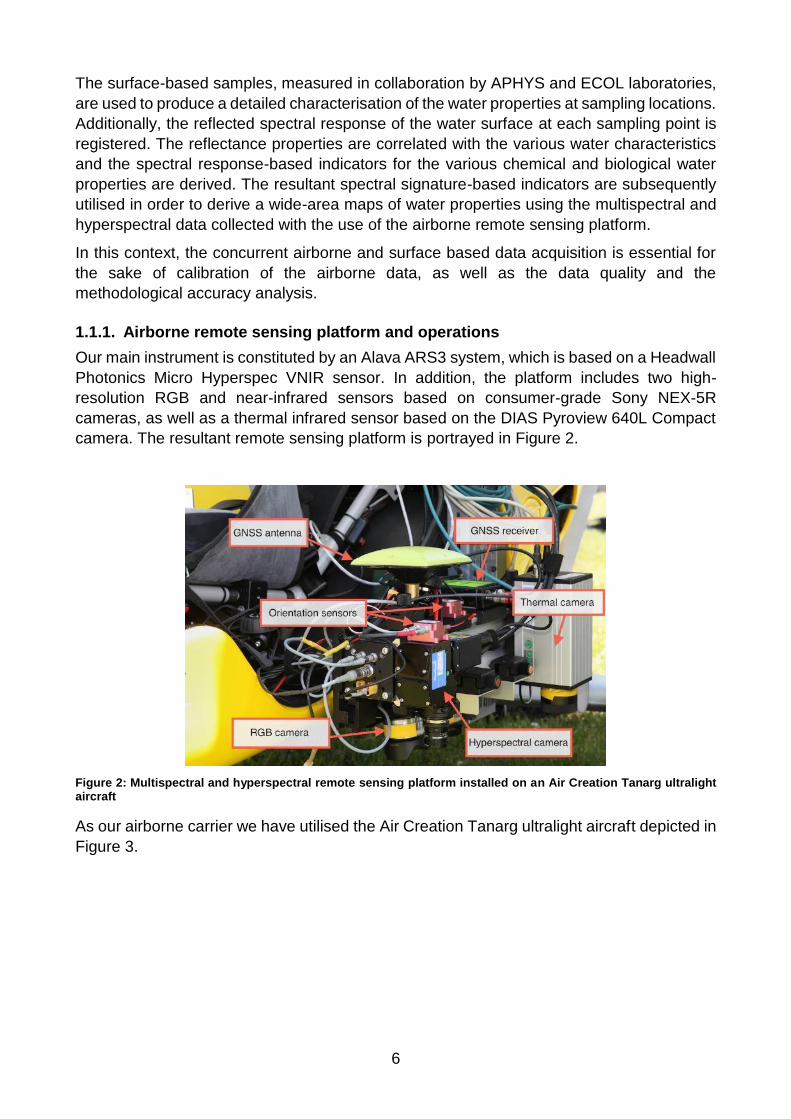
1.1.1. Airborne remote sensing platform and operations
Our main instrument is constituted by an Alava ARS3 system, which is based on a Headwall
Photonics Micro Hyperspec VNIR sensor. In addition, the platform includes two high-
resolution RGB and near-infrared sensors based on consumer-grade Sony NEX-5R
cameras, as well as a thermal infrared sensor based on the DIAS Pyroview 640L Compact
camera. The resultant remote sensing platform is portrayed in Figure 2.
Figure 2: Multispectral and hyperspectral remote sensing platform installed on an Air Creation Tanarg ultralight aircraft
As our airborne carrier we have utilised the Air Creation Tanarg ultralight aircraft depicted in
Figure 3.

7
Figure 3: Air Creation Tanarg 912S ultralight aircraft with the remote sensing platform installed
1.1.2. Data acquisition
The field campaign resulted in the collection of the total of around 7 Terabytes of airborne
remote sensing data covering the area in excess of 2000 km2, including more than 100 in
situ sampling sites.
The entire field campaign spanning both Lake Léman and Lake Baikal phases included over
83 hours of flight having an accumulate flight trajectory length in excess of 7,700 km. In
particular, the data collected to date is comprised by 580,000 airborne images and nearly
15,000,000 hyperspectral scan lines.
Lake Léman phase
During the stage of the system development, as well as during the collection of the initial
data, we conducted a series of flights in the area of Lake Léman. Our initial points of interest
included the mouths of the Venoge and Rhône Rivers, which exhibit a particularly rich range
of visually observable hydrological phenomena.
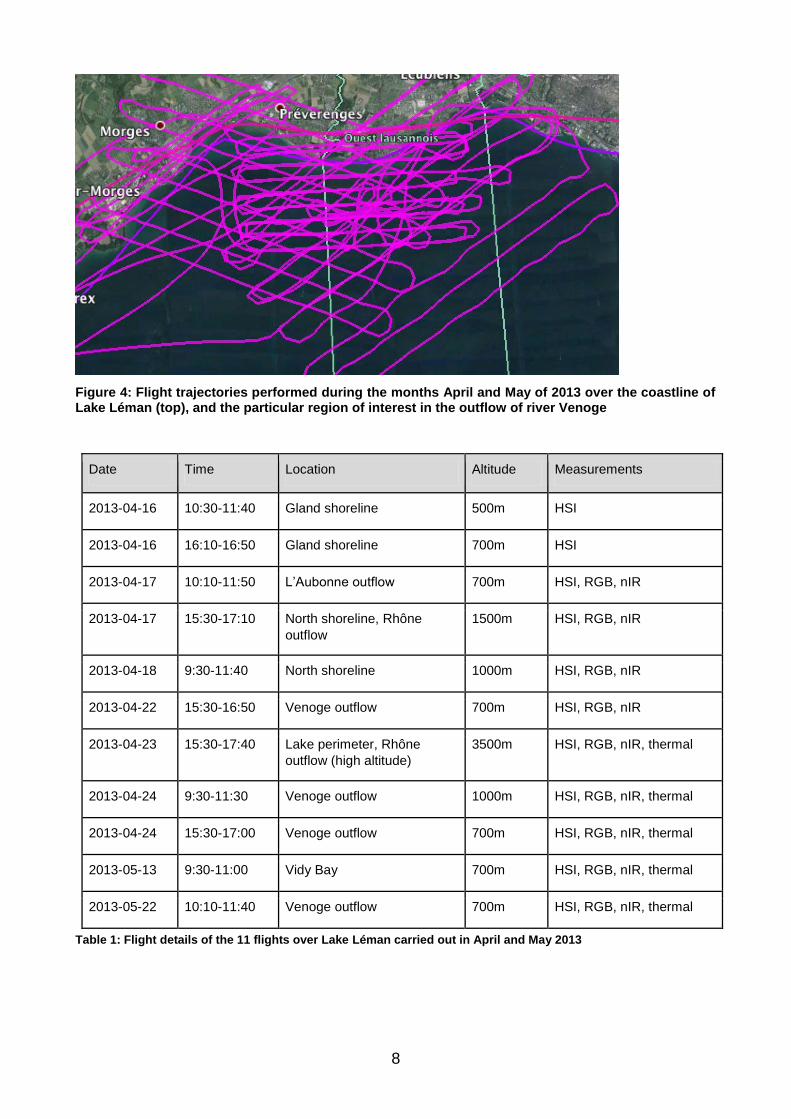
8
Figure 4: Flight trajectories performed during the months April and May of 2013 over the coastline of Lake Léman (top), and the particular region of interest in the outflow of river Venoge
Date Time Location Altitude Measurements
2013-04-16 10:30-11:40 Gland shoreline 500m HSI
2013-04-16 16:10-16:50 Gland shoreline 700m HSI
2013-04-17 10:10-11:50 L’Aubonne outflow 700m HSI, RGB, nIR
2013-04-17 15:30-17:10 North shoreline, Rhône
outflow
1500m HSI, RGB, nIR
2013-04-18 9:30-11:40 North shoreline 1000m HSI, RGB, nIR
2013-04-22 15:30-16:50 Venoge outflow 700m HSI, RGB, nIR
2013-04-23 15:30-17:40 Lake perimeter, Rhône
outflow (high altitude)
3500m HSI, RGB, nIR, thermal
2013-04-24 9:30-11:30 Venoge outflow 1000m HSI, RGB, nIR, thermal
2013-04-24 15:30-17:00 Venoge outflow 700m HSI, RGB, nIR, thermal
2013-05-13 9:30-11:00 Vidy Bay 700m HSI, RGB, nIR, thermal
2013-05-22 10:10-11:40 Venoge outflow 700m HSI, RGB, nIR, thermal
Table 1: Flight details of the 11 flights over Lake Léman carried out in April and May 2013
9
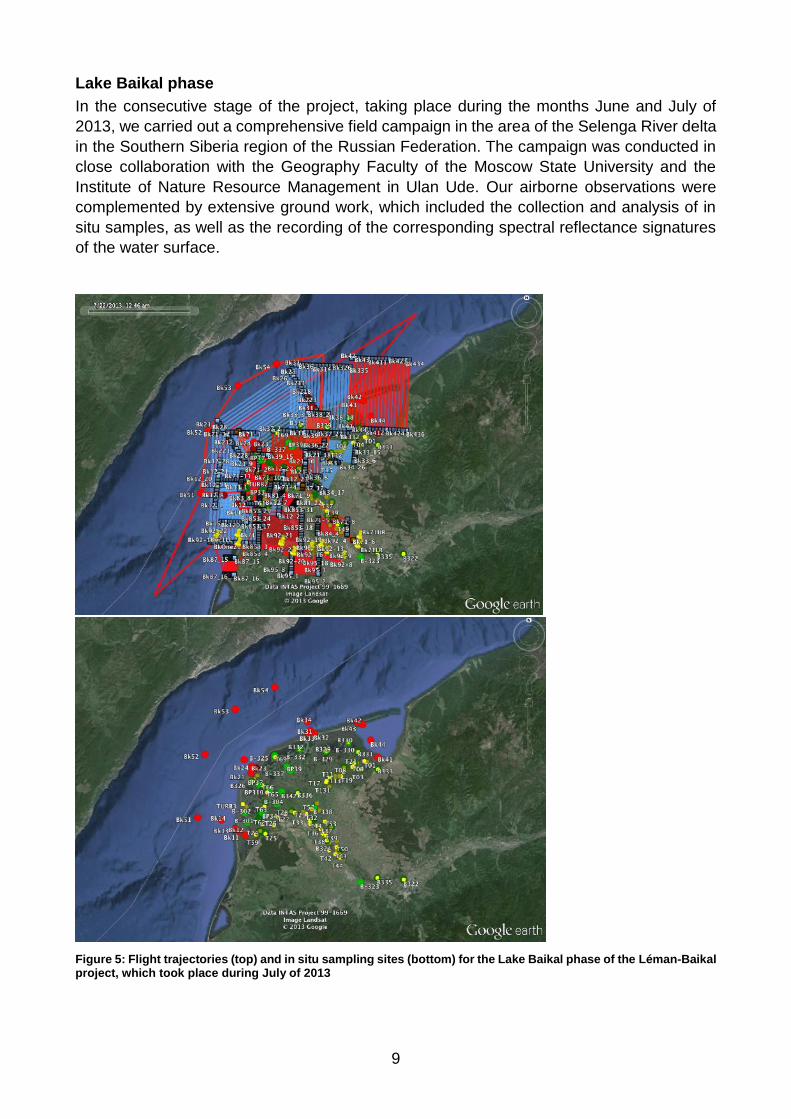
Lake Baikal phase
In the consecutive stage of the project, taking place during the months June and July of
2013, we carried out a comprehensive field campaign in the area of the Selenga River delta
in the Southern Siberia region of the Russian Federation. The campaign was conducted in
close collaboration with the Geography Faculty of the Moscow State University and the
Institute of Nature Resource Management in Ulan Ude. Our airborne observations were
complemented by extensive ground work, which included the collection and analysis of in
situ samples, as well as the recording of the corresponding spectral reflectance signatures
of the water surface.
Figure 5: Flight trajectories (top) and in situ sampling sites (bottom) for the Lake Baikal phase of the Léman-Baikal project, which took place during July of 2013
10
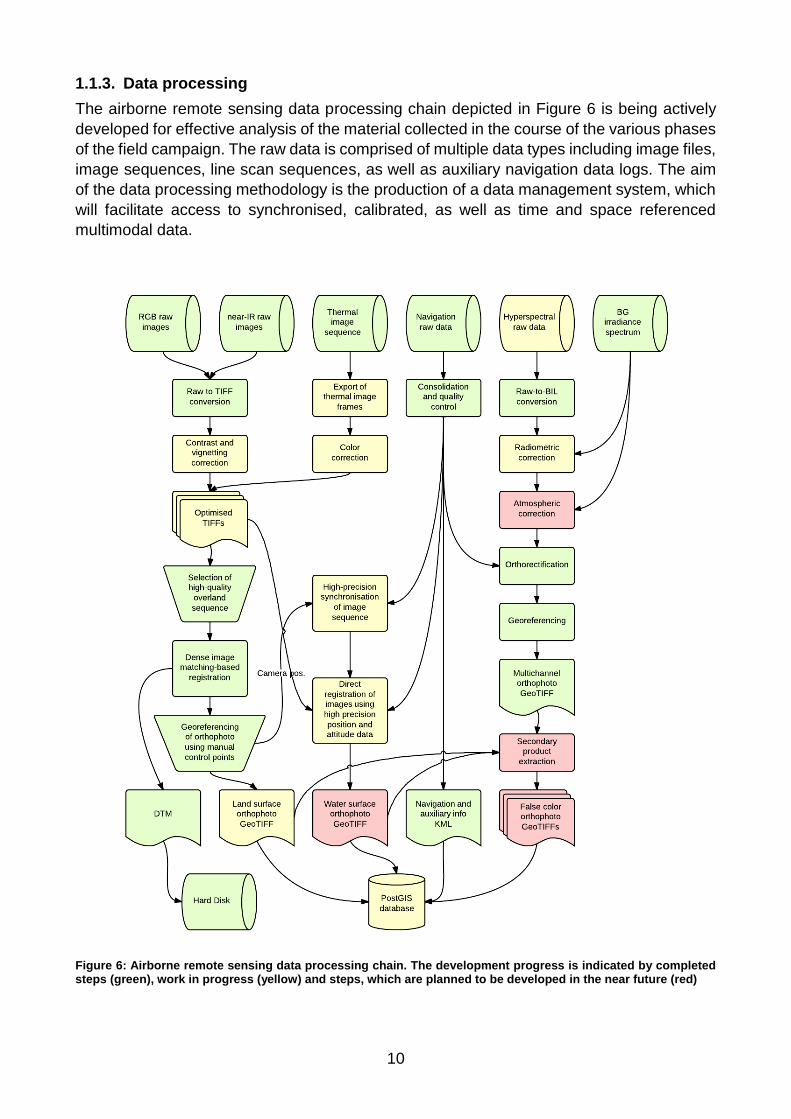
1.1.3. Data processing
The airborne remote sensing data processing chain depicted in Figure 6 is being actively
developed for effective analysis of the material collected in the course of the various phases
of the field campaign. The raw data is comprised of multiple data types including image files,
image sequences, line scan sequences, as well as auxiliary navigation data logs. The aim
of the data processing methodology is the production of a data management system, which
will facilitate access to synchronised, calibrated, as well as time and space referenced
multimodal data.
Figure 6: Airborne remote sensing data processing chain. The development progress is indicated by completed steps (green), work in progress (yellow) and steps, which are planned to be developed in the near future (red)
11
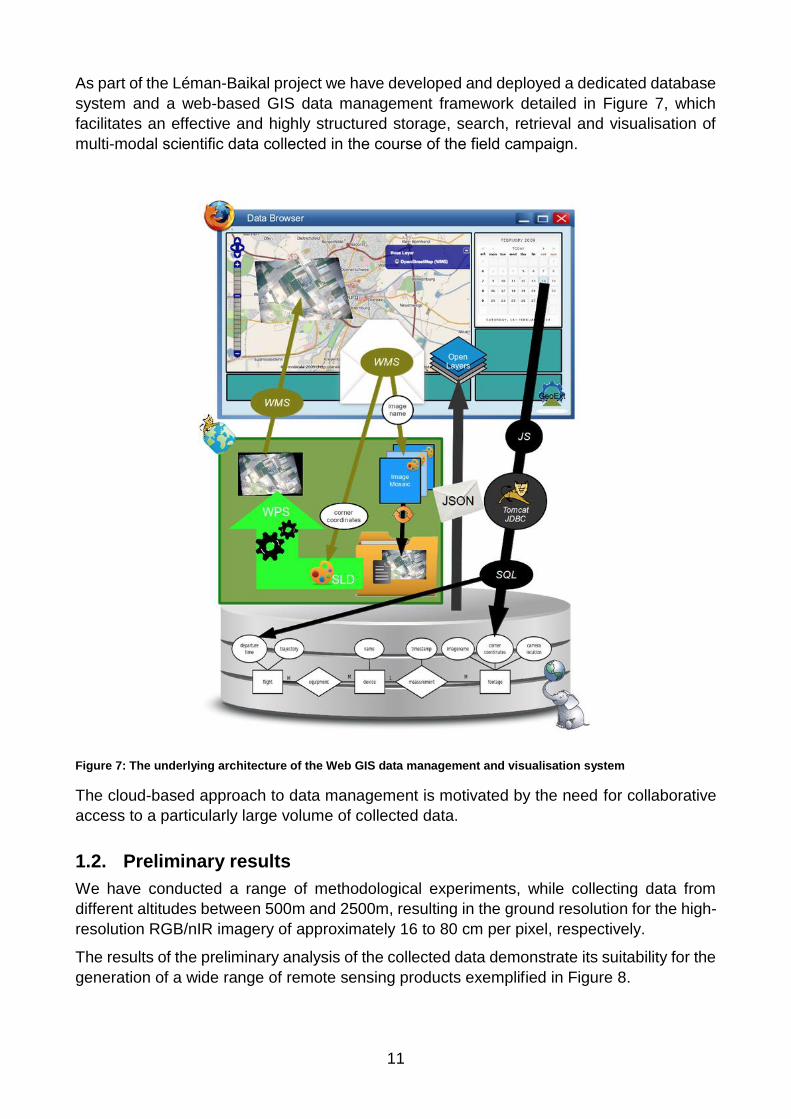
As part of the Léman-Baikal project we have developed and deployed a dedicated database
system and a web-based GIS data management framework detailed in Figure 7, which
facilitates an effective and highly structured storage, search, retrieval and visualisation of
multi-modal scientific data collected in the course of the field campaign.
Figure 7: The underlying architecture of the Web GIS data management and visualisation system
The cloud-based approach to data management is motivated by the need for collaborative
access to a particularly large volume of collected data.
1.2. Preliminary results
We have conducted a range of methodological experiments, while collecting data from
different altitudes between 500m and 2500m, resulting in the ground resolution for the high-
resolution RGB/nIR imagery of approximately 16 to 80 cm per pixel, respectively.
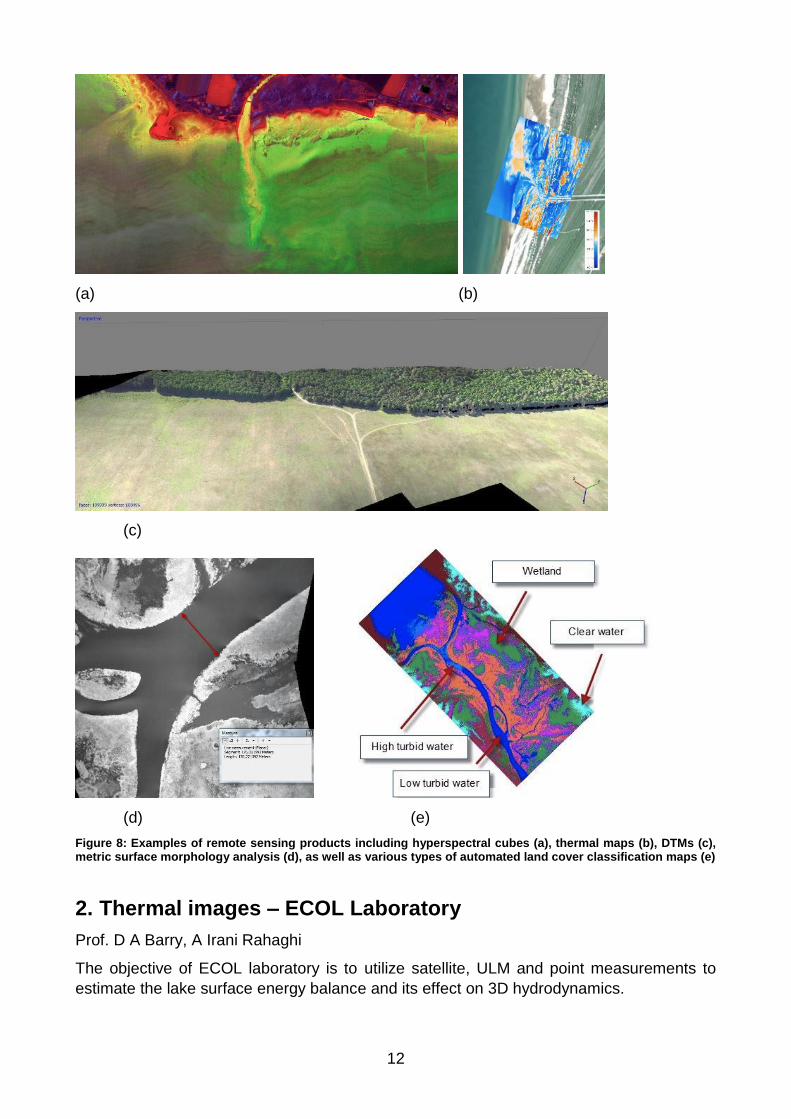
The results of the preliminary analysis of the collected data demonstrate its suitability for the
generation of a wide range of remote sensing products exemplified in Figure 8.
12
(a) (b)
(c)
(d) (e)
Figure 8: Examples of remote sensing products including hyperspectral cubes (a), thermal maps (b), DTMs (c), metric surface morphology analysis (d), as well as various types of automated land cover classification maps (e)
2. Thermal images – ECOL Laboratory
Prof. D A Barry, A Irani Rahaghi
The objective of ECOL laboratory is to utilize satellite, ULM and point measurements to
estimate the lake surface energy balance and its effect on 3D hydrodynamics.
13
2.1. Surface temperatures from remote sensing
The heat balance at the air-water interface includes different mechanisms. In general for
lakes, heat flows from groundwater and inflow/outflow are insignificant compared to other
heat transfer mechanisms. Therefore, the heat flux equation at the lake surface is given by:
w p sn an ev cotot br
T
tC h Q Q Q Q Q Q , (1)
where the RHS (right-hand side) terms are, respectively, net incident solar radiation (short-
wave), net incident atmospheric radiation (long-wave), back radiation (long-wave),
evaporation and convection. Also, h is the mixed layer thickness, T is temperature, t is time,
w is the water density and Cp is the heat capacity.
Methods to evaluate the heat flux at the lake surface in (1) have been investigated by ECOL
laboratory. For this, we have acquired a radiometer for measuring the first three terms in the
RHS (i.e., the net radiation). For estimating evaporative and convective heat flux over lakes,
different approaches are possible (bulk aerodynamic methods, surface energy balance
system, etc.). These methods require measurement of air temperature, surface water
temperature, wind speed, humidity, and air pressure within a precise temporal scale (e.g.,
hourly). The air temperature, wind speed, humidity and air pressure can be obtained using
some of our own instruments as well as MeteoSuisse COSMO data. For calculating the local
temperature derivatives (left-hand side, LHS), surface temperature values in different times
are needed. Therefore, the lake surface water temperature (LSWT) plays an important role
in three terms of the heat flux equation.
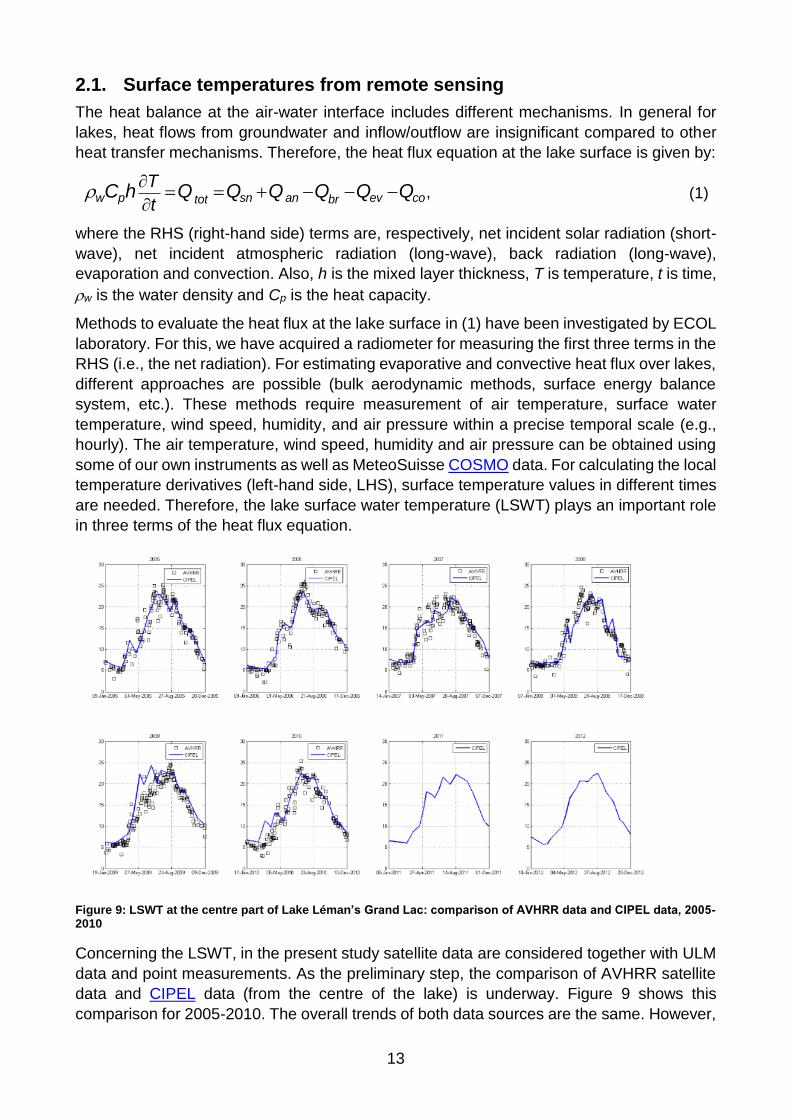
Figure 9: LSWT at the centre part of Lake Léman’s Grand Lac: comparison of AVHRR data and CIPEL data, 2005-2010
Concerning the LSWT, in the present study satellite data are considered together with ULM
data and point measurements. As the preliminary step, the comparison of AVHRR satellite
data and CIPEL data (from the centre of the lake) is underway. Figure 9 shows this
comparison for 2005-2010. The overall trends of both data sources are the same. However,
14
in some points there is a noticeable difference. The ULM data sets will provide the missing
scale between the satellite and point measurements, and are expected to help to explain
the differences evident in Figure 9.
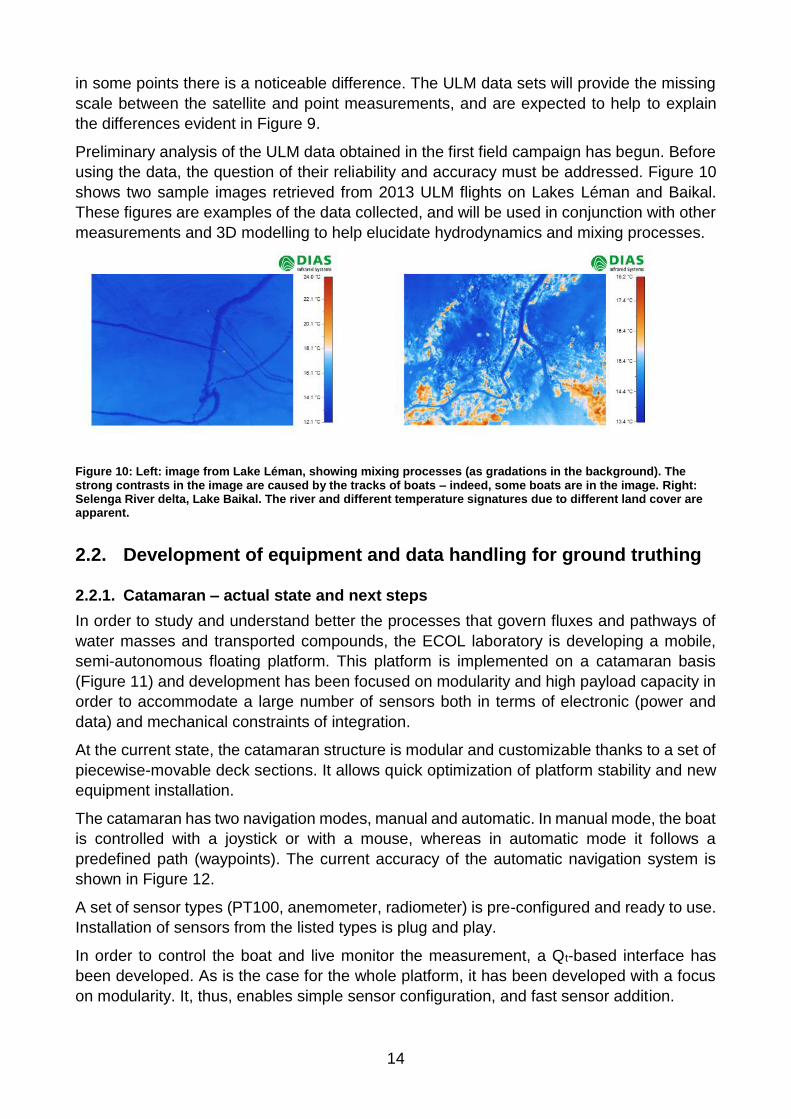
Preliminary analysis of the ULM data obtained in the first field campaign has begun. Before
using the data, the question of their reliability and accuracy must be addressed. Figure 10
shows two sample images retrieved from 2013 ULM flights on Lakes Léman and Baikal.
These figures are examples of the data collected, and will be used in conjunction with other
measurements and 3D modelling to help elucidate hydrodynamics and mixing processes.
Figure 10: Left: image from Lake Léman, showing mixing processes (as gradations in the background). The strong contrasts in the image are caused by the tracks of boats – indeed, some boats are in the image. Right: Selenga River delta, Lake Baikal. The river and different temperature signatures due to different land cover are apparent.
2.2. Development of equipment and data handling for ground truthing
2.2.1. Catamaran – actual state and next steps
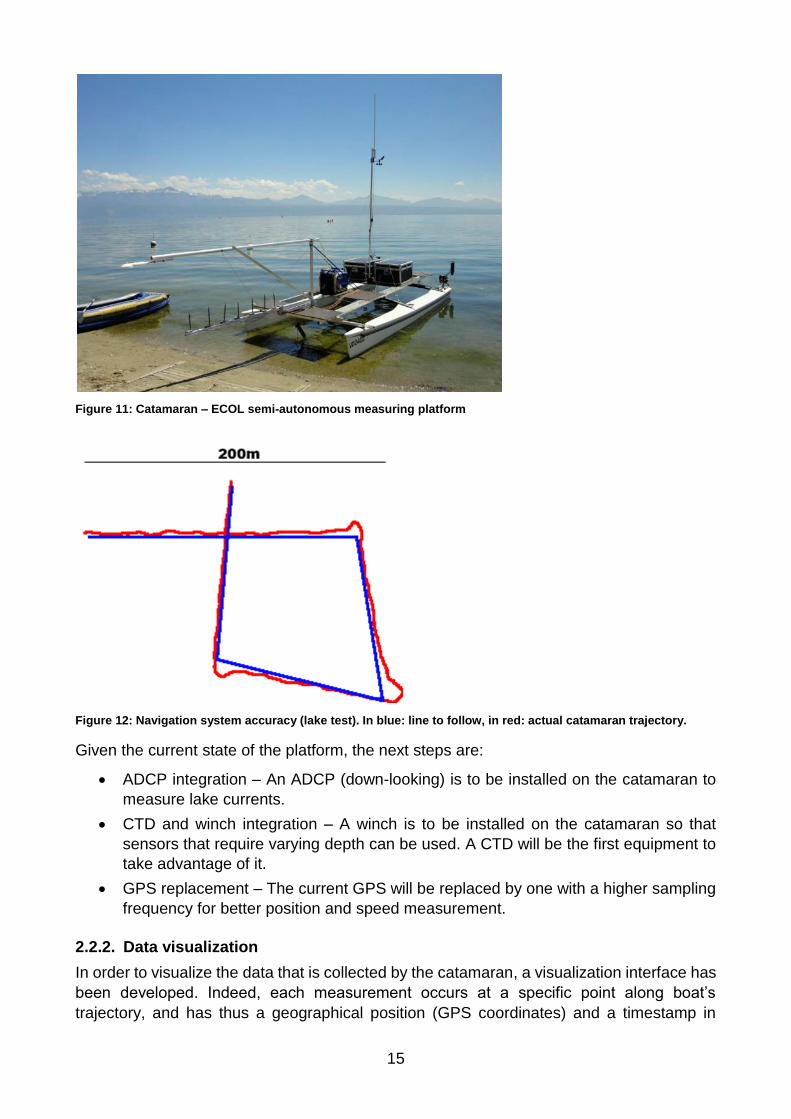
In order to study and understand better the processes that govern fluxes and pathways of
water masses and transported compounds, the ECOL laboratory is developing a mobile,
semi-autonomous floating platform. This platform is implemented on a catamaran basis
(Figure 11) and development has been focused on modularity and high payload capacity in
order to accommodate a large number of sensors both in terms of electronic (power and
data) and mechanical constraints of integration.
At the current state, the catamaran structure is modular and customizable thanks to a set of
piecewise-movable deck sections. It allows quick optimization of platform stability and new
equipment installation.
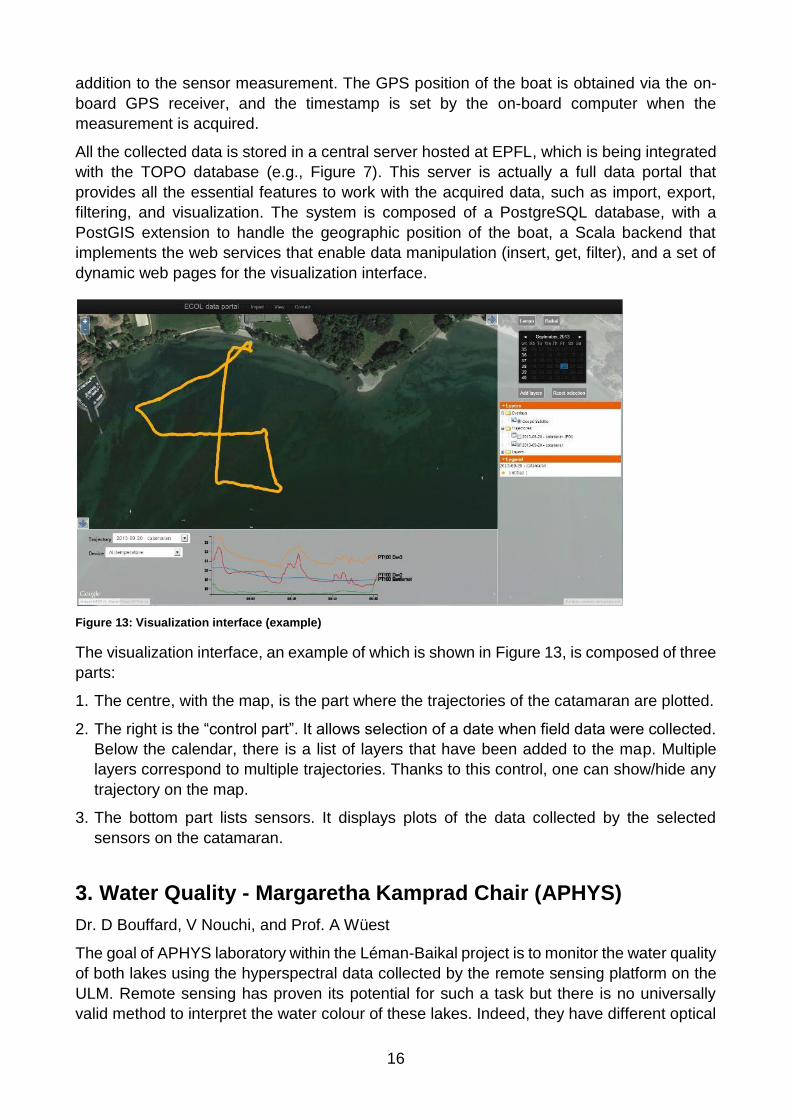
The catamaran has two navigation modes, manual and automatic. In manual mode, the boat
is controlled with a joystick or with a mouse, whereas in automatic mode it follows a
predefined path (waypoints). The current accuracy of the automatic navigation system is
shown in Figure 12.
A set of sensor types (PT100, anemometer, radiometer) is pre-configured and ready to use.
Installation of sensors from the listed types is plug and play.
In order to control the boat and live monitor the measurement, a Qt-based interface has
been developed. As is the case for the whole platform, it has been developed with a focus
on modularity. It, thus, enables simple sensor configuration, and fast sensor addition.
15
Figure 11: Catamaran – ECOL semi-autonomous measuring platform
Figure 12: Navigation system accuracy (lake test). In blue: line to follow, in red: actual catamaran trajectory.
Given the current state of the platform, the next steps are:
ADCP integration – An ADCP (down-looking) is to be installed on the catamaran to
measure lake currents.
CTD and winch integration – A winch is to be installed on the catamaran so that
sensors that require varying depth can be used. A CTD will be the first equipment to
take advantage of it.
GPS replacement – The current GPS will be replaced by one with a higher sampling
frequency for better position and speed measurement.
2.2.2. Data visualization
In order to visualize the data that is collected by the catamaran, a visualization interface has
been developed. Indeed, each measurement occurs at a specific point along boat’s
trajectory, and has thus a geographical position (GPS coordinates) and a timestamp in
16
addition to the sensor measurement. The GPS position of the boat is obtained via the on-
board GPS receiver, and the timestamp is set by the on-board computer when the
measurement is acquired.
All the collected data is stored in a central server hosted at EPFL, which is being integrated
with the TOPO database (e.g., Figure 7). This server is actually a full data portal that
provides all the essential features to work with the acquired data, such as import, export,
filtering, and visualization. The system is composed of a PostgreSQL database, with a
PostGIS extension to handle the geographic position of the boat, a Scala backend that
implements the web services that enable data manipulation (insert, get, filter), and a set of
dynamic web pages for the visualization interface.
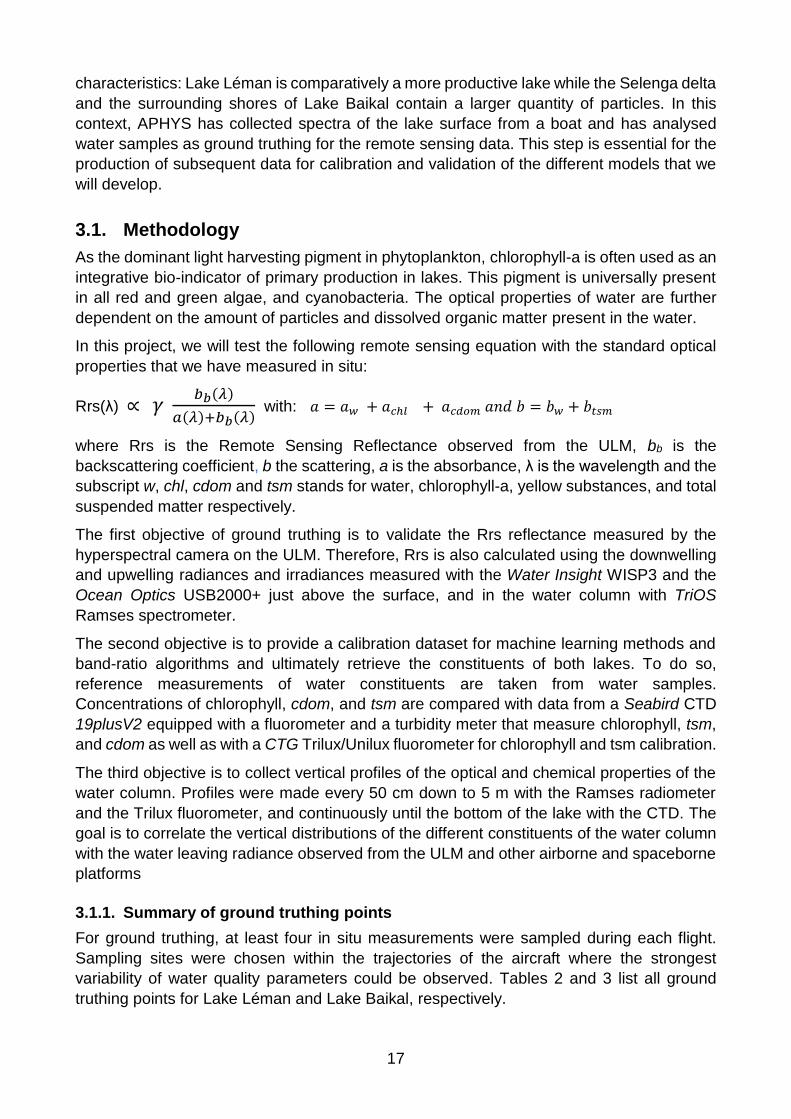
Figure 13: Visualization interface (example)
The visualization interface, an example of which is shown in Figure 13, is composed of three
parts:
1. The centre, with the map, is the part where the trajectories of the catamaran are plotted.
2. The right is the “control part”. It allows selection of a date when field data were collected.
Below the calendar, there is a list of layers that have been added to the map. Multiple
layers correspond to multiple trajectories. Thanks to this control, one can show/hide any
trajectory on the map.
3. The bottom part lists sensors. It displays plots of the data collected by the selected
sensors on the catamaran.
3. Water Quality - Margaretha Kamprad Chair (APHYS)
Dr. D Bouffard, V Nouchi, and Prof. A Wüest
The goal of APHYS laboratory within the Léman-Baikal project is to monitor the water quality
of both lakes using the hyperspectral data collected by the remote sensing platform on the
ULM. Remote sensing has proven its potential for such a task but there is no universally
valid method to interpret the water colour of these lakes. Indeed, they have different optical
17
characteristics: Lake Léman is comparatively a more productive lake while the Selenga delta
and the surrounding shores of Lake Baikal contain a larger quantity of particles. In this
context, APHYS has collected spectra of the lake surface from a boat and has analysed
water samples as ground truthing for the remote sensing data. This step is essential for the
production of subsequent data for calibration and validation of the different models that we
will develop.
3.1. Methodology
As the dominant light harvesting pigment in phytoplankton, chlorophyll-a is often used as an
integrative bio-indicator of primary production in lakes. This pigment is universally present
in all red and green algae, and cyanobacteria. The optical properties of water are further
dependent on the amount of particles and dissolved organic matter present in the water.
In this project, we will test the following remote sensing equation with the standard optical
properties that we have measured in situ:
Rrs(λ) ∝ 𝛾 𝑏𝑏(𝜆)
𝑎(𝜆)+𝑏𝑏(𝜆) with: 𝑎 = 𝑎𝑤 + 𝑎𝑐ℎ𝑙 + 𝑎𝑐𝑑𝑜𝑚 𝑎𝑛𝑑 𝑏 = 𝑏𝑤 + 𝑏𝑡𝑠𝑚
where Rrs is the Remote Sensing Reflectance observed from the ULM, bb is the
backscattering coefficient, b the scattering, a is the absorbance, λ is the wavelength and the
subscript w, chl, cdom and tsm stands for water, chlorophyll-a, yellow substances, and total
suspended matter respectively.
The first objective of ground truthing is to validate the Rrs reflectance measured by the
hyperspectral camera on the ULM. Therefore, Rrs is also calculated using the downwelling
and upwelling radiances and irradiances measured with the Water Insight WISP3 and the
Ocean Optics USB2000+ just above the surface, and in the water column with TriOS
Ramses spectrometer.
The second objective is to provide a calibration dataset for machine learning methods and
band-ratio algorithms and ultimately retrieve the constituents of both lakes. To do so,
reference measurements of water constituents are taken from water samples.
Concentrations of chlorophyll, cdom, and tsm are compared with data from a Seabird CTD
19plusV2 equipped with a fluorometer and a turbidity meter that measure chlorophyll, tsm,
and cdom as well as with a CTG Trilux/Unilux fluorometer for chlorophyll and tsm calibration.
The third objective is to collect vertical profiles of the optical and chemical properties of the
water column. Profiles were made every 50 cm down to 5 m with the Ramses radiometer
and the Trilux fluorometer, and continuously until the bottom of the lake with the CTD. The
goal is to correlate the vertical distributions of the different constituents of the water column
with the water leaving radiance observed from the ULM and other airborne and spaceborne
platforms
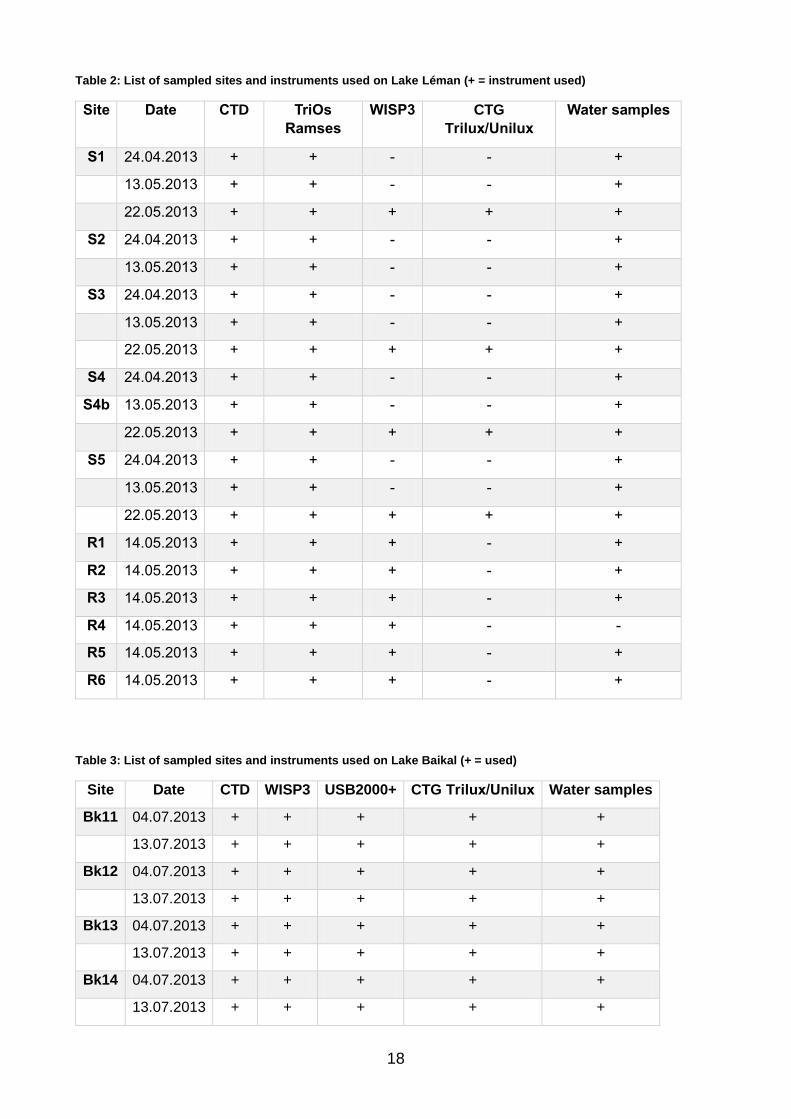
3.1.1. Summary of ground truthing points
For ground truthing, at least four in situ measurements were sampled during each flight.
Sampling sites were chosen within the trajectories of the aircraft where the strongest
variability of water quality parameters could be observed. Tables 2 and 3 list all ground
truthing points for Lake Léman and Lake Baikal, respectively.
18
Table 2: List of sampled sites and instruments used on Lake Léman (+ = instrument used)
Site Date CTD TriOs
Ramses
WISP3 CTG
Trilux/Unilux
Water samples
S1 24.04.2013 + + - - +
13.05.2013 + + - - +
22.05.2013 + + + + +
S2 24.04.2013 + + - - +
13.05.2013 + + - - +
S3 24.04.2013 + + - - +
13.05.2013 + + - - +
22.05.2013 + + + + +
S4 24.04.2013 + + - - +
S4b 13.05.2013 + + - - +
22.05.2013 + + + + +
S5 24.04.2013 + + - - +
13.05.2013 + + - - +
22.05.2013 + + + + +
R1 14.05.2013 + + + - +
R2 14.05.2013 + + + - +
R3 14.05.2013 + + + - +
R4 14.05.2013 + + + - -
R5 14.05.2013 + + + - +
R6 14.05.2013 + + + - +
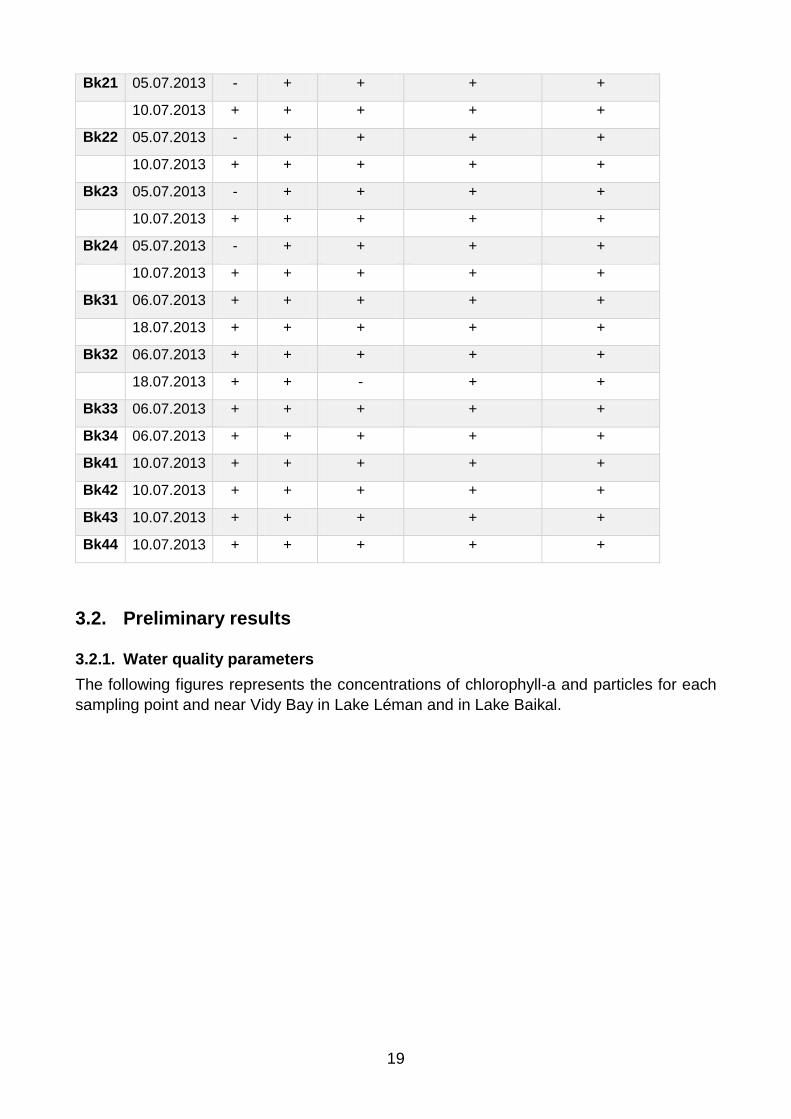
Table 3: List of sampled sites and instruments used on Lake Baikal (+ = used)
Site Date CTD WISP3 USB2000+ CTG Trilux/Unilux Water samples
Bk11 04.07.2013 + + + + +
13.07.2013 + + + + +
Bk12 04.07.2013 + + + + +
13.07.2013 + + + + +
Bk13 04.07.2013 + + + + +
13.07.2013 + + + + +
Bk14 04.07.2013 + + + + +
13.07.2013 + + + + +
19
Bk21 05.07.2013 - + + + +
10.07.2013 + + + + +
Bk22 05.07.2013 - + + + +
10.07.2013 + + + + +
Bk23 05.07.2013 - + + + +
10.07.2013 + + + + +
Bk24 05.07.2013 - + + + +
10.07.2013 + + + + +
Bk31 06.07.2013 + + + + +
18.07.2013 + + + + +
Bk32 06.07.2013 + + + + +
18.07.2013 + + - + +
Bk33 06.07.2013 + + + + +
Bk34 06.07.2013 + + + + +
Bk41 10.07.2013 + + + + +
Bk42 10.07.2013 + + + + +
Bk43 10.07.2013 + + + + +
Bk44 10.07.2013 + + + + +
3.2. Preliminary results
3.2.1. Water quality parameters
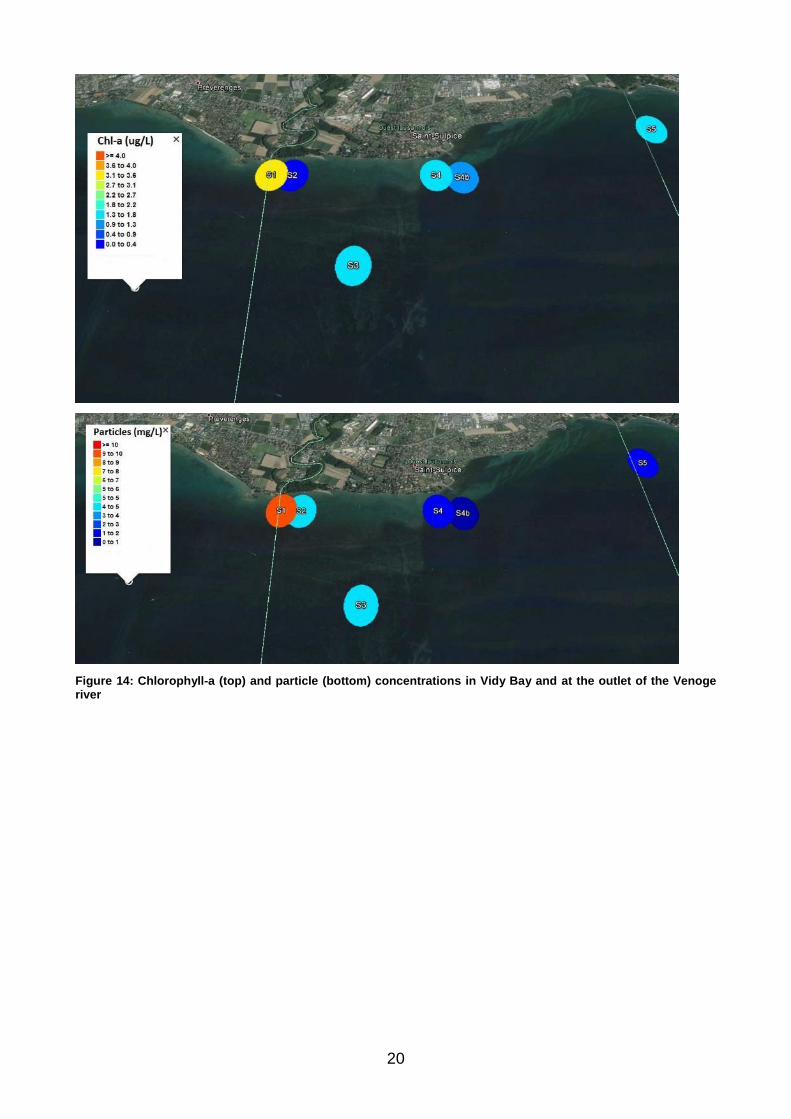
The following figures represents the concentrations of chlorophyll-a and particles for each
sampling point and near Vidy Bay in Lake Léman and in Lake Baikal.
20
Figure 14: Chlorophyll-a (top) and particle (bottom) concentrations in Vidy Bay and at the outlet of the Venoge river
21
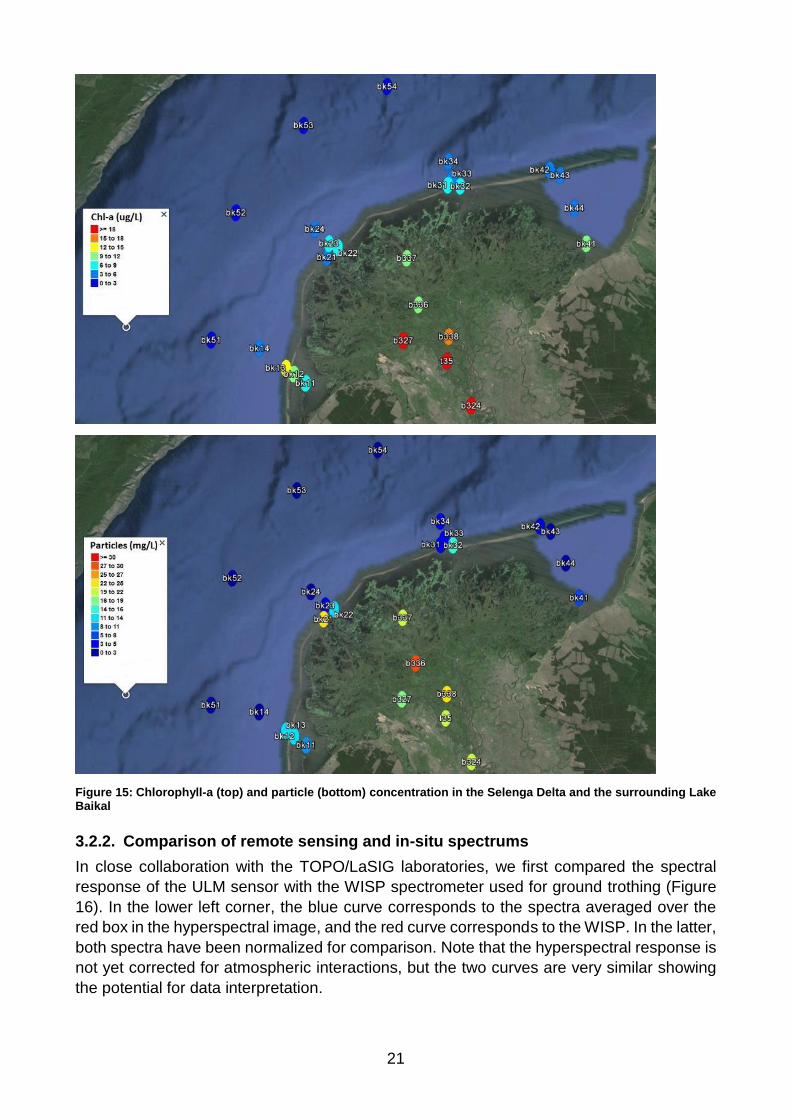
Figure 15: Chlorophyll-a (top) and particle (bottom) concentration in the Selenga Delta and the surrounding Lake Baikal
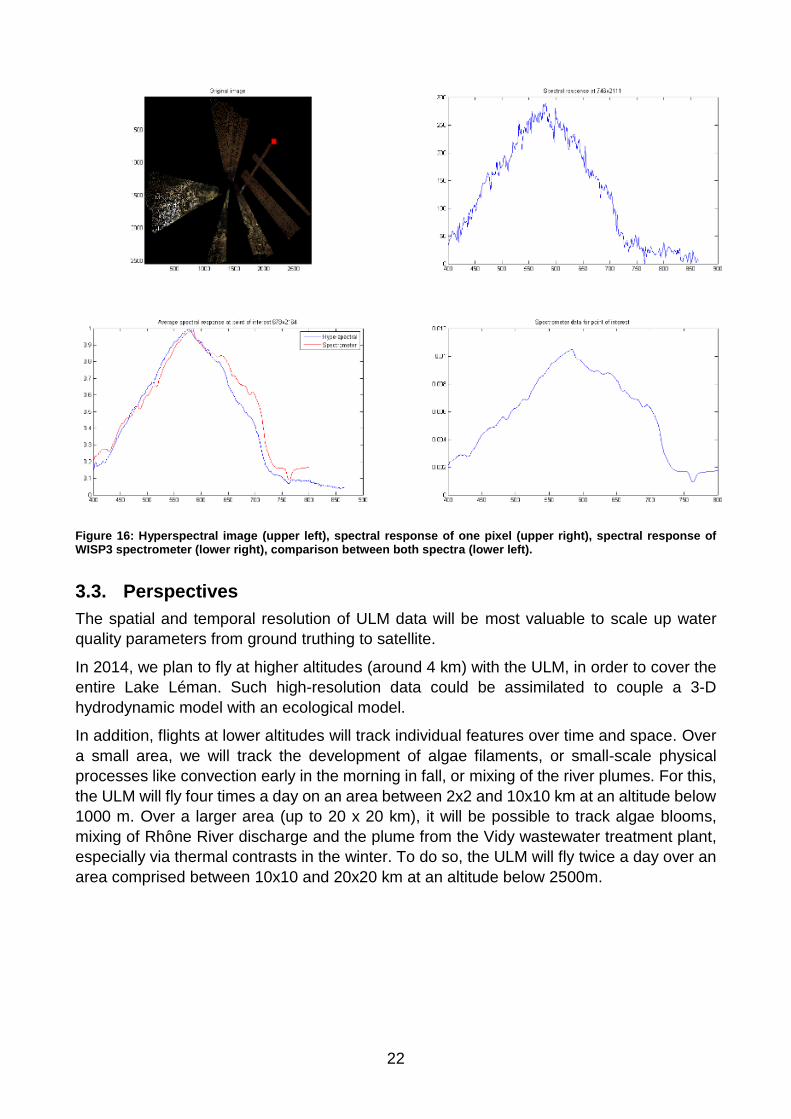
3.2.2. Comparison of remote sensing and in-situ spectrums
In close collaboration with the TOPO/LaSIG laboratories, we first compared the spectral
response of the ULM sensor with the WISP spectrometer used for ground trothing (Figure
16). In the lower left corner, the blue curve corresponds to the spectra averaged over the
red box in the hyperspectral image, and the red curve corresponds to the WISP. In the latter,
both spectra have been normalized for comparison. Note that the hyperspectral response is
not yet corrected for atmospheric interactions, but the two curves are very similar showing
the potential for data interpretation.
22
Figure 16: Hyperspectral image (upper left), spectral response of one pixel (upper right), spectral response of WISP3 spectrometer (lower right), comparison between both spectra (lower left).
3.3. Perspectives
The spatial and temporal resolution of ULM data will be most valuable to scale up water
quality parameters from ground truthing to satellite.
In 2014, we plan to fly at higher altitudes (around 4 km) with the ULM, in order to cover the
entire Lake Léman. Such high-resolution data could be assimilated to couple a 3-D
hydrodynamic model with an ecological model.
In addition, flights at lower altitudes will track individual features over time and space. Over
a small area, we will track the development of algae filaments, or small-scale physical
processes like convection early in the morning in fall, or mixing of the river plumes. For this,
the ULM will fly four times a day on an area between 2x2 and 10x10 km at an altitude below
1000 m. Over a larger area (up to 20 x 20 km), it will be possible to track algae blooms,
mixing of Rhône River discharge and the plume from the Vidy wastewater treatment plant,
especially via thermal contrasts in the winter. To do so, the ULM will fly twice a day over an
area comprised between 10x10 and 20x20 km at an altitude below 2500m.
23
4. Atmospheric Boundary Layer over Lake Léman - WIRE
Dr. G V Lungo and Prof. F Porté-Agel
4.1. Introduction
The Wind Engineering and Renewable Energy (WIRE) Lab contributes to the project “A
study of the micrometeorology and heat fluxes over Lake Léman using ULM and lidars”,
which is coordinated by the Limnology Center, with turbulence measurements of the
atmospheric boundary layer (ABL). Those measurements will be performed through three
different setups: instrumented towers, wind lidars and turbulence probes installed on a ULM.
The synergistic analysis of those data will improve our understanding on turbulence and
transport phenomena within the ABL over the Lake Léman. Moreover, those data will be
useful to evaluate if standard turbulence models are suitable for prediction of a turbulent
atmospheric flow for this test case where the surrounding topography and land/water
transition play a significant role. Measurements will be performed in proximity of the
land/water with instrumented towers, while wind lidars will acquire wind data within a range
of heights from 45m up to 1500m. Finally, turbulence measurements will be carried out
through probes installed on a ULM.
The scientific goal of this field campaign is mainly devoted to the characterization of the
turbulent flow within the ABL over Lake Léman, and of transport phenomena associated with
it. A better physical understanding of the physics occurring in presence of such a
heterogeneous domain will be fundamental to investigate on the consequent effect on the
local micrometeorology and on air quality of the Léman region. Furthermore, the
characterization of the wind field at different heights and for different ABL stability regimes
will allow to estimate the potential for wind energy harvesting, especially connected to wind
flows at higher altitudes and due to thermals.
4.1.1. Experimental setup
As already mentioned in the previous section, measurements will be performed with three
different setups: instrumented towers, three wind lidars and turbulence probes installed on
a ULM.
Several (3-4) 10 m towers can be installed on the considered site in order to characterize
the wind/atmospheric conditions. Those towers are typically instrumented with sonic
anemometers, temperature probes, radiometers and eventually hygrometers. This setup
can be also installed on shorter 3m tripods and eventually it can be deployed over a floating
platform or on a catamaran. This setup is essential for the characterization of the ABL in the
surface layer, thus in proximity of the land/water, and to evaluate if classical models to
predict ABL flows, which need just measurements in proximity of the surface, are
satisfactory in areas with heterogeneous topography.
Wind measurements will be performed with three lidars. The lidars allow the measurement
of the wind velocity component parallel to the direction of the laser beam, which is denoted
as the line-of-sight velocity. By combining three lidars, different measurement techniques
can be designed in order to perform measurements over planes, volumes or to obtain 3D
velocity components of the wind in a single point. The frequency resolution varies with
different measurement procedures, thereby involving different measurement volumes. Wind
24
lidar measurements can be typically performed from a minimum distance from the lidar
location of 45m up to distances larger than 1000m. The maximum achievable distance is a
function of the aerosol concentration within the ABL.
4.2. Field campaign in 2013
Measurements of the ABL over Lake Léman will be also carried out through turbulence
probes installed on a UML. For the 2013 field campaign, two fast-response five-hole
pressure probes were purchased for turbulence measurements of the three wind velocity
components. Furthermore, two total air temperature probes were also purchased to
measure air temperature. All the measurements was acquired with a standard National
Instrument Data Acquisition System.
For the field campaign 2013, two weeks (10 days) were devoted to the ULM measurements.
Unfortunately, the ULM was not accessible for test setup before the campaign. Due to delays
in setting up our equipment, just half day was allocated to the WIRE group for the setup of
the probes and to carry out a 15 minute flight to check its structural robustness.
Due to miscommunication, the AC power supply and the GPS/IMU data for the post-
processing were not provided on the ULM. Therefore, no data were acquired through this
preliminary flight.
4.3. Assessment of the existing setup and upgrade for 2014
For the next field campaign the first goal is to perform measurements with the setup
designed for the field campaign 2013. The setup will be initially tested in the WIRE wind
tunnel. A new DC light power supply will be designed and purchased. All the data acquisition
will be performed with a portable NI-Compact RIO. GPS/IMU data will be acquired directly
by WIRE and synchronized with the NI-Compact RIO. Access to the ULM three months
before the test flights will allow tests that ensure an accurate setup. WIRE will acquire data
over different atmospheric conditions during the three planned periods. Finally, we will
coordinate ULM tests with the lidar and ground/tower measurements.
For the field campaign 2014 we are also planning to upgrade the setup by adding other
instruments. In addition to the turbulence fast-response probes, we are planning to also
install two sonic anemometers. The latters are characterized by a lower frequency
resolution, but they represent a more robust solution. The sonic anemometer data will be
used to assess the data acquired through the fast-response probes. Regarding the
temperature measurements, we intend to explore the possibility of performing very high
frequency measurements through a cold-wire probe. The water vapour content can be also
measured through hygrometers. We are also considering to use shortwave and longwave
radiometers to measure net radiation, surface temperature and albedo.
5. Princeton effort in collaboration with EFLUM/CRYOS
Prof. M Hultmark, Dr. H Huwald and Prof. M B Parlange
5.1. Objective
25
The ultimate goal for this project is to mount new and unique ultra-fast-response temperature
and humidity sensors on the ULM and measure humidity and temperature fluctuations in the
lower atmosphere, in order to investigate the full range of turbulent scales present in the
atmospheric humidity field and relate it to the macroscopic boundary layer properties. We
propose to combine the ULM measurements with Doppler lidar measurements, where the
lidar is pointed straight upwards. This will allow us to accurately estimate the boundary layer
thickness, a parameter that is very important for the atmospheric turbulence. The ULM
should be flown as low as possible with a path that intersects the lidar beam and extends
from over the lake to over the land. These fast response measurements will be supported
by more conventional slow response sensors for calibration purposes as well as mean
measurements. These measurements will be the first fully resolved measurements of the
humidity field in the atmospheric boundary layer, which will allow us to compare the resulting
turbulent humidity spectrum to existing theoretical analysis.
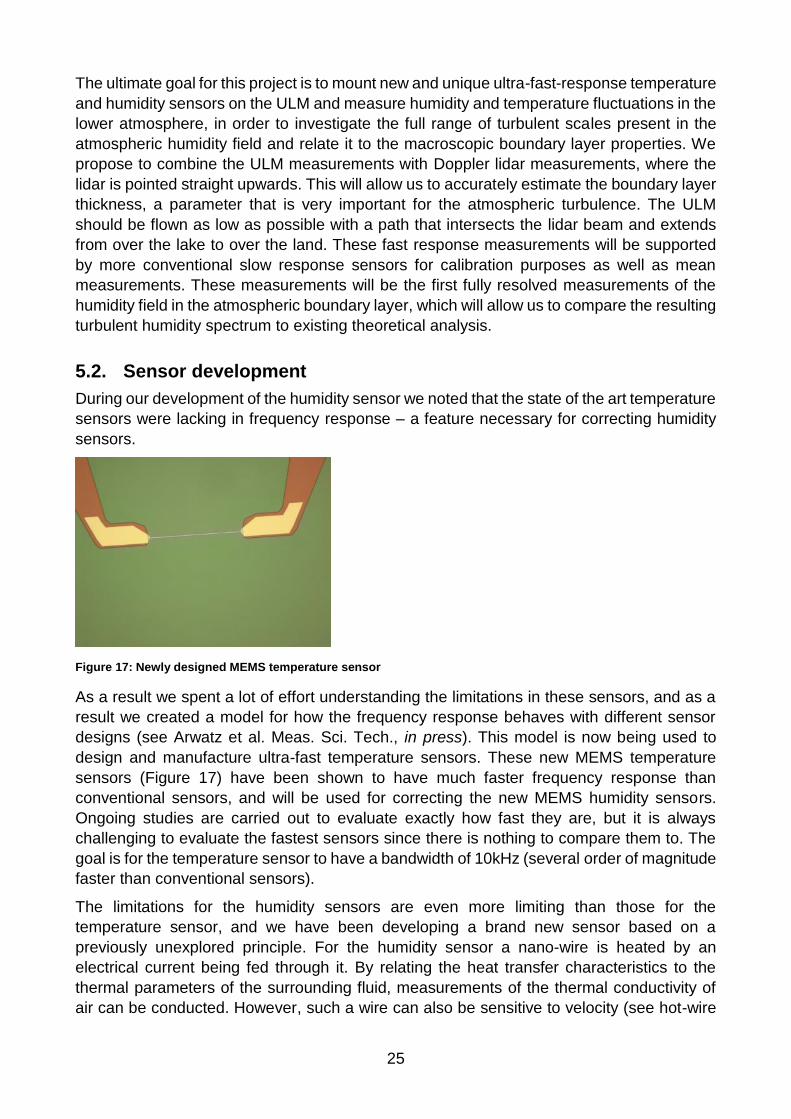
5.2. Sensor development
During our development of the humidity sensor we noted that the state of the art temperature
sensors were lacking in frequency response – a feature necessary for correcting humidity
sensors.
Figure 17: Newly designed MEMS temperature sensor
As a result we spent a lot of effort understanding the limitations in these sensors, and as a
result we created a model for how the frequency response behaves with different sensor
designs (see Arwatz et al. Meas. Sci. Tech., in press). This model is now being used to
design and manufacture ultra-fast temperature sensors. These new MEMS temperature
sensors (Figure 17) have been shown to have much faster frequency response than
conventional sensors, and will be used for correcting the new MEMS humidity sensors.
Ongoing studies are carried out to evaluate exactly how fast they are, but it is always
challenging to evaluate the fastest sensors since there is nothing to compare them to. The
goal is for the temperature sensor to have a bandwidth of 10kHz (several order of magnitude
faster than conventional sensors).
The limitations for the humidity sensors are even more limiting than those for the
temperature sensor, and we have been developing a brand new sensor based on a
previously unexplored principle. For the humidity sensor a nano-wire is heated by an
electrical current being fed through it. By relating the heat transfer characteristics to the
thermal parameters of the surrounding fluid, measurements of the thermal conductivity of
air can be conducted. However, such a wire can also be sensitive to velocity (see hot-wire
26
anemometry). The novelty of the new sensor lies in the separation of the sensitivity of
thermal conductivity from the velocity, as well as the manufacturing of a free standing nano-
wire. If the local Péclet number (𝑃𝑒 = 𝐿𝑈/𝛼, where L is the diameter of the wire, U the
velocity over it and α the thermal diffusivity of the air) is much smaller than unity, molecular
diffusion is the dominant mode of heat transfer. This allows one to relate the heat transferred
from the wire to the thermal properties of the fluid only, eliminating sensitivity to velocity. In
order to decrease the magnitude of the Péclet number without decreasing the air velocity
the length scale, L, can be decreased. Obviously, for this project we are interested in
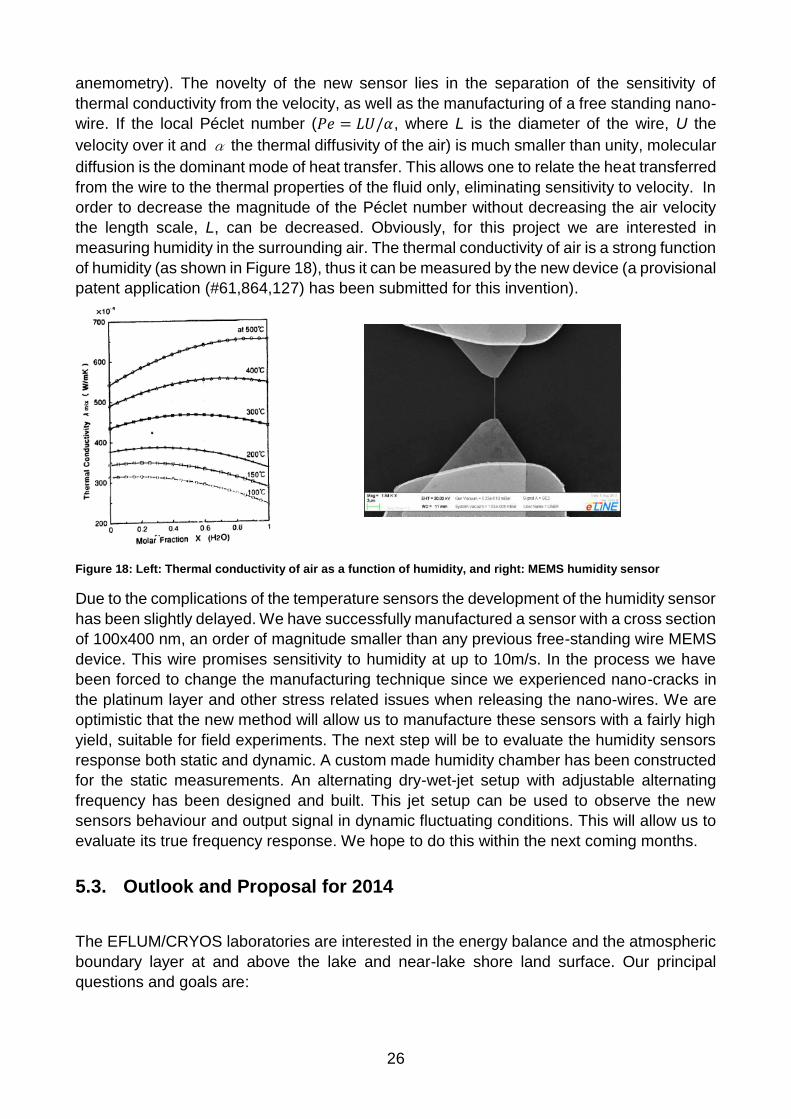
measuring humidity in the surrounding air. The thermal conductivity of air is a strong function
of humidity (as shown in Figure 18), thus it can be measured by the new device (a provisional
patent application (#61,864,127) has been submitted for this invention).
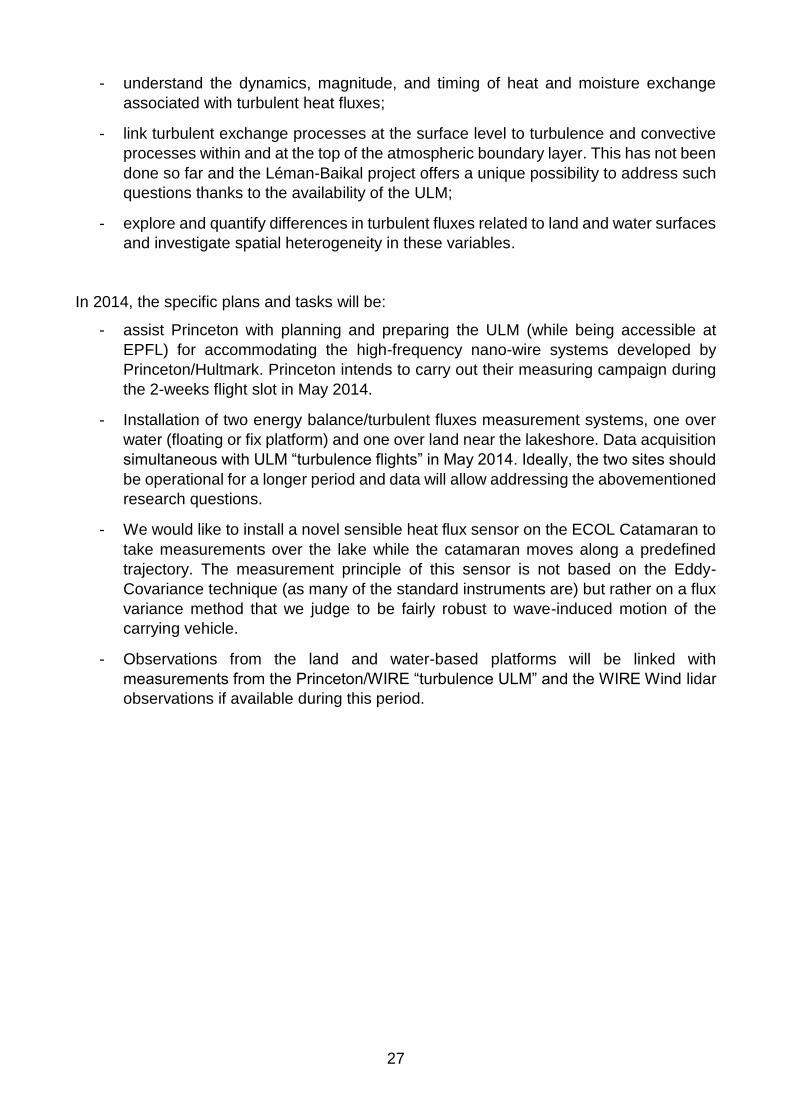
Figure 18: Left: Thermal conductivity of air as a function of humidity, and right: MEMS humidity sensor
Due to the complications of the temperature sensors the development of the humidity sensor
has been slightly delayed. We have successfully manufactured a sensor with a cross section
of 100x400 nm, an order of magnitude smaller than any previous free-standing wire MEMS
device. This wire promises sensitivity to humidity at up to 10m/s. In the process we have
been forced to change the manufacturing technique since we experienced nano-cracks in
the platinum layer and other stress related issues when releasing the nano-wires. We are
optimistic that the new method will allow us to manufacture these sensors with a fairly high
yield, suitable for field experiments. The next step will be to evaluate the humidity sensors
response both static and dynamic. A custom made humidity chamber has been constructed
for the static measurements. An alternating dry-wet-jet setup with adjustable alternating
frequency has been designed and built. This jet setup can be used to observe the new
sensors behaviour and output signal in dynamic fluctuating conditions. This will allow us to
evaluate its true frequency response. We hope to do this within the next coming months.
5.3. Outlook and Proposal for 2014
The EFLUM/CRYOS laboratories are interested in the energy balance and the atmospheric
boundary layer at and above the lake and near-lake shore land surface. Our principal
questions and goals are:
27
- understand the dynamics, magnitude, and timing of heat and moisture exchange
associated with turbulent heat fluxes;
- link turbulent exchange processes at the surface level to turbulence and convective
processes within and at the top of the atmospheric boundary layer. This has not been
done so far and the Léman-Baikal project offers a unique possibility to address such
questions thanks to the availability of the ULM;
- explore and quantify differences in turbulent fluxes related to land and water surfaces
and investigate spatial heterogeneity in these variables.
In 2014, the specific plans and tasks will be:
- assist Princeton with planning and preparing the ULM (while being accessible at
EPFL) for accommodating the high-frequency nano-wire systems developed by
Princeton/Hultmark. Princeton intends to carry out their measuring campaign during
the 2-weeks flight slot in May 2014.
- Installation of two energy balance/turbulent fluxes measurement systems, one over
water (floating or fix platform) and one over land near the lakeshore. Data acquisition
simultaneous with ULM “turbulence flights” in May 2014. Ideally, the two sites should
be operational for a longer period and data will allow addressing the abovementioned
research questions.
- We would like to install a novel sensible heat flux sensor on the ECOL Catamaran to
take measurements over the lake while the catamaran moves along a predefined
trajectory. The measurement principle of this sensor is not based on the Eddy-
Covariance technique (as many of the standard instruments are) but rather on a flux
variance method that we judge to be fairly robust to wave-induced motion of the
carrying vehicle.
- Observations from the land and water-based platforms will be linked with
measurements from the Princeton/WIRE “turbulence ULM” and the WIRE Wind lidar
observations if available during this period.