ul - defense technical information center traction tester kith driver jock davis, ......
TRANSCRIPT

AD-A276 484
*n \UL INSPECTE 3 ELECTEDTICQUAITYW~pETED~ j MAR 0 4 1994
Three Approaches toWinter Traction Testing
Sall A. hoopJuly 1993
.................. ...
.........................
a.... ..~............. ... . ....
.....................a..... ... m ý "****
.. . .. .... ......

BestAvailable
Copy

Abs4•-tactTraction on winter surfaces was measured using three test vehicles, each de-signed to measure traction for a different purpose: vehicle mobility research(CRREL Instrumented Vehicle), commercial tire testing (Uniroyal-Goodrich trac-tion tester), and airport runway safety (Saab friction tester). The traction meas-ured with each method is comparable, but there are systematic differences dueto the effects of the surface material and the test and analysis technique. Thiscomparison serves as the fundamental basis for collaboration beween the vari-ous traction testing communities and illustrates the need for well documentedtest procedures and data analysis as a standard for traction testing andevaluation.
Cover: Leftto right: The Saab friction tester with driverMark Lucier, the Uniroyal-Goodrich traction tester Kith driver Jock Davis, and the CRREL Instru-mented Vehicle with driver Byron Young.
For conversion of SI metric units to U.S./British customary units of measurementconsult Standard Practice for Use of the International System of Units (SI), ASTMStandard E380-89a, published by the American Society for Testing and Mater-ials, 1916 Race St., Philadelphia, Pa. 19103.

CRREL Report 93-9
US Army Corpsof EngineersCold Regions Research &Engineering Laboratory
Three Approaches toWinter Traction TestingSally A. Shoop July 1993
Prepared for
OFFICE OF THE CHIEF OF ENGINEERS
Approved for public release; distribution is unlimited.
PREFACE
This report was prepared by Sally A. Shoop, Research Civil Engineer, of the Applied Re-search Branch, Experimental Engineering Division, U.S. Army Cold Regions Research andEngineering Laboratory (CRREL). The project was funded by DA Project 4A762784AT42,Design, Construction, and Operations Technology for Cold Regions; Task CS, Work Unit 007, Off-Road Mobility in Thawing Soils.
This work would not have been possible without the cooperation and assistance of JackDavis, Testing Services and Instrumentation Co., Engineering Consultant operating the
Uniroyal-Goodrich traction tester; Russell Alger, Group Leader, Snow Research Institute,Keweenaw Research Center, providing the Saab and the snow data; Byron Young, Techni-cian and operator of the CRREL Instrumented Vehicle, who collected and reduced the CIVdata; and Paul Richmond, who assisted with the CIV during the winter of 1993. The authoris also grateful to Mark Lucier for his assistance in operating the Saab friction tester; MichelinAmericas Research and Development Corporation, owners of the Uniroyal-Goodrich trac-tion tester; Paul Richmond and George Blaisdell for reviewing the paper; Maria Bergstad forediting; and William Bates and Thomas Vaughan for drafting the figures.
The contents of this report are not to be used for advertising or promotional purposes.Citation of brand names does not constitute an official endorsement or approval of the use ofsuch commercial products.
""

CONTENTS
Preface .......................................................................................................................... UiIntroduction ................................................................................................................. 1Traction test methods ................................................................................................. 1
Saab friction tester .................................................................................................. 1Uniroyal-Goodrich traction tester ....................................................................... 2CRREL Instrumented Vehicle ............................................................................... 2
Surfaces tested ............................................................................................................. 2Reporting results and terminology .......................................................................... 3Factors influencing traction ....................................................................................... 3Results .......................................................................................................................... 5
Traction curves for each surface .......................................................................... 5Traction coefficients .............................................................................................. 6
Conclusion .................................................................................................................. 8Literature cited .......................................................................................................... 9Appendix A: Vehicle instrumentation and samples of graphic output ............... 11Appendix B: Comparison of measured traction coefficients with published and
predicted values ................................................................................................... 15Abstract ........................................................................................................................ 19
ILLUSTRATIONS
Figure1. Terrain profiles ................................................................................................ 22. Generalized g-slip curves for different surface materials ............................. 43. Variation in g--slip curves from different tire designs .................................... 44. Location and relative value of the different traction coefficients based on the
calculation method and shape of the lp-slip curve ................................. 45. Typical gt-DW curves for six winter surfaces ...................... 56. Comparison of surface traction by test method and reporting method ....... 67. Comparison of four methods of reporting traction coefficients using CIV
test data ..................................................................................................... 78. Comparison of the test data between the Saab and the CIV ............................ 79. Comparison of p measured with the Uniroyal-Goodrich traction tester and
and the CRREL Instrumented Vehicle ........................ 8
TABLES
Table1. Tire characteristics ............................................................................................ 22. Factors influencing traction ............................................................................ 33. Net traction coefficients .................................................................................... 6
iii

Three Approaches to Winter Traction Testing
SALLY SHOOP
INTRODUCTION winter environments including ice, snow, and as-phalt runway surfaces. We compare these traction
Traction of tires or other running gear on differ- test vehicles, point out some of the differences in theent surfaces can be measured in many different ways collection, reduction, and reporting of traction, andwith widely varied equipment (i.e., single wheel establish a basis for comparison and future collabo-testers, fixed slip testers, drawbar tests, and instru- ration among the various traction testing commu-mented vehicles). Before the 1970s, vehicle traction nities.was generally measured by performing a drawbarpull test, where the amount of pull a vehicle couldproduce was measured using a load cell attachedto the rear of the vehicle. With advances in electron- For each surface tested, the vehicles traversed theics, drawbar tests have been augmented by new test- same distance, one after the other, operating besideing equipment where traction is measured at each the wheel path of the previous vehicle. The speedindividual wheel and tests can be computer con- of the vehicles was held at 8 km/hr (5 mph) in ac-trolled. This enables the traction equipment and cordance with the speed range specified by SAEtechnique to be designed specifically for each test (1985). (This is the normal test speed of the ClV andpurpose. the U-G, but the Saab normally measures friction
For testing the traction qualities of new tire or at a base vehicle speed of 64 km/hr.) Although thetread designs, the Uniroyal-Goodrich (U-G) trac- three traction test vehicles measure traction in thetion tester is equipped to measure efficiently or rap- same basic way, using a torque or load cell on oneidly the traction of many different tire classes. To or more instrumented wheels, the design and oper-assess friction on a runway surface for safe aircraft ation of each vehicle differs according to its purpose.landing, the Saab friction tester is designed to mea- Details of the instrumentation of each of the vehi-sure traction at a fixed value of braking slip using a cles as well as samples of their graphic output arescaled airplane tire. For vehicle traction and mobili- provided in Appendix A.ty research, the CRREL Instrumented Vehicle (CWV)is capable of performing a variety of mobility tests Saab friction tester(traction, resistance, maneuverability) using differ- The Saab measurement of braking traction cor-ent tires, traction aids, and vehicle configurations on relates well with the actual braking ability of aircrafta wide range of terrain surfaces. Although other trac- (Yager et al. 1988). At the rear of the vehicle is antion test devices exist, these vehicles represent well- instrumented fifth wheel that is lowered to contactknown, state-of-the-art equipment for three major the pavement at a set vertical load (Fig. Al). Thetraction testing communities. The test procedure and wheel is geared to operate at an angular velocity thatdata analysis are different for each vehicle; each is is lower than that of the drive wheels. This resultsdesigned for optimum operation for its specific pur- in a continuous 12% braking slip, and the conse-pose. quent axle torque is measured and converted to a
To tap the resources and experience of each of friction coefficient. The standard test tire is a Fric-these three traction measurement groups, a compar- tion Tester AERO 4.00-8 in. made of natural rubberison of test method and data reporting was per- (shore hardness 60) with circumferential groves,formed. The three vehicles were used to measure simulating an aircraft tire (Table 1).traction in side-by-side tests on surfaces typical of The friction and vehicle speed are recorded and

Table 1. Tire characteristics, such as driving or braking traction, motion resis-
CIV and Satance, and steering maneuvers (Berliner and Shoop1991, Shoop 1992). For the driving traction test per-
Design All-season radial, Aircraft tire with circum- formed in this study, the vehicle was placed in front-mud and snow ferential grooves wheel drive and vehicle speed was held constant
Tire size LT235/75 R 15 4.00- x 8-in.Tread width 15.7 cm 5.5 an using the rear brakes while increasing torque wasInflation pressure 180 kPa 700 kPa applied to the front axle. Thus, the tractive force wasNormal load 6200 N 1400 N measured at both front wheels over a range of wheelContact area 3645 cm 2 31.6 cm 2 slips, similar to the technique used by the U-G tester.
plotted every meter. For this study, the friction was At least eight tests were performed on each surface.
measured over a distance of 121 m (400 ft) and av- Each test series was summarized by collating theeraged every 33.3 m (100 ft) as shown in Figure A2. averages, standard deviations, and averaged peak
This test setup was repeated three times for each traction in a variety of graphs such as the traction
surface. curves shown in Figure A7.
Uniroyal-Goodrich traction tester SURFACES TESTEDThe U-G traction tester measures the driving trac-
tion of tires in snow for the tire and automobile in- Six conditions were tested, representing a va-dustry. It is fully automated to measure traction at ety of winter surfaces and a wide range of traction
one instrumented wheel and is designed for per- values. Air temperatures and snow depths and den-
forming numerous tests quickly. The vehicle is a sities were measured as well as snow temperaturerear-wheel-drive Chevrolet C-10 one-half-ton pick- at a depth of 2.5 cm or at the bottom of the surfaceup truck. The right rear axle is instrumented with snow layer. A sketch of the profile of each test sur-
an orthogonal load cell to measure the fore-aft and face is shown in Figure 1.vertical forces on the tire. The rear of the truck has a Surface Profiles Air Temperatureweight system for adjusting the vertical load on theback axle, as well as an automated, self-contained a 3. 2 m 0.o Snnow -2*cjacking unit and a special wheel retention system , M, -,.c
(knock-off hub) for increasing the ease and speed Smooth Iceof testing numerous tires (Fig. A3).
Traction tests are conducted by increasing the b ,,,,,l,-,,,,-17*C
driving torque to the test wheel while maintaining Rough Iceconstant vehicle speed (8 km/hr) by braking the oth-er wheels. The torque is increased gradually using .an automatic throttle, until the desired maximum ý 2.5 cm ::.:::0.250 lcm3.•W nw _2Ctire spin is achieved. Generally, 10 spinups are con- 1 -cducted in a single pass over the test section. In each Hard-packed Snow
spinup, traction is measured over a range of wheelslips covering a distance of approximately 10 m. The d, .......full traction-slip curve is recorded for each spinup ::.; : il -7-Cand then averaged over the 10 spinups (Fig. A4). For i i0 6.'! !546:0 • c/: 3 :Sno'w -17*C
commercial tire testing (SAE 1985), this test sequence ..... ......... ..is performed three times, each on a different day.An average of the traction coefficient over a speci- 7/7 .77/7/ 77//,7/fied range of slip or Differential Interface Velocity Hard Surface (Ice)(DIV) is then calculated for comparison among tires.
The Uniroyal-Goodrich tester was configured e.......with the same tire as the CIV for the comparison an2°*. -0.6"Ctests: a standard mud and snow radial (Table 1). Hard-packed Snow
CRREL Instrumented Vehicle f ///////7,/////////////17/// - 17°CThe CIV differs from the U-G tester in that all four Apha
wheels are independently instrumented (Fig. A5 andA6) so the vehicle can be used for a variety of tests Figure 1. Terrain profiles.
2

REPORTING RESULTS AND TERMINOLOGY 2. SAE p is an average of the p obtained between
Traction is a function of the relative movement a DIV of 3.2 and 24 km/hr (equivalent to a skid of
between the wheel and the test surface, reported as 40 to 300% or a slip of 28 to 75% for vehicle speed ofskid (S [ISTVS 19771), slip (i [ISTVS 1977]), or differ- 8 km/hr). This represents the traction available at
ential interface velocity (DIV), also called slip speed high sips rather than specifically optimum traction.or longitudinal slip velocity (SAE 1992), where 3. p. at 12% slip is the value occurring when thetest wheel is slipping at 12% (DIV of 1.1 km/hr for
DIV = V,- V, (1) vehicle speed of 8 km/hr).4. Averaged peak p represents the optimum trac-
S = (Vv - Vv)/ Vv = DIV/ V, (2) tive performance over a range of operating slips; itis calculated by taking the average of the top 20% of
i = (Vw - Vv)/VV = DIV/V. (3) values.,= velocity of the vehicle, and There are other commonly used traction coeffi-
cients including that at 20% slip used by WaterwaysVw = (theoretical) longitudinal velocity of the Experiment Station (based on numerous traction
wheel (i.e., rolling radius x angular veloc- tests on soil where the traction curves leveled off toity of wheel). a nearly constant value by 20% slip), and. at 15% slip
used by agricultural engineers because it corre-The different terms developed from the way in sponds to the limiting slip for avoiding substantial
which the test is run. Since a drawbar pull test is soil compaction. Another useful representation ofgenerally performed at constant engine rpm or con- the traction-slip equation is efficiency (or work opti-stant wheel speed, the definition of slip in eq 3, with mum coefficient [SAE 19671), which is p(1 - i).the constant wheel speed in the denominator, fullydescribes the test from 0 to 100% slip when the ve- FACTORS INFLUENCING TRACTONhide has been pulled to a stop. However, when run-ning a constant vehicle speed test, such as is com- The factors that affect traction can be placed intomon for snow traction testers and instrumented ve- two groups: those variables related to the terrain andhicles, eq 2 (defined as longitudinal slip by SAE and those related to the tire (Table 2).as skid by ISTVS) more dearly defines the measure-ment because the constant vehicle speed is in the Table 2. Factors influencing traction.denominator. To add to the confusion, the SAE(1992) defines slip ratio, longitudinal slip, or percent Terrain surface Tire
slip the same as skid above; wheel slip the same as slip conditions conditions
above; and wheel skid as an occurence and not a Surface material Inflation pressuremathematical expression. The use of longitudinal Macro texture Sizeslip velocity or DIV clarifies the measurement, and (slope and obstacles) Rubber compoundits merit has been the topic of many discussions (Lis- Micro texture Temperature
Moisture Tread designton 1977). The remainder of this paper will refer to Uniformity Load
either slip or DIV using the definitions given in eq I Temperature Structure
and 3.All these vehicles measure net traction and di- Each of these variables affects not only the mag-
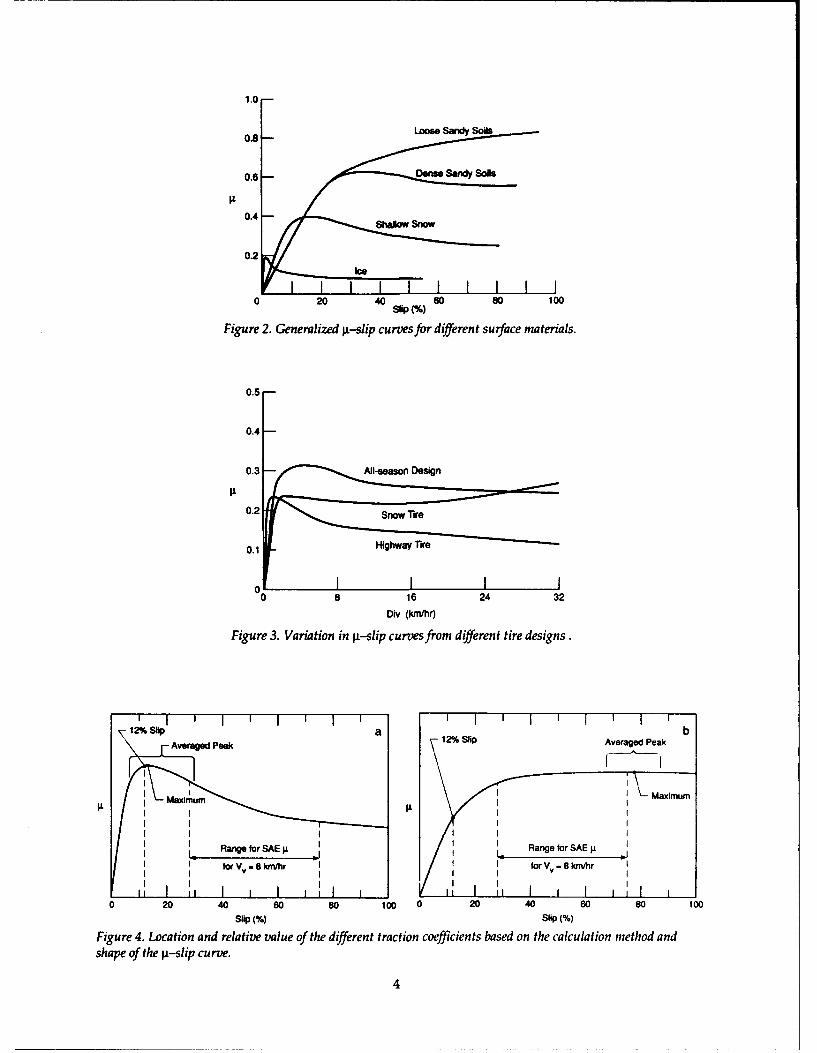
vide it by the measured vertical load to obtain a trac- nitude of traction but also influences the shape oftion coefficient, gt (ISTVS 1977), also called net trac- the p-slip curve. For example, traction on ice is usu-tion ratio (ASAE 1990). Because p varies with slip, it ally lower than traction on soils, and the shape ofis often reduced to a singular value based on its the p-slip curve can be very different. Where a trac-maximum, or it is averaged over a range of slip (or tion curve on soil may be a smooth hyperbolic shape,DlV). Several different methods of reporting trac- the traction curve on ice usually has a strong sharption, and their merits, are discussed in Domeck peak at low slips and then very abruptly decreases(1982) and Woehrle and Wozniak (1989). There are to a constant value. The idealized p-slip curvesfour reporting methods that are standard practice shown in Figure 2 illustrate how curves may varyfor these three approaches to traction testing: with terrain.
1. Maximum p is the singular maximum value or Even on the same surface material, the tractionan average of a small amount of data (3%) surround- curve shape changes with the tire type, as seen ining the maximum. Figure 3 for three radial tire designs on the same
3
1.0
0.8-LmSadSol
0.6-Dm SnySk
IL0.4 -SalwSo
0.2Ice
0 20 40 60 s0 100W~ M%
Figure 2. Generalized p.-slip curves for different surface mnaterials.
0.5-
0.4-
0.1 Highway Tire
0 L- I I
Div (Km/hr)
Figure 3. Variation in li-slip curves from different tire designs .
Averged ealk12% lipAveraged Peak
I MaximumIL ILAi
Rangefor SE ILRange for SAE g
0 2 4 60 80 100 0 0 4 80s 100SUiP N% Si~p (%)
Figure 4. Location and relative value of the different traction coefficients based on the calculation method andshape of the p~-slip curve.
4

medium-packed shallow snow (Domeck 1982). RESULTSWhile the standard highway tire and all-season de- Traction curves for each surfacesign have a definite peak traction coefficient fol- The shape and magnitude of traction curves islowed by a decreasing slope in the curve, the snow the result of a complex interaction between the tiretire shows no initial peak and maintained a high and the terrain, and the curve shapes obtained intraction coefficient (even increasing slightly) at high this study varied accordingly. Characteristic DIVD[Vs. curves for each of the six surfaces tested, obtained
The shape of the curves is indicative of the be- with the same tire and loading, are shown in Figurehavior of the surface material. Generally, behavior 5. The curves were gathered using the CIV, with thecan be related to whether surface material is loose exception of the snow test section data from the U-or compact and therefore fails with compactive or G traction tester. The similar curve shape for thedilatant behavior under the stress applied by the tire. groomed snow test section and the snow road re-Similarly, a peak in the traction curve may indicate flect the similar terrain profiles of these two surfac-adhesive or apparent cohesive behavior, due to fric- es (refer to Fig. 1). The lower values for the snowtional interlocking of terrain particles or interlock- road are a direct result of the lower snow densitying of the terrain and the tire tread. and higher temperature (much closer to melting
As the curve shape changes, the peak occurs at temperature).different values of slip. For instance, with a peaked While the initial curve is the same for both icecurve typical of snow, ice, and dense granular soils surfaces, with the rough ice slightly greater, the small(Fig. 4a), the SAE g is lower than the maximum g. amount of snow on the smooth ice has a beneficialOn the other hand, for conditions where traction effect on traction that is not reflected in any of theincreases, or remains constant with increasing slip, methods for calculating g because it occurs at verythe maximum p may equal SAE g (Fig. 4b). high DIV. This gentle increase was seen in all eight
0.20 I I I II I I
0.16 a) 0.16 b)
0.12 0.140.12
0.08 0.10
0.04 Ice with Snow 0.08 Rough Ice
0 1 1 0.060 20 40 60 0 20 40 60
0'4 1 o.S I I I I I I I I I 1 ,
0o.3. c) 0.4 d)
p.... .0.20.2 0.2
0.1 Snow Test SectionSnow Road 0.1 (1992)
0 - I I I 1 0 , ; I I ,0 20 40 60 0 2 4 6 8 10 12
0 ._ I I I I I I I I I I I I I I
0.4 e) 0.8
0.3 0.6
0.2 0.4Snow Test Section
0.1 (1993)0.2 Asphalt Runway
o r . I __ I I - I I I I . I , I , I I
0 8 16 24 0 2 4 6 8 10 12
DIV (km/hr)
Figure 5. Typical g-DIV curves for six winter surfaces.
5

tests on the ice with snow but was not seen when er measurements on similar surfaces and with pre-testing on bare ice. The distinctive shapes of these dicted values are also given in Appendix B.curves directly affect the relative value of g, depend- The bar chart (Fig. 6) shows the traction coeffi-ing on the particular calcuLat on method, as shown cients for each of the surfaces, grouped by vehiclein Figure 4. and data reduction method. Arranging the surfac-
es, from slippery (smooth ice) to tractive (asphaltTraction coefficients runway), results in the same ranking, independent
The Saab friction tester measures only the pi at of test vehicle and data reduction scheme. The ex-12% slip, and the U-G tester routinely reports both ception is the two snow test sections measured withthe SAE gi and a maximum (peak) pi. The CIV rou- the U-G, whose curve shape changed from gentlyt~acly reports an averaged peak traction value, but decreasing in 1992 (Fig. 5), resulting in low SAE, tofor this study the data were also used to calculate relatively flat in 1993 where Max. and SAE are near-the other traction coefficients. A summary of the re- ly equal.sults for all three vehicles on each of the surfaces To compare the four different gi calculations, thetested is assembled in Table 3. Values reported are CIV data are shown in Figure 7 grouped by test sur-for net traction. The motion resistance measured face. For all surfaces, the maximum pt is greatest, fol-with the CIV can be used to obtain gross traction lowed by the averaged peak and 12% slip values,for the CIV and U-C, which used the same tire and and the SAE gi is consistently lowest. Aside from thetire loading conditions. This is done in Appendix B. 1993 snow test section, which had a relatively flatComparisons of these traction coefficients with oth- gi-DIV curve, the range of the pa values becomes pro-
Table 3. Net traction coefficients.
Untroyal-Goodrich Saab __ CIV_Max. 12% Max. Avg 12%(3%) SAE slip. (sink pk Ali SAE
a. Smooth ice with snow - - 0.03 0.14 0.12 0.09 0.05b. Rough ice 0.18 0.08 0.09 0.18 0.15 0.13 0.08c. Snow road - - 0.13 0.31 0.26 0.25 0.18d. Snow test section ('92) 0.36 0.19 0.24 - - - -
e. Snow test section ('93) 0.34 0.31 - 0.36 0.32 0.31 0.30f. Asphalt runway 0.69 0.57 0.58 0.72 0.64 0.57 0.51
CRREL Instrumented Vehicle.
I Ice w/Snow 0 Snow Road 0 Snow Test Section '92
[ ice I Snow Test Section '93 I Runway
0.8
0.6-
0.4 -
Max. SAE 12% Max. Avg 12%/6 SAEPeak
U-G Saab CIV
Figure 6. Comparison of surface traction by test method and reporting method.
6

08
- Max.
0.6 C] Ave. Peak0 12% slip0 SAE
0.4-
0.2
0LIce w/Snow Rough Ice Snow Road Test Section Runway
(0993)
Figure 7. Comparison offour methods of reporting traction coefficients usingCIV test data.
]Saab0.6- civ
0.4-
0.2-
Ice w/Snow Rough Ice Snow Road Runway
Figure 8. Comparison of the test data between the Saab and the CIV.
gressively larger as the operating surface becomes measure the same values for the ice surface and dif-more tractive. The wide range of traction coefficients fer by only 3 to 11% on the snow test section andon the airport runway could also be caused by scat- the asphalt runway. Because the tire conditions wereter in the data due to small patches of hard-packed the same, this small difference is likely due to un-blown snow. avoidable experimental variations (e.g., snow patch-
Accurate comparisons between the vehicles are es on the runway surface).possible when the same gi reporting method is used. Considering the differences and similarities of theIn Figure 8, g at 12% slip measured with the CIV vehicles and test techniques, one might now askand the Saab reflect the contrast in the test tire char- "which is best?" Certainly, the agreement betweenacteristics (Table 1) and the fact that the Saab test the vehicles is very encouraging when the effects ofuses braking traction while the CIV uses driving trac- tire design are considered. At the same time, theretion. The CIV tire has higher traction on snow (by is a large difference between the traction coefficient48%) and ice (30 to 67%), where the aggressive tread based on the g calculation technique (particularlypattern and rubber compound are more effective, for the more tractive surfaces), although the relativeand the aircraft tire performs best on the runway, ranking of surfaces is consistent. The best tractionas per its design. value is that which most closely reflects the specific
Figure 9 compares the U-G tester and the CIV, application. Because the Saab measures traction toreporting both maximum and SAE g. The vehicles assess safe aircraft brakin& traction at 12% braking
7

0.8
_ Uniroyal-Goodrich
0.6 -- 0.6
EE 0.4 0.4
=LW
0.2 0.2 -
Rough Ice Test Section Runway Rough Ice Test Section Runway(1993) (1993)
Figure 9. Comparison of yi measured with the Uniroyal-Goodrich traction tester and the CRREL InstrumentedVehicle.
slip is logical. The SAE g• represents a conservative imum gi is consistently greatest, followed by the av-estimate of traction available to an untrained driver eraged peak and 12% slip values, and the SAE p• iswho tends to operate at high slip when faced with consistently lowest.difficult or slippery surface conditions. Conversely, 2. The test surfaces covered a wide range of trac-the peak g represents traction at the optimum per- tion coefficients, from 0.03 on smooth ice to 0.72 onformance. The comparison and agreement between the asphalt runway. The ranking of the test surfac-test equipment and methods enhances possibilities es, from slippery to tractive, was generally the samefor future cooperation and collaboration among the regardless of the test vehicle or data reductionvarious traction testing communities. It also frees the scheme (Table 3, Fig. 6).test or research engineer to choose the best test meth- 3. With the significant differences among theod, reduce the data to meet the application, and be methods of reporting gI (particularly for the moreconfident that the results can be compared with oth- tractive surfaces), the best value is that which moster test methods. closely reflects the specific application. The maxi-
mum and averaged peak values indicate optimum
CONCLUSION tractive performance, but to assess safe aircraft land-ing, it is logical to measure traction at 12% braking
Three very different state-of-the-art instrument- slip. For comparing the snow traction of varioused vehicles were compared in side-by-side traction tires, the SAE pt represents a conservative estimatetests on six winter surfaces. . CRREL Instrument- of traction available to the untrained driver whoed Vehicle is a versatile instruinented vehicle used tends to operate at high slip when faced with diffi-for vehicle mobility research, the Uniroyal--oodich cult or slippery surface conditions.traction tester is used for commercial tire testing C,£- 4. Using the same gi reporting method, the agree-snow using the SAE standard method, and the Saab ment between the CIV and the U-G tester (using thefriction tester is the most sophisticated of the sever- same test tire) was consistently excellent (Fig. 9).al FAA-approved methods for measuring runway However, differences between the Saab and the CIVfriction. Four methods of reducing the 1-slip (or (Fig. 8) are based on tire performance. The aircraftDIV) curves to a representive traction coefficient tire (Saab) performed better on the runway, and thewere used. The following points summarize the all-season tire (CIV) performed better on snow andfindings of this investigation: ice.
1. Each surface has a distinctively shaped g•-DIV The results of this study form the basis for com-curve, with similar surfaces yielding similar curve parson and collaboration between the various trac-shapes (Fig. 5). Because of the differences in curve tion testing communities. This information may al-shapes, the magnitude of peak p and its relation- low the development of a standard practice for trac-ship to slip-specific p values (i..e., 12% slip and SAE tion testing and reporting that can be used by allp) varies with the surface material. Even so, the max- traction testers.
8

LITERATURE CITED
ASAE (1990) Uniform terminology for traction of SAE (1985) Passenger car and light truck tire dynam-agricultural tractors, self-propelled implements, and ic driving traction in snow. SAE Recommendedother traction and transport devices. ASAE Standard Practice, SAE J1466 OCT85. Warrendale, Pennsylva-$296.3. St. Joseph, Michigan: American Society of nia: Society of Automotive Engineers.Agricultural Engineers. SAE (1967) Off-road vehicle mobility evaluation.Berliner, E. and S. Shoop (1991) Instrumentation for SAE Recommended Practice Handbook Supple-vehicle mobility testing in the Frost Effects Research ment, SAE J939. Warrendale, Pennsylvania: SocietyFacility. In Proceedings of the 2nd International Sym- of Automotive Engineers.posium on the State of the Art of Pavement Response Shoop, S.A. (1992) Precision analysis and recom-Monitoring Systems for Roads and Airfields, ASCE, Sep- mended test procedures for mobility measurementstember, p. 12-26. made with an instrumented vehicle. USA Cold Re-Domeck, D.C. (1982) Winter tire testing as seen by gions Research and Engineering Laboratory, Specialthe independent tester. Presented at the SAE Inter- Report 92-7.national Congress and Exposition, Detroit, Michi- Woehrle, W.J. and R.J. Wozniak (1989) Tire trac-gan, Paper 820344. tion-Matching product and test technologies. SAEISTVS (1977) International Society for Terrain Ve- Paper 890102. Warrendale, Pennsylvania: Society ofhicle Systems Standards. Journal of Terramechanics, Automotive Engineers.14(3)' 153-182. Yager, T.J., W.A. Vogler and P. Baldasare (1988) Air-Liston, R.A. (1977) Drawbar-pull versus interface craft and ground vehicle friction correlation test re-velocity rather than slip. Presented at the 1977 An- suits obtained under winter runway conditions dur-nual Meeting of the American Society of Agricul- ing Joint FAA/NASA Runway Friction Program.tural Engineers, Raleigh, North Carolina, paper no. U.S. National Aeronautics and Space Administra-77-1057. tion, Technical Memorandum, NASA-TM-100506SAE (1992) Glossary of Automotive Terms. Warrendale, (N88-18582).Pennsylvania: Society of Automotive Engineers.
9

APPENDIX A: VEHICLE INSTRUMENTATION AND
SAMPLES OF GRAPHIC OUTPUT
1. Display 6. Mud flap2. Panel meter 7. Water tank outlet nozzle3. Control panel 8. Chain transmission4. Computer 9. Measuring wheel5. Water tank to wet test surface
Figure Al. The Saab friction tester.
mph f (M) 0.20 0.26 0.25 0.23
100 1.0 --- ------ I--- -
900 r-
RWY 05 80 0.8, -------------.----------------
60 0.8: -------- L-----I-----j----
T 10:33 50 ------------ ------ -------
*
DAY 11 40 0.41--------- 4------- ------
MON 02 30 L-------- --t-----~.'
/u ,' .... • .. ... e....e.. " * .. . .*
-. ------ Figu 1. Ire A2. Typical data from a Saab friction test on
Fag
o :20 0.6 .. .. . .. . .. ..- '. .. .. '
0.4 groomed shallow snow. Friction was measured over a* -~ distance of 121 m(400 ft) and avera ged every 33.3 m(100
YEA 2 10 ----- ---- 4 ---- ------ ft), as printled at the top of the graph. The vertical axis is* vehicle speed (solid line) and friction (circles), and the
0 0' ------- 1---------L----- ~ horizontal axis is distance (each block is 100 fi).
11

1. Box on left front for weights to unload right rear 11. 20 Mb hard drive2. Computer-controlled throttle 12. Daytronic Model 10KG data acquisition3. Keyboards and signal conditioner4. Data acquisition CRT 13. Self-contained hydraulic jack5. HP ink-jet printer 14. Air shocks to adjust vehicle attitude6. 2 kW Honda 115 Vac power generator 15. Tire chain to prevent slip of left rear7. Static load containment 16. Right rear housing contains orthogonal8. Optical encoder to measure ground velocity load cell to measure tire loads9. HP 9000 Series computer 17. Right rear wheel assembly contains optical
10. HP CRT encoder to measure test tire velocity
Figure A3. The Uniroyal-Goodrich traction tester (property of Michelin Americas Researchand Development Corporation).
a0.4
9
0.3 1
0.2 1-
a. Composite of al spinups, o.1
0.5
0.4
0. -
0.2 -
b. Average of 10 spinups. --
Figure A4. Traction coefficient vs. longitudi- 0 I I Inal slip velocity from the Uniroyal--Goodrich 0 5 10 15 20 25traction tester on groomed shallow snow. Longitudinal Slip Velocity (km/hr)
12

1. Sonic velocity sensor for true vehicle speed 13. Fenders cut to accommodate 16.5-in tires2. Secondary alternator to power data acquisition 14. Control valves for front, rear, and drive shaft3. Stepper motor for automatic throttle control brakes4. Readout for 5th wheel and sonic speed sensor 15. Torsion bars for body torque stability5. Computer mounted on passenger side 16. Proximity gauge to measure wheel speed6. Data acquisition, printer, and accessories on each wheel7. Power inverter 17. Triaxial load cells on axle housing of each8. Shore/inverter power switch wheel9. 110 Vac power intake 18. Speed indicator pins inserted into each brake
10. Remote control winch disk11. Dual-caliper brakes on each wheel 19. DC batteries12. Lock-out hubs on each wheel 20. Fifth wheel to monitor true vehicle speed
Figure A5. The CRREL Instrumented Vehicle.
Vertical
Leck-Of claugHub
Uned Call
IndleloPna
TransverseFigure A6. Configuration of speed sensors and axle-
Longitudinal mounted load cells.
13

0.18 I I 0.4 I I
0.16 Rough Ice 0.3 Snow Road
0.14 003±0.12 3±0.2 - 0 0
0.10 a 00 oo 0
o 0oe_ 0 0.1 0 o
0.068 0 I
0 20 40 60 0 20 40 60
0 .2 0 1 , I 1 1 , I ' I I I ' I -
0.16 Ice with Snow 0.8
3± 0.12 0 3±0.6 0 0
0 % 000 a
0..08 0 0 0.4
0.04 0.2 Asphalt RunwayS0 .2R u w y0 i I •I ,0 20 40 60 0 2 4 6 8 10 12
DIV (km/hr) DIV (km/hr)
Figure A7. Typical graphical output from the CRREL Instrumented Vehicle for four of the test surfaces.
14

APPENDIX B: COMPARISON OF MEASURED TRACTION COEFFICIENTSWITH PUBLISHED AND PREDICTED VALUES
Predicted gross traction based on equations giv- where Tg is gross traction, Tn is net traction, anden in Richmond et al (1990) is in good agreement MRterra.n is the external motion resistance attribut-with measured gross traction on similar surfaces able to deformation of the terrain material.(Table B1). The equations used to calculate measuredgross traction and predicted gross traction are giv-en below. Comparisons of published and predicted REFERENCEStraction coefficients for ice and shallow snow are Blaisdell, G.L. (1983) Driving traction on ice withshown in Table B1 and Figures B1 and B2. all-season and mud-and-snow radial tires. USA
Traction prediction equation for undisturbed Cold Regions Research and Engineering Laborato-snow: ry, CRREL Report 83-27.
Tg = 0.851 N0-823 Blaisdell, G.L and S. L Borland (1992) Braking trac-tion on sanded ice at low slip rates. Prepared forFederal Aviation Administration, Washington, D.C.
for hard-packed snow: by USA Cold Regions Research and EngineeringTg = 0.321 NO.97 Laboratory.
Clark, S.K. (1982) Mechanics of pneumatic tires. U.S.Department of Transportation, U.S. Government
for undisturbed snow over ice: Printing Office, Washington, D.C.=0.127N Richmond, P.W., G.L. Blaisdell and C.E. Green
T(1990) Wheels and tracks in snow: Second valida-
tion study of the CRREL shallow snow mobilitywhere Tg is gross tractive stress and N is the normal modeL USA Cold Regions Research and Engineer-stress under the tire or track (kPa). ing Laboratory, CRREL Report 90-13.
Society of Mining Engineers (1973) SME MiningGross Traction: Engineering Hati..ook. New Yorlc Society of Mining
Engineers of the American Institute of Mining, Met-Tg = Tn + MRterrain allurgical, and Petroleum Engineers, Inc.
Table B1. Measured, published, and predicted traction coefficients.
"TIb T"C T9 T9Tn' published rules of thumb MRerrind measured predicted
Smooth ice with snow 0.12 0.08,0.11 - 0.022 0.14 0.17Ice 0.15 0.12-W0.28 0.12 0.0015 0.15 -Snow road 0.26 - 0.20 0.03 0.29 -Snow test section (°93) 0.32 0.28 0.20 0.009 0.32 0.28
a CIV average peak from Table 3.b Published values on similar surfaces (also measured with CIV).
Values for buffed and steamed ice at -100 C and -3*C (Blaisdell and Borland 1992).Range of values for "natural" ice (Blaisdell 1983).CIV with same tire and tire loading in 6 cm of 0.59 g/cm 3 snow (Richmond et al. 1990).
c Society of Mining Engineers (1973) traction values used to estimate haulage on ice and packedsnow.
d Measured during this study (based on subtracting hard surface motion resistance from totalmotion resistance measured using a static vehicle calibration).
15

: Data fromTablss3aWdB1a Date froOther Refw wmwmn:::::::::::::'::::~ ice : : : .m .l=rm •R nm0 : O PredictId Gross; TrecSon
*~Ls~a12% Sip
0 LcN: P•ek A ' . .: : : : : : . .. 055. .cm 3
'a PO MaxSnow over Smooth Ice
.. . . . .Slp . . . . . . . .. . . . . .
90 Ave. Peak (gw' . "
0 IL SPredicted, Snwover Ice
J0.. v: Max
.0. Pc Iv" Ave. Peak . . . .. . . .. . . . .
CIV Rough ice
0 ti * SAE
* , ay Ave. Pek . . . . .. . . .
* ~ ~ Ubufodice (Blazeel 198 3)0 I BufedIceat 30 C (BlaiMedl and Bofland 1992)
* .: UBuffed Ice at -100 C (Blaisdell and Borland 1992)a * , 1973) . .. , .( . o1. 9.7
. .. . Rule.f.T. umb. . . . . . . . . .. . . .
. .. . . . . . . ............. . . .
0 0.2 0.4 0.8Traction Coeffident (j.L)
Figure B1. Measured, published, and predicted values of traction on ice.
16

DRIM trf T11bgs 3 end 81
Snow:: Is Daetafrom 01M erfurences: : .: : P OPedisd Grose Traction
.. . . :: : . . . Ave.Peak : Road'0 .I 12 .Si Road
2.5 CM. 0.25 g'cM3
c0 pIIv Ave. Peak (gross): :
SnowTe• Secton 2:: : : : :j 10c 0.54 n •3** u.12%S&Ip Snwoe adPc
Snow TeeSection V3
:e JIaV Ave. Peak . . fOT~SOIf .3SJCIV12%SP. . . .I2cmO59cm
S... .... .... ... Snow over H-ard Packi~ ~ ~ ~ ~ ~~ ~ ~~~(a z -! °IuGAi!!ii!(r=0.6, C. Tsnow=-2.80C)
•ii~ ipii ii 'e& SAEii i i :S... C. 'v e. Peak (gr
It IL~jAvw~.Pea(ne) 8 CM, 0.59 W=32 Groomned: : lv'Ave. Peak (groes) : mdPaked Snow
IIL PackedSnow(SME 19M3) (rlchmond t al. 10)
o ji i , Pred•ted. Hard.packed S0 P Udctd .H-cbcked Snow
.:" .S•6 Preicted. Undistbed Snow
0 02 0.4 0.6
Traction Coeicient (pL)
Figure B2. Measured, published, and predicted values of traction on shallow groomed snow.
17

Form ApprovedREPORT DOCUMENTATION PAGE OMB . 0o70 1
Public reporting burden for this collection of information is estimated to average I hour per response, inctuding the time ior reviewing instructions. searcting eJsting data sources, gathe0;g7dmaintaining the data needed, and completing and reviewing the collection of information Send comments regarding this burden estimate or any other aspect of this coaection of inWfiration.including suggestion for reducing this burdil. to Washington Headquarters Services, Directorate for Information Operations and Reports. 1215 Jefferson Davis Highway, Suie 1204. Art iglon,VA 22202-4302, and to the Office of Management and Budget. Paperwork Reduction Protect (0704-0188). Washington. DC 20503
1. AGENCY USE ONLY (Leave blank) 2. REPORT DATE 3. REPORT TYPE AND DATES COVEREDI July 1993
4. TITLE AND SUBTITLE 5. FUNDING NUMBERS
Three Approaches to Winter Traction Testing PR: 4A762784AT42TA: CS
6. AUTHORS WU: 007
Sally A. Shoop
7. PERFORMING ORGANIZATION NAME(S) AND ADDRESS(ES) 8. PERFORMING ORGANIZATIONREPORT NUMBER
U.S. Army Cold Regions Research and Engineering Laboratory72 Lyme Road CRREL Report 93-9Hanover, New Hampshire 03755-1290
9. SPONSORING/MONITORING AGENCY NAME(S) AND ADDRESS(ES) 10. SPONSORING/MONITORINGAGENCY REPORT NUMBER
Office of the Chief of EngineersWashington, D.C. 20314-1000
11. SUPPLEMENTARY NOTES
12a. DISTRIBUTION/AVAILABILITY STATEMENT 12b. DISTRIBUTION CODE
Approved for public release; distribution is unlimited.
Available from NTIS, Springfield, Virginia 22161.
13. ABSTRACT (Maximum 200 wiords)
Traction on winter surfaces was measured using three test vehides, each designed to measure traction for adifferent purpose: vehicle mobility research (CRREL Instrumented Vehicle), commercial tire testing (Uniroyal-Goodrich traction tester), and airport runway safety (Saab friction tester). The traction measured with eachmethod is comparable, but there are systematic differences due to the effects of the surface material and thetest and analysis technique. This comparison serves as the fundamental basis for collaboration between thevarious traction testing communities and illustrates the need for well documented test procedures and dataanalysis as a standard for traction testing and evaluation.
14. SUBJECT TERMS 15. NUMBE•jF PAGESMobility Soil Tires Vehicle 2
Runway Strength Traction Wheel 16. PRICE CODESnow Terrain Trafficability
17. SECURITY CLASSIFICATION 18. SECURITY CLASSIFICATION 19. SECURITY CLASSIFICATION 20. UMITATION OF ABSTRACTOF REPORT OF THIS PAGE OF ABSTRACT
UNCLASSIFIED UNCLASSIFIED UNCLASSIFIED
NSN 7540-01-280-5500 Standard Form 298 (Rev. 2-89)Proiew by ANS Slid Z30182M-102

0
0S0
b- (D <
00 >
LU L
0