ukraine grain and feed annual grain and feed annual report gain publications/grain and feed... ·...
TRANSCRIPT

THIS REPORT CONTAINS ASSESSMENTS OF COMMODITY AND TRADE ISSUES MADE BY
USDA STAFF AND NOT NECESSARILY STATEMENTS OF OFFICIAL U.S. GOVERNMENT
POLICY
Date:
GAIN Report Number:
Approved By:
Prepared By:
Report Highlights:
Production of wheat, corn and rye in Ukraine in MY 2014/15 are forecast to decrease mainly due to lower
projected yields. A dramatic increase in input costs for agricultural producers is expected to lead to lower input
use, thus negatively affecting yields and output. Ending stocks for major grains are expected to remain at
average levels while exports are projected to finish MY 2013/14 at record high levels for Ukrainian corn and
wheat. Domestic consumption of feed grains in the new season may be conditioned by economic situation in the
country and the opportunities for growth in industrial poultry and pork production.
Yuliya Dubinyuk, Agricultural Specialist
Randall J. Hager, Agricultural Attaché
Grain and Feed Annual Report
Grain and Feed Annual
Ukraine
UP1412
4/1/2014
Required Report - public distribution

GAIN Report – UP1412 – Grain and Feed Annual Report Page 2 of 30
UNCLASSIFIED USDA Foreign Agricultural Service
Executive Summary:
A record corn crop and good wheat production in Ukraine in 2013 resulted in high stocks and large surplus of
grains available for export. Ukraine is expected to harvest another good crop in MY 2014/15, led by corn and
wheat..
Wheat production in MY 2014/15 is forecast at 20 Million Metric Tons (MMT), a decrease of about 13 percent
based on slight decline in the winter crop area and average yields. Exports of wheat in the new season are
anticipated to remain high, at about 9.5 MMT compared to expected 10 MMT in the current season.
Corn production in MY 2014/15 is forecast at 20 percent below the previous season mainly due to lower expected
average yields. Lower input use and deficiency in subsurface moisture available at the start of corn planting in
spring 2014 are the main factors behind this forecast decrease in production. Corn exports in the new season are
expected at 17.5 MMT with less than 30 percent of the crop consumed domestically. Trade with the EU is
expected to remain strong while East Asia destinations are anticipated to gain larger share compared to the
previous season.
Barley production is expected to remain similar to the previous season with exports following the trend. The
Middle East would remain the major buyer.
Rye production is projected to decline in MY 2014/15 leading to lower domestic consumption and exports.
The Ukrainian currency devaluation in the last months resulted in greater commodity price fluctuations in the
domestic market and some reluctance to sell that was observed at the time of this reports writing.
$0.00
$50.00
$100.00
$150.00
$200.00
$250.00
$300.00
Jul-
09
Sep
-09
No
v-0
9
Jan
-10
Mar
-10
May
-10
Jul-
10
Sep
-10
No
v-1
0
Jan
-11
Mar
-11
May
-11
Jul-
11
Sep
-11
No
v-1
1
Jan
-12
Mar
-12
May
-12
Jul-
12
Sep
-12
No
v-1
2
Jan
-13
Mar
-13
May
-13
Jul-
13
Sep
-13
No
v-1
3
Jan
-14
Mar
-14
Ukraine Domestic Grains Prices (EXW, $/MT)
Milling Wheat Price (Ukr. 3rd Grade) Feed Wheat
Feed Barley Corn Price
Source: Information Agency APK-Inform

GAIN Report – UP1412 – Grain and Feed Annual Report Page 3 of 30
UNCLASSIFIED USDA Foreign Agricultural Service
An increase in input costs for agricultural producers that is already occurring is expected to translate into lower
use or application of cheaper (which in most cases means less effective) fertilizer and especially plant protection
means and seeds. In addition, relatively lower world agricultural commodity market prices in the current season
cut down on Ukrainian producer profits that also stimulate them to reduce input expenses for the new harvest and
to hold off on technology improvements that require large upfront expenditures.
Local currency devaluation in the last four months by about 40 percent affects input costs directly. According to
producer reports, while in the past five years average increase in production costs for some was about ten
percent annually (mainly improvements in technology and seed quality), the increase is reaching 20-30 percent
this time around. By the end of the season, the costs of production may go up even further.
Ukraine is expected to remain loyal to its trade partners in the current and new trade seasons while the industry
and the Government of Ukraine (GoU) try to find more new ways of make agricultural business more profitable
and attractive to investment.
0
5000
10000
15000
20000
25000
30000
35000
19
90
19
95
20
00
20
01
20
02
20
03
20
04
20
05
20
06
20
07
20
08
20
09
20
10
20
11
20
12
20
13
*
Area Planted under Main Agricultural Crops in Ukraine
Grains and Legumes Sugar Beet Sunflower Seed
Potatoes Vegetables Forage and Feed crops
Source: State Statistics Committee of Ukraine, 2013* - preliminary data
Thous. HA

GAIN Report – UP1412 – Grain and Feed Annual Report Page 4 of 30
UNCLASSIFIED USDA Foreign Agricultural Service
Commodities:
Production:
In 2014 wheat production is expected at about 20 MMT – a slight decrease from the previous harvest mainly due
to a slight decrease in harvested area and expected yields somewhat below last season’s (see PSD table in the
end of this section).
Winter wheat (as well as barley) planting in the fall 2013 was somewhat delayed by adverse weather conditions.
However, extended and warm fall season allowed the plants to develop better thus going into winter dormancy in
a generally strong condition (several tillers and strong roots). Over the winter season some regions in the country
saw less snow cover while others experienced temperatures well below freezing point (-10 – -20 degrees C) for a
number of weeks. According to the official Ukrainian Hydrometcenter reports, only about 6-10 percent of the
winter crops were in bad condition with expected losses of 1-2 percent.
The spring season has arrived early but temperatures were picking up slowly in most of the country. Plants came
out of winter dormancy adjusting well to the new growth season. Official field observations data shows that this
season winter wheat plantings had a chance to develop more tillers in early spring. This so far is indicative of
good prospective yields. Some reported shortage of precipitation over the winter season and dry early spring
conditions added to the already low subsurface moisture levels. The graph below shows comparison of
subsurface moisture levels for February-June period over the recent years.
Wheat

GAIN Report – UP1412 – Grain and Feed Annual Report Page 5 of 30
UNCLASSIFIED USDA Foreign Agricultural Service
Below is a map of Ukraine generated by satellite imagery that depicts vegetative development index (NDVI) as of
March 29, 2014. So far, there is enough green color through the country which indicated ‘better than normal’ plant
conditions. However, there is also some white and yellow color seen through the map that indicates worse than
normal vegetative growth mostly in the central and eastern parts of the country, as well as in the south.
According to Ukraine’s Hydrometcenter reports in late March 2014, central and southern regions (mostly Kherson,
Mykolayiv, Zaporyzhia, and Odessa oblasts) experienced a deficit of 40-50 percent in soil moisture, while overall
deficit in the country is estimated at 25-40 percent. At the time of this report writing, the soil as well as air moisture
deficiency in the country is expected to have some negative effects on the development of early spring crops and
may cut down winter crop yields as well. Thus, wheat production at this point is forecast to drop slightly in
comparison with that of the previous season.
Consumption:
High wheat production in MY 2013/14 and a good share of milling wheat along with decreasing wheat prices
stimulated continuous increase in wheat flour production for domestic consumption and for exports. The graph
below shows wheat flour production trends in Ukraine for the last several years. The domestic market is well
supplied by food grade wheat for the current season.

GAIN Report – UP1412 – Grain and Feed Annual Report Page 6 of 30
UNCLASSIFIED USDA Foreign Agricultural Service
0
50
100
150
200
250
Wheat Flour Production by Large Enterprises in Ukraine (1000 MT)
MY 2010/11 MY 2011/12 MY 2012/13 MY 2013/14
Source: State Statistics Committee of Ukraine
However, bread production has been decreasing in Ukraine over the recent years (see graph below) along with
the population. In addition, a minor increase in consumer incomes stimulated one of the recent trends in society –
switching away from purchasing ‘social’ types of bread in favor of premium bakery products and home bread
making. While large, mostly state, bread making enterprises have been reducing production quantities, various
private specialty bread producers have been opening up small stores and delivering to regular grocery stores in
larger cities catering to the changing tastes of consumers where majority of income increases occurred.
0
20
40
60
80
100
120
140
160
180
Production of Bread and Bread Products in Ukraine (1000 MT)
MY 2010/11 MY 2011/12 MY 2012/13 MY 2013/14
Source: State Statistics Committee of Ukraine
GAIN Report – UP1412 – Grain and Feed Annual Report Page 7 of 30
UNCLASSIFIED USDA Foreign Agricultural Service
Domestic use of wheat in the MY 2014/15 may change back to wider consumption of ‘social’ bread and products due to the current economic situation.
Trade:
Wheat exports in Ukraine in MY 2013/14 have been exceeding that of the previous season because of an
increase in wheat production of about 40 percent, year-on-year. In addition, more transparent and non-restrictive
export regulations were stimulating the normal pace of trade this season. Total MY 2013/14 exports of wheat are
expected to reach up to ten MMT. The majority of shipments as usual were executed at the start of the season.
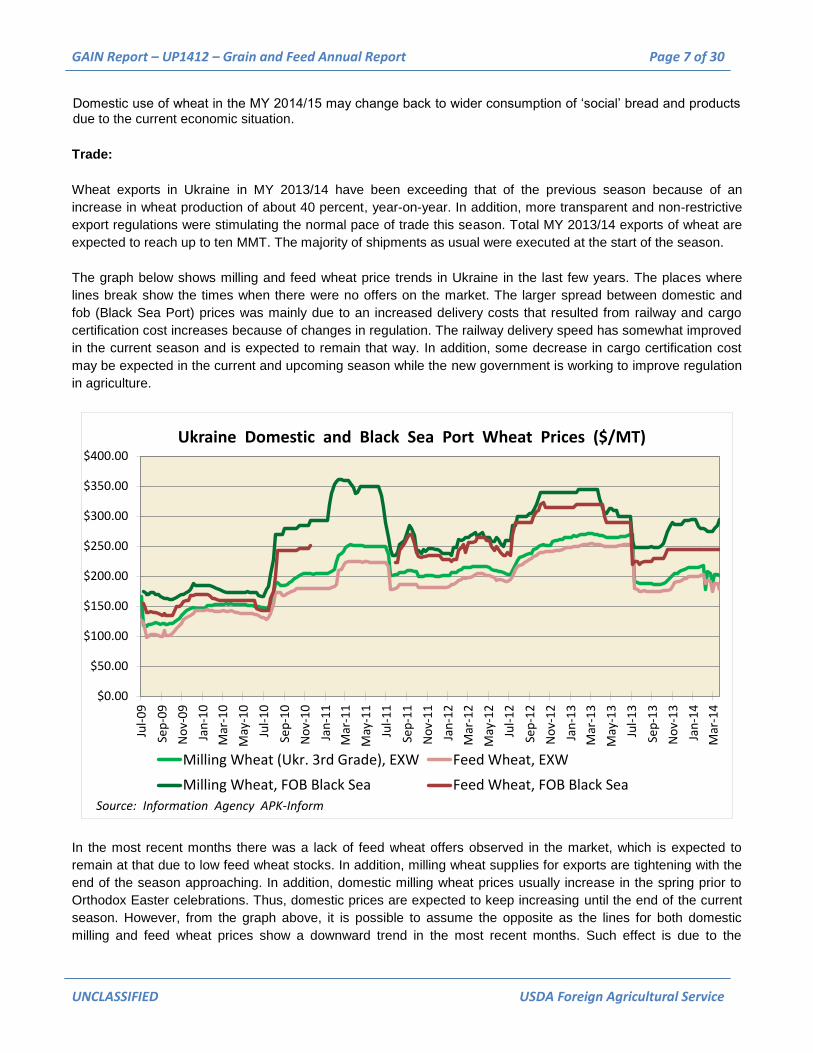
The graph below shows milling and feed wheat price trends in Ukraine in the last few years. The places where
lines break show the times when there were no offers on the market. The larger spread between domestic and
fob (Black Sea Port) prices was mainly due to an increased delivery costs that resulted from railway and cargo
certification cost increases because of changes in regulation. The railway delivery speed has somewhat improved
in the current season and is expected to remain that way. In addition, some decrease in cargo certification cost
may be expected in the current and upcoming season while the new government is working to improve regulation
in agriculture.
$0.00
$50.00
$100.00
$150.00
$200.00
$250.00
$300.00
$350.00
$400.00
Jul-
09
Sep
-09
No
v-0
9
Jan
-10
Mar
-10
May
-10
Jul-
10
Sep
-10
No
v-1
0
Jan
-11
Mar
-11
May
-11
Jul-
11
Sep
-11
No
v-1
1
Jan
-12
Mar
-12
May
-12
Jul-
12
Sep
-12
No
v-1
2
Jan
-13
Mar
-13
May
-13
Jul-
13
Sep
-13
No
v-1
3
Jan
-14
Mar
-14
Ukraine Domestic and Black Sea Port Wheat Prices ($/MT)
Milling Wheat (Ukr. 3rd Grade), EXW Feed Wheat, EXW
Milling Wheat, FOB Black Sea Feed Wheat, FOB Black Sea
Source: Information Agency APK-Inform
In the most recent months there was a lack of feed wheat offers observed in the market, which is expected to
remain at that due to low feed wheat stocks. In addition, milling wheat supplies for exports are tightening with the
end of the season approaching. In addition, domestic milling wheat prices usually increase in the spring prior to
Orthodox Easter celebrations. Thus, domestic prices are expected to keep increasing until the end of the current
season. However, from the graph above, it is possible to assume the opposite as the lines for both domestic
milling and feed wheat prices show a downward trend in the most recent months. Such effect is due to the

GAIN Report – UP1412 – Grain and Feed Annual Report Page 8 of 30
UNCLASSIFIED USDA Foreign Agricultural Service
difference in exchange rate between Ukrainian Hryvnia and US Dollar that has recently fluctuated a lot. In the
view of the economic and political unrest in the country, in the last four months Hryvnia has lost about 40 percent
of its value to the US Dollar. Domestic prices in the new season are expected to pick up to reflect the world
market trends.
In the new season Ukraine is projected to export 9.5 MMT, slightly less than is expected in MY 2013/14, mainly
due to lower projected production. In MY 2013/14 to date, Egypt remained the top buyer, just like in the previous
two seasons. While in MY 2012/13 the most common wheat buyers for Ukraine were from the Mediterranean and
the Middle East. It was feed wheat for the most part that was sold to these destinations then. In the current
season the picture has changed. Over the first six months of the MY 2013/14 Ukraine sold more milling wheat and
the buyers came from various destinations like South Africa, Thailand, Kenya, Bangladesh (once again among
the top ten buyers), Israel, Indonesia, and even Japan. For a more detailed list please see tables in the end of this
report.
Export destinations for MY 2014/15 would depend on the type of wheat sold. At this point it is too early to say
whether Ukraine would produce more milling or more feed wheat in summer 2014 as this highly depends on the
growing season conditions. Egypt is expected to rain at the top of the buyers list.
Imports of wheat in Ukraine are virtually non-existent and for the MY 2012/13 totaled a little over one thousand
metric tons. The country produces enough wheat to satisfy its domestic consumption needs. The only imports that
do come in are either high protein wheat varieties for production of premium pasta products or seeds of some
special wheat varieties for breeding purposes in Ukraine.
Stocks:
In MY 2013/14 Ukraine’s monthly wheat stocks were higher than in previous season due to larger production in
summer 2013. However, good exports pace at the start of the season quickly took care of the surplus. In March
2014 wheat stocks in Ukraine were at the usual level for this time of the year.
0.0
2000.0
4000.0
6000.0
8000.0
10000.0
12000.0
14000.0
16000.0
18000.0
Mar
-11
May
-11
Jul-
11
Sep
-11
No
v-1
1
Jan
-12
Mar
-12
May
-12
Jul-
12
Sep
-12
No
v-1
2
Jan
-13
Mar
-13
May
-13
Jul-
13
Sep
-13
No
v-1
3
Jan
-14
Mar
-14
Thous. tons
Source: State Statistics Committee of Ukraine
Wheat Stocks Held by Producers, Elevators and Processors in Ukraine (1000 MT)
Producers (Large and Mid-size Enterprises) Elevators Processors

GAIN Report – UP1412 – Grain and Feed Annual Report Page 9 of 30
UNCLASSIFIED USDA Foreign Agricultural Service
Production, Supply and Demand Data Statistics:
USDA Official and FAS-Kyiv Forecast Production Supply and Demand Statistics
USD A
Off icialN ew P o st
USD A
Off icialN ew P o st USD A Off icial N ew P o st
Area Harvested 5,630 5,630 6,566 6,566 6,400
Beginning Stocks 5,363 5,363 2,179 2,839 3,619
Production 15,761 15,761 22,278 22,278 20,000
MY Imports 45 1 100 2 1
TY Imports 45 1 100 2 1
TY Imp. from U.S. 0 0 0 0 0
Total Supply 21,169 21,125 24,557 25,119 23,620
MY Exports 7,190 6,886 10,000 10,000 9,500
TY Exports 7,190 6,886 10,000 10,000 9,500
Feed and Residual 3,300 3,100 3,500 3,400 3,500
FSI Consumption 8,500 8,300 8,000 8,100 8,000
Total Consumption 11,800 11,400 11,500 11,500 11,500
Ending Stocks 2,179 2,839 3,057 3,619 2,620
Total Distribution 21,169 21,125 24,557 25,119 23,620
Yield 2.8 2.8 3.39 3.39 3.13
2012/2013
M arket Year B egin: Jul 2012
Revised
2013/2014
M arket Year B egin: Jul 2014
Forecast
2013/2014
M arket Year B egin: Jul 2013
Estimate
Wheat,
Ukra ine
Commodities:
Production:
In the new marketing year (MY 2014/15), barley production is forecast to remain at the level of the current
season. Even though production area is expected to be high, the yields at this point are not forecast to reach
previous levels mainly due to the dry weather conditions this spring. For more detailed discussion on winter crop
conditions please see the Wheat Production section above.
Spring barley planting is currently underway in Ukraine and the areas are forecast to exceed those of the previous
season in total by about eight percent. Difficulties with financing and an increase in input costs are expected to
prompt some producers to plant more spring barley as this is a lower cost of production crop. In addition, the
market prices for barley in the current season were quite attractive that also to some extent would stimulate the
producers to choose this crop.
Consumption:
In MY 2014/15 barley consumption in Ukraine is expected to remain at the level of the current season. Barley
consumption in Ukraine in general has not changed much in the last few years. In the past when producers were
low on cash they dedicating more areas to this low maintenance crop that none the less sold well to Middle East
destinations and was used more by domestic animal producers. However, in recent years, producer preferences
Barley

GAIN Report – UP1412 – Grain and Feed Annual Report Page 10 of 30
UNCLASSIFIED USDA Foreign Agricultural Service
have shifted towards production of corn. This trend was mostly stimulated by the rapidly expanding industrial
poultry production in Ukraine and some development in the industrial pork production in the country. These
industries use more corn in animal feed thus leaving more barley for export market.
Trade:
Barley exports in MY 2013/14 are expected to surpass the figures of the previous season by about ten percent
mainly due to higher production in summer 2013. In the new season exports are so far anticipated to remain at
the level of the current marketing year. However, if production in summer 2014 is different from that projected at
the time of this report writing, exports may be expected to follow the trend.
Saudi Arabia remained the top buyer of Ukrainian barley in MY 2012/13 purchasing over 60 percent of the
available export quantities. Its buyers are at the top of the list in the current season, with similar sales and Saudi
Arabia is expected to remain the largest buyer in the near future as well. Among the other buyers are Iran, Libya
(in MY 2013/14 has increased its barley purchases in Ukraine significantly compared to the previous season),
Jordan, Israe,l and other nearby locations that enjoy the comparative advantage of the delivery costs from the
Black Sea ports.
Stocks:
Barley stocks at the start of the season were not as high as in the previous season. However, a few months after
the start of the MY 2013/14 when traders turned to the record corn crop, barley stocks have started accumulating
at the levels similar to the previous season and are expected to decrease gradually to the usual levels by the end
of the current marketing year. In the MY 2014/15 stocks are expected to follow similar trend, unless production of
other factors change significantly from the anticipated conditions.
0.0
500.0
1000.0
1500.0
2000.0
2500.0
3000.0
3500.0
4000.0
4500.0
Mar
-11
May
-11
Jul-
11
Sep
-11
No
v-1
1
Jan
-12
Mar
-12
May
-12
Jul-
12
Sep
-12
No
v-1
2
Jan
-13
Mar
-13
May
-13
Jul-
13
Sep
-13
No
v-1
3
Jan
-14
Mar
-14
Thous. tons
Source: State Statistics Committee of Ukraine
Barley Stocks Held by Producers, Elevators and Processors in Ukraine (1000 MT)
Producers (Large and Mid-size Enterprises) Elevators Processors
Production, Supply and Demand Data Statistics:

GAIN Report – UP1412 – Grain and Feed Annual Report Page 11 of 30
UNCLASSIFIED USDA Foreign Agricultural Service
USDA Official and FAS-Kyiv Forecast Production Supply and Demand Statistics
USD A
Off icialN ew P o st
USD A
Off icialN ew P o st
USD A
Off icialN ew P o st
Area Harvested 3,293 3,293 3,233 3,233 3,500
Beginning Stocks 1,172 1,172 1,003 881 847
Production 6,935 6,935 7,561 7,561 7,500
MY Imports 30 8 30 5 5
TY Imports 30 1 30 5 5
TY Imp. from U.S. 0 0 0 0 0
Total Supply 8,137 8,115 8,594 8,447 8,352
MY Exports 2,134 2,134 2,500 2,500 2,500
TY Exports 2,200 2,200 2,500 2,500 2,500
Feed and Residual 3,400 3,500 3,500 3,400 3,400
FSI Consumption 1,600 1,600 1,700 1,700 1,600
Total Consumption 5,000 5,100 5,200 5,100 5,000
Ending Stocks 1,003 881 894 847 852
Total Distribution 8,137 8,115 8,594 8,447 8,352
Yield 2.11 2.11 2.34 2.34 2.14
Estimate
M arket Year B egin: Jul 2012
2012/2013 2014/2015
M arket Year B egin: Jul 2014
Forecast
2013/2014
M arket Year B egin: Jul 2013
Estimate
Barley
Ukra ine
Commodities:
Production:
Corn production in Ukraine in MY 2014/15 is expected to remain high but is forecast at the time of this report
writing to be about 25 MMT, roughly 20 percent below the previous harvest figure. While harvested area is
expected to remain similar to the previous season the decrease in production in the new season is anticipated
mainly because of projected lower yields to be lower than in the past season due to the following factors:
- Lower input use than in the past
- Cheaper/lower quality seeds used
- Dryer than usual weather at the start of corn planting and overall low subsurface moisture availability
The increase in input costs for agricultural producers that is already occurring is expected to translate into lower
use or application of cheaper (which in most cases means less effective) fertilizer and especially plant protection
means and seeds. In addition, relatively low world agricultural commodity market prices at the start of MY 2013/14
cut down on Ukrainian producers’ profits that also stimulate them to reduce input expenses for the new harvest
and to hold off on technology improvements that require large upfront expenditures.
A good share of fertilizer components (for production of ready to use fertilizers in the local facilities) and plant
protection products are imported to Ukraine from China, Russia, Belorussia, and other countries. In addition,
energy costs in Ukraine have gone up this season that affects the local input production as well. Most large
agricultural enterprises and those that usually plan in advance for the season have purchased or signed purchase
contracts with locked-in price for fertilizer, fuel, and seeds that are needed for their spring planting before the
major changes in the currency exchange rate started occurring in Ukraine. However, there are some who did not
Corn

GAIN Report – UP1412 – Grain and Feed Annual Report Page 12 of 30
UNCLASSIFIED USDA Foreign Agricultural Service
have enough financial reserves to set aside in advance that will now have to be very creative in allocating funds
for their spring planting expenses.
Seed quality is another important fact in corn production. In the last five years Ukraine has expanded imports of
good quality hybrid corn seeds from Hungary, Romania, the US, and other countries alike (see statistical tables in
the end of this report for more details). At the same time local corn seed production capacity has been developing
as well. According to seed sellers, at present over half of the market is imported corn hybrids. In view of the of the
increasing input costs and devolving local currency producers may turn to using cheaper and lower quality corn
seeds or switch to domestically produced and less expensive corn seeds. Thus, yields lower than in the previous
season are expected.
The weather is always a risk factor in agriculture. Major corn planting in Ukraine usually starts in April. This year it
is not an exception. As of late March 2014, local weather reports did not forecast significant rainfall in the nearest
future. This may lead to weaker sprouting or may prompt corn sowing until later dates that may negatively affect
the yields. In addition, if the currently low subsurface moisture is not replenished before the main corn growth
stages begin, yields may not be able to reach the higher boundaries. However, the weather factor may also play
out to benefit the new crop. At the time of this report writing, overall corn production forecasts are made by
factoring in the average weather conditions for the growing and harvest times.
Consumption:
The increase in domestic consumption of corn is expected to continue for the remainder of the MY 2013/14.
Mainly driven by the expanding poultry production that is forecast by FAS-Kyiv to grow by up to ten percent. Pork
production has also been growing and is projected by FAS-Kyiv to increase by about four percent in 2014,
depending on economic stability. Expansion of production facilities and such depends highly on imports of
technology components. Consequently, animal feed consumption and especially corn (as the main feed
ingredient in industrial poultry production) may fail to follow the upward trend it MY 2014/15.
0
100
200
300
400
500
600
Compound Feed Production in Ukraine (1000 MT)
MY 2010/11 MY 2011/12 MY 2012/13 MY 2013/14
Source: State Statistics Committee of Ukraine

GAIN Report – UP1412 – Grain and Feed Annual Report Page 13 of 30
UNCLASSIFIED USDA Foreign Agricultural Service
Overall corn consumption in MY 2013/14 is estimated at a much higher rate that in the previous season mainly
due to growing domestic consumption by animal industry and higher anticipated losses. The quality of corn
produced in the fall 2013 suffered because of the continuous adverse weather conditions at the harvesting time.
Large share of corn produced had to be dried for proper storage. Drying equipment in Ukraine varies greatly in
quality and speed of operations and in some cases negatively affects crop quality as a result. Thus, greater crop
losses are anticipated in the current season.
Trade:
Record corn production in Ukraine in fall 2014 prompted record corn exports in MY 2013/14 that is forecast to
reach 20.5 MMT. Even though world market price for feed corn has declined in the current season compared to
the previous one, Ukrainian producers have been selling the crop at high rates trying to return the investment and
secure the funds for the new season plating campaign.
Ukraine domestic corn price dropped significantly at the start of the harvest in fall 2013 rebounding slightly at the
time of this report writing on the decline in the reported offers in the domestic market and an overall economic and
political turmoil in the country. However, corn exports have been going still at good pace and are expected to
continue without interruption in the coming months. Some producers indicate they want to hold the stocks for
exports while domestic prices adjust to better reflect the world market prices and the currency exchange rate in
Ukraine. Others are willing to sell anyway since they need cash for the ongoing spring planting campaign. So,
some stocks are still available for export and the trade is willing to conduct sales.
In MY 2012/13 as well as in MY 2011/12 Spain and Egypt were the top corn destinations for Ukraine. The EU
countries in general have been favoring Ukrainian feed corn in the last few years with East Asia coming into play
more strongly in MY 2013/14.
Since signing the intergovernmental agreement between Ukraine and China in 2013 (among other things, it
contains terms for delivery of up to four MMT corn a year to China starting in 2013), trade with this destination
slowly picked up. The first large shipment (about 100,000 MT) of corn to China left ports in the Black Sea in
November 2013.

GAIN Report – UP1412 – Grain and Feed Annual Report Page 14 of 30
UNCLASSIFIED USDA Foreign Agricultural Service
$0.00
$50.00
$100.00
$150.00
$200.00
$250.00
$300.00
$350.00
Jul-
09
Sep
-09
No
v-0
9
Jan
-10
Mar
-10
May
-10
Jul-
10
Sep
-10
No
v-1
0
Jan
-11
Mar
-11
May
-11
Jul-
11
Sep
-11
No
v-1
1
Jan
-12
Mar
-12
May
-12
Jul-
12
Sep
-12
No
v-1
2
Jan
-13
Mar
-13
May
-13
Jul-
13
Sep
-13
No
v-1
3
Jan
-14
Mar
-14
Ukraine Feed Corn Prices ($/MT)
Corn Price, EXW Corn Price, FOB (Black Sea Prot)
Source: Information Agency APK-Inform
According to official trade statistics (for details see statistical table at the end of this report), during the first three
months of the current marketing year (October – December 2013), the top Ukrainian corn export destinations
were Egypt, South Korea, Spain, Japan, Iran, the Netherlands, and Italy.
Exports of Ukrainian corn in the new season are anticipated to cover a variety of destinations once again in the
upcoming marketing year. The EU, North Africa, Middle East, and East Asia are expected to remain the major
buyers in the new season.
Stocks:
Record corn harvest in fall 2013 resulted in larger accumulated stocks at the start of the season. However, the
market players worked hard to get the exports going at the highest rate ever. At the time of this report writing corn
stocks are slightly higher than at the same time in the previous two seasons. However, recently trade has been
reporting a reduction in availability of good quality corn for sale in the domestic market.

GAIN Report – UP1412 – Grain and Feed Annual Report Page 15 of 30
UNCLASSIFIED USDA Foreign Agricultural Service
0.0
2,000.0
4,000.0
6,000.0
8,000.0
10,000.0
12,000.0
14,000.0
16,000.0
18,000.0
Mar
-11
May
-11
Jul-
11
Sep
-11
No
v-1
1
Jan
-12
Mar
-12
May
-12
Jul-
12
Sep
-12
No
v-1
2
Jan
-13
Mar
-13
May
-13
Jul-
13
Sep
-13
No
v-1
3
Jan
-14
Mar
-14
Thous. tons
Source: State Statistics Committee of Ukraine
Corn Stocks Held by Producers, Elevators and Processors in Ukraine (1000 MT)
Producers (Large and Mid-size Enterprises) Elevators Processors

GAIN Report – UP1412 – Grain and Feed Annual Report Page 16 of 30
UNCLASSIFIED USDA Foreign Agricultural Service
Production, Supply and Demand Data Statistics:
USDA Official and FAS-Kyiv Forecast Production Supply and Demand Statistics
USD A
Off icialN ew P o st
USD A
Off icialN ew P o st
USD A
Off icialN ew P o st
Area Harvested 4,370 4,372 4,825 4,825 4,800
Beginning Stocks 1,051 1,197 1,197 1,363 1,963
Production 20,922 20,961 30,900 30,900 25,000
MY Imports 50 50 50 50 50
TY Imports 50 50 50 50 50
TY Imp. from U.S. 0 0 0 3 3
Total Supply 22,023 22,208 32,147 32,313 27,013
MY Exports 12,726 12,725 18,500 20,500 17,500
TY Exports 12,726 12,725 18,500 20,500 17,500
Feed and Residual 6,800 6,800 8,500 8,500 7,000
FSI Consumption 1,300 1,320 1,600 1,350 1,350
Total Consumption 8,100 8,120 10,100 9,850 8,350
Ending Stocks 1,197 1,363 3,547 1,963 1,163
Total Distribution 22,023 22,208 32,147 32,313 27,013
Yield 4.79 4.79 6.4 6.4 5.2
Corn
Ukra ine
2012/2013
M arket Year B egin: Oct2012
Revised
2014/2015
M arket Year B egin: Oct2014
Forecast
2013/2014
M arket Year B egin: Oct2013
Estimate
Commodities:
Production:
Once again rye production in Ukraine is forecast to decline, by about 35 percent year-on-year. Production area for
summer harvest 2014 is projected to drop by almost 30 percent compared to the previous summer.
Rye is one of the minor cereal grains that Ukraine produces to cater to the traditional diet preferences of domestic
consumers. Bread made with rye or a mixture of rye and wheat flours is a staple food in the country. The project
level of rye production is sufficient enough to satisfy domestic demand.
Consumption:
Consumption of rye in MY 2014/15 is expected to decline slightly because of lower consumption for bread-making
following the general decreasing population trend.
Trade:
Exports of rye in MY 2013/14 are expected to stay similar to previous season. However, in MY 2014/15 export
quantity would decline due to a forecast decrease in production and thus lower available surplus.
In the first six months of the MY 2013/14, the major buyer or Ukrainian rye was Israel. However, over the last
several years there was no list of constant buyers for this product with sales being occasional small loads
shopped to countries in the EU and some in Middle East. This pattern is expected to remain.
Rye

GAIN Report – UP1412 – Grain and Feed Annual Report Page 17 of 30
UNCLASSIFIED USDA Foreign Agricultural Service
Stocks:
Ukraine has accumulated larger stocks of rye in the current season while domestic consumption has been
decreasing and exports of rye are not as attractive business in Ukraine as that of other grains.
0.00
100.00
200.00
300.00
400.00
500.00
600.00
Mar
-11
May
-11
Jul-
11
Sep
-11
No
v-1
1
Jan
-12
Mar
-12
May
-12
Jul-
12
Sep
-12
No
v-1
2
Jan
-13
Mar
-13
May
-13
Jul-
13
Sep
-13
No
v-1
3
Jan
-14
Mar
-14
Thous. tons
Source: State Statistics Committee of Ukraine
Rye Stocks Held by Producers, Elevators and Processors in Ukraine (1000 MT)
Producers (Large and Mid-size Enterprises) Elevators Processors
Production, Supply and Demand Data Statistics:
USDA Official and FAS-Kyiv Forecast Production Supply and Demand Statistics
USD A
Off icialN ew P o st
USD A
Off icialN ew P o st USD A Off icial N ew P o st
Area Harvested 298 298 279 279 200
Beginning Stocks 132 132 166 222 241
Production 676 677 638 638 410
MY Imports 0 0 0 1 1
TY Imports 0 0 0 1 1
TY Imp. from U.S. 0 0 0 0 0
Total Supply 808 809 804 861 652
MY Exports 17 17 25 20 5
TY Exports 16 16 25 20 5
Feed and Residual 50 50 50 70 30
FSI Consumption 575 520 600 530 470
Total Consumption 625 570 650 600 500
Ending Stocks 166 222 129 241 147
Total Distribution 808 809 804 861 652
Yield 2.27 2.27 2.29 2.29 2.05
2014/2015
M arket Year B egin: Jul 2014
Forecast
2012/2013
M arket Year B egin: Jul 2012
Revised
2013/2014
M arket Year B egin: Jul 2013
EstimateRye
Ukra ine

GAIN Report – UP1412 – Grain and Feed Annual Report Page 18 of 30
UNCLASSIFIED USDA Foreign Agricultural Service
Commodities:
Policy:
Over the last few season Ukraine’s policy in agriculture has seen quite a few changes. Firstly, no official trade
restrictions were observed in the market. The Memorandum of Agreement between the GOU and the industry on
trade balances continues to be signed every season. This has positively affected the trade in general and allowed
producers to hold and sell stocks easily though the year. However, some technical difficulties with grain logistics
and certification in Ukraine resulted in increased transportation etc. costs, thus reducing producer margins.
Value Added Tax (VAT) reimbursement on exports of grain is another point of interest that has been on agenda
for the industry in Ukraine for quite some time now. Please monitor upcoming FAS-Kyiv reports for the latest data
on the issue.
Since the major changes in the government started occurring in Ukraine in winter 2014, more changes in the
agricultural sector are anticipated. Some may promote exports of grain and others may lead to restructuring of
business practices in the country and subsequently result in different production and trade patterns in Ukraine in
the long-run. It is too early to make predictions at this time.
Author Defined:
Exports via Sea Ports
Over the 12 months in MY 2012/13 (July 2013 – June 2013) there were about 25.5 MMT of grains and oilseeds
and products shipped from Ukrainian ports in the Black Sea and Azov Sea with grains alone totaling 19 MMT.
The major share of all grain exports was executed through the port of Mykolayiv, about 27 percent or 4.3 MMT
(see chart below) followed by the port of Odessa (25 percent) and ports Ilyichivsk (16 percent) and Yuzhny (16
percent). The Port Sevastopol is located at Crime peninsula in the Black Sea and usually carried out a smaller
share of grain exports as the transportation of cargo from the mainland to the peninsula is not as easy and
convenient as it is with the other major agricultural commodity carrying ports in Ukraine. The ports of Mariupol and
Berdyansk are located in the Azov Sea and accept only smaller size grain and oilseed carrying vessels (up to
5,000 MT) due to the sea floor depth natural limitations. Their share of exports is expected to remain low.
In MY 2013/14, between July 2013 and February 2014, Ukrainian ports shipped over 26 MMT of grains and
oilseeds and products. This figure exceeds the total quantity carried by these ports in MY 2012/13. There were
about 19 MMT of grains shipped since July 2013. So far in the current marketing year and once again the leader
in shipment of grains is the port of Mykolayiv with a 30 percent share. The Port of Yuzhny has picked up the
speed (21 percent) leaving Ilyichivsk (12 percent) behind for now.
Rye
Corn
Barley
Wheat

GAIN Report – UP1412 – Grain and Feed Annual Report Page 19 of 30
UNCLASSIFIED USDA Foreign Agricultural Service
Mykolayiv27%
Odessa25%
Ilyichivsk16%
Yuzhny16%
Kherson5%
Sevastopol7%
Mariupol3%
Berdyansk1%
Balck & Azov Sea Ports Share in Grain Shipments from Ukraine July 2012 - June 2013
Source: FAS-Kyiv estimates
According to trade reports, during several months over the last half year, Ukraine exported grains and oilseeds
and products at a record high speed of up to five MMT a month cumulatively from its sea ports. In the past all its
sea ports collectively shipped about three MMT a month. It is expected that the grain and oilseed transshipment
capacity of the major ports in the Black Sea would be further increasing in the future while Ukraine is enhancing
agricultural production and improving its grain logistics infrastructure.
Mykolayiv30%
Odessa24%
Yuzhny21%
Ilyichivsk12%
Kherson3%
Sevastopol5%
Mariupol3%
Berdyansk2%
Balck & Azov Sea Ports Share in Grain Shipments from Ukraine July 2013 - February 2014
Source: FAS-Kyiv estimates

GAIN Report – UP1412 – Grain and Feed Annual Report Page 20 of 30
UNCLASSIFIED USDA Foreign Agricultural Service
Author Defined:
Statistical Tables
Quantity % Share Quantity % Share Quantity % Share
World 4,166.2 100.00 5,254.2 100.00 6,886.1 100.00 31.06
Egypt 626.2 15.03 1,200.2 22.84 1,646.4 23.91 37.17
Spain 237.1 5.69 1,073.1 20.42 833.6 12.11 - 22.32
Morocco 0.0 0.00 54.0 1.03 795.7 11.55 1373.28
Tunisia 212.5 5.10 281.5 5.36 450.6 6.54 60.06
Syria 99.5 2.39 186.7 3.55 419.5 6.09 124.71
Libya 264.7 6.35 152.3 2.90 376.4 5.47 147.15
Jordan 0.0 0.00 153.6 2.92 351.1 5.10 128.55
Israel 398.8 9.57 713.5 13.58 350.7 5.09 - 50.85
Kenya 181.5 4.36 35.5 0.68 306.0 4.44 761.85
South Africa 0.0 0.00 0.0 0.00 271.3 3.94 0.00
Turkey 611.2 14.67 96.6 1.84 130.0 1.89 34.65
Lebanon 150.1 3.60 118.4 2.25 112.0 1.63 - 5.42
Korea South 170.5 4.09 0.0 0.00 101.8 1.48 0.00
Yemen 0.0 0.00 0.0 0.00 101.6 1.48 0.00
Sudan 28.6 0.69 20.3 0.39 89.8 1.30 341.46
Uganda 8.9 0.21 0.0 0.00 75.4 1.10 0.00
United Arab Emirates 0.0 0.00 30.9 0.59 73.8 1.07 138.56
Italy 93.7 2.25 293.6 5.59 68.4 0.99 - 76.72
Tanzania 30.0 0.72 0.0 0.00 55.6 0.81 0.00
Netherlands 20.6 0.49 115.9 2.21 43.2 0.63 - 62.75
Mauritania 15.9 0.38 0.0 0.00 37.3 0.54 0.00
Mozambique 0.0 0.00 0.0 0.00 34.7 0.50 0.00
Portugal 38.6 0.93 58.7 1.12 31.8 0.46 - 45.93
Indonesia 0.5 0.01 1.1 0.02 31.5 0.46 2751.44
Georgia 253.2 6.08 0.0 0.00 13.9 0.20 0.00
Rwanda 0.0 0.00 0.0 0.00 13.0 0.19 0.00
Belarus 6.2 0.15 11.4 0.22 11.9 0.17 4.74
Senegal 0.0 0.00 0.0 0.00 8.6 0.12 0.00
Thailand 59.2 1.42 143.6 2.73 7.6 0.11 - 94.73
Burundi 0.0 0.00 0.0 0.00 7.0 0.10 0.00
Lithuania 0.0 0.00 0.0 0.00 6.3 0.09 0.00
Malaysia 1.2 0.03 13.9 0.26 6.3 0.09 - 55.02
Germany 23.6 0.57 1.7 0.03 5.9 0.09 255.94
Greece 12.5 0.30 0.0 0.00 3.2 0.05 0.00
United Kingdom 6.1 0.15 13.0 0.25 2.8 0.04 - 78.30
Poland 38.2 0.92 0.7 0.01 0.0 0.00 - 99.99
Palestine 0.0 0.00 6.4 0.12 0.0 0.00 - 100.00
Saudi Arabia 0.0 0.00 265.7 5.06 0.0 0.00 - 100.00
Uzbekistan 0.7 0.02 0.0 0.00 0.0 0.00 0.00
Vietnam 107.1 2.57 37.9 0.72 0.0 0.00 - 100.00
Unidentified Country 50.3 1.21 0.0 0.00 0.0 0.00 0.00
Bangladesh 287.0 6.89 118.0 2.25 0.0 0.00 - 100.00
Albania 11.2 0.27 3.1 0.06 0.0 0.00 - 100.00
Armenia 71.5 1.72 4.9 0.09 0.0 0.00 - 100.00
Iraq 7.0 0.17 0.0 0.00 0.0 0.00 0.00
Japan 13.0 0.31 0.0 0.00 0.0 0.00 0.00
Korea North 5.5 0.13 0.0 0.00 0.0 0.00 0.00
Other 23.6 0.6 47.7 0.9 11.4 0.2 8,183.0
Source: State Customs Committee of Ukraine
Wheat Exports from Ukraine by Destination, MY, 1000 MT (HS Code 1001)
Destination
% Change
MY 2012/13 to
2011/12
MY 2010/11
(July 10-June 11)
MY 2011/12
(July 11-June 12)
MY 2012/13
(July 12-June 13)

GAIN Report – UP1412 – Grain and Feed Annual Report Page 21 of 30
UNCLASSIFIED USDA Foreign Agricultural Service
Destination Jul-12 Aug-12 Sep-12 Oct-12 Nov-12 Dec-12
Subtotal
Jul-Dec
2012
Subtotal
MY
2012/13
Jul-13 Aug-13 Sep-13 Oct-13 Nov-13 Dec-13
Subtotal
Jul-Dec
2013
% Share Jul-
Dec 2013 to
MY 2012/13
% Change
Jul-Dec
2013 to Jul-
Dec 2012
World 333.7 881.5 1,250.3 1,514.1 1,424.9 532.8 5,937.3 6,886.1 260.3 1,297.4 1,931.1 1,734.3 801.2 792.3 6,816.6 98.99 114.81
Egypt 0.0 129.8 245.2 587.2 417.3 163.5 1,542.9 1,646.4 5.0 221.9 434.3 641.3 191.3 358.1 1,851.9 112.48 120.03
South Africa 0.0 50.0 60.5 80.5 0.0 32.6 223.6 271.3 42.7 132.4 152.4 40.5 49.5 40.8 458.3 168.95 204.95
Thailand 1.5 2.2 0.0 3.3 0.6 0.0 7.6 7.6 2.5 85.1 231.5 63.8 1.4 0.6 385.0 5085.69 5085.69
Kenya 63.8 60.0 12.8 40.4 11.5 40.6 228.9 306.0 57.5 89.7 122.8 60.9 49.7 0.0 380.6 124.38 166.26
Bangladesh 0.0 0.0 0.0 0.0 0.0 0.0 0.0 0.0 0.0 204.6 25.4 66.1 25.5 23.3 345.0 ∞ ∞
Israel 58.0 113.9 54.8 64.7 46.0 13.3 350.7 350.7 24.9 106.8 58.1 41.3 38.4 29.1 298.6 85.15 85.15
Indonesia 0.0 0.0 2.2 27.8 0.8 0.7 31.5 31.5 1.1 53.0 112.9 49.7 49.2 9.8 275.8 874.19 874.19
Japan 0.0 0.0 0.0 0.0 0.0 0.0 0.0 0.0 0.0 62.6 95.3 108.6 0.5 0.0 267.0 ∞ ∞
Syria 65.8 0.0 0.0 23.7 0.0 0.0 89.5 419.5 49.4 50.6 79.9 14.7 27.5 43.7 265.8 63.36 296.84
Libya 6.9 58.9 86.3 61.7 88.7 10.9 313.4 376.4 25.3 48.8 38.7 36.6 27.1 75.7 252.2 67.00 80.48
Philippines 0.0 0.0 0.0 0.0 0.0 0.0 0.0 0.5 2.3 40.5 128.9 17.4 46.8 0.0 235.8 51376.03 ∞
Tunisia 74.8 67.1 48.0 75.5 82.4 28.1 375.9 450.6 8.8 0.0 0.0 49.2 104.6 22.5 185.1 41.07 49.24
Jordan 0.0 52.7 51.9 0.0 150.7 47.7 303.0 351.1 0.0 0.0 60.4 71.5 5.0 47.5 184.3 52.49 60.83
Pakistan 0.0 0.0 0.0 0.0 0.0 0.0 0.0 0.0 0.0 0.1 38.2 126.1 0.0 0.0 164.4 ∞ ∞
Djibouti 0.0 0.0 0.0 0.0 0.0 0.0 0.0 0.0 0.0 0.0 0.0 0.0 93.2 40.0 133.2 ∞ ∞
Ethiopia 0.0 0.0 0.0 0.0 0.0 0.0 0.0 0.0 0.0 0.0 22.5 59.9 0.0 40.5 122.9 ∞ ∞
Turkey 16.5 0.0 2.0 42.7 48.1 11.2 120.6 130.0 0.0 19.0 33.3 31.6 30.5 6.0 120.5 92.64 99.87
Korea South 0.0 52.3 49.5 0.0 0.0 0.0 101.8 101.8 0.0 24.3 59.4 32.3 0.0 0.0 116.0 114.00 114.00
Lebanon 0.0 18.5 13.8 0.0 73.3 3.1 108.7 112.0 0.0 19.2 19.3 18.6 16.9 30.3 104.4 93.19 96.06
Vietnam 0.0 0.0 0.0 0.0 0.0 0.0 0.0 0.0 0.0 0.0 99.9 0.0 0.0 0.0 99.9 ∞ ∞
Morocco 0.0 0.0 165.3 314.6 113.9 63.0 656.8 795.7 15.7 20.8 0.0 17.8 9.7 0.0 64.0 8.05 9.75
Iran 0.0 0.0 0.0 0.0 0.0 0.0 0.0 0.0 0.0 0.0 0.0 55.0 0.0 0.0 55.0 ∞ ∞
Sudan 0.0 0.0 0.0 26.3 63.5 0.0 89.8 89.8 0.0 20.7 0.0 31.1 0.0 0.0 51.8 57.66 57.66
Yemen 0.0 0.0 0.0 50.4 51.3 0.0 101.6 101.6 0.0 42.0 0.0 9.3 0.0 0.0 51.3 50.45 50.45
Spain 33.8 205.1 362.5 60.0 137.2 35.0 833.6 833.6 0.0 0.0 0.0 9.9 0.0 0.0 9.9 1.19 1.19
Other 12.7 71.2 95.5 55.3 139.6 83.1 457.4 510.0 25.0 55.3 117.8 81.2 34.5 25.2 338.9 66.46 74.10
Source: State Customs Committee of Ukraine
Wheat Export Statistics by Month and Destination, Ukraine, 1000 MT (HS Code 1001)

GAIN Report – UP1412 – Grain and Feed Annual Report Page 22 of 30
UNCLASSIFIED USDA Foreign Agricultural Service
Quantity % Share Quantity % Share Quantity % Share
World 2,794.1 100.00 2,463.1 100.00 2,133.8 100.00 - 13.37
Saudi Arabia 1,797.9 64.35 1,686.5 68.47 1,457.4 68.30 - 13.58
Iran 0.0 0.00 117.8 4.78 155.5 7.29 32.00
Libya 200.4 7.17 38.7 1.57 154.8 7.26 300.03
Jordan 33.0 1.18 95.7 3.88 132.8 6.22 38.78
Israel 248.8 8.90 78.2 3.18 99.0 4.64 26.49
Turkey 5.0 0.18 0.0 0.00 33.7 1.58 0.00
Egypt 7.9 0.28 0.0 0.00 32.2 1.51 0.00
Kuwait 67.7 2.42 0.0 0.00 26.1 1.22 0.00
Lebanon 23.1 0.83 32.7 1.33 20.2 0.95 - 38.38
United Arab Emirates 17.4 0.62 0.0 0.00 6.3 0.30 0.00
Greece 0.0 0.00 2.9 0.12 2.0 0.09 - 31.44
United Kingdom 2.7 0.10 0.0 0.00 1.5 0.07 0.00
Uzbekistan 2.1 0.07 0.7 0.03 1.5 0.07 104.68
Armenia 2.0 0.07 0.0 0.00 1.3 0.06 0.00
Netherlands 24.1 0.86 0.0 0.00 0.3 0.01 0.00
Russia 5.7 0.21 0.1 0.00 0.1 0.00 10.32
Moldova 0.1 0.00 0.1 0.00 0.1 0.00 - 23.10
Switzerland 0.0 0.00 0.1 0.00 0.1 0.00 - 38.69
Kyrgyzstan 0.0 0.00 0.0 0.00 0.0 0.00 0.00
Syria 80.9 2.90 232.5 9.44 0.0 0.00 - 100.00
Morocco 14.8 0.53 69.7 2.83 0.0 0.00 - 100.00
Algeria 0.0 0.00 50.5 2.05 0.0 0.00 - 100.00
Qatar 0.0 0.00 39.0 1.58 0.0 0.00 - 100.00
Italy 28.7 1.03 5.9 0.24 0.0 0.00 - 100.00
Liberia 0.0 0.00 0.0 0.00 0.0 0.00 - 100.00
Georgia 2.8 0.10 0.0 0.00 0.0 0.00 0.00
Germany 5.2 0.19 0.0 0.00 0.0 0.00 0.00
Korea South 0.5 0.02 0.0 0.00 0.0 0.00 0.00
Japan 71.0 2.54 0.0 0.00 0.0 0.00 0.00
Tunisia 119.1 4.26 0.0 0.00 0.0 0.00 0.00
Vietnam 4.8 0.17 0.0 0.00 0.0 0.00 0.00
Oman 15.9 0.57 0.0 0.00 0.0 0.00 0.00
Portugal 12.5 0.45 0.0 0.00 0.0 0.00 0.00
Source: State Customs Committee of Ukraine
Barley Exports from Ukraine by Destination, MY, 1000 MT (HS Code 1003)
Destination
MY 2010/11
(July 10-June 11)
MY 2011/12
(July 11-June 12)
MY 2012/13
(July 12-June 13)% Change
MY 2012/13 to
2011/12

GAIN Report – UP1412 – Grain and Feed Annual Report Page 23 of 30
UNCLASSIFIED USDA Foreign Agricultural Service
Destination Jul-12 Aug-12 Sep-12 Oct-12 Nov-12 Dec-12
Subtotal
Jul-Dec
2012
Subtotal
MY
2012/13
Jul-13 Aug-13 Sep-13 Oct-13 Nov-13 Dec-13
Subtotal
Jul-Dec
2013
% Share
Jul-Dec
2013 to
MY
2012/13
% Change
Jul-Dec
2013 to
Jul-Dec
2012
World 30.0 478.4 647.9 367.9 188.4 134.8 1,847.5 3,981.3 493.3 709.4 478.9 183.7 110.6 77.3 2,053.2 51.6 111.1
Saudi Arabia 1.3 406.1 468.1 267.7 147.0 106.4 1,396.7 2,854.1 333.3 599.2 356.0 72.2 63.7 0.0 1,424.4 49.9 102.0
Libya 2.8 15.8 16.1 14.3 24.8 21.3 95.0 249.8 18.6 32.1 32.8 21.4 22.8 61.8 189.5 75.9 199.5
Kuwait 0.0 26.1 0.0 0.0 0.0 0.0 26.1 52.3 74.0 0.0 30.4 0.0 0.0 0.0 104.5 199.8 399.7
Tunisia 0.0 0.0 0.0 0.0 0.0 0.0 0.0 0.0 0.0 0.0 27.3 51.3 1.2 0.0 79.8 ∞ ∞
Israel 18.9 8.3 20.4 21.3 0.0 4.6 73.6 172.5 5.7 8.8 21.9 13.7 5.3 7.3 62.6 36.3 85.1
Jordan 0.0 0.0 47.5 0.0 0.0 0.0 47.5 180.3 51.4 0.0 0.0 0.0 0.0 0.0 51.4 28.5 108.2
Japan 0.0 0.0 0.0 0.0 0.0 0.0 0.0 0.0 0.0 39.8 9.7 0.0 0.0 0.0 49.5 ∞ ∞
Syria 0.0 0.0 0.0 0.0 0.0 0.0 0.0 0.0 0.0 29.0 0.0 0.0 0.0 0.0 29.0 ∞ ∞
United Arab Emirates 0.0 6.3 0.0 0.0 0.0 0.0 6.3 12.6 9.7 0.0 0.0 0.1 17.6 0.3 27.7 220.1 440.2
Algeria 0.0 0.0 0.0 0.0 0.0 0.0 0.0 0.0 0.0 0.0 0.0 25.1 0.0 0.0 25.1 ∞ ∞
Switzerland 0.0 0.0 0.0 0.0 0.0 0.0 0.0 0.1 0.0 0.0 0.0 0.0 0.0 5.0 5.0 7593.9 ∞
Lebanon 3.3 0.0 0.0 3.1 0.0 0.0 6.4 26.5 0.0 0.0 0.0 0.0 0.0 2.9 2.9 10.9 45.7
Korea South 0.0 0.0 0.0 0.0 0.0 0.0 0.0 0.0 0.4 0.0 0.7 0.0 0.0 0.0 1.2 ∞ ∞
Netherlands 0.0 0.0 0.0 0.3 0.0 0.0 0.3 0.6 0.0 0.3 0.0 0.0 0.0 0.0 0.3 ∞ 100.7
Denmark 0.0 0.0 0.0 0.0 0.0 0.0 0.0 0.0 0.1 0.1 0.0 0.0 0.0 0.0 0.2 ∞ ∞
Germany 0.0 0.0 0.0 0.0 0.0 0.0 0.0 0.0 0.1 0.0 0.0 0.0 0.0 0.0 0.1 ∞ ∞
Moldova 0.0 0.0 0.0 0.0 0.0 0.0 0.1 0.1 0.0 0.0 0.0 0.0 0.0 0.0 0.1 41.2 94.7
Belarus 0.0 0.0 0.0 0.0 1.3 0.6 1.9 7.8 0.0 0.0 0.0 0.0 0.0 0.0 0.0 0.2 0.7
Kazakhstan 0.0 0.0 0.0 0.0 0.0 0.0 0.0 0.0 0.0 0.0 0.0 0.0 0.0 0.0 0.0 ∞ ∞
Georgia 0.0 0.0 0.0 0.0 0.0 0.0 0.0 0.0 0.0 0.0 0.0 0.0 0.0 0.0 0.0 ∞ ∞
United Kingdom 0.0 0.0 0.0 0.0 0.0 0.0 0.0 1.5 0.0 0.0 0.0 0.0 0.0 0.0 0.0 ∞ ∞
Uzbekistan 0.0 0.0 0.0 0.0 0.5 0.9 1.3 2.8 0.0 0.0 0.0 0.0 0.0 0.0 0.0 0.0 0.0
Turkey 3.7 0.0 0.0 0.0 0.0 0.0 3.7 37.4 0.0 0.0 0.0 0.0 0.0 0.0 0.0 ∞ 0.0
Kyrgyzstan 0.0 0.0 0.0 0.0 0.0 0.0 0.0 0.0 0.0 0.0 0.0 0.0 0.0 0.0 0.0 ∞ ∞
Russia 0.0 0.0 0.0 0.0 0.0 0.0 0.0 0.1 0.0 0.0 0.0 0.0 0.0 0.0 0.0 ∞ ∞
Armenia 0.0 0.0 0.0 0.0 0.0 1.0 1.0 2.3 0.0 0.0 0.0 0.0 0.0 0.0 0.0 0.0 0.0
Cyprus 0.0 0.0 0.0 0.0 0.0 0.0 0.0 3.2 0.0 0.0 0.0 0.0 0.0 0.0 0.0 ∞ ∞
Egypt 0.0 7.5 9.7 0.0 14.9 0.0 32.2 64.3 0.0 0.0 0.0 0.0 0.0 0.0 0.0 ∞ 0.0
Greece 0.0 0.0 0.0 0.0 0.0 0.0 0.0 2.0 0.0 0.0 0.0 0.0 0.0 0.0 0.0 ∞ ∞
Iran 0.0 8.1 86.0 61.4 0.0 0.0 155.5 311.0 0.0 0.0 0.0 0.0 0.0 0.0 0.0 ∞ 0.0
Source: State Customs Committee of Ukraine
Barley Export Statistics by Month and Destination, Ukraine, 1000 MT (HS Code 1003)

GAIN Report – UP1412 – Grain and Feed Annual Report Page 24 of 30
UNCLASSIFIED USDA Foreign Agricultural Service
Quantity % Share Quantity % Share Quantity % Share
World 5,007.6 100.00 15,207.9 100.00 12,725.0 100.00 - 16.33
Spain 672.2 13.42 2,248.3 14.78 2,466.9 19.39 9.72
Egypt 992.8 19.83 3,796.6 24.96 1,512.2 11.88 - 60.17
Italy 208.2 4.16 127.7 0.84 1,321.7 10.39 935.02
Netherlands 263.1 5.25 299.5 1.97 1,001.0 7.87 234.23
Iran 641.3 12.81 1,784.3 11.73 923.1 7.25 - 48.27
Israel 256.3 5.12 649.7 4.27 834.7 6.56 28.48
Portugal 316.8 6.33 1,005.3 6.61 657.8 5.17 - 34.56
Turkey 152.2 3.04 49.8 0.33 511.8 4.02 927.83
Syria 322.6 6.44 643.3 4.23 461.9 3.63 - 28.21
Ireland 27.5 0.55 107.4 0.71 446.0 3.50 315.11
Libya 142.7 2.85 402.9 2.65 385.4 3.03 - 4.33
Japan 0.1 0.00 965.6 6.35 350.3 2.75 - 63.72
Belgium 0.0 0.00 80.9 0.53 349.5 2.75 331.88
United Kingdom 25.8 0.52 27.5 0.18 177.5 1.39 544.38
Germany 7.6 0.15 44.7 0.29 166.9 1.31 273.04
Lebanon 117.0 2.34 289.2 1.90 156.1 1.23 - 46.02
Tunisia 227.5 4.54 460.8 3.03 153.9 1.21 - 66.60
Korea South 0.0 0.00 850.3 5.59 123.5 0.97 - 85.48
Denmark 0.0 0.00 0.0 0.00 108.8 0.86 ∞
Lithuania 75.9 1.52 73.0 0.48 106.1 0.83 45.33
France 30.1 0.60 0.0 0.00 99.9 0.79 ∞
Algeria 88.8 1.77 384.5 2.53 71.2 0.56 - 81.48
Belarus 68.7 1.37 75.8 0.50 70.7 0.56 - 6.63
Cyprus 14.4 0.29 10.9 0.07 55.9 0.44 413.21
Greece 44.3 0.88 12.6 0.08 51.8 0.41 310.55
Poland 67.2 1.34 48.1 0.32 35.3 0.28 - 26.56
Jordan 0.0 0.00 26.9 0.18 27.0 0.21 0.25
Russia 87.5 1.75 9.9 0.07 17.0 0.13 70.78
Georgia 31.4 0.63 8.8 0.06 16.5 0.13 88.57
Estonia 4.7 0.09 4.5 0.03 12.6 0.10 181.31
Latvia 4.6 0.09 16.2 0.11 10.6 0.08 - 34.54
Hungary 4.1 0.08 5.2 0.03 9.1 0.07 73.99
Azerbaijan 40.5 0.81 1.1 0.01 9.0 0.07 735.52
Armenia 30.4 0.61 0.0 0.00 6.1 0.05 0.00
Panama 0.0 0.00 0.0 0.00 4.5 0.04 ∞
Taiwan 0.6 0.01 71.0 0.47 4.1 0.03 - 94.24
China 0.0 0.00 0.0 0.00 0.1 0.00 0.00
Slovenia 0.0 0.00 0.0 0.00 0.1 0.00 0.00
South Africa 0.0 0.00 146.3 0.96 0.0 0.00 - 100.00
Saudi Arabia 21.9 0.44 177.6 1.17 0.0 0.00 - 100.00
Other 18.6 0.4 301.7 2.0 8.4 0.1 -97.2
Source: State Customs Committee of Ukraine
Corn Exports from Ukraine by Destination, MY, 1000 MT (HS Code 1005)
Destination
MY 2010/11
(Oct. 10-Sept. 11)
MY 2011/12
(Oct. 11-Sept. 12)
MY 2012/13
(Oct. 12-Sept. 13)% Change
MY 2012/13 to
2011/12

GAIN Report – UP1412 – Grain and Feed Annual Report Page 25 of 30
UNCLASSIFIED USDA Foreign Agricultural Service
Destination Oct-12 Nov-12 Dec-12
Subtotal
Oct-Dec
2012
Subtotal
MY
2012/13
Oct-13 Nov-13 Dec-13
Subtotal
Oct-Dec
2013
% Share
Oct-Dec
2013 to
MY
2012/13
% Change
Oct-Dec
2013 to
Oct-Dec
2012
World 1,056.7 1,467.3 2,102.2 4,626.2 12,725.0 1,304.1 3,263.6 4,062.9 8,630.6 67.8 186.6
Egypt 81.4 111.3 200.8 393.4 1,512.2 291.2 667.2 377.2 1,335.6 88.3 339.5
Korea South 0.0 0.0 120.8 120.8 123.5 368.2 298.7 638.6 1,305.5 1057.1 1080.8
Spain 316.5 444.9 636.3 1,397.7 2,466.9 97.4 453.4 713.8 1,264.6 51.3 90.5
Japan 57.8 0.0 5.0 62.8 350.3 91.9 422.6 446.6 961.0 274.3 1531.1
Iran 31.5 57.8 66.0 155.3 923.1 0.0 313.7 341.9 655.6 71.0 422.3
Netherlands 60.1 98.3 275.8 434.2 1,001.0 54.5 92.2 381.6 528.2 52.8 121.7
Italy 188.0 247.0 137.1 572.1 1,321.7 40.4 231.2 225.9 497.5 37.6 87.0
Portugal 48.6 191.8 0.0 240.5 657.8 0.0 101.0 152.7 253.7 38.6 105.5
Israel 38.5 41.5 97.9 177.9 834.7 59.1 47.5 98.7 205.4 24.6 115.4
United Kingdom 5.9 3.2 68.1 77.2 177.5 5.4 70.8 99.0 175.2 98.7 226.9
Syria 47.2 58.1 53.2 158.4 461.9 51.3 58.7 64.2 174.3 37.7 110.0
Tunisia 23.3 7.7 10.4 41.4 153.9 38.5 50.4 53.9 142.7 92.7 344.9
Ireland 55.0 13.3 67.0 135.3 446.0 24.6 22.0 78.4 125.0 28.0 92.4
Belgium 30.3 62.6 127.1 219.9 349.5 0.0 37.0 80.0 117.0 33.5 53.2
Germany 0.3 0.3 55.0 55.5 166.9 0.0 8.9 107.5 116.4 69.7 209.6
China 0.0 0.0 0.0 0.0 0.1 0.0 109.0 2.0 110.9 133666.3 ∞
Lithuania 2.4 3.1 5.2 10.7 106.1 11.2 43.2 47.5 101.9 96.0 948.5
Poland 1.9 3.3 5.0 10.2 35.3 8.0 30.7 41.5 80.3 227.3 786.4
Libya 19.8 42.6 106.9 169.4 385.4 32.2 21.0 21.7 74.9 19.4 44.2
Malaysia 0.0 0.0 0.0 0.0 0.0 1.7 67.0 1.6 70.4 ∞ ∞
Taiwan 0.0 0.5 0.0 0.5 4.1 22.8 5.8 31.1 59.7 1460.3 12337.0
Lebanon 5.9 14.7 11.0 31.6 156.1 16.2 40.7 0.7 57.6 36.9 182.2
Cuba 0.0 0.0 0.0 0.0 0.0 25.0 25.0 0.0 50.0 ∞ ∞
Belarus 5.5 3.4 4.2 13.1 70.7 5.9 10.8 11.0 27.7 39.2 211.4
Algeria 22.0 27.2 0.0 49.2 71.2 26.7 0.0 0.0 26.7 37.5 54.3
Morocco 0.0 0.0 0.0 0.0 0.0 26.3 0.0 0.0 26.3 ∞ ∞
France 0.0 20.7 5.6 26.3 99.9 0.0 0.0 26.1 26.1 26.2 99.2
Latvia 0.0 0.7 1.8 2.5 10.6 1.5 4.9 6.9 13.3 125.7 539.1
United Arab Emirates 0.0 0.0 0.0 0.0 0.0 0.0 9.2 0.1 9.3 ∞ ∞
Oman 0.0 0.0 0.0 0.0 0.0 0.0 9.1 0.0 9.1 ∞ ∞
Georgia 0.0 0.0 0.0 0.0 16.5 1.5 7.5 0.0 9.0 54.6 ∞
Armenia 0.0 0.0 0.0 0.0 6.1 2.0 0.0 2.5 4.5 74.6 ∞
Greece 3.0 3.0 0.0 6.0 51.8 0.0 0.0 4.3 4.3 8.3 71.6
Hungary 5.0 3.0 0.4 8.4 9.1 0.0 0.0 4.0 4.0 44.1 47.7
Vietnam 0.0 0.0 0.0 0.0 0.0 0.0 3.1 0.0 3.1 ∞ ∞
Estonia 0.3 2.4 1.6 4.3 12.6 0.3 1.0 0.9 2.2 17.8 52.7
Russia 0.0 0.4 0.6 1.0 17.0 0.2 0.2 0.8 1.1 6.8 119.4
Austria 0.0 0.0 0.0 0.0 0.0 0.0 0.1 0.1 0.2 ∞ ∞
Jordan 0.0 0.0 0.0 0.0 27.0 0.0 0.0 0.1 0.1 0.5 ∞
Finland 0.0 0.0 0.0 0.0 0.0 0.0 0.0 0.1 0.1 ∞ ∞
Cyprus 6.6 3.3 0.0 9.9 55.9 0.0 0.0 0.0 0.0 0.1 0.5
Denmark 0.0 0.0 28.9 28.9 108.8 0.0 0.0 0.0 0.0 0.0 0.0
Other 0.0 1.3 10.6 11.9 450.7 0.0 0.0 0.0 0.0 0.0 0.0
Corn Export Statistics by Month and Destination, Ukraine, 1000 MT (HS Code 1005)
Source: State Customs Committee of Ukraine

GAIN Report – UP1412 – Grain and Feed Annual Report Page 26 of 30
UNCLASSIFIED USDA Foreign Agricultural Service
Quantity % Share Quantity % Share Quantity % Share
World 42.6 100.00 51.2 100.00 49.2 100.00 - 3.92
France 6.5 15.21 10.5 20.47 13.1 26.55 24.66
Hungary 11.7 27.52 17.0 33.28 12.6 25.66 - 25.93
Romania 10.9 25.65 15.3 29.84 9.4 19.05 - 38.68
United States 4.4 10.35 3.5 6.81 2.7 5.55 - 21.66
Chile 0.9 2.20 1.0 1.90 2.6 5.24 164.45
Serbia 0.3 0.72 0.6 1.21 2.1 4.18 230.70
Canada 2.5 5.81 0.6 1.08 1.5 3.01 167.07
Slovakia 0.7 1.56 0.9 1.66 1.4 2.84 63.96
Belarus 1.1 2.56 0.3 0.63 1.1 2.30 251.86
Austria 1.2 2.88 0.9 1.76 0.9 1.75 - 4.31
Bulgaria 0.2 0.44 0.0 0.05 0.4 0.72 1272.80
Poland 0.0 0.00 0.0 0.00 0.3 0.54 ∞
Argentina 0.1 0.21 0.2 0.30 0.3 0.53 68.95
Virgin Islands (British) 0.0 0.00 0.0 0.00 0.3 0.51 0.00
Germany 0.2 0.56 0.1 0.19 0.2 0.47 137.99
Italy 0.0 0.01 0.0 0.01 0.2 0.37 5210.84
New Zealand 0.0 0.10 0.0 0.00 0.1 0.21 4985.58
Croatia 0.4 0.91 0.2 0.47 0.1 0.20 - 59.58
Moldova 0.2 0.48 0.1 0.24 0.1 0.17 - 29.56
Russia 0.0 0.00 0.0 0.04 0.1 0.12 195.15
Turkey 1.1 2.69 0.0 0.04 0.0 0.04 - 3.96
Netherlands 0.0 0.00 0.0 0.00 0.0 0.00 0.00
Mexico 0.0 0.00 0.0 0.00 0.0 0.00 1.87
Spain 0.1 0.14 0.0 0.00 0.0 0.00 0.00
Suriname 0.0 0.00 0.0 0.00 0.0 0.00 0.00
Switzerland 0.0 0.01 0.0 0.01 0.0 0.00 - 100.00
Greece 0.0 0.03 0.0 0.00 0.0 0.00 0.00
Australia 0.0 0.01 0.0 0.00 0.0 0.00 0.00
Source: State Customs Committee of Ukraine
Corn Imports to Ukraine by Origin, MY, 1000 MT (HS Code 1005)
Origin
MY 2010/11
(Oct. 10-Sept. 11)
MY 2011/12
(Oct. 11-Sept. 12)
MY 2012/13
(Oct. 12-Sept. 13)% Change
MY 2012/13 to
2011/12
GAIN Report – UP1412 – Grain and Feed Annual Report Page 27 of 30
UNCLASSIFIED USDA Foreign Agricultural Service
Quantity % Share Quantity % Share Quantity % Share
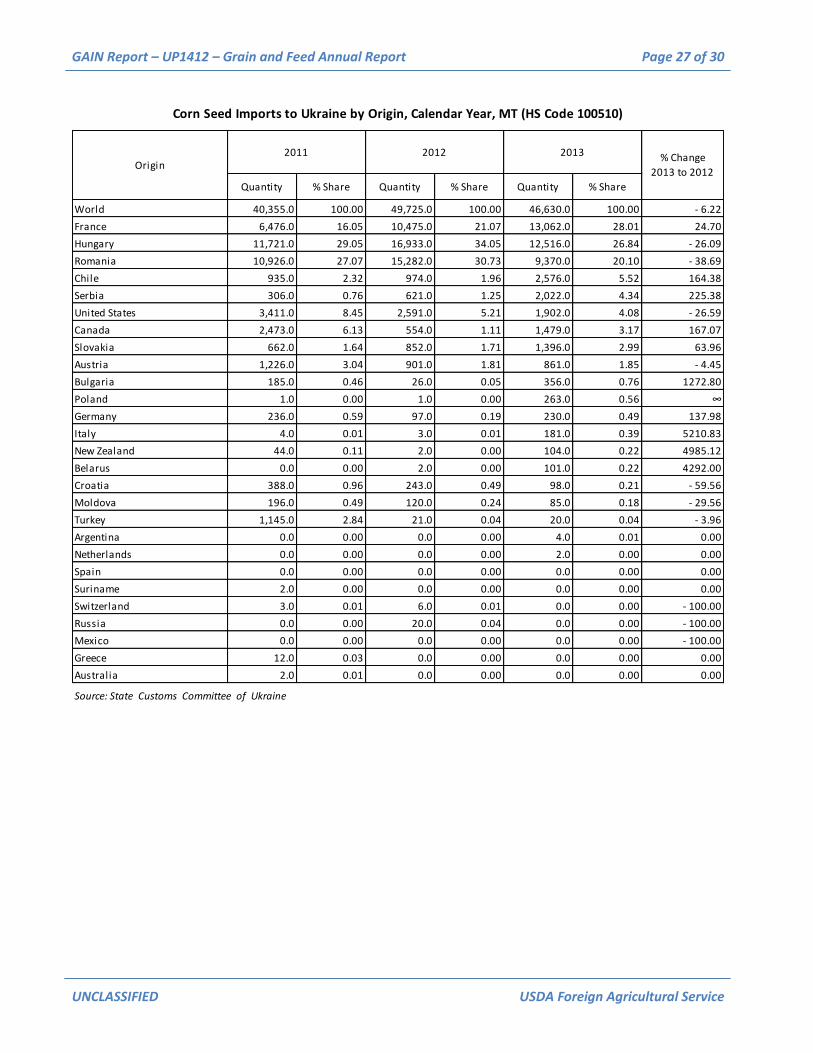
World 40,355.0 100.00 49,725.0 100.00 46,630.0 100.00 - 6.22
France 6,476.0 16.05 10,475.0 21.07 13,062.0 28.01 24.70
Hungary 11,721.0 29.05 16,933.0 34.05 12,516.0 26.84 - 26.09
Romania 10,926.0 27.07 15,282.0 30.73 9,370.0 20.10 - 38.69
Chile 935.0 2.32 974.0 1.96 2,576.0 5.52 164.38
Serbia 306.0 0.76 621.0 1.25 2,022.0 4.34 225.38
United States 3,411.0 8.45 2,591.0 5.21 1,902.0 4.08 - 26.59
Canada 2,473.0 6.13 554.0 1.11 1,479.0 3.17 167.07
Slovakia 662.0 1.64 852.0 1.71 1,396.0 2.99 63.96
Austria 1,226.0 3.04 901.0 1.81 861.0 1.85 - 4.45
Bulgaria 185.0 0.46 26.0 0.05 356.0 0.76 1272.80
Poland 1.0 0.00 1.0 0.00 263.0 0.56 ∞
Germany 236.0 0.59 97.0 0.19 230.0 0.49 137.98
Italy 4.0 0.01 3.0 0.01 181.0 0.39 5210.83
New Zealand 44.0 0.11 2.0 0.00 104.0 0.22 4985.12
Belarus 0.0 0.00 2.0 0.00 101.0 0.22 4292.00
Croatia 388.0 0.96 243.0 0.49 98.0 0.21 - 59.56
Moldova 196.0 0.49 120.0 0.24 85.0 0.18 - 29.56
Turkey 1,145.0 2.84 21.0 0.04 20.0 0.04 - 3.96
Argentina 0.0 0.00 0.0 0.00 4.0 0.01 0.00
Netherlands 0.0 0.00 0.0 0.00 2.0 0.00 0.00
Spain 0.0 0.00 0.0 0.00 0.0 0.00 0.00
Suriname 2.0 0.00 0.0 0.00 0.0 0.00 0.00
Switzerland 3.0 0.01 6.0 0.01 0.0 0.00 - 100.00
Russia 0.0 0.00 20.0 0.04 0.0 0.00 - 100.00
Mexico 0.0 0.00 0.0 0.00 0.0 0.00 - 100.00
Greece 12.0 0.03 0.0 0.00 0.0 0.00 0.00
Australia 2.0 0.01 0.0 0.00 0.0 0.00 0.00
Source: State Customs Committee of Ukraine
Corn Seed Imports to Ukraine by Origin, Calendar Year, MT (HS Code 100510)
Origin2011 2012 2013 % Change
2013 to 2012

GAIN Report – UP1412 – Grain and Feed Annual Report Page 28 of 30
UNCLASSIFIED USDA Foreign Agricultural Service
OriginOctober
2012
November
2012
December
2012
Subtotal
Oct.-
Dec.2012
Subtotal
MY
2012/13
October
2013
November
2013
December
2013
Subtotal
Oct.-
Dec.2013
% Share
Oct-Dec
2013 to
MY
2012/13
% Change
Oct-Dec
2013 to
Oct-Dec
2012
World 737.0 1,112.0 3,843.0 5,692.0 49,196.0 65.0 1,313.0 4,676.0 6,054.0 12.3 106.4
Hungary 0.0 0.0 1,487.0 1,487.0 12,621.0 0.0 393.0 2,497.0 2,890.0 22.9 194.4
Romania 0.0 0.0 1,048.0 1,048.0 9,370.0 0.0 633.0 1,450.0 2,083.0 22.2 198.8
United States 145.0 42.0 149.0 336.0 2,730.0 20.0 42.0 220.0 282.0 10.3 83.9
Chile 577.0 40.0 7.0 624.0 2,576.0 28.0 170.0 67.0 265.0 10.3 42.5
Serbia 0.0 0.0 561.0 561.0 2,055.0 0.0 4.0 221.0 225.0 10.9 40.1
Argentina 0.0 0.0 55.0 55.0 263.0 0.0 51.0 77.0 128.0 48.7 232.7
France 0.0 0.0 397.0 397.0 13,063.0 0.0 0.0 103.0 103.0 0.8 25.9
Russia 0.0 0.0 19.0 19.0 57.0 16.0 19.0 19.0 54.0 94.7 284.2
Austria 0.0 0.0 0.0 0.0 862.0 0.0 0.0 20.0 20.0 2.3 ∞
Germany 0.0 0.0 0.0 0.0 230.0 0.0 0.0 0.0 0.0 0.0 ∞
Greece 0.0 0.0 0.0 0.0 0.0 0.0 0.0 0.0 0.0 ∞ ∞
Slovakia 0.0 0.0 0.0 0.0 1,396.0 0.0 0.0 0.0 0.0 0.0 ∞
Spain 0.0 0.0 0.0 0.0 0.0 0.0 0.0 0.0 0.0 ∞ ∞
Suriname 0.0 0.0 0.0 0.0 0.0 0.0 0.0 0.0 0.0 ∞ ∞
Switzerland 0.0 0.0 0.0 0.0 0.0 0.0 0.0 0.0 0.0 ∞ ∞
Thailand 0.0 0.0 0.0 0.0 0.0 0.0 0.0 0.0 0.0 ∞ ∞
Turkey 0.0 0.0 0.0 0.0 20.0 0.0 0.0 0.0 0.0 0.0 ∞
Virgin Islands (British) 0.0 0.0 0.0 0.0 250.0 0.0 0.0 0.0 0.0 0.0 ∞
Belarus 15.0 1,030.0 0.0 1,045.0 1,131.0 0.0 0.0 0.0 0.0 0.0 0.0
Bulgaria 0.0 0.0 0.0 0.0 356.0 0.0 0.0 0.0 0.0 0.0 ∞
Canada 0.0 0.0 40.0 40.0 1,479.0 0.0 0.0 0.0 0.0 0.0 0.0
Croatia 0.0 0.0 0.0 0.0 98.0 0.0 0.0 0.0 0.0 0.0 ∞
Australia 0.0 0.0 0.0 0.0 0.0 0.0 0.0 0.0 0.0 ∞ ∞
India 0.0 0.0 0.0 0.0 0.0 0.0 0.0 0.0 0.0 ∞ ∞
Italy 0.0 0.0 72.0 72.0 181.0 0.0 0.0 0.0 0.0 0.0 0.0
Mexico 0.0 0.0 0.0 0.0 0.0 0.0 0.0 0.0 0.0 ∞ ∞
Moldova 0.0 0.0 0.0 0.0 85.0 0.0 0.0 0.0 0.0 0.0 ∞
Netherlands 0.0 0.0 0.0 0.0 2.0 0.0 0.0 0.0 0.0 0.0 ∞
New Zealand 0.0 0.0 6.0 6.0 104.0 0.0 0.0 0.0 0.0 0.0 0.0
Poland 0.0 0.0 0.0 0.0 263.0 0.0 0.0 0.0 0.0 0.0 ∞
Puerto Rico (U.S.) 0.0 0.0 0.0 0.0 0.0 0.0 0.0 0.0 0.0 ∞ ∞
Source: State Customs Committee of Ukraine
Corn Seed Imports to Ukraine by Month and Origin, MT (HS Code 100510)

GAIN Report – UP1412 – Grain and Feed Annual Report Page 29 of 30
UNCLASSIFIED USDA Foreign Agricultural Service
Quantity % Share Quantity % Share Quantity % Share
World 38.3 100.00 11.1 100.00 16.5 100.00 48.47
Israel 0.0 0.00 0.0 0.00 12.3 74.22 0.00
United Kingdom 0.0 0.00 0.0 0.00 1.3 8.07 0.00
Latvia 0.0 0.00 0.5 4.57 1.1 6.94 125.59
Poland 0.0 0.00 9.0 80.73 1.0 6.05 - 88.88
Netherlands 0.0 0.00 0.6 5.66 0.6 3.79 - 0.56
Switzerland 0.0 0.00 0.0 0.09 0.2 0.93 1440.00
Egypt 30.6 79.93 0.0 0.00 0.0 0.00 0.00
Germany 0.0 0.00 0.0 0.00 0.0 0.00 0.00
Lithuania 0.0 0.00 1.0 8.96 0.0 0.00 - 100.00
Syria 7.7 20.07 0.0 0.00 0.0 0.00 0.00
Destination
MY 2010/11
(July 10-June 11)
MY 2011/12
(July 11-June 12)
Rye Exports from Ukraine by Destination, MY, 1000 MT (HS Code 1002)
Source: State Customs Committee of Ukraine
% Change
MY 2012/13 to
2011/12
MY 2012/13
(July 12-June 13)

GAIN Report – UP1412 – Grain and Feed Annual Report Page 30 of 30
UNCLASSIFIED USDA Foreign Agricultural Service
Destination Jul-12 Aug-12 Sep-12 Oct-12 Nov-12 Dec-12
Subtotal
Jul-Dec
2012
Subtotal
MY
2012/13
Jul-13 Aug-13 Sep-13 Oct-13 Nov-13 Dec-13
Subtotal
Jul-Dec
2013
% Share
Jul-Dec
2013 to
MY
2012/13
% Change
Jul-Dec
2013 to
Jul-Dec
2012
World 0.0 0.2 0.6 1.1 3.3 0.4 5.7 16.5 0.4 3.0 7.8 0.0 0.1 0.0 11.2 198.04 67.97
Israel 0.0 0.0 0.0 0.0 3.0 0.0 3.0 12.3 0.0 3.0 6.3 0.0 0.0 0.0 9.3 309.07 75.55
Poland 0.0 0.0 0.0 0.0 0.0 0.0 0.0 1.0 0.0 0.0 1.0 0.0 0.0 0.0 1.0 ∞ 100.00
United Kingdom 0.0 0.0 0.5 0.0 0.3 0.0 0.8 1.3 0.0 0.0 0.5 0.0 0.0 0.0 0.5 59.95 37.48
Netherlands 0.0 0.2 0.1 0.0 0.0 0.3 0.6 0.6 0.3 0.0 0.0 0.0 0.0 0.0 0.3 50.00 50.00
Switzerland 0.0 0.0 0.0 0.0 0.0 0.1 0.1 0.2 0.1 0.0 0.0 0.0 0.1 0.0 0.2 233.33 100.00
Latvia 0.0 0.0 0.0 1.1 0.0 0.0 1.1 1.1 0.0 0.0 0.0 0.0 0.0 0.0 0.0 0.00 0.00
Belarus 0.0 0.0 0.0 0.0 0.0 0.0 0.0 0.0 0.0 0.0 0.0 0.0 0.0 0.0 0.0 ∞ ∞
Germany 0.0 0.0 0.0 0.0 0.0 0.0 0.0 0.0 0.0 0.0 0.0 0.0 0.0 0.0 0.0 ∞ ∞
Lithuania 0.0 0.0 0.0 0.0 0.0 0.0 0.0 0.0 0.0 0.0 0.0 0.0 0.0 0.0 0.0 ∞ ∞
Source: State Customs Committee of Ukraine
Rye Export Statistics by Month and Destination, Ukraine, 1000 MT (HS Code 1002)