uk trade in numbers - assets.publishing.service.gov.uk · foreword with the renewed focus on trade...
TRANSCRIPT
UK Trade in NumbersSeptember 2019

Disclaimer
The figures used in this pocketbook are the latest at the time of publication. We include figures from monthly and quarterly publications, such as ONS Balance of Payments, Trade in Services by Partner Country, GDP and UK monthly Trade figures.
Often more up-to-date headline figures are available however a geographical breakdown is not available. Thus in some instances figures in the summary page may differ to other visuals presented.
UK and International sources do not always match. This can be due to exchange rate conversions used or delays in processing revisions. Readers are advised to reference sources and access the latest published statistics online.
Contact
This publication was produced by the Macro Analysis and Statistics Team, if you have any enquiries about the content please contact Jay Cheema at [email protected]
ForewordWith the renewed focus on trade that our department brings and the increased interest in UK trade data, I am delighted to present this pocketbook of UK trade and investment statistics. Trade statistics are a fascinating aspect of economic statistics and are a substantial source of information to help inform how we meet the challenges of trade policy and promotion in the UK.
Trade statistics are derived from a number of sources and can be presented in different ways. The UK’s trade statistics are primarily provided by Office for National Statistics (ONS) releases including the ONS UK monthly trade, ONS UK quarterly trade in services by partner country, UK Balance of Payments as well as the ‘Pink Book’.
These releases, alongside new Trade in Value Added data from the Organisation for Economic Co-operation and Development (OECD), set out the UK’s economic relationship with other countries on an internationally comparable basis. Beneath the surface is a wealth of data for us to understand and exploit for developing trade and investment policy. This pocketbook brings together and summarises trade statistics produced by ONS, HM Revenue & Customs (HMRC), Department for International Trade (DIT), OECD and others into a single visual product.
I hope it proves to be a handy reference whether you use trade statistics on a daily basis or are travelling abroad and want to show the UK trade position to colleagues.
Tom KnightChief Statistician
Department for International Trade
1UK Trade in Numbers

ContentsForeword 1
Summary (calendar year*) 4
Summary (latest period*) 6
Top 10 UK trading partners (2018) 7
Top 10 UK export markets for goods and services (2018) 8
Top 10 UK goods exports (2018) 10
Top 5 UK services exports (2018) 11
Top 10 UK import markets for goods and services (2018) 12
Top 10 UK goods imports (2018) 14
Top 5 UK services imports (2018) 15
UK bilateral trade in goods and services balances (2018) 16
UK’s largest trade surpluses (2018) 18
UK’s largest trade deficits (2018) 19
UK trade in goods and trade in services balances (2011 - 2018) 20
UK trade balances with the EU and non-EU (2011 - 2018) 20
World rankings for exports of goods and services (2005 - 2018) 21
World rankings for imports of goods and services (2005 - 2018) 21
2 UK Trade in Numbers

Origin of value added in UK gross exports (2015) 22
Top 5 export markets in gross and value added terms (2015) 23
Top 10 destinations for UK FDI (2017) 24
Top 10 investors in the UK (2017) 26
UK Inward FDI stocks (2008 - 2017) 28
Top 20 global destinations for FDI (2018) 28
UK Outward FDI stocks (2008 - 2017) 29
Top 20 global investors (2018) 29
Number of FDI projects into the UK and jobs created / safeguarded (2017-18 - 2018-19) 30
Number of FDI projects into the UK (2017 - 2018) 31
UK exports of goods by region (2018) 32
UK exports of services by region (2017) 34
Number of exporters of goods and/or services (2017) 36
3UK Trade in Numbers

Summary (calendar year*)
UK Total trade: £1,299.1bn (h 3.2%)(2018*)
Source: ONS UK Trade (July 2019)
of which (as % change since 2017):
Imports: £665.0bn (h 3.7%)
Exports: £634.1bn (h 2.7%)
Goods: £839.4bn (h 3.1%)
Services: £459.7bn (h 3.4%)
Source: ONS UK Trade (July 2019)
2018*
EU: £641.9bn (h 3.7%)
Non-EU: £657.2bn (h 2.7%)
Source: ONS Balance of Payments (January to March 2019)
2018
Trade as % of GDP: 61.3% (i -0.1 ppts)
Trade deficit as % of GDP: 1.5% (h 0.3 ppts)
Exports as % of GDP: 29.9% (i -0.2 ppts)
Source: ONS UK Trade (July 2019) and ONS GDP first quarterly estimate, UK (April to June 2019)
4 UK Trade in Numbers
* Figures provided are for the latest calendar year where available (whilst figures in brackets showthe change on the previous year).

2017
Number of GB businesses exporting*: 235,800 (h 6.6%)
Proportion of GB businesses exporting*: 9.9% (h 0.5 ppts)
Source: ONS, Annual Business Survey, Great Britain Non-Financial Business Economy: 2017 Exporters and Importers.
*Experimental statistics. Only covers registered businesses in the GB non-financial business economy.
2017
Outward FDI Stock: £1,313.3bn (h 3.0%)
Inward FDI Stock: £1,336.5bn (h 12.6%)
Note: Data are on a directional basis Source: ONS Foreign Direct Investment Involving UK Companies: 2017
2018 (rankings unchanged from 2017)
Global Ranking: Outward FDI stock 5th
5UK Trade in Numbers
Global Ranking: Inward FDI stock 3rd
Note: Data are on a directional basis Source: UNCTAD, World Investment Report 2019

Summary (latest period*)
UK Total trade £1,336.5bn (h 4.7%)(Year ending Source: ONS UK Trade (July 2019)Jul 2019*)
of which (as % change since year ending July 2018):
Imports: £689.9bn (h 6.1%)
Exports: £646.7bn (h 3.2%)
Goods: £865.7bn (h 4.8%)
Services: £470.9bn (h 4.4%)
Source: ONS UK Trade (July 2019)
( as % change since Year ending Mar 2019* year ending Mar 2018)
EU: £654.0bn (h 4.6%)
Non-EU: £677.8bn (h 5.9%)
Source: ONS Balance of Payments (January to March 2019)
Year ending June 2019
Trade as % of GDP: 62.0% (h 0.9 ppts)
Trade deficit as % of GDP: 2.1% (h 1.0 ppts)
Exports as % of GDP: 29.9% (i -0.1 ppts)
Source: ONS UK Trade (July 2019) and ONS GDP first quarterly estimate, UK (April to June 2019)
6 UK Trade in Numbers
* Figures provided are for the latest 12 month period for which data are available (whilst figures inbrackets show the change compared to previous 12 months where applicable).

Top 10 UK trading partners (2018)TOTAL TRADE RANK
Total % UK % UK %
Countrytrade
£bn (% of total
trade)
change since 2017
exports £bn, to
(% of total
exports)
change since 2017
imports £bn, from
(% of total imports)
change since 2017
1 United States*190.5 h 4.0% 118.2 h 3.9% 72.4 h 4.1%
(14.7%) (18.6%) (10.9%)
2 Germany132.7
(10.2%)
i -1.6% 55.4
(8.7%)
i -1.7% 77.3
(11.6%)
i -1.6%
3 Netherlands93.1
(7.2%)
h 8.7% 44.0
(6.9%)
h 14.1% 49.1
(7.4%)
h 4.2%
4 France84.9
(6.5%)
h 4.3% 42.1
(6.6%)
h 2.7% 42.8
(6.4%)
h 5.9%
5 China68.5
(5.3%)
h 2.3% 23.1
(3.6%)
h 4.6% 45.4
(6.8%)
h 1.1%
6 Ireland60.2
(4.6%)
h 2.6% 38.3
(6.0%)
h 4.2% 21.9
(3.3%)
i -0.3%
7 Spain49.9
(3.8%)
h 2.8% 17.6
(2.8%)
h 2.2% 32.3
(4.9%)
h 3.1%
8 Belgium48.6
(3.7%)
h 3.0% 19.4
(3.1%)
h 0.9% 29.1
(4.4%)
h 4.5%
9 Italy44.5
(3.4%)
h 3.4% 19.7
(3.1%)
h 2.4% 24.8
(3.7%)
h 4.3%
01 Switzerland30.5
(2.3%)
i -5.0% 19.6
(3.1%)
i -2.2% 10.9
(1.6%)
i -9.7%
Note: These figures for countries are only available on a non-seasonally adjusted basis, therefore for aggregate totals we recommend users to use summary page 6. Summary page 6 provides seasonally adjusted figures showing totals for UK total trade with the World, EU and Non-EU.
* including Puerto Rico
Source: ONS UK Trade, quarterly trade in goods and services: January to March 2019
7UK Trade in Numbers
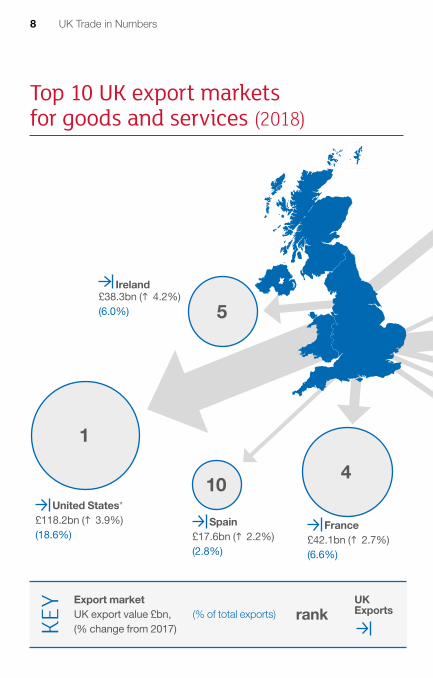
Top 10 UK export markets for goods and services (2018)
4
United States* £118.2bn (h 3.9%) (18.6%)
France £42.1bn (h 2.7%) (6.6%)
Ireland £38.3bn (h 4.2%) (6.0%)
Spain £17.6bn (h 2.2%) (2.8%)
KEY Export market UK export value £bn, (% change from 2017)
(% of total exports)UK Exports
10
1
5
8 UK Trade in Numbers
rank

2
3
68
Germany £55.4bn (i -1.7%) (8.7%)
Netherlands £44.0bn (h 14.1%) (6.9%)
Italy £19.7bn (h 2.4%) (3.1%)
Switzerland £19.6bn (i -2.2%) (3.1%)
9
China £23.1bn (h 4.6%) (3.6%)
Belgium £19.4bn (h 0.9%) (3.1%)
7
Note: These figures for countries are only available on a non-seasonally adjusted basis, therefore for aggregate totals we recommend users to use summary page 6. Summary page 6 provides seasonally adjusted figures showing totals for UK total trade with the World, EU and Non-EU.
*including Puerto Rico Source: ONS UK Trade, quarterly trade in goods and services: January to March 2019
9UK Trade in Numbers
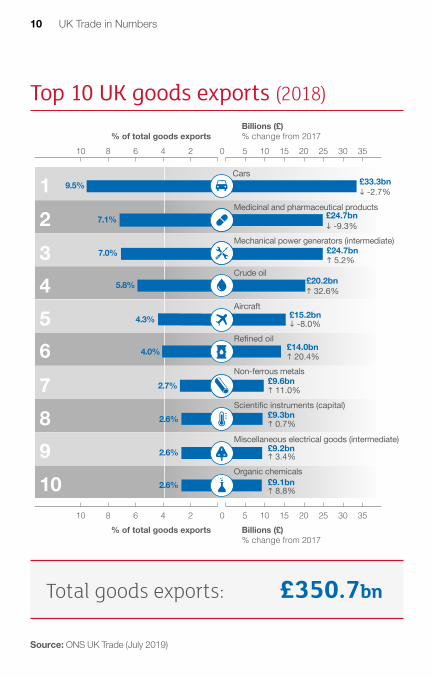
Top 10 UK goods exports (2018)
Organic chemicals
Aircraft
Medicinal and pharmaceutical products
Mechanical power generators (intermediate)
Refined oil
Non-ferrous metals
Scientific instruments (capital)
Miscellaneous electrical goods (intermediate)
Cars
Crude oil
£24.7bn
£15.2bn
£14.0bn
£9.6bn
£9.3bn
£9.1bn
£20.2bn
£9.2bn
£33.3bn
£24.7bn
10 15 25 355 20 30
10 15 25 355 20 30
Billions (£) % change from 2017
% of total goods exports
Billions (£) % change from 2017% of total goods exports
12345678910
7.1%
4.3%
4.0%
2.7%
2.6%
2.6%
5.8%
2.6%
9.5%
7.0%
0246810
0246810
-2.7%
5.2%
-8.0%
-9.3%
32.6%
20.4%
11.0%
0.7%
3.4%
8.8%
Total goods exports: £350.7bn
Source: ONS UK Trade (July 2019)
10 UK Trade in Numbers

Top 5 UK services exports (2018)
£61.4bn
£20.8bn
£30.2bn
£81.3bn
£38.9bn
4.4%
4.4%
1.7%
0.7%
2.0%
05101520253035
5101520253035
20 40 60 80 100
% of total services exports
0 20 40 60 80 100
Billions (£) % change from 2017% of total services exports
12345
21.7%
7.3%
10.7%
28.7%
13.7%
Other business services*
Financial services
Travel services
Transport services
Telecomms, computer and information
Billions (£) % change from 2017
*including professional, management consulting, technical
and trade-related services
Total services exports: £283.4bn
11UK Trade in Numbers
Source: ONS Balance of Payments (January to March 2019)

Top 10 UK import markets for goods and services (2018)
Ireland £21.9bn (i -0.3%) (3.3%)
United States* £72.4bn (h 4.1%) (10.9%) Spain
£32.3bn (h 3.1%) (4.9%)
France £42.8bn (h 5.9%) (6.4%)
KEY Import market UK import value £bn, (% change from 2017)
9
2
56
(% of total imports)UK Imports
12 UK Trade in Numbers
rank

10
Germany £77.3bn (i -1.6%) (11.6%)
Netherlands £49.1bn (h 4.2%) (7.4%)
7
China £45.4bn (h 1.1%) (6.8%)
Belgium £29.1bn (h 4.5%) (4.4%)
3
8
Italy £24.8bn (h 4.3%) (3.7%)
4
Norway £21.7bn (h 3.3%) (3.3%)
1
13UK Trade in Numbers
Note: These figures for countries are only available on a non-seasonally adjusted basis, therefore for aggregate totals we recommend users to use summary page 6. Summary page 6 provides seasonally adjusted figures showing totals for UK total trade with the World, EU and Non-EU.
*including Puerto Rico Source: ONS UK Trade, quarterly trade in goods and services: January to March 2019

Top 10 UK goods imports (2018)
Refined oil
Medicinal and pharmaceutical products
Road vehicles other than cars (intermediate)
Mechanical power generators (intermediate)
Crude oil
Telecoms and sound equipment (capital)
Miscellaneous electrical goods (intermediate)
Cars
Clothing
Other manufactures (consumer)
£24.7bn
£19.9bn
£19.7bn
£19.3bn
£16.1bn
£13.3bn
£20.6bn
£14.3bn
£33.0bn
£22.7bn
% of total goods imports
% of total goods imports
12345678910
5.0%
4.1%
4.0%
3.9%
3.3%
2.7%
4.2%
2.9%
6.7%
4.6%
-3.7%
-11.1%
-2.5%
-0.8%
24.8%
21.2%
6.0%
1.9%
4.0%
-2.0%
Billions (£) % change from 2017
Billions (£) % change from 2017
10 15 25 355 20 300246810
10 15 25 355 20 300246810
Total goods imports: £488.7bn
14 UK Trade in Numbers
Source: ONS UK Trade (July 2019)
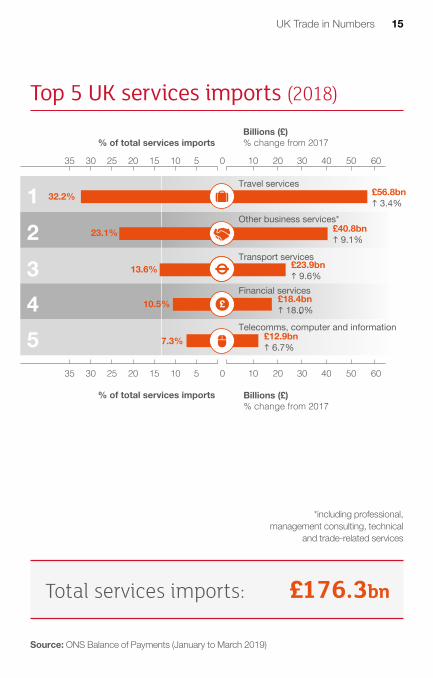
Top 5 UK services imports (2018)
£40.8bn
£12.9bn
£18.4bn
£56.8bn
£23.9bn
05101520253035 10 20 30 40 50 60
% of total services imports
05101520253035 10 20 30 40 50 60
% of total services imports
12345
23.1%
7.3%
10.5%
32.2%
13.6%
Other business services*
Transport services
Financial services
Travel services
Telecomms, computer and information
9.1%
6.7%
18.0%
3.4%
9.6%
Billions (£) % change from 2017
Billions (£) % change from 2017
*including professional, management consulting, technical
and trade-related services
Total services imports: £176.3bn
Source: ONS Balance of Payments (January to March 2019)
15UK Trade in Numbers

UK bilateral trade in goods and services balances (2018)
KEY
UK Trade deficit (imports exceed exports)
UK Trade surplus (exports exceed imports)
Neither a surplus nor a deficit
No Data available / Not applicable
16 UK Trade in Numbers

This map should not be taken as representative of the UK governments view of boundaries or political status
Source: ONS UK Trade, quarterly trade in goods and services: January to March 2019
17UK Trade in Numbers

UK’s largest trade surpluses (2018)
United States*
Ranking Partner country £ billionchange from 2017 £ billion
h 1.5
h 1.6
h 0.7
h 0.3
h 1.1
i -0.4
h 0.6
h 0.9
i -1.6
i -0.7
45.8
16.4
8.6
5.7
5.0
4.3
4.2
2.9
2.3
2.2
Ireland
Switzerland
Australia
South Korea
United Arab Emirates
Singapore
Guernsey
Saudi Arabia
Gibraltar
1
2
3
4
5
6
7
8
9
10
* including Puerto RicoSource: ONS UK Trade, quarterly trade in
goods and services: January to March 2019
18 UK Trade in Numbers
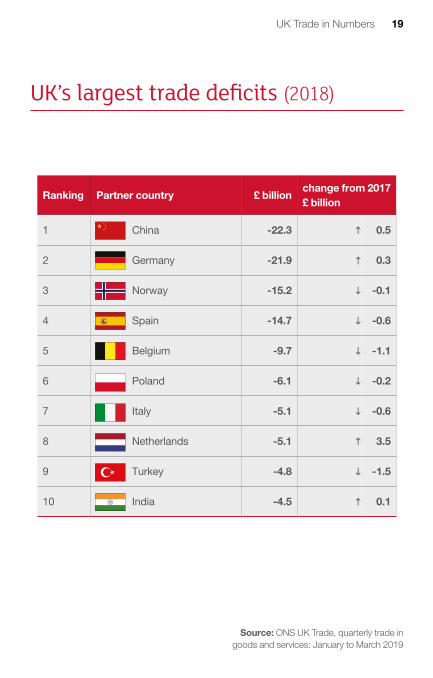
UK’s largest trade deficits (2018)
Ranking Partner country £ billionchange from 2017 £ billion
1 China -22.3 h 0.5
2 Germany -21.9 h 0.3
3 Norway -15.2 i -0.1
4 Spain -14.7 i -0.6
5 Belgium -9.7 i -1.1
6 Poland -6.1 i -0.2
7 Italy -5.1 i -0.6
8 Netherlands -5.1 h 3.5
9 Turkey -4.8 i -1.5
10 India -4.5 h 0.1
Source: ONS UK Trade, quarterly trade in goods and services: January to March 2019
19UK Trade in Numbers

UK trade in goods and trade in services balances (2011 - 2018)
Bill
ions
(£)
2011 2012 2013 2014 2015 2017 20182016-150-120-90-60-30
0306090
120
-94.
475
.9
-106
.781
.1
-119
.090
.0
-122
.192
.4
-117
.890
.8
-132
.710
1.8
-137
.0
-138
.1
113.
1
107.
1
Trade in goods balance Trade in services balance
Total trade balance
UK trade balances with the EU and non-EU (2011 - 2018)
Source: ONS UK Trade (July 2019)
Bill
ions
(£)
2011 2012 2013 2014 2015 2017 20182016-150-120-90-60-30
0306090
120
-20.
11.
6
-36.
010
.4
-52.
123
.1
-53.
323
.6
-64.
137
.1
-74.
6
-61.
4
43.7
37.4
-64.
033
.1
Trade balance with the EU Trade balance with non-EU
Total trade balance
20 UK Trade in Numbers
Source: Balance of Payments (January to March 2019)

World rankings for exports of goods and services (2005 - 2018)
Wor
ld R
anki
ng
1
2
3
4
5
6
7
2007 200820062005 2009 2010 2011 2012 2013 2014 2015 2016 2017 2018*
China United States Germany Japan France UK * estimated
Source: UNCTAD
World rankings for imports of goods and services (2005 - 2018)
Wor
ld R
anki
ng
1
2
3
4
5
6
7
2007 200820062005 2009 2010 2011 2012 2013 2014 2015 2016 2017 2018*
China United States Germany Japan France UK * estimated
Source: UNCTAD
21UK Trade in Numbers
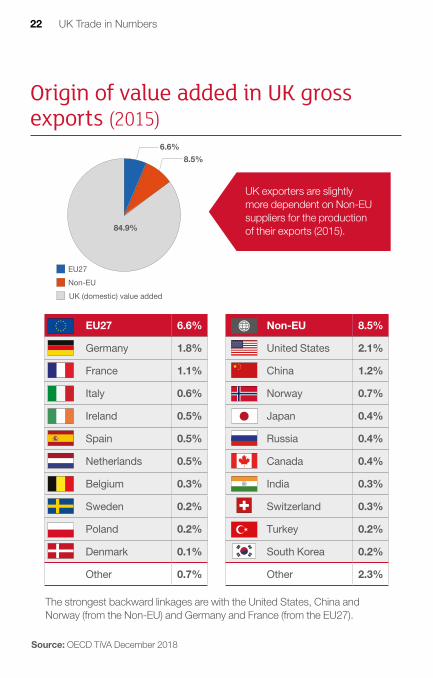
Origin of value added in UK gross exports (2015)
EU27
84.9%
8.5%6.6%
Non-EUUK (domestic) value added
UK exporters are slightly more dependent on Non-EU suppliers for the production of their exports (2015).
Non-EU 8.5%
United States 2.1%
China 1.2%
Norway 0.7%
Japan 0.4%
Russia 0.4%
Canada 0.4%
India 0.3%
Switzerland 0.3%
Turkey 0.2%
South Korea 0.2%
Other 2.3%
The strongest backward linkages are with the United States, China and Norway (from the Non-EU) and Germany and France (from the EU27).
22 UK Trade in Numbers
Source: OECD TiVA December 2018
EU27 6.6%
Germany 1.8%
France 1.1%
Italy 0.6%
Ireland 0.5%
Spain 0.5%
Netherlands 0.5%
Belgium 0.3%
Sweden 0.2%
Poland 0.2%
Denmark 0.1%
Other 0.7%

Top 5 export markets in gross and value added terms (2015)Top 5 export markets for the UK in 2015
Gross data
Partner % of total% of total exportsexports
1
2
3
4
United States
Germany
France
Ireland
15.7%
8.1%
6.6%
5.9%
5 China
EU
World
4.6%
43.5%
100.0%
Value added data
1
2
3
4
Partner
United States
Germany
France
China
% of total exports
17.9%
7.8%
6.5%
5.6%
5 Ireland
EU
World
3.4%
37.0%
100.0%
23UK Trade in Numbers
The United States was the UK’s largest export market in both gross and value added terms in 2015.
In value added terms, the importance of the United States as an export market is amplified, with a share of 17.9%, while the EU27 becomes a less important export market (with a share of 37.0%, compared to 43.5% in gross terms).
Source: OECD TiVA December 2018

Top 10 destinations for UK FDI (2017)
Outward FDI stock, directional basis
The United States was the top destinationfor UK investment in 2017.
United States £257.8bn (h 8.4%) (19.6%)
France £78.8bn (h 10.1%)(6.0%)
Spain £70.5bn (h 8.7(5.4%)
%)
Ireland £61.8bn (h 27.0%) (4.7%)
54
UK Offshore Islands £53.6bn (h 21.9%) (4.1%)
8
1
KEY Investment destination Outward FDI stock £bn, (% change from 2016) (% of total outward FDI stock)
Outward FDI stock
7
24 UK Trade in Numbers
rank

2 Netherlands £153.3bn (i -12.6%) (11.7%)
Luxembourg £112.1bn (i -3.3%) (8.5%)
Hong Kong £66.1bn (h 7.6%) (5.0%)
Switzerland £51.9bn (h 123.6%) (4.0%)
9
6Australia £35.7bn (i -12.9%) (2.7%)
10
3
25UK Trade in Numbers
UK FDI in the EU £576.3bn (i -0.3%) (43.9%)
UK FDI in the Non-EU £737.0bn (h 5.8%) (56.1%)
Total UK FDI abroad £1,313.3bn (h 3.0%) (100%)
FDI statistics are compiled on the basis of the immediate, rather than the ultimate, partner country. Pass-through investment often leads to an overstatement of investments in or from big financial centres, or countries offering favourable tax terms to investors, distorting the geographical distribution of FDI flows and FDI rankings. (
Source: Foreign Direct Investment involving UK companies 2017, ONS
FDI stocks, directional basis)
Top 10 investors in the UK (2017)
87
Inward FDI stock, directional basis
The United States was the top investor in the UK in 2017.
rank
United States £351.0bn (h 19.5%) (26.3%)
UK Offshore Islands £114.4bn (h 45.3%) (8.6%)
4
1
Spain £50.2bn (h 64.6%) (3.8%)
France £57.6bn (i -14.0%) (4.3%)
Inward FDI stock
26 UK Trade in Numbers
KEY Source country Inward FDI stock £bn, (% change from 2016) (% of total inward FDI stock)

France £57.6bn (i -14.0%) (4.3%)
EU FDI in the UK £573.1bn (h 3.9%) (42.9%)
Total FDI in the UK £1,336.5bn (h 12.6%) (100%)
Non-EU FDI in the UK £763.4bn (h 20.1%) (57.1%)
* Undisclosed figure
2Netherlands £228.2bn (h 7.7%) (17.1%)
Luxembourg £116.3bn (h 0.8%) (8.7%)
3
Japan £77.7bn (h 71.0%) (5.8%)
5
Germany £63.6bn (h 4.2%) (4.8%)
6
Switzerland £45.1bn (h 2.7%) (3.4%)
Hong Kong (*) £20.4bn (1.5%)
109
27UK Trade in Numbers
FDI statistics are compiled on the basis of the immediate, rather than the ultimate, partner country. Pass-through investment often leads to an overstatement of investments in or from big financial centres, or countries offering favourable tax terms to investors, distorting the geographical distribution of FDI flows and FDI rankings.
Source: Foreign Direct Investment involving UK companies 2017, ONS
(FDI stocks, directional basis)

UK Inward FDI stocks (2008 - 2017)
Bill
ions
(£)
2008 2009 2010 2011 2012 2013 2014 20162015 20170
300
600
900
1,200
1,500
317 344 347 366452 462 490 552
441
763
308 289 335 382461 456
523
636592
625 634 682 749913 918
1,013
1,1871,033
1,337
573
Source: ONS Foreign Direct Investment Involving UK
Companies: 2017 Source: EU Source: Non EU
Top 20 global destinations for FDI (2018)
Billions ($)
7,4651,997
1,6741,6281,4811,063
939910894825745684683659525522486431407
1,890
0 1,000 2,000 3,000 4,000 5,000 6,000 7,000 8,000 9,000
United StatesHong Kong
United KingdomNetherlands
ChinaSingapore
Switzerland*Germany
IrelandCanadaFrance
British Virgin IslandsBrazil
AustraliaSpain
Cayman IslandsBelgiumMexico
ItalyRussia
Note: Data are on a directional basis * Includes Liechtenstein
28 UK Trade in Numbers
Source: UNCTAD
Note: Data are on a directional basis

UK Outward FDI stocks (2008 - 2017)
Bill
ions
(£)
2008 2009 2010 2011 2012 2013 2014 20162015 20170
300
600
900
1,200
1,500
576
7371,313
538 504
510
565
513
557
561
505
569
455
636
445
634
456
628
578
696581 1,014 1,077 1,118 1,073 1,091 1,079 1,084
1,2751,119
Source: ONS Foreign Direct Investment Involving UK
Companies: 2017 Destination: EU Destination: Non EU
Top 20 global investors (2018)
Billions ($)
6,4752,427
1,87016971,6651.6451,5081,3251,263
1,021912898578563549491388371344
1,939
0 1,000 2,000 3,000 4,000 5,000 6,000 7,000 8,000 9,000
United StatesNetherlands China
Hong Kong United Kingdom
Japan Germany
France Canada
Switzerland* Singapore
Ireland British Virgin Islands
Belgium Spain
Italy Australia
Korea, Republic of Sweden
Russia
Source: UNCTADNote: Data are on a directional basis * Includes Liechtenstein
29UK Trade in Numbers
Note: Data are on a directional basis

Number of FDI projects into the UK and jobs created / safeguarded (2017-18 - 2018-19)
2017-18 2018-19 % change
Total projects 2,072 1,782 i -14.0%
Involved projects 1,682 1,436 i -14.6%
Total Jobs 91,031 64,623 i -29.0%
New jobs 75,968 57,625 i -24.1%
Safeguarded jobs 15,063 6,998 i -53.5%
2018-19 Total Projects
1,782
Projects by investors new
to the UK 730
Projects by existing investors in the UK 1,052
30 UK Trade in Numbers
Source: Department for International Trade inward investment results 2018 to 2019

Number of FDI projects into the UK (2017 - 2018)
The fDi Report 2019: Number of UK Inward FDI Projects is increasing
Country 2017 2018 % change
UK 1,075 1,278 h 18.9%
France 698 588 i -15.8%
Germany 1,031 568 i -44.9%
Spain 395 551 h 39.5%
Netherlands 275 275 n 0.0%
Ireland 202 219 h 8.4%
The EY UK Attractiveness Survey 2018 and 2019: Number of UK Inward FDI Projects is decreasing
Country 2017 2018 % change
UK 1,205 1,054 i -12.5%
France 1,019 1,027 h 0.8%
Germany 1,124 973 i -13.4%
Source: The fDi Report 2019, Financial Times & The EY UK Attractiveness Survey 2018 and 2019
Notes: EY and FT (supported fDi Markets), publish data on greenfield FDI only, and report on a calendar year basis.
DIT reports on greenfield and M&A FDI on a financial year basis.
31UK Trade in Numbers

UK exports of goods by region (2018)
Of the total UK goods exports in 2018, £249.0bn (73%) were from England. The region with the highest value of exports was the South East, which exported £47.0bn worth of goods. 14% of the total value of UK goods exports.
The region or UK country with the highest growth in goods exports during 2018 was Scotland, where the value of goods exports grew by 13%.
Yorkshire and The Humber and the East Midlands also achieved high levels of goods export growth during 2018, both with increases of 8%. Whilst three regions, the North West, the West Midlands and the East, saw decreases in the value of goods exported in 2018 compared to 2017.
Source: HMRC, Regional Trade Statistics (April to June 2019)
Notes:
1. The ONS UK T rade (July 2019) currently provides the best estimate for the total value of UK exports of goods in 2018 which is £350.7bn. This is not directly comparable with the HMRCestimates presented here due to differences in coverage and methodology.
2. The sum of exports of goods by region does not add up to 100% as 9.5% (£32.2bn) of goods exported from the UK in 2018 cannot be allocated to a region.
3. These data ar e not comparable with the ONS regional trade in services data on pages 34 and35 due to differences in coverage and methodology.
West Midlands£33.4bn (i -0.1%)
32 UK Trade in Numbers

0.0 – 10.0
10.1 – 20.0
20.1 – 30.0
30.1 – 40.0
≥ 40.1
Scotland £32.2bn (h 12.7%)
Northern Ireland £8.9bn (h 2.3%)
North West £27.9bn (i -2.9%)
West Midlands £33.4bn (i -0.1%)
Wales £17.2bn (h 4.3%)
South West £21.5bn (h 5.1%)
North East £13.2bn (h 2.0%)
Yorkshire and The Humber £18.2bn (h 8.0%)
East Midlands £22.2bn (h 7.9%)
East of England £28.3bn (i -2.3%)
London £37.5bn (h 3.5%)
South East £47.0bn (h 3.7%)
33UK Trade in NumbersKey: £ billions (% change from 2017)

UK exports of services by region (2017)
Source: ONS, Subnational exports of services from the UK, 2017
Notes:
1. The ONS UK T rade (July 2019) currently provides the best estimate for the total value of UK exports of services in 2017, £278.8bn. The above sources are closely aligned (£278.7bn for2017).
2. Experimental statistics (i.e. not yet fully developed). Data for 2017 ar e not entirely consistent with data for 2016 due to methodological improvements and ONS therefore strongly advisecaution when comparing these results with previous results.
3. These data ar e not comparable with the HMRC regional trade in goods data on pages 32and 33 due to differences in coverage and methodology.
West Midlands£11.5bn (h 25.7%)
Of the total UK services exports in 2017, £245.7bn (88%) were from England. The region with the highest value of exports was London, which exported £116.6bn in services, 42% of the total value of services exported by the UK.
The regions or UK countries with the highest growth in services exports were Wales, exporting 47% more services during 2017, and the North East, exporting 31% more.
Only one region exported fewer services in 2017, London, down 1% compared to 2016.
34 UK Trade in Numbers
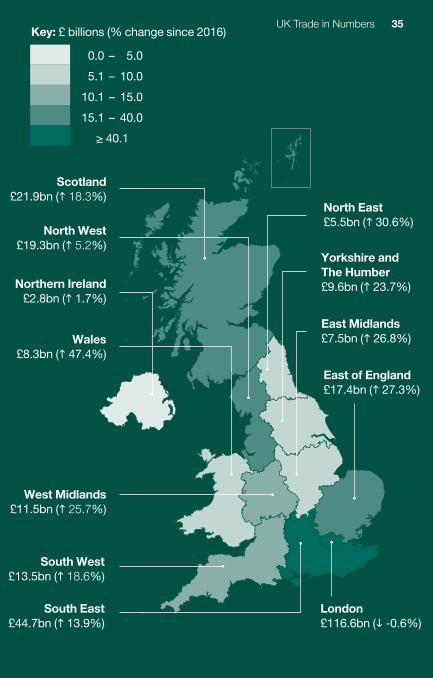
Scotland £21.9bn (h 18.3%)
Northern Ireland £2.8bn (h 1.7%)
North West £19.3bn (h 5.2%)
West Midlands £11.5bn (h 25.7%)
Wales £8.3bn (h 47.4%)
South West £13.5bn (h 18.6%)
North East £5.5bn (h 30.6%)
Yorkshire and The Humber £9.6bn (h 23.7%)
East Midlands £7.5bn (h 26.8%)
East of England £17.4bn (h 27.3%)
London £116.6bn (i -0.6%)
South East £44.7bn (h 13.9%)
Key: £ billions (% change since 2016)
0.0 – 5.0
5.1 – 10.0
10.1 – 15.0
15.1 – 40.0
≥ 40.1
35UK Trade in Numbers

Number of exporters of goods and/or services (2017)
Source: ONS, Annual Business Survey, Great Britain Non-Financial Business Economy: 2017 Exporters and Importers
Notes:
1. Experimental statistics (i.e. not yet fully developed).
2. These estimates do not cover all businesses. They only cover r egistered businesses (for VAT and/or PAYE) in the GB non-financial business economy which accounts for around two-thirds of the economy in terms of gross value added.
3. Other sour ces also estimate the number or proportion of businesses which export (e.g. HMRC Regional Trade Statistics) but they differ in their methodology and coverage so are not directly comparable with the ABS.
There were 235,800 exporters of goods and/or services in Great Britain in 2017. Of these exporters, 219,200 (93%) were in England.
The region with the highest number of exporters was London, which had 60,800 exporters, 26% of the total number of exporters in Great Britain.
The North East was the region with the lowest number of exporters at 4,300, but was also the region that grew the most, with its number of exporters increasing by 72% during 2017. Similarly, Wales had the second lowest number of exporters at 5,900, but saw the second highest levels of increases, with the number of exporters growing by 44% during 2017.
The East and West Midlands were the only regions that had less exporters in 2017 compared to 2016.
36 UK Trade in Numbers
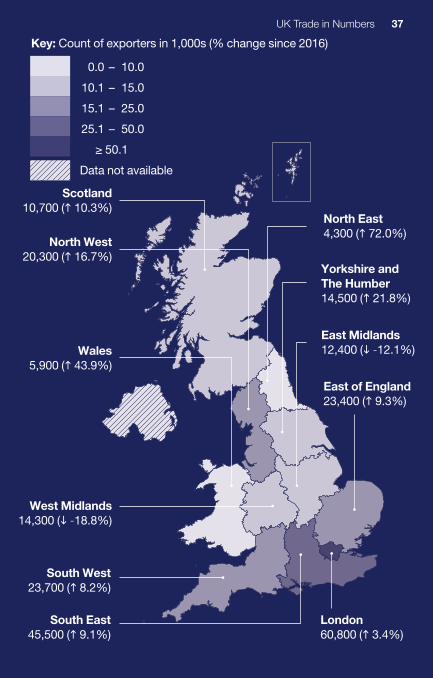
Scotland 10,700 (h 10.3%)
North West 20,300 (h 16.7%)
West Midlands 14,300 (i -18.8%)
Wales 5,900 (h 43.9%)
South West 23,700 (h 8.2%)
North East 4,300 (h 72.0%)
Yorkshire and The Humber 14,500 (h 21.8%)
East Midlands 12,400 (i -12.1%)
East of England 23,400 (h 9.3%)
London 60,800 (h 3.4%)
South East 45,500 (h 9.1%)
Key: Count of exporters in 1,000s (% change since 2016)
0.0 – 10.0
10.1 – 15.0
15.1 – 25.0
25.1 – 50.0
≥ 50.1
Data not available
37UK Trade in Numbers
The UK’s Department for International Trade (DIT) has overall responsibility for promoting UK trade across the world and attracting foreign investment to our economy. We are a specialised government body with responsibility for negotiating international trade policy, supporting business, as well as delivering an outward-looking trade diplomacy strategy.
gov.uk/dit
© Crown Copyright 2019
This publication is licensed under the terms of the Open Government. Licence v3.0 except where otherwise stated. To view this licence, visit nationalarchives.gov.uk/doc/ open-government-licence/version/3
Where we have identified any third party copyright information you will need to obtain permission from the copyright holders concerned.
Any enquiries regarding this publication should be sent to us at [email protected]
Disclaimer
Whereas every effort has been made to ensure that the information in this document is accurate the Department for International Trade does not accept liability for any errors, omissions or misleading statements, and no warranty is given or responsibility accepted as to the standing of any individual, firm, company or other organisation mentioned.
Published 24th September 2019 by Department for International Trade