uk trade in goods statistics by business characteristics 2016 · pdf filenumber of employees...
TRANSCRIPT

1
UK trade in goods statistics by business characteristics
2016
Coverage: United Kingdom
Theme: Business and Energy
Released: 23 November 2017
Media contact: HMRC Press Office 020 7147 2318
Statistical contacts: Chris Cribbett Tel: 03000 593949 [email protected]
Helen Sears Tel: 03000 593746 [email protected]
Customs Trade Statistics HM Revenue & Customs 21 Victoria Avenue Southend‐on‐Sea SS99 1AA
Email: [email protected]
Website: https://www.uktradeinfo.com
HMRC has linked the Overseas Trade Statistics (OTS) trade in goods data with the Office for National Statistics (ONS) business statistics sourced from the Inter-Departmental Business Register (IDBR).
The linked data provides additional information about the types of business carrying out international trade, such as their industry group, age and size.
Summary
In 2016, there were 147,000 businesses in the UK exporting goods, with a total employee count of 9.7 million. There were 227,000 importing businesses in the UK with a total employee count of 12.6 million.
The majority of UK businesses engaged in international trade in goods were at least ten years old (63 per cent of exporters and 57 per cent of importers, excluding those where age is unknown). These businesses contributed 85 per cent of the value of UK exports of goods and 83 per cent of imports
In 2016, the average number of employees per trading business remained approximately the same as in 2015, following a decrease between 2014 and 2015.

2
This page
intentionally
left blank
3
Introduction
HMRC has linked the Overseas Trade Statistics (OTS) trade in goods data with the Office for National Statistics (ONS) business statistics sourced from the Inter-Departmental Business Register (IDBR). Whereas the OTS shows the values and volumes of goods being traded by product and country, this release provides information about the types of businesses that are trading those goods. This report focuses on trade by industry group, age of business and size of business (number of employees). In addition, you can download Microsoft Excel spreadsheets with more detailed information.
This publication is for 2016 data. Revised 2015 and 2014 data is included for comparison in the tables, and revised data from 2013-2015 is included on relevant graphs. All data presented in this release has been compiled on a Special Trade basis, rather than a General Trade basis as in previous years. For further information on the differences between General and Special Trade, please see the Methodology Paper for Overseas Trade Statistics. This change is in line with the compilation of the OTS, which have been published on a Special Trade basis since May 2016. Previous releases of UK trade in goods statistics by business characteristics have not been updated.
Currently these statistics are labelled as experimental. The reasons for this are:
to allow this new publication to incorporate new methodology which is subject to change;
to allow external users to provide feedback on the publication so that enhancements can be made to future releases.
For more information and guidance on the use of experimental statistics, please visit the Guide to Experimental Statistics on the ONS website.
We welcome feedback on the content and presentation of these statistics. If you have any comments, please send them to:

4
Methodology Update
1. All data within the release is now compiled on a Special Trade basis
rather than a General Trade basis. This applies to both 2016 data and
data from previous years which has been included for comparison. This
change is in line with the compilation of the Overseas Trade Statistics
(OTS), which have been published on a Special Trade basis since May
2016.
2. All revisions to OTS data from 2013 onwards have been applied.
3. Some businesses that were previously published within the ‘Zero
employees’ category for business size (see 2013-2015 releases ) were
subsequently identified as foreign-owned businesses that are required
to register for UK VAT due to distance selling regulations. Although
these businesses are recorded on the IDBR as having zero employees,
within this release they have been placed in the ‘Unknown’ category for
business size.
4. The matching process has been revised to ensure the age of a
business is determined by the birth date and death date of the
enterprise rather than that of the underlying VAT-registered business.
This maintains consistency within the data in that each business will
always have the same birth date and death date for all EU and Non-EU
imports and exports. This has resulted in some changes in the
distribution of businesses among the age group categories.
5. Further processing changes have been put in place to ensure a unique
industry group is assigned to each business for all EU and Non-EU
imports and exports.

5
Analysis
What’s in this release?
All data and charts in this release are based on international trade in goods carried out by businesses based in the UK. Trade in services is not included. For the data presented on the ‘Services’ industry, this refers to trade in goods carried out by businesses classified as ‘Services’.
The analysis is presented in four sections:
1. Total trade
Timelines of total trade 2013-2016: Value of UK imports and exports Number of UK importers and exporters
2. Trade by industry group
Timelines of trade for non-Services industries 2013-2016: Value of UK imports and exports Number of UK importers and exporters
Timelines of trade for the Services industry 2013-2016: Value of UK imports and exports Number of UK importers and exporters
Analysis of trade by industry group (for 10 industry groups): Value UK imports and exports Number of UK importers and exporters Number of employees for UK importers and exporters
3. Trade by size of business
Timelines of trade for large businesses 2013-2016: Value of UK imports and exports Number of UK importers and exporters
Timelines of trade for small and medium-sized businesses 2013-2016: Value of UK imports and exports Number of UK importers and exporters
Analysis of trade by business size (for 5 size categories): Value of UK imports and exports Number of UK importers and exporters Number of employees for UK importers and exporters
4. Trade by age of business
Analysis of trade by business age (for 6 age categories): Value UK imports and exports
6
1. Total trade
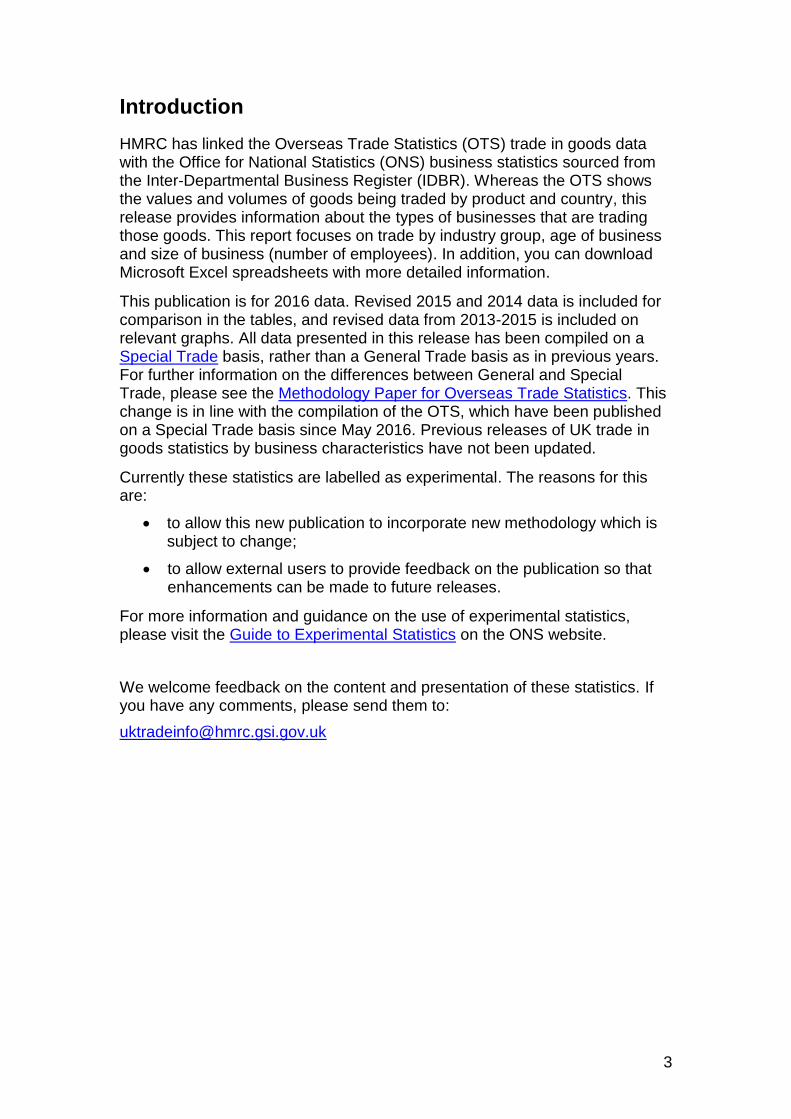
Timelines of total trade 2013-20161
Figure 1.1 - Value of UK exports 2013-2016
Figure 1.2 - Count of UK exporters 2013-2016
1 Values will not match annual OTS values, which are compiled on a General trade basis up to April 2016. Counts
will not match those in the UK VAT Registered Importer and Exporter Population release, which gives a combined count for importers/exporters. See Annex for further information.
The total value of UK exports declined sharply between 2013 and 2014 (down 11 per cent) and then plateaued, before an increase of 1 per cent between 2015 and 2016.
Exports to the EU decreased between 2013 and 2015, but rose by 7 per cent in 2016.
Conversely, exports to non-EU countries declined by 5 per cent between 2015 and 2016.
The total number of exporting businesses in the UK remained fairly consistent between 2013 and 2015, but rose by 4 per cent in 2016.
Businesses exporting to the EU and those exporting to non-EU countries both contributed to this rise.
Source: HMRC OTS and ONS IDBR data
Source: HMRC OTS and ONS IDBR data

7
Figure 1.3 - Value of UK imports 2013-2016
Figure 1.4 - Count of UK importers 2013-2016
The total value of UK imports decreased by 3 per cent between 2013 and 2015 but rose sharply in 2016 (up 15 per cent).
Imports from the EU decreased by 1 per cent between 2013 and 2015, then rose by 8 per cent in 2016.
Imports from non-EU countries decreased by 7 per cent between 2013 and 2015, but rose by 23 per cent in 2016.
The total number of importing businesses in the UK increased steadily year-on-year between 2013 and 2016, with a 4 per cent rise between 2015 and 2016.
The number of businesses importing from the EU increased by 2 per cent between 2015 and 2016, while the number importing from non-EU countries rose by 6 per cent.
Source: HMRC OTS and ONS IDBR data
Source: HMRC OTS and ONS IDBR data

8
2. Total trade
Timelines of trade for non-Services2 industries 2013-2016
Figure 2.1 - Value of UK exports by non-Services industries, 2013-2016
Figure 2.2 – Count of UK exporters within non-Services industries, 2013-2016
2 Non-Services industries include industry groups 1-9 as described in the Annex.
The total value of exports by businesses classified as non-Services decreased year-on-year between 2013 and 2015, then rose in 2016.
Exports to the EU declined by 6 per cent over the 3 year period, while exports to non-EU countries decreased by 2 per cent.
The total number of non-Services businesses exporting goods from the UK decreased year-on-year between 2013 and 2015, then rose in 2016. There was a net increase in exporters of 1 per cent over the 3 year period.
The number of non-Services businesses exporting to the EU increased by 1 per cent over the 3 years, while the number exporting to countries outside the EU decreased marginally.
Source: HMRC OTS and ONS IDBR data
Source: HMRC OTS and ONS IDBR data

9
Figure 2.3 - Value of UK imports by non-Services industries, 2013-2016
Figure 2.4 – Count of UK importers within non-Services industries, 2013-2016
The total value of imports by businesses classified as non-Services decreased year-on-year between 2013 and 2015, then rose in 2016.
Imports from the EU increased by 2 per cent over the 3 year period, while imports from non-EU countries declined by 17 per cent in value.
The total number of non-Services businesses importing goods rose steadily between 2013 and 2016, with a net increase of 8 per cent over the 3 years.
The number of non-Services businesses importing from the EU increased by 8 per cent, while the number importing from non-EU countries rose by just 3 per cent.
Source: HMRC OTS and ONS IDBR data
Source: HMRC OTS and ONS IDBR data

10
Timelines of trade for the Services3 industry 2013-2016
Figure 2.5 - Value of UK exports by the Services industry, 2013-2016
Figure 2.6 – Count of UK exporters within the Services industry, 2013-2016
3 Services industry is industry group 10, as described in Annex. Data includes only businesses within the Services
industry that are trading in goods. See Annex for further information.
The total value of exports by businesses within the Services industry group decreased sharply between 2013 and 2014, then declined at a slower rate over the next 2 years.
Exports to the EU decreased by 3 per cent over the 3 year period 2013-2016, while exports to non-EU countries went down by 34 per cent in value.
The total number of exporting businesses within the Services industry group decreased between 2013 and 2014, then increased over the next 2 years.
The number of Services businesses exporting to the EU increased by 3 per cent over the period 2013-2016, while the number exporting to non-EU countries rose by 2 per cent.
Source: HMRC OTS and ONS IDBR data
Source: HMRC OTS and ONS IDBR data

11
Figure 2.7 - Value of UK imports by the Services industry, 2013-2016
Figure 2.8 – Count of UK importers within the Services industry, 2013-2016
The total value of imports by businesses within the Services industry rose steadily between 2013 and 2015, then increased sharply in 2016, giving a net value increase of 22 per cent over the 3 years.
This large increase was mainly due to growth in imports from non-EU countries (up 33 per cent between 2013 and 2016) while imports from the EU increased by 13 per cent.
The total number of importing businesses within the Services industry group increased steadily year-on-year between 2013 and 2016, with a net increase of 11 per cent over the 3 years.
The number of Services businesses importing from the EU increased by 11 per cent, and the number importing from outside the EU rose by 10 per cent.
Source: HMRC OTS and ONS IDBR data
Source: HMRC OTS and ONS IDBR data

12
Analysis of trade by industry group
Table 2.1: Total value of UK trade by industry group
£ millions
Industry Group
Exports Imports
2014 2015 2016 2014 2015 2016
Group 1 Agriculture and Food 16,982 17,947 18,025 20,219 19,646 20,301
Group 2 Mining, Petroleum products & Waste
27,257 19,943 18,591 36,720 26,360 23,790
Group 3 Chemicals 13,673 13,449 9,686 9,831 9,387 7,132
Group 4 Pharmaceuticals 7,876 9,917 6,790 3,306 3,110 5,152
Group 5 Electronic and Electrical equipment
18,627 18,342 13,476 13,311 13,657 8,273
Group 6 Machinery and equipment n.e.s
17,504 15,997 18,909 9,716 8,358 11,443
Group 7 Motor vehicles & transport equipment1
26,392 26,060 30,797 24,704 25,016 27,581
Group 8 Aerospace and related machinery
16,319 19,670 28,464 7,448 8,504 17,273
Group 9 Other manufacturing 14,768 14,621 14,661 13,500 12,663 12,997
Group 10 Services2 136,537 135,055 133,445 267,304 271,019 322,297
Unknown 10,053 9,632 9,987 9,452 9,003 11,938
Total 305,988 300,634 302,832 415,510 406,723 468,177
Source: HMRC OTS and ONS IDBR data
1. Group 7 excludes aerospace.
2. Industry Group 10 Services includes only trade in goods carried out by businesses in the Services Industry.
Figure 2.9: Percentage change in UK trade value between 2015 and 2016, by industry group
Source: HMRC OTS and ONS IDBR data
13
Between 2015 and 2016, the value of exports increased for half of the industry groups, while the value of imports increased for the majority of industry groups. For most groups, the growth in imports exceeded the growth in exports. Between 2015 and 2016, excluding the Unknown group:
↑ Five groups increased in export value (1. Agriculture and Food, 6. Machinery and equipment, 7. Motor vehicles, 8. Aerospace and 9. Other manufacturing).
↓ Five groups decreased in export value (2. Mining & petroleum, 3. Chemicals, 4. Pharmaceuticals, 5. Electronic and electrical equipment and 10. Services).
↑ Seven groups increased in import value (1. Agriculture, 4. Pharmaceuticals, 6. Machinery & equipment, 7. Motor vehicles, 8. Aerospace, 9. Other manufacturing and 10. Services).
↓ Three groups decreased in import value (2. Mining & petroleum, 3. Chemicals and 5. Electronic and electrical equipment).
↑ Notable rises: Aerospace saw large increases of 45 per cent in exports and a doubling of the value of imports. Imports from the Pharmaceuticals group increased by 66 per cent.
↓ Notable falls: The Pharmaceuticals industry saw a 32 per cent fall in exports. For the Electronic and electrical equipment group there was a 39 per cent decrease in imports.
For the period 2014-2016:
↑ There was sustained increase in export value for the Agriculture and Food group and the Aerospace group.
↑ There was a sustained increase in import value for the Motor vehicles group, Aerospace group and Services group.
↓ There was a sustained decrease in export value for the Mining & petroleum group, the Chemicals group, the Electronic and electrical equipment group and the Services group.
↓ There was a sustained decrease in import value for the Mining & petroleum group and the Chemicals group.
Market Share 2014-2016:
↓ For Mining, petroleum products & waste, the market share of exports decreased from 8.9 per cent to 6.1 per cent between 2014 and 2016, while the market share of imports fell from 8.8 per cent to 5.1 per cent.
↑ For Aerospace and related machinery, the market share of exports increased from 5.3 per cent to 9.4 per cent, while the market share of imports increased from 1.8 per cent to 3.7 per cent.
↓ For Electronic and electrical equipment, the market share of imports decreased from 3.2 per cent to 1.8 per cent.
14
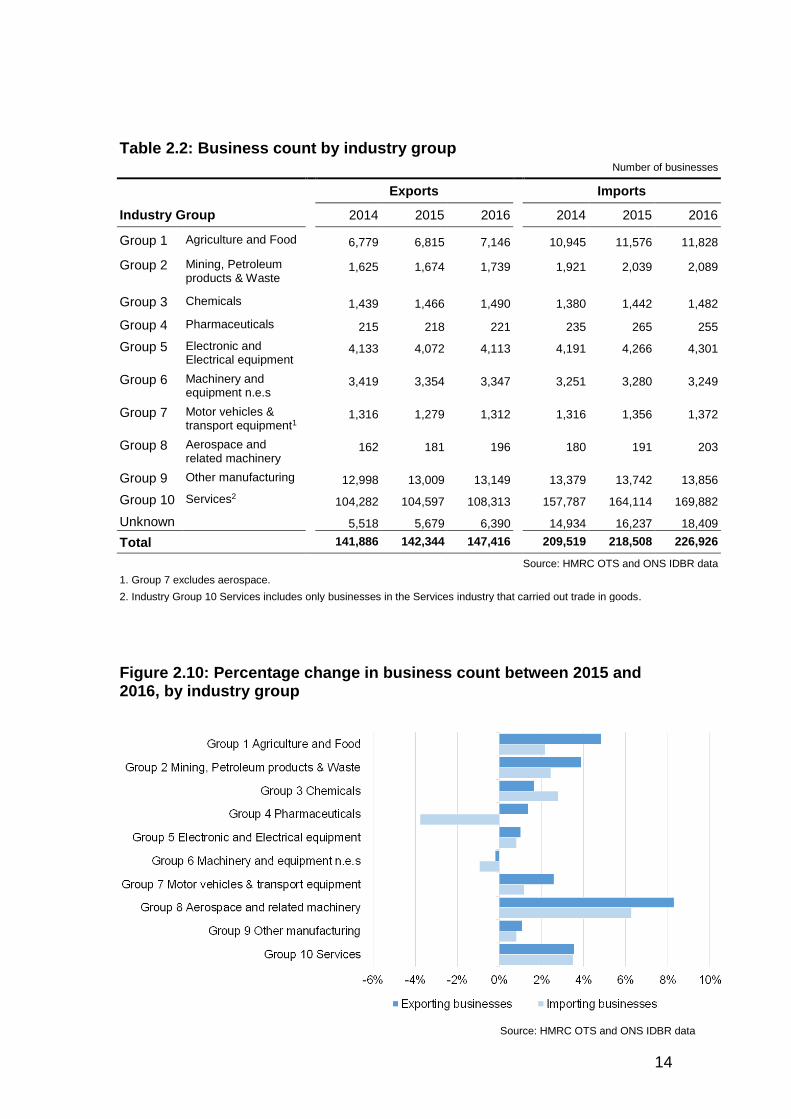
Table 2.2: Business count by industry group Number of businesses
Industry Group
Exports Imports
2014 2015 2016 2014 2015 2016
Group 1 Agriculture and Food 6,779 6,815 7,146 10,945 11,576 11,828
Group 2 Mining, Petroleum products & Waste
1,625 1,674 1,739 1,921 2,039 2,089
Group 3 Chemicals 1,439 1,466 1,490 1,380 1,442 1,482
Group 4 Pharmaceuticals 215 218 221 235 265 255
Group 5 Electronic and Electrical equipment
4,133 4,072 4,113 4,191 4,266 4,301
Group 6 Machinery and equipment n.e.s
3,419 3,354 3,347 3,251 3,280 3,249
Group 7 Motor vehicles & transport equipment1
1,316 1,279 1,312 1,316 1,356 1,372
Group 8 Aerospace and related machinery
162 181 196 180 191 203
Group 9 Other manufacturing 12,998 13,009 13,149 13,379 13,742 13,856
Group 10 Services2 104,282 104,597 108,313 157,787 164,114 169,882
Unknown 5,518 5,679 6,390 14,934 16,237 18,409
Total 141,886 142,344 147,416 209,519 218,508 226,926
Source: HMRC OTS and ONS IDBR data
1. Group 7 excludes aerospace.
2. Industry Group 10 Services includes only businesses in the Services industry that carried out trade in goods.
Figure 2.10: Percentage change in business count between 2015 and 2016, by industry group
Source: HMRC OTS and ONS IDBR data
15
Between 2015 and 2016, the number of exporting businesses increased for 9 of the 10 industry groups. The number of businesses importing goods increased for 8 of the 10 groups over the same period.
Between 2014 and 2016 there was a sustained increase in the number of businesses exporting for 7 of the 10 industry groups. During this period there was a sustained increase in the number of businesses importing for 8 of the industry groups.
In particular:
↑ For the Aerospace industry, the number of exporting businesses rose by 8 per cent, while the number of importing businesses rose by 6 per cent.
↓ The Machinery and equipment group was the only industry group to see a sustained decrease in the number of exporters over the period 2014-2016.
↓ The Pharmaceuticals group saw a 4 per cent decrease in the number of importers between 2015 and 2016, although this followed a 13 per cent increase between 2014 and 2015.

16
Table 2.3: Employee count by industry group Number of employees
Industry Group
Exports Imports
2014 2015 2016 2014 2015 2016
Group 1 Agriculture and Food 475,680 476,910 487,217 545,614 552,335 568,409
Group 2 Mining, Petroleum products & Waste
294,379 295,325 259,803 334,229 335,747 330,721
Group 3 Chemicals 89,888 86,295 81,368 89,625 86,931 81,923
Group 4 Pharmaceuticals 47,648 45,973 29,779 48,202 45,872 30,229
Group 5 Electronic and Electrical equipment
177,984 181,923 175,238 179,477 183,529 175,730
Group 6 Machinery and equipment n.e.s
170,808 164,290 167,596 168,549 163,596 166,005
Group 7 Motor vehicles & transport equipment1
147,065 153,778 148,668 149,132 157,389 153,583
Group 8 Aerospace and related machinery
89,055 87,699 90,848 88,889 87,684 90,696
Group 9 Other manufacturing 477,726 489,593 488,377 493,630 510,271 512,014
Group 10 Services2 7,605,312 7,351,274 7,756,892 9,969,992 10,010,297 10,483,819
Unknown3 . . . . . .
Total4 9,575,545 9,333,060 9,685,786 12,067,339 12,133,651 12,593,129
Source: HMRC OTS and ONS IDBR data Note: 1. Group 7 excludes aerospace.
2. Industry Group 10 Services includes only businesses in the Services industry that carried out trade in goods. 3. Unknown category excludes employees of foreign-owned businesses that are required to register for UK VAT
due to distance selling regulations.
4. Totals exclude the Unknown category.
Figure 2.11: Percentage change in employee count between 2015 and 2016, by industry group
Source: HMRC OTS and ONS IDBR data

17
Between 2015 and 2016, the majority of exporting industries saw a decrease in the number of people they employed. However, at total level, exporting industries saw a net increase in the number of employees. This was heavily impacted by a sizeable increase within the Services industry4.
Between 2015 and 2016 half of importing industry groups saw an increase in the number of people they employed, with a total net increase of 4 per cent in employees over all importing industries. Again, this figure was dominated by the Services industry, which accounted for over 80 per cent of all employees for businesses engaged in international trade.
The most notable changes were:
↑ The largest percentage increase between 2015 and 2016 was in employees within the Services industry (up 6 per cent for exporting businesses and 5 per cent for importing businesses).
↓ The largest percentage decrease between 2015 and 2016 was in employees within the Pharmaceuticals industry (down 35 per cent for exporting businesses and 34 per cent for importing businesses).
↑ For the period 2014-2016, the Agriculture and Food group was the only industry group to see a sustained increase in number of employees over the 2 years (up 2 per cent for exporting industries and 4 per cent for importing industries).
↓ For the period 2014-2016, the Chemicals and Pharmaceuticals groups were the only industry groups to see a sustained decrease in number of employees, across both importing and exporting industries.
4 Industry Group 10 Services includes only the number of people employed by businesses in the Services industry that are trading in goods. See Annex for further information.

18
Summary of trade by industry group 2014-2016:
Trade value, number of businesses and employee count
Between 2014 and 2016 the number of importing and exporting businesses increased for the majority of industry groups. This was coupled with a decrease in the average number of employees per business across most industry groups. The average value of goods imported and exported per business varied widely between industry groups: per business, there were large decreases in average import and export value for Mining, petroleum products & waste, Chemicals and Electronic and electrical equipment, while Aerospace saw very large increases in the average values imported and exported per business.
Between 2014 and 2016:
The number of Pharmaceuticals businesses importing and exporting increased (exporters up 3 per cent and importers up 9 per cent), but these businesses employed considerably fewer people on average. The average export value per business decreased (down 16 per cent), but the average import value per business increased sharply (up 44 per cent).
The number of Aerospace businesses importing and exporting increased (exporters up 21 per cent and importers up 13 per cent), but these businesses employed fewer people on average. The average export value per business and average import value per business both went up considerably (up 44 per cent for exports and 106 per cent for imports).
The number of Chemicals businesses importing and exporting increased (exporters up 4 per cent and importers up 7 per cent), but the average number of employees per business went down for both importers and exporters. The average export value and average import value per business both rose by 32 per cent.
The number of importing and exporting businesses within Mining, petroleum products & waste increased (exporters up 7 per cent and importers up 9 per cent), but they employed fewer people on average. The average value of goods imported and exported per business also decreased considerably (exports down 36 per cent and imports down 40 per cent).

19
3. Trade by size of business
Timelines of trade for large businesses5 2013-2016
Figure 3.1 – Value of UK exports by large businesses 2013-2016
Figure 3.2 – Count of UK exporters – large businesses 2013-2016
5 Large businesses are defined as those with 250 or more employees.
The total value of exports by large businesses decreased steadily year-on-year between 2013 and 2016.
Exports to the EU declined by 10 per cent over the 3 year period, while exports to non-EU countries decreased by 24 per cent.
The total number of large businesses exporting goods from the UK increased year-on-year between 2014 and 2016, following a decrease between 2013 and 2014.
The number of large businesses exporting to the EU increased by 7 per cent over the 3 year period, while the number exporting to non-EU countries rose by only 2 per cent.
Source: HMRC OTS and ONS IDBR data
Source: HMRC OTS and ONS IDBR data
20
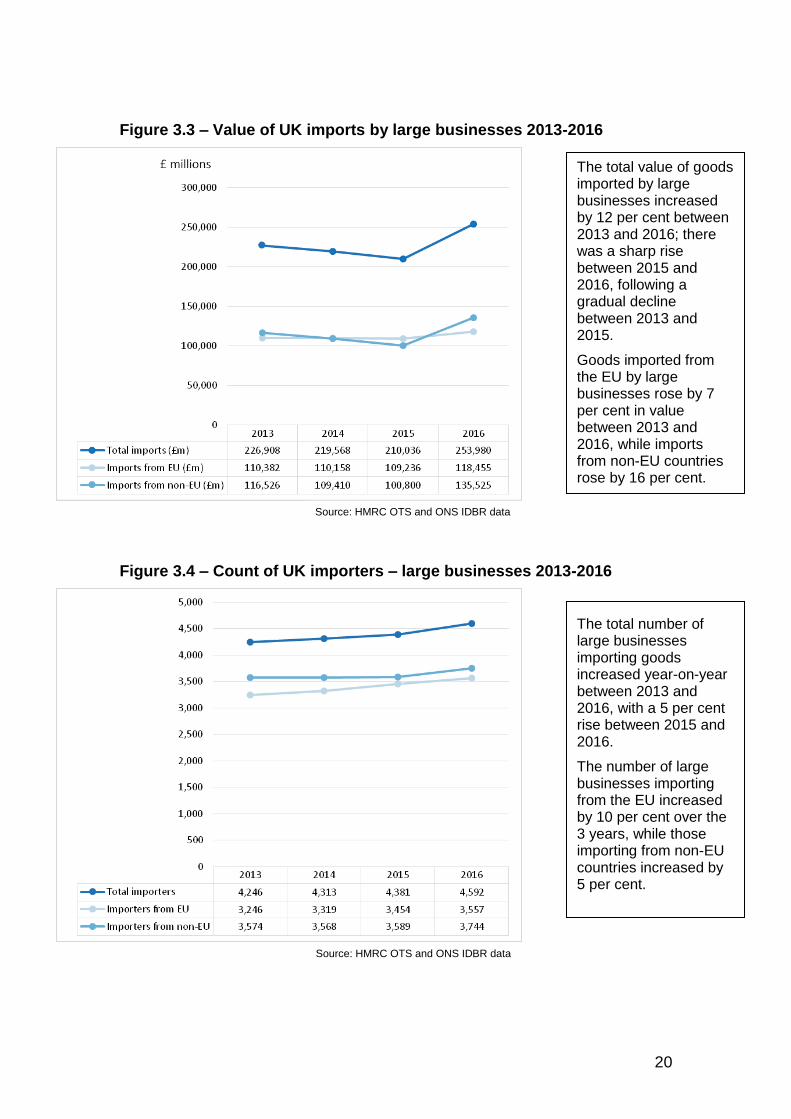
Figure 3.3 – Value of UK imports by large businesses 2013-2016
Figure 3.4 – Count of UK importers – large businesses 2013-2016
The total value of goods imported by large businesses increased by 12 per cent between 2013 and 2016; there was a sharp rise between 2015 and 2016, following a gradual decline between 2013 and 2015.
Goods imported from the EU by large businesses rose by 7 per cent in value between 2013 and 2016, while imports from non-EU countries rose by 16 per cent.
The total number of large businesses importing goods increased year-on-year between 2013 and 2016, with a 5 per cent rise between 2015 and 2016.
The number of large businesses importing from the EU increased by 10 per cent over the 3 years, while those importing from non-EU countries increased by 5 per cent.
Source: HMRC OTS and ONS IDBR data
Source: HMRC OTS and ONS IDBR data

21
Timelines of trade for SMEs6 2013-2016
Figure 3.5 – Value of UK exports by SMEs 2013-2016
Figure 3.6 – Count of UK exporters – SMEs 2013-2016
6 SMEs (Small and medium sized enterprises) are defined as businesses with less than 250 employees.
The total value of goods exported by small and medium-sized businesses (SMEs) decreased between 2013 and 2015, but rose by 10 per cent between 2015 and 2016.
Exports to the EU by SMEs increased in value by 9 per cent over the 3 years, but SME exports to non-EU countries fell by 4 per cent.
The total number of SMEs exporting goods increased by 2 per cent between 2013 and 2015, with a 3 per cent rise in 2016.
The number of SMEs exporting to the EU increased by 2 per cent over the 3 year period, with the number exporting to non-EU countries up 1 per cent.
Source: HMRC OTS and ONS IDBR data
Source: HMRC OTS and ONS IDBR data
22
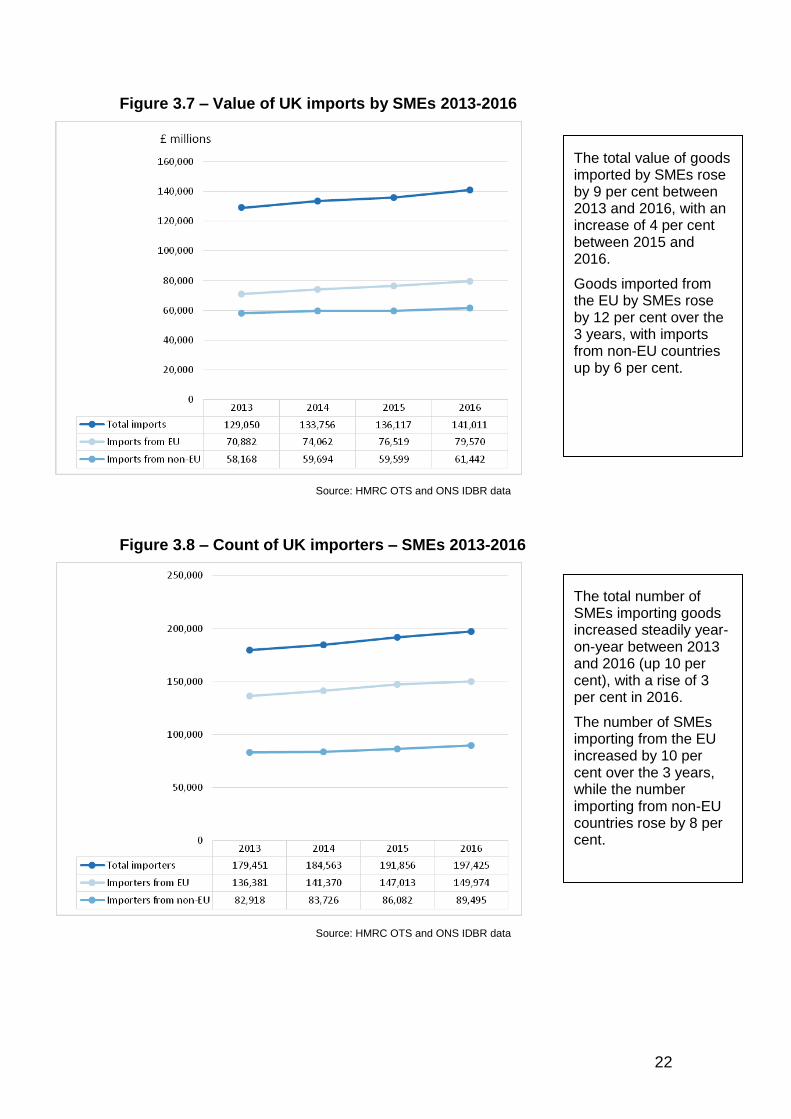
Figure 3.7 – Value of UK imports by SMEs 2013-2016
Figure 3.8 – Count of UK importers – SMEs 2013-2016
The total value of goods imported by SMEs rose by 9 per cent between 2013 and 2016, with an increase of 4 per cent between 2015 and 2016.
Goods imported from the EU by SMEs rose by 12 per cent over the 3 years, with imports from non-EU countries up by 6 per cent.
The total number of SMEs importing goods increased steadily year-on-year between 2013 and 2016 (up 10 per cent), with a rise of 3 per cent in 2016.
The number of SMEs importing from the EU increased by 10 per cent over the 3 years, while the number importing from non-EU countries rose by 8 per cent.
Source: HMRC OTS and ONS IDBR data
Source: HMRC OTS and ONS IDBR data

23
Analysis of trade by business size
Table 3.1: Total value of UK trade by business size £ millions
Business size (no. of employees)
Exports Imports
2014 2015 2016 2014 2015 2016
0 308 242 248 370 376 375
1 to 9 15,740 15,722 18,518 25,340 25,334 25,517
10 to 49 24,842 23,936 25,739 46,820 47,561 48,290
50 to 249 41,349 41,193 44,453 61,227 62,846 66,829
250 + 175,784 175,043 169,038 219,568 210,036 253,980
Unknown1 44,499 44,499 44,835 62,186 60,570 73,185
Total 305,988 300,634 302,832 415,510 406,723 468,177
Source: HMRC OTS and ONS IDBR data
Note: 1. Unknown category includes trade by foreign-owned businesses required to register for UK VAT due to distance selling regulations.
Figure 3.9: Percentage change in UK trade value between 2015 and 2016, by business size
Source: HMRC OTS and ONS IDBR data

24
Between 2015 and 2016 there were increases in export and import value for the majority of business size categories. This was in contrast to the period 2014-2015, which saw decreases for most size categories.
The most notable changes were:
↑ Between 2015 and 2016, for businesses classified as SMEs (covering the categories 0, 1-9, 10-49 and 50-249) the value of exports increased more than imports in all size categories.
↓ The Zero employee size category was the only one for which the value of imports decreased between 2015 and 2016, although this decrease was marginal.
↓ The only reduction in export value between 2015 and 2016 was in the 250+ employees category (down 3 per cent). This category experienced a sustained decrease in export value over the period 2014-2016.
↑ The largest increase in exports between 2015 and 2016 was within the 1-9 employees category (up 18 per cent).
↑ By far the largest increase in import value between 2015 and 2016 was in the 250+ employees category (up 21 per cent).
↑ The only categories that saw a sustained increase in import value over the period 2014-2016 were 10-49 and 50-249.

25
Table 3.2: Business count by business size Number of businesses
Business size (no. of employees)
Exports Imports
2014 2015 2016 2014 2015 2016
0 7,955 7,559 7,511 12,059 12,061 11,600
1 to 9 77,884 78,634 81,449 114,725 120,566 124,606
10 to 49 33,812 33,422 34,377 44,700 45,568 47,188
50 to 249 10,333 10,627 10,903 13,079 13,661 14,031
250 + 3,403 3,422 3,591 4,313 4,381 4,592
Unknown1 8,499 8,680 9,585 20,643 22,271 24,909
Total 141,886 142,344 147,416 209,519 218,508 226,926
Source: HMRC OTS and ONS IDBR data
Note: 1. Unknown category includes foreign-owned businesses required to register for UK VAT due to distance selling regulations.
Figure 3.10: Percentage change in business count between 2015 and 2016, by business size
Source: HMRC OTS and ONS IDBR data

26
Apart from the Zero employees category and the Unknown category, all business size groups saw an increase in the numbers of both exporting and importing businesses between 2015 and 2016. For most size categories, there was a sustained increase in the number of businesses trading internationally over the period 2014-2016.
The most notable changes were:
↓ The largest percentage decrease in number of businesses importing between 2015 and 2016 was in the Zero employees category.
↑ The largest percentage increase in number of businesses between 2015 and 2016 was in the 250+ employees category (up 5 per cent for both importing and exporting businesses).
↓ The only sustained decrease in number of businesses between 2014 and 2016 was in exporters within the Zero employees category.

27
Table 3.3: Employee count by business size Number of employees
Business size (no. of employees)
Exports Imports
2014 2015 2016 2014 2015 2016
0 0 0 0 0 0 0
1 to 9 260,735 258,998 267,510 386,008 397,056 410,765
10 to 49 726,531 720,834 744,516 950,785 968,951 1,007,777
50 to 249 1,068,080 1,099,928 1,124,830 1,343,637 1,401,656 1,436,319
250 + 7,520,199 7,253,300 7,548,930 9,386,909 9,365,988 9,738,268
Unknown1 . . . . . .
Total2 9,575,545 9,333,060 9,685,786 12,067,339 12,133,651 12,593,129
Source: HMRC OTS and ONS IDBR data
Note: 1. Unknown category excludes employees of foreign-owned businesses that are required to register for UK VAT due to distance selling regulations
2. Totals exclude the Unknown category.
Figure 3.11: Percentage change in employee count between 2015 and 2016, by business size
Source: HMRC OTS and ONS IDBR data

28
Between 2015 and 2016, there was an increase in the number of people employed by importing and exporting businesses for all business size groups. This followed a decrease in employee count between 2014 and 2015 for exporting businesses, with the exception of the 50-249 size category.
The most notable changes were:
↑ For importing businesses, the largest percentage increase in number of employees between 2015 and 2016 was in the 10-49 employees category (up 4 per cent).
↑ For exporting businesses, the biggest percentage increase in number of employees between 2015 and 2016 was in the 250+ employees category (up 4 per cent).
↑ Between 2014 and 2016 there was a sustained increase in number of employees for exporters within the 50-249 category.
↑ Between 2014 and 2016 there was a sustained increase in number of employees for importers within all business size groups apart from the 250+ category, where there was a small decrease in 2015.

29
4. Trade by age of business
Analysis of trade by business age
Table 4.1: Total value of UK trade by business age £ millions
Age Group
(years)
Exports Imports
2014 2015 2016 2014 2015 2016
0 to 1 2,331 2,101 3,727 4,908 6,318 8,567
2 to 3 7,487 4,465 4,110 10,263 8,646 9,929
4 to 5 6,872 9,794 7,485 10,178 16,628 17,631
6 to 9 12,973 13,134 15,136 22,657 20,129 22,777
10 to 20 40,700 35,390 37,526 56,564 55,532 56,984
20+ 214,244 218,096 219,021 293,375 284,094 333,141
Unknown 21,380 17,654 15,826 17,565 15,375 19,147
Total 305,988 300,634 302,832 415,510 406,723 468,177
Source: HMRC OTS and ONS IDBR data
Figure 4.1: Percentage change in UK trade value between 2015 and 2016, by business age
Source: HMRC OTS and ONS IDBR data

30
Table 4.1 shows the value of trade by age of business. Interpretation of movements in age group categories should be treated with caution, since individual businesses naturally progress through the groups.
The most notable changes were:
↑ Between 2015 and 2016, there was a large increase in value of exports for businesses under 1 year old (up 77 per cent).
↑ Business under 1 year old also saw the largest percentage increase in imports (up 36 per cent) between 2015 and 2016.
↓ The biggest percentage decrease in export value between 2015 and 2016 was for businesses aged 4-5 years (down 24 per cent), although this followed a large rise of 43 per cent between 2014 and 2015.
↑ Businesses within the 6-9 and 20+ age categories experienced a sustained increase in the value of exports between 2014 and 2016.
↑ In contrast, businesses aged 2-3 years saw a sustained decrease in the value of exports between 2014 and 2016.
↓ There were sustained increases in import value for businesses aged 0-1 and 4-5 between 2014 and 2016.

31
Access to data
The detailed tables for 2016 data are available on the gov.uk website in Microsoft Excel spreadsheet format. Previously published data for 2013-2105 is also available on the same webpage, although this data was compiled on a General Trade as opposed to a Special Trade basis. For more details on the difference between General and Special trade, see the Methodology Paper for Overseas Trade Statistics.
These files contain individual tables for Industry Group, Age, and Business Size and also 2 dimensional tables which show:
Industry Group by Age;
Industry Group by Business Size;
Business Size by Age.
A breakdown of industry, age or business size by country for 2016 is available for selected partner countries. These countries are Algeria, Australia, Bangladesh, Belgium, Brazil, Canada, China, Czech Republic, Denmark, France, Germany, Hong Kong, India, Irish Republic, Israel, Italy, Japan, Malaysia, Mexico, Netherlands, Nigeria, Norway, Poland, Qatar, Russia, Saudi Arabia, Singapore, South Africa, South Korea, Spain, Sri Lanka, Sweden, Switzerland, Taiwan, Thailand, Turkey, UAE, USA, Vietnam, EU (all EU partner countries combined), NEU (all Non EU partner countries combined), World (all partner countries combined).

32
Annex: Metadata FAQ
What is the purpose of these experimental statistics?
To produce trade statistics based on 10 predefined industry groups to show the total value of UK trade imported and exported, broken down by age and size of UK businesses.
Why is this release “Experimental Statistics”?
Experimental statistics allow a new publication to incorporate new methodology which is subject to change. It also allows external users to provide feedback on the publication and enhancements can be made to future releases.
What data has been used to produce this release?
This release combines data from the Overseas Trade Statistics (OTS) published by HM Revenue & Customs (HMRC) with the Inter-Departmental Business Register (IDBR) published by the Office for National Statistics (ONS). The OTS is a detailed dataset covering the UK’s trade in goods with other nations by partner country and product. More information can be found in the methodology paper for the Overseas Trade Statistics. Since 1994 the IDBR has been the comprehensive list of UK businesses that is used by government for statistical purposes. More information about the Inter-Departmental Business Register can be found on the ONS website.
What is the definition of a “business”?
For the purpose of this release the term “business” is used to represent an enterprise. An enterprise can be defined as the smallest combination of legal units (generally based on VAT and/or PAYE records) that is an organisational unit producing goods or services, which benefits from a certain degree of autonomy in decision-making, especially for the allocation of its current resources. An enterprise carries out one or more activities at one or more locations. An enterprise may be a sole legal unit.
Business characteristics such as employee count, age group and industry group are recorded at enterprise level on the IDBR. The business counts published here are therefore counts of enterprises, and the value of trade is derived from trade declared to HMRC by the underlying VAT-registered or EORI-registered7 businesses.
7 EORI is an acronym for Economic Operator Registration and Identification. In the UK, an EORI number is assigned to importers and exporters by HMRC for the purposes of trading with countries outside the EU.

33
How has the data matching been done?
Data is matched by linking the VAT number of each business on the trade statistics data with its corresponding reference on the IDBR data. If a match was not found, then a ‘fuzzy matching’ on the name was attempted. Any remaining unmatched VAT numbers were allocated to an industry group obtained from departmental VAT records where possible.
There are number of reasons why a business may be classified within the
‘Unknown’ category for industry group, number of employees, business size
or age group:
1. Businesses where the trading VAT/EORI number is invalid are
classified as Unknown for industry group, number of employees,
business size and age group.
2. Overseas-based businesses with a VAT presence in the UK are
classified as Unknown for industry group, number of employees,
business size and age group.
3. Businesses for which IDBR data on industry group, number of
employees, business size or age group are unavailable are placed in
the Unknown category for the respective group(s).
4. EU trade in oil and gas that cannot be attributed to a VAT number is
placed in the Unknown category for employee count, business size and
age group, while industry group is estimated from HMRC records on
businesses trading similar goods.
5. Trade carried out by businesses in the Channel Islands and Isle of Man
is placed in the Unknown category for industry group, number of
employees, business size and age group.
6. Parcel post trade that is dealt with centrally (trade with Non-EU only) is
placed in the Unknown category for industry group, number of
employees, business size and age group.
7. Although trade carried out by UK Government is placed in the
Unknown category for employee count, it is categorised under the
‘250+’ group for business size.
For more detailed information or to comment on this methodology, contact the uktradeinfo helpdesk (email: [email protected]).
Which variables are being published?
Age of business (0-1, 2-3, 4-5, 6-9, 10-20, 20+, unknown) Business size (no. of employees) (0, 1-9, 10-49, 50-249, 250+, unknown) Industry group (1, 2, 3, 4, 5, 6, 7, 8, 9, 10, unknown) Statistical value of trade in goods Employee count Business count

34
What are the industry groupings?
The industry group refers to the classification of the main activity of the
business. A business may trade predominantly in commodities relating to its
main activity, but may also trade in commodities outside of this group. For
example, the 'Pharmaceuticals' group (group 4) contains all importing or
exporting businesses classified as belonging to the 'Pharmaceuticals' sector.
However, the 'trade in goods' value for this group contains all trade in goods
carried out by these businesses - this may predominantly be trade in
pharmaceutical goods, but could include trade in any type of commodity.
The Standard Industrial Classification 2007 (SIC) groupings within each Industry group are:
Group Description SIC 2007 Group 1 Agriculture and Food A, 10 – 17
Group 2 Mining, Petroleum products and Waste B, 19, 24, D, E
Group 3 Chemicals 20
Group 4 Pharmaceuticals 21
Group 5 Electronic and Electrical equipment 26, 27
Group 6 Machinery and equipment n.e.s 28
Group 7 Motor vehicles, transport equipment (excluding aerospace) 29, 30 (excluding 30.3)
Group 8 Aerospace and related machinery 30.3
Group 9 Other manufacturing 18, 22, 23, 25, 31, 32
Group 10 Services 33, F – U
For further details on SIC 2007 visit the ONS website.
What partner countries or geographical areas are available?
Only a selection of partner countries are available, which are: Algeria, Australia, Bangladesh, Belgium, Brazil, Canada, China, Czech Republic, Denmark, France, Germany, Hong Kong, India, Irish Republic, Israel, Italy, Japan, Malaysia, Mexico, Netherlands, Nigeria, Norway, Poland, Qatar, Russia, Saudi Arabia, Singapore, South Africa, South Korea, Spain, Sri Lanka, Sweden, Switzerland, Taiwan, Thailand, Turkey, UAE, USA, Vietnam, EU (all EU countries combined), NEU (all Non EU countries combined), World (all countries combined). These are the top EU and non-EU partner countries for the UK in terms of trade value.
This data is available in Microsoft Excel spreadsheet format for expert users.
How were the employee count and business count fields calculated?
The business count is the total number of businesses who imported or exported, with the specified characteristics. The employee count is the total number of employees for those businesses. It does not mean that all these employees are directly involved in the activity of international trade.

35
Does this data include trade in services?
This publication does not include any data on services traded by businesses. However, a breakdown is provided of industry type, which includes group 10: Services. The figures within this group include only the value of goods traded by those businesses who are classified as a Services industry, the number of businesses in the Services industry who are trading in goods and the employee counts for these businesses. The figures do not contain any data on the services these businesses provide or the values related to this.
How have suppressions been applied to these experimental statistics?
While the OTS is subject to passive disclosure control, due to linking with the IDBR these experimental statistics are subject to active disclosure control. Disclosure control procedures applied are in line with those recommended by GSS guidance on disclosure control.
Where the data has been suppressed, additional suppressions (masks) have been used making it impossible to calculate the contents of suppressed cells. All suppressed cells are shown with an “S”.
Why do the trade totals not match the published OTS or the ‘UK VAT Registered Importer and Exporter Population’ release?
The trade totals will not match the published OTS for two reasons, both related to EU trade. Firstly, the OTS totals for EU trade include an estimate for non-response which is not included in this publication. Secondly, the contribution of traders below the Intrastat threshold for EU trade has had to be recalculated on a per trader basis, and has not been allocated to individual EU countries. Although this closely replicates the methodology for the estimation of below threshold trade in the OTS, timing and other issues means there is not an exact match.
Annual tables published as part of the OTS release are currently calculated on a General Trade basis up to April 2016 and annual values are therefore not comparable with those in this release, which are calculated on a Special Trade basis.
The counts given in the UK VAT Registered Importer and Exporter Population release relate to the total number of UK businesses engaged in trade in goods (importers and exporters combined) and are therefore not comparable with data in this release, where importers and exporters are treated separately.
Why is this data different to that presented in the HMRC Regional Trade Statistics (RTS) releases?
Due to methodological differences, the data presented in this release will not match published RTS data. The main reasons for this are:

36
The business counts in this release are calculated on a per enterprise basis, while RTS business counts are calculated at the level of the VAT-registered business.
Different methods are used for estimating trade below the Intrastat reporting threshold, to enable trade values to be allocated per business in this release.
This release includes all UK trade in goods, while RTS data excludes trade in non-monetary gold.
Are there any similar statistics available on the characteristics of UK exporters and importers?
The ONS produce the Annual Business Survey publication 'Great Britain non-financial business economy exporters and importers’ (latest release published 09 November 2017). This includes details of the number and proportion of non-financial GB enterprises (excluding Northern Ireland) engaged in international trade in goods and services, categorised by employment size group, broad industry group, ownership (UK/foreign owned), turnover and age of business. A regional breakdown is also supplied. The aim of 'Great Britain non-financial business economy exporters and importers’ is to supply comprehensive information on business trading behaviour for both goods and services to provide answers to questions such as:
What share of businesses export goods and/ or services?
What share of businesses import goods and/ or services?
Are importing businesses also those that export, or do some businesses only import or export?
The aim of the HMRC UK Trade Statistics by Business Characteristics is to add value to the UK trade in goods data by looking at the characteristics of businesses trading. This may provide answers to questions such as:
How many people are employed by businesses engaged in international trade in goods?
What share of exports/imports is carried out by particular industry groups?
How many new businesses involved in international trade in goods are trading with specific partner countries?
Due to methodological differences between the ABS statistics and the HMRC statistics published in this release, the trade in goods data within each dataset are not directly comparable and may differ. Methodological differences between the two releases include differences in: data sources and coverage, measurement of employee count, disclosure control procedures and the handling of revisions.