uk remuneration review 2015 - proxy insight report 2015.pdf · uk remuneration review 2015 2...
TRANSCRIPT

UK Remuneration Review 2015
In associat ion with

2
ContentsUK Remuneration Review 2015
2 Preface
4 Unclear messages
7 What the shareholders say
10 The policies
Preface
Since the so called shareholder spring
of 2012, executive pay has rarely been
out of the headlines. Companies must
now walk the tightrope of attracting
and retaining their top executives in an
increasingly global market place while
avoiding allegations of fat cats.
UK Companies have had to report on
their Directors’ Remuneration since
2002 allowing shareholders a say, albeiit
on an advisory basis. However In 2013
the UK government went much further
and introduced new rules regarding the
reporting of executive remuneration:
The Remuneration Report
The Remuneration Report will continue
to include information on an annual
basis explaining how much directors
have been paid in the reporting year, and
how the pay policy will be implemented
in the current financial year.
Now companies must also disclose the
amount each director has been paid and
to express this as a single figure taking
account of all aspects of remuneration.
The company must also explain on
what basis the level of variable pay
has been set therefore linking actual
performance to remuneration.
As before voting on the remuneration
report is on an advisory basis only.
The Remuneration Policy
The Remuneration Policy is a new
requirement detailing how each
element of a directors’ remuneration
package “supports the short and
long term strategy of the company, its
potential value, and any performance
measures relating to it”. It must also set
out a policy for paying newly recruited
directors and a policy for loss of office
payments.
The Policy must be submitted to a
binding shareholder vote at least every
3 years.
2014 saw the vast majority of the
FTSE350 put their Remuneration
Report and Remuneration Policy to a
shareholder vote. For the first time it is
possible to see how shareholders voted
on remuneration on a binding basis and
also their views on the future direction
of executive pay.
This report looks at:
- Voting across the FTSE350 enabling
individual companies to compare their
voting results with their peers.
- Which investors most commonly
voted against Remuneration Reports
and Policies and why.
- A look ahead to 2015 with
Remuneration policy changes from key
asset managers.
13 Appendix Part 1
FTSE 100 Companies
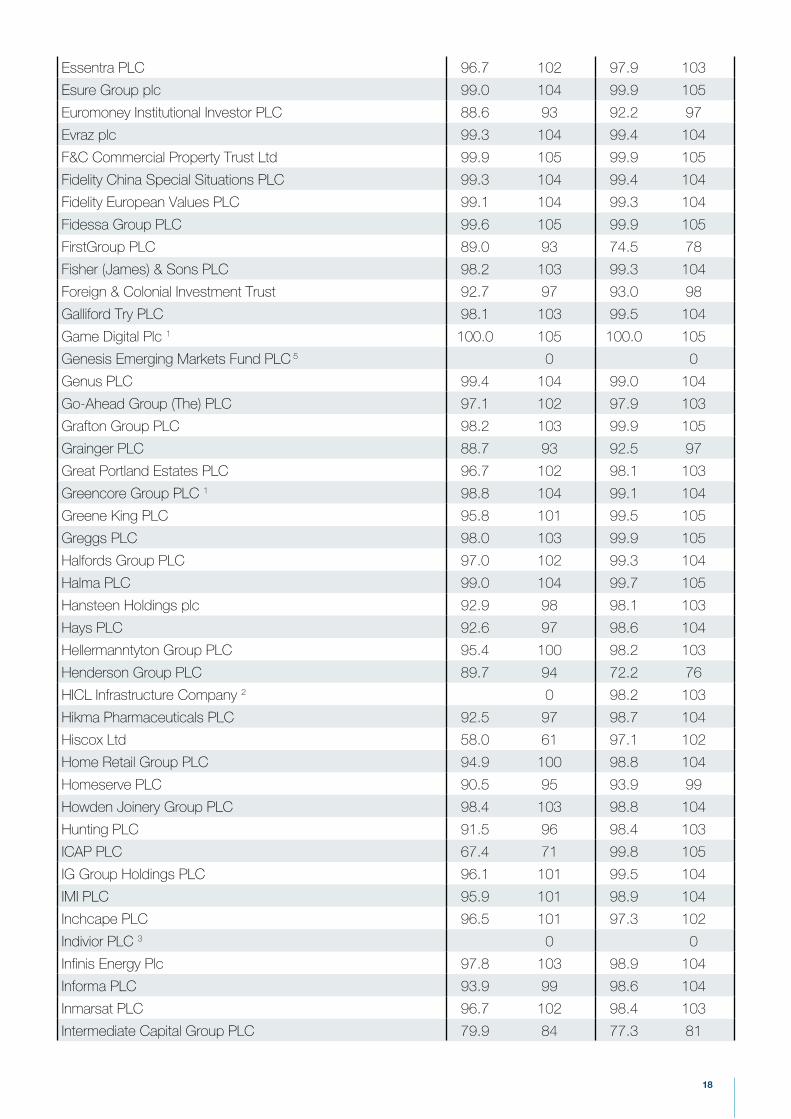
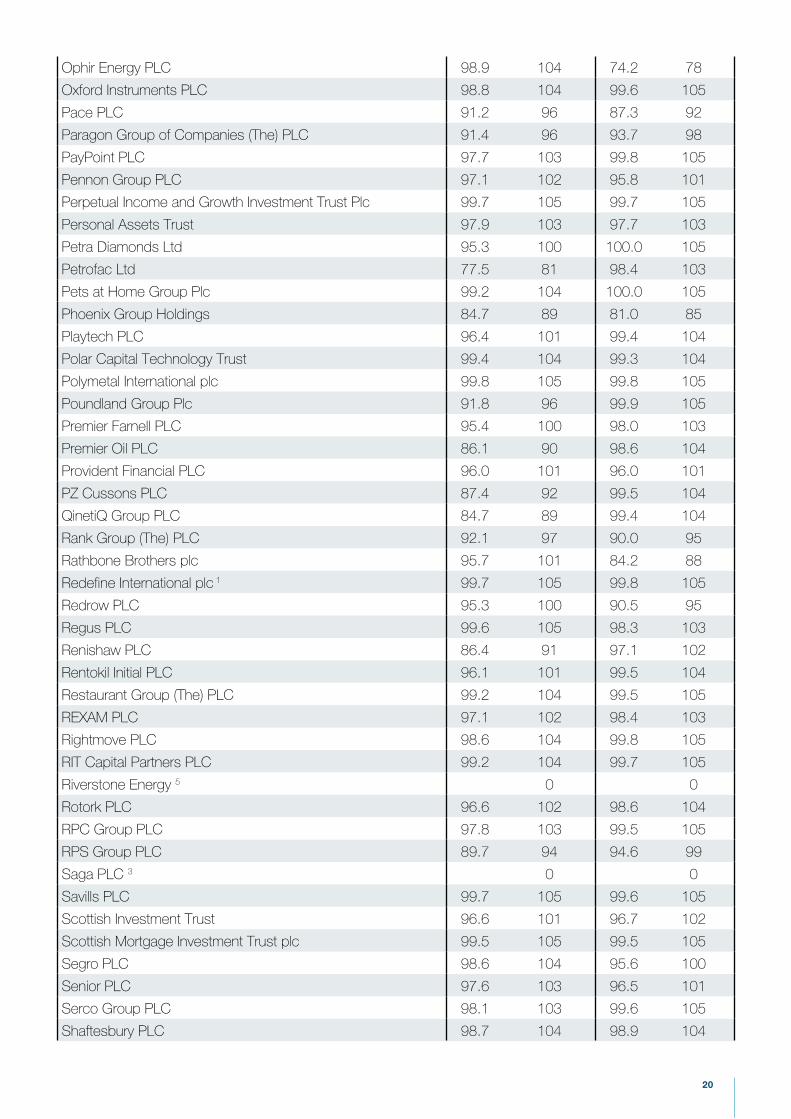
16 Appendix Part 2
FTSE 250 Companies

www.proxyinsight.com
Don’t leave it to
chance
Proxy Insight has all the intelligence you need for a successful shareholder vote. Understanding who votes, how and why puts you in control—so don’t leave it to chance.

A lot has been written about the conflicting messages
investors sent to issuers in 2014 through their voting
patterns on executive pay. Indeed, Ecclesiastical’s
Neville White told Proxy Insight earlier this year that the different
outcomes for binding Remuneration Policy and advisory
Remuneration Reports were at times “schizophrenic”.
Overall, however, the average rate of support across the FTSE100
was very close with 93.7% for Policy and 92.8% for Reports.
Across the FTSE250, the results were exactly the same at 95.2%.
Analysis on the next two pages reviews the companies in
the FTSE100 and FTSE250 with the lowest support for both
resolution types.
Unclear messagesWhy rates of support for Remuneration Reports and Policies have become detatched, and how issuers can understand what shareholders want.
4

FTSE100
While Burberry was the only FTSE100
company to lose a remuneration vote,
a number failed to garner reasonable
support on either or both categories.
The companies with the lowest support
in each category are listed below while
the full list may be found in the appendix
to this report. Interestingly, while 85
companies secured support for their
Remuneration Policy of 90% or more,
only 78 managed to reach this level in
votes on their Remuneration Report.
While Carnival and – to an extent,
Burberry, HSBC, Reckitt Benkiser
and Astra Zeneca fared poorly in both
votes – others had issues in just one
of the categories. Despite receiving a
very low level of support for their Policy,
Standard Chartered’s Report actually
received a higher than average level of
support. Likewise, Pearson’s Policy had
a highly respectable level of support but
performed poorly for the Report vote.
These results matter, and are likely to
prove confusing for issuers. Support
for Policies may indicate a company is
heading in the right direction but this is
unlikely to make life easier for investor
relations teams trying to get their
Reports approved.
Having approved the principles for
executive pay, shareholders may still
object to the actual compensation
planned once details are announced in
proxy filings each year. Industries where
returns can be highly volatile, such as
banks, may be particularly affected.
5
The divergent outcomes for Remuneration Report and Remuneration
Policy votes have been described as schizophrenic”
“Remuneration Policy Remuneration Report
Rank Company % For Vs Avg % For Vs avg
1 Standard Chartered PLC 59.2 63 94.6 102
2 Carnival PLC 61.9 66 58.6 63
3 WM Morison Supermarkets PLC 73.5 78 89.1 96
4 HSBC Holdings PLC 79.4 85 84.0 90
5 Reckitt Benckiser Group PLC 80.2 86 68.5 74
FTSE 100-Lowest support for remuneration policy
FTSE 100-Lowest support for remuneration report
Remuneration Report Remuneration Policy
Rank Company % For Vs Avg % For Vs avg
1 Burberry Group PLC 47.3 51 83.9 90
2 Carnival PLC 58.6 63 61.9 66
3 AstraZeneca PLC 61.5 66 85.0 91
4 Pearson PLC 65.8 71 95.8 102
5 BG Group PLC 67.2 72 93.7 100
Source: Proxy Insight
Source: Proxy Insight

Remuneration Policy Remuneration Report
Rank Company % For Vs Avg % For Vs avg
1 Investec PLC 56.0 59 90.0 95
2 Hiscox PLC 58.0 61 97.1 102
3 ICAP PLC 67.4 71 99.8 105
4 Cranswick PLC 72.8 76 100.0 105
5 Smith (DS) PLC 77.1 81 81.9 86
Remuneration Report Remuneration Policy
Rank Company % For Vs Avg % For Vs avg
1 Crest Nicholson Holdings PLC 61.6 65 94.6 99
2 International Pearson Finance PLC 63.3 67 97.1 102
3 National Express Group PLC 64.0 67 88.5 93
4 Tullett Prebon PLC 64.5 68 88.1 93
5 SVG Capital PLC 65.0 68 99.0 104
FTSE250
As many as 14% of FTSE250 companies
failed to win 90% support for Policy in
2014, while 15% failed to reach the
same level for Report.
Yet only DS Smith fared badly on
both votes; Investec, Hiscox, ICAP
and Cranswick had poor results for
their Policies but high support for
their Reports, while conversely Crest
Nicholson, and International Personal
Finance had good support for their
Reports but fared badly on their
Policies. Again, the worst performers
are highlighted in a table at the end of
this report.
Abstentions / Withheld Votes
One of the less well-reported facts is
that companies understandably only
base their results on votes cast for or
against a proposal, effectively ignoring
shareholders who choose perhaps to
send a softer message by casting an
Abstain or Withhold vote.
In some cases, this could make a
significant difference to the vote. For
example, BP’s Report received just over
1,518 million votes (16.1%) “against”, but
2,218 million votes were withheld.
FTSE 250-Lowest support for remuneration policy
FTSE 250-Lowest support for remuneration report
6
Source: Proxy Insight
Source: Proxy Insight

A COMPUTERSHARE COMPANY
Would you make the right moves?
When protecting against activism, your preparation is crucial:
• Profilingtheactivist
• Assessingthevotingriskoftheinstitutionsandproxyadvisors’influence
• Weighinguptheinfluenceoftheretailholders
• Craftinganddeliveringthemessagetoactivatetherightinvestorsanddrivevotes
Let us prepare your activist strategy:CasSydorowitz
[email protected]+44(0)8707030302www.georgeson.com
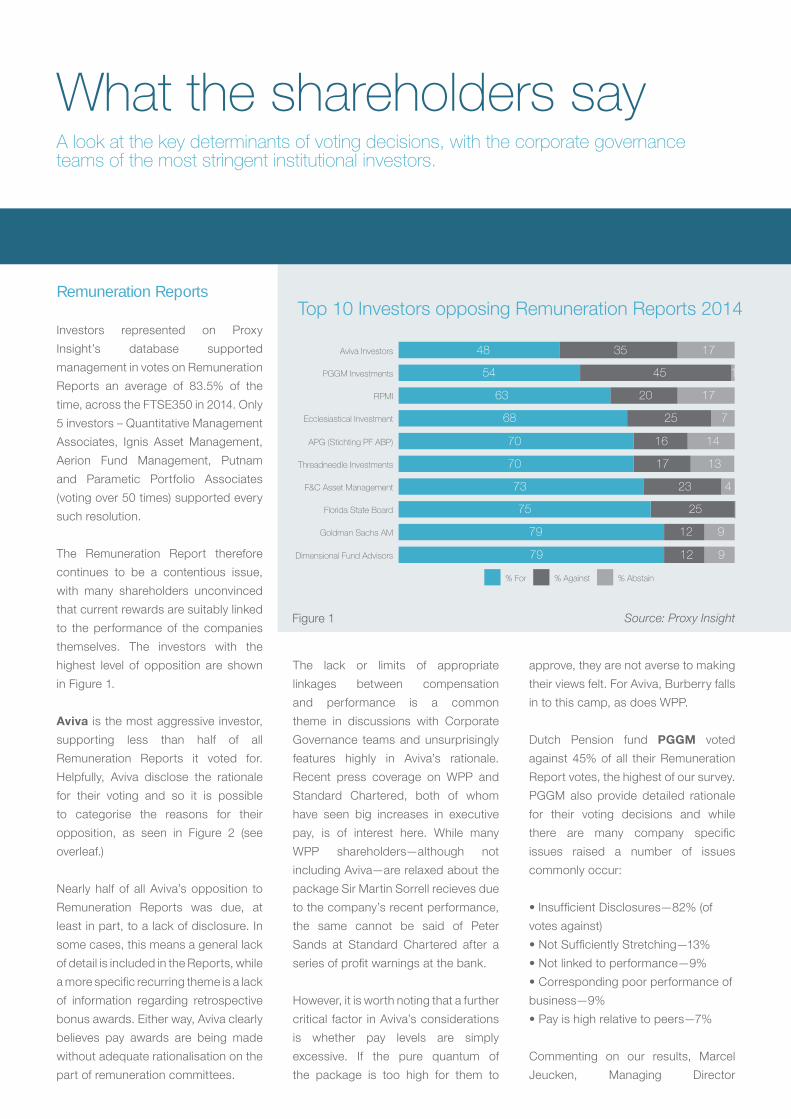
Remuneration Reports
Investors represented on Proxy
Insight’s database supported
management in votes on Remuneration
Reports an average of 83.5% of the
time, across the FTSE350 in 2014. Only
5 investors – Quantitative Management
Associates, Ignis Asset Management,
Aerion Fund Management, Putnam
and Parametic Portfolio Associates
(voting over 50 times) supported every
such resolution.
The Remuneration Report therefore
continues to be a contentious issue,
with many shareholders unconvinced
that current rewards are suitably linked
to the performance of the companies
themselves. The investors with the
highest level of opposition are shown
in Figure 1.
Aviva is the most aggressive investor,
supporting less than half of all
Remuneration Reports it voted for.
Helpfully, Aviva disclose the rationale
for their voting and so it is possible
to categorise the reasons for their
opposition, as seen in Figure 2 (see
overleaf.)
Nearly half of all Aviva’s opposition to
Remuneration Reports was due, at
least in part, to a lack of disclosure. In
some cases, this means a general lack
of detail is included in the Reports, while
a more specific recurring theme is a lack
of information regarding retrospective
bonus awards. Either way, Aviva clearly
believes pay awards are being made
without adequate rationalisation on the
part of remuneration committees.
The lack or limits of appropriate
linkages between compensation
and performance is a common
theme in discussions with Corporate
Governance teams and unsurprisingly
features highly in Aviva’s rationale.
Recent press coverage on WPP and
Standard Chartered, both of whom
have seen big increases in executive
pay, is of interest here. While many
WPP shareholders—although not
including Aviva—are relaxed about the
package Sir Martin Sorrell recieves due
to the company’s recent performance,
the same cannot be said of Peter
Sands at Standard Chartered after a
series of profit warnings at the bank.
However, it is worth noting that a further
critical factor in Aviva’s considerations
is whether pay levels are simply
excessive. If the pure quantum of
the package is too high for them to
approve, they are not averse to making
their views felt. For Aviva, Burberry falls
in to this camp, as does WPP.
Dutch Pension fund PGGM voted
against 45% of all their Remuneration
Report votes, the highest of our survey.
PGGM also provide detailed rationale
for their voting decisions and while
there are many company specific
issues raised a number of issues
commonly occur:
• Insufficient Disclosures—82% (of
votes against)
• Not Sufficiently Stretching—13%
• Not linked to performance—9%
• Corresponding poor performance of
business—9%
• Pay is high relative to peers—7%
Commenting on our results, Marcel
Jeucken, Managing Director
What the shareholders sayA look at the key determinants of voting decisions, with the corporate governance teams of the most stringent institutional investors.
Aviva Investors
PGGM Investments
RPMI
Ecclesiastical Investment
APG (Stichting PF ABP)
Threadneedle Investments
F&C Asset Management
Florida State Board
Goldman Sachs AM
Dimensional Fund Advisors
48 35
70
17
141670
72568
2063
14554
17
73
1317
23 4
75 25
79 12 9
79 12 9
% For % Against % Abstain
Top 10 Investors opposing Remuneration Reports 2014
Source: Proxy InsightFigure 1

Responsible Investment at PGGM
Investment said:
“Voting against proposals is not
something PGGM takes lightly. PGGM
is however very pleased that in the
UK shareholders can vote on both
remuneration policies and reports
as this significantly strengthens the
system of proper checks and balances.
The UK is a pioneer on this issue and
we believe it can (and will) improve
remuneration practices over time.”
RPMI has been a leading driver in
promoting longer term remuneration
targets around remuneration. It is
therefore of little surprise to see it at
third place in our rankings.
Ecclesiastical Investment
Management has also been a vocal
player on the subject of executive
pay. Commenting on our study, the
investor’s Head of SRI, Neville White,
stated:
“We are gratified by these results
as they suggest our rigorous policy
against supporting excessive awards
disconnected from long-term, superior
outperformance is firmly integrated
into our voting outcomes. Among
the top UK companies (FTSE30) we
find it increasingly difficult to support
executive remuneration packages,
and these results show that in around
half of FTSE350 cases we have been
unable to support management”.
The top US public pension
fund, Florida State Board of
Administration (SBA) provided Proxy
Insight with some of the key criteria it
applies when voting on remuneration.
Mike McCauley, its Senior Officer for
Investment Programs & Governance,
highlighted these points:
• SBA voting on FTSE companies is
similar to other developed markets and
generally in line with its overall global
voting statistic of approximately 20% to
25% votes against.
• Poor disclosure surrounding
performance objectives, award
thresholds, and key structural features
of any existing/proposed equity plans.
• Sufficient transparency is necessary
to fully understand how short/long term
incentive plans have been designed
and have worked.
• SBA prefers to see a strong
performance orientation embedded
within compensation framework, with
high correlation between financial
performance, total compensation,
and total stock returns (and votes
accordingly).
• It also examines compensation on
a relative basis, adjusting for industry
and size, and utilises several external
compensation models (e.g., ISS, Glass
Lewis, and Farient Advisors).
Remuneration Policy
For all investors in the Proxy Insight
database in 2014, the average support
for Remuneration Policy across the
FTSE350 was 88.5%, five percentage
points higher than the average support
for the Remuneration Report. Eight
investors supported every resolution
they voted on, including TIAA-CREF
and Ignis Asset Management.
As a binding resolution, the level
of opposition is lower than for
Remuneration Report. However, there
is still significant opposition from key
investors, as seen in Figure 3 (see
overleaf.)
Fidelity Worldwide took a much
tougher stance on Remuneration for
the 2014 proxy season, citing concerns
around the lack of long-term structure
in executive pay. Trelawny Williams,
Global Head of Corporate Finance at
Fidelity, commented on our analysis as
follows:
“Our votes against management were
a consequence of our campaign to
extend LTIP retention periods to five
years. We are not proud of having had
to vote against so many companies but
on the plus side it has led to significant
and continuing change on the ground
Voting against proposals is not something PGGM takes lightly”“
49%43%
37%31%
16%15%
14%10%
7%6%
5%
Lack of Disclosure
Lack/Low Performance link
Excessive Actual/Potential Pay Level
Lack of Retrospective Disclosure on Bonus Awards
Inappropriate Discretionary Payments
Generous Pension
Undue Ratcheting up of pay
No Limits Under Incentive Schemes
Lack of Claw-back Policy
Inappropriate Service Contracts
Lack of Independence on Committee
Key issues causing Aviva to oppose Remuneration Reports
Source: Proxy Insight
9
Figure 2

with over 50 FTSE companies now
having an LTIP share retention period
of over three years, up from only 13
two years ago.”
Of additional interest is that Fidelity is
the only investor to actually vote against
either of the remuneration categories
as opposed to a combination of against
and abstain votes.
Aviva applies much the same concerns
for its votes against Remuneration
Policy as for its votes against Reports
(Figure 4.) However, in a reversal of its
priorities, excessive potential pay is its
highest concern when deciding how
to vote on policies. The lack of bonus
deferral shows Aviva’s concerns that
companies are not being long-term
enough in their planning of variable
pay. In addition, Aviva also believes
certain boards are seeking too much
discretion to determine remuneration,
rather than seeking shareholder
approval. Linked to this point is the lack
of suitable clawback should a reward
prove to be inappropriate as a result of
future losses.
The final issue raised by Aviva is the lack
or limit of a shareholding requirement.
The investor remains a supporter
of requiring executives to think more
long-term and increase their linkage to
the wider shareholder base by owning
stock in the company they manage.
Report versus Policy
The different approaches investors
take to Remuneration Reports and
Policies continues to surprise and
enliven the debate around executive
compensation. But why should this be
so? True, one is historic, while the other
is forward looking. One is advisory
and the other binding. But should
there really be any difference between
investors’ voting on the two?
This report suggests investors take
a slightly more aggressive stance
on Reports than they do on Policies,
although in reality there seems little
difference at an aggregate level. Most
variations appear to be peculiar to
each company; for example, Standard
Chartered had very poor support for
its forward looking Policy, though
its Report received a slightly above
average level of support compared
to the wider FTSE100. Conversely,
Burberry’s Report failed, while its
Policy received reasonable, albeit
below average, support.
In terms of actual voting, three Dutch
pension funds—PGGM Investments,
Tandtechniek Stichting Pernsioenonds
and BPL Pensioen—opposed over 20%
more Remuneration Reports than they
did for Remuneration Policies. Conversely
while Fidellity Worldwide opposed 57% of
Policies this fell to only 13 % for Reports.
Likewise Ecclesiastical’s opposition was
47% and 32% for Policies and Reports
respectively.
43 54 3
53 32 15
56 26 18
59 22 19
76 21 3
77 22 1
79 12 9
80 10 10
80 20
84 11 5
Fidelity Worldwide
Ecclesiastical Investment
Aviva Investors
RPMI
F&C Asset Management
PGGM Investments
APG (Stichting PF ABP)
Threadneedle Investments
Florida State Baord
Dreyfus Corp.
% For % Against % Abstain
Top 10 Investors opposing Remuneration Policies 2014
Excessive Actual/Potential Pay Level
Lack Bonus Deferral
Too Much Discretion
Low/No Shareholding Requirement
Lack of Disclosure
Lack of Claw-Back Policy
Lack/Low Performance Link
Inappropriate Service Contracts
Uncapped Bonus
Too Short Term
30%29%
26%16%16%16%
13%11%11%
7%
Key issues causing Aviva to oppose Remuneration Reports
Source: Proxy Insight
Source: Proxy Insight
Figure 3
Figure 4
Aviva: A new policy includes requests
for annual disclosure of the remuneration
policy table within the remuneration
report. It also includes requests
for identifiable limits to executive
compensation, as Aviva is unlikely to
support compensation without limits.
Furthermore, the new policy indicates
support for companies that are
accredited as paying the living wage,
and expands and clarifies the investor’s
ideal clawback provision to include
performance adjustment or post-vesting
clawback.
BlackRock: Its new policy has a more
detailed explanation of BlackRock’s
say on pay analysis—where its old
policy says say on pay votes are
likely to correspond with votes on
the directors who are compensation
committee members, the new policy
explains the following preferences in
compensation: disclosure; long-term;
not solely formulaic; explanation of
unusual structure; avoid benchmarking;
good peer selection; no arbitrary limits;
no preference for specific plan; and
responsive to shareholders. The policy
also explains BlackRock’s engagement
process when it has concerns about
executive compensation.
BNP Paribas: Its new approach
expands requirements for a company’s
remuneration policy to include: an
explanation of the philosophy of the
remuneration policy; the link with
strategy and HR policy; the split between
the different remuneration mechanisms
chosen; long-term plan with extra-
financial performance metrics. New
negative aspects of the remuneration
policy include remuneration that is
disproportionate relative to the evolution
of its employees’ median remuneration.
For approving short-term remuneration,
BNP’s new policy adds requirements for
the disclosure of rules for formulating
short-term remuneration and
performance criteria of short-term
remuneration. The new policy adds
clawback and performance disclosure
requirements for long term remuneration.
SBA will vote for proposals to ratify or renew management/
profit sharing contact with other companies“CalSTRS: The pension fund’s old
policy says that additional forms of
compensation such as retirement
benefits are not warranted for director
compensation. The new policy explains
that this is because this kind of benefit
could create perverse incentives. An
old policy says the Audit Committee
should receive greater compensation
than other Board Committees, while
the new policy doesn’t mention this.
Charles Schwab: Used to simply
follow Glass Lewis, but now has its
own policy, which is used in addition
to the Glass Lewis policy and
includes: advisory vote on executive
compensation; equity awards plans;
employee stock purchase plans; and
the repricing of options.
CPPIB: A new policy cautions against
the use of external peer benchmarking
as it could lead to an escalation in
executive pay, unsupported by company
performance. The new policy also
expands the investor’s clawback policy
to include other performance metrics, as
well as misstated financial results.
F&C: Its new policy expands on
performance metrics and talks about
reputational and regulatory risks for
companies and industries where pay
levels were seen by regulators, investors
and the general public as excessive and
insufficiently aligned with performance.
Florida SBA: The new policy says the
SBA will vote for proposals to ratify
or renew management/profit-sharing
contracts with other companies (in
which the company retains or gains
management control over the other). It
also expands and clarifies the investor’s
views on golden parachutes.
Glass Lewis: The proxy adviser’s new
policy has a section on risk-taking in
its opening paragraph. It also includes
implementation and effectiveness as
criteria for its “say on pay” review. The
new policy includes a section on one-off
awards and expands on the following
points: clawback; compensation
consultants; golden parachutes; and
employee stock purchase plans.
ISS: A new scorecard is used to evaluate
equity plans. Rather than listing pass
and fail requirements, the scorecard is
designed to give a more balanced review
of equity plans.
The policiesHere, we review how voting policies are changing for a number of significant investors
11

Janus: The old policy says Janus will
generally vote against plans where the
proposed cost of an equity-based-plan
is above the allowable cap determined
by the proxy adviser. The new policy
adds that the investor will also vote
“against” if plan’s features and grant
practices are misaligned with the
maximising of shareholder value.
OTPP: The investor’s new policy
expands “say on pay” guidelines, and
aligns pay with performance. It also lists
certain trigger points that could result
in an “against” vote on say on pay.
The new policy changes the wording
of disclosure requirements from hurdle
rate to vesting conditions.
Royal London: A new policy says the
investor will vote against a remuneration
policy if it has concerns with how
remuneration is structured or if the policy
allows for excessive remuneration. The
new policy adds that Royal London
will vote against the remuneration
policy when pension payments are
excessive and out of line with pension
benefits awarded to employees, and
expands the approach to performance
periods from a hard requirement for “a
minimum of three years” to “preferably
for five years”. It also adds a section on
additional post-vesting holding periods
and adds a minimum credit quality
performance requirement.
SWIB: The old policy says SWIB will
evaluate the link between pay and
performance by reviewing proxy
materials. The new policy details
performance evaluation criteria that
SWIB considers positive and negative
and its position on non-performance
based compensation. The old policy
says plans that are not clear or lack
specific information on which to
determine pay and performance links
are typically not supported. The new
policy details exactly what must be
disclosed (e.g. Performance targets;
Financial Metrics; Compensation drivers
etc.). The acceptable level of dilution for
compensation plans has been revised
from 20% to 15%. The new policy
also gives more detail and specifics
on retirement plans and severance
payments.
T. Rowe Price: An old policy says
votes against bank bonuses are likely,
while the new policy has no mention of
them. An old policy says the investor
will generally vote for Section 162(m)
proposals. Their new policy adds unless
evergreen provisions are present.
Union Investment: The new policy
includes a request for key ‘non-financial’
performance indicators and requests
quantifiable limits and disclosure for
remuneration. It takes a critical view of
retrospective improvements to existing
share-option schemes or performance
measures that make it easier to achieve
specified targets.
Companies that successfully passed
both remuneration votes, even by small
margins, may be tempted to think that
this year’s focus on compensation will
not have long-term consequences and
continue broadly as they are. However,
the following risks illustrate why this may
be a poor decision:
Bad PR – Burberry, Standard
Chartered, Barclays and others all
received negative press coverage
over pay practices. More than merely
embarrassing these companies, the
negative coverage will no doubt cause
issues with staff, customers and
suppliers, as well as with shareholders.
Increasing Investor scrutiny – The
voting behaviour of investors is under
greater scrutiny than ever before and the
need to be shown to be good stewards
is of paramount importance. In addition,
many shareholders are introducing
more stringent rules on what forms of
remuneration are acceptable.
Competition for Capital – In a global
equity market, issuers must compete
with numerous other sources of capital.
Removing any obstacles to shareholder
support is surely a no-brainer for
Investor Relations teams.
Activism – Low levels of shareholder
support is a key screening tool used by
Activist investors when selecting new
targets. Indeed, it is no coincidence
that Marathon Partners chose to
nominate three directors to the board of
US issuer Shutterfly, after the company
received just 50.01% support for its
Remuneration Report last year.
So what?
12

AppendixPart 1: FTSE 100 Companies
Remuneration Policy Remunerartion Report
Company % FOR Vs Avg % FOR Vs Avg
3i Group PLC 98.1 105 98.5 106
Aberdeen Asset Management PLC 86.3 92 88.8 96
Admiral Group PLC 98.5 105 99.6 107
Aggreko PLC 96.7 103 98.7 106
Anglo American PLC 94.6 101 94.9 102
Antofagasta PLC 91.8 98 97.4 105
ARM Holdings PLC 97.6 104 97.5 105
Ashtead Group PLC 96.8 103 69.8 75
Associated British Foods PLC 90.6 97 94.0 101
AstraZeneca PLC 85.0 91 61.5 66
Aviva plc 96.9 103 98.1 106
Babcock International Group PLC 98.9 106 99.7 107
BAE Systems PLC 93.0 99 93.2 100
Barclays PLC 93.2 100 76.0 82
Barratt Developments PLC 99.0 106 99.3 107
BG Group PLC 93.7 100 67.2 72
BHP Billiton PLC 1 97.2 104 98.2 106
BP PLC 96.4 103 83.9 90
British American Tobacco PLC 90.5 97 95.3 103
British Land Co PLC 97.3 104 97.2 105
BT Group plc 96.9 103 99.1 107
Bunzl PLC 97.8 104 97.8 105
Burberry Group PLC 83.9 90 47.3 51
Capita PLC 94.5 101 90.9 98
Carnival PLC 61.9 66 58.6 63
Centrica PLC 96.1 103 98.3 106
Coca-Cola HBC AG 81.5 87 85.9 92
Compass Group PLC 97.8 104 99.1 107
CRH PLC 95.2 102 98.1 106
Diageo plc 97.5 104 97.0 104
Direct Line Insurance Group PLC 97.6 104 98.1 106
Dixons Carphone PLC 2 90.7 97 91.4 98
13

easyJet PLC 55.0 59 55.5 60
Experian PLC 87.4 93 85.9 93
Fresnillo PLC 99.7 106 100.0 108
Friends Life Group Ltd 96.9 103 98.1 106
G4S PLC 98.4 105 98.3 106
GKN PLC 97.8 104 99.3 107
GlaxoSmithKline PLC 97.4 104 98.5 106
Glencore Plc 97.9 105 99.1 107
Hammerson PLC 97.1 104 97.8 105
Hargreaves Lansdown PLC 98.4 105 93.0 100
HSBC Holdings plc 79.4 85 84.0 90
Imperial Tobacco Group PLC 88.0 94 92.6 100
InterContinental Hotels Group PLC 90.9 97 94.0 101
International Consolidated Airlines Group SA 0 86.0 93
Intertek Group PLC 98.4 105 97.1 105
Intu Properties PLC 99.8 107 99.7 107
ITV PLC 96.0 103 77.5 83
Johnson Matthey PLC 97.6 104 99.1 107
Kingfisher PLC 98.9 106 99.7 107
Land Securities Group PLC 99.1 106 99.7 107
Legal & General Group PLC 97.6 104 98.7 106
Lloyds Banking Group Plc 98.0 105 87.3 94
London Stock Exchange Group PLC 94.9 101 96.9 104
Marks & Spencer Group PLC 98.3 105 99.2 107
Meggitt PLC 99.0 106 99.8 107
Mondi PLC 98.1 105 99.0 107
National Grid PLC 96.3 103 99.0 107
Next PLC 97.9 105 99.6 107
Old Mutual PLC 97.2 104 97.0 105
Pearson Plc 95.8 102 65.8 71
Persimmon PLC 90.8 97 93.2 100
Prudential PLC 91.9 98 94.5 102
Randgold Resources Ltd 97.9 105 89.9 97
Reckitt Benckiser Group PLC 80.2 86 68.5 74
Reed Elsevier PLC 93.8 100 89.1 96
Rio Tinto PLC 1 94.8 101 97.2 105
Rolls-Royce Holdings plc 96.3 103 94.2 101
Royal Bank Scotland plc (The) 99.7 106 99.8 108
Royal Dutch Shell PLC (A) 92.9 99 93.3 101
Royal Mail PLC 96.5 103 99.7 107
RSA Insurance Group PLC 96.9 103 99.7 107
SABMiller PLC 92.3 99 95.4 103
Sage Group (The) PLC 95.0 101 96.2 104
Sainsbury (J) PLC 99.2 106 99.5 107
14

Schroders PLC 92.2 98 94.2 102
Severn Trent PLC 97.7 104 99.4 107
Shire PLC 94.7 101 97.0 104
Sky PLC 93.0 99 86.2 93
Smith & Nephew PLC 93.5 100 98.0 106
Smiths Group PLC 95.0 101 93.6 101
Sports Direct International PLC 87.5 93 97.9 105
SSE PLC 99.1 106 97.6 105
St. James’s Place PLC 99.9 107 100.0 108
Standard Chartered PLC 59.2 63 94.6 102
Standard Life PLC 95.8 102 97.7 105
Taylor Wimpey PLC 98.2 105 99.4 107
Tesco PLC 97.5 104 98.6 106
Travis Perkins PLC 93.3 100 96.6 104
TUI Travel PLC 97.6 104 99.4 107
Tullow Oil PLC 90.8 97 92.1 99
Unilever PLC 97.5 104 99.1 107
United Utilities Group PLC 98.5 105 99.4 107
Vodafone Group Plc 96.0 102 97.3 105
Weir Group PLC 99.6 106 99.8 108
Whitbread PLC 99.4 106 99.1 107
Wm Morrison Supermarkets PLC 73.5 78 89.1 96
Wolseley PLC 93.6 100 98.4 106
WPP PLC 81.9 87 81.8 88
Average 93.7 92.8
Notes:1 As dual listed companies Rio Tinto PLC and BHP Billiton PLC had Remuneration Report votes for both UK and Austalian law. The UK law vote was used for this analysis2 Data shown was for Carphone Warehouse PLC
15

AppendixPart 2: FTSE 250 Companies
16
Remuneration Policy Remuneration Report
Company % FOR Vs Avg % FOR Vs Avg
3i Infrastructure PLC 2 99.9 105
Aberforth Smaller Companies Trust Plc 100.0 105 100.0 105
Acacia Mining PLC 98.4 103 85.4 90
Afren PLC 91.6 96 91.8 96
Al Noor Hospitals Group PLC 98.2 103 100.0 105
Alent PLC 96.8 102 99.4 104
Alliance Trust PLC 89.2 94 93.8 99
Allied Minds PLC 3 0 0
AMEC Foster Wheeler PLC 81.3 85 88.4 93
Amlin PLC 97.6 103 98.9 104
AO World plc 99.6 105 99.4 104
Ashmore Group PLC 82.2 86 99.0 104
AVEVA Group PLC 97.3 102 96.6 101
Balfour Beatty PLC 97.2 102 92.2 97
Bank of Georgia Holdings plc 91.9 97 93.6 98
Bankers Investment Trust PLC 96.3 101 96.3 101
Barr (A G) PLC 96.8 102 99.5 105
BBA Aviation PLC 95.1 100 99.4 104
Beazley PLC 98.2 103 83.3 88
Bellway PLC 97.7 103 98.5 103
Berendsen PLC 99.3 104 99.3 104
Berkeley Group Holdings (The) PLC 95.9 101 91.6 96
Betfair Group PLC 99.8 105 68.1 72
BH Macro Ltd 2 0 99.9 105
Big Yellow Group PLC 99.7 105 99.5 104
BlackRock World Mining Trust plc 99.7 105 99.8 105
BlueCrest AllBlue Fund Ltd 4 0 0
Bodycote PLC 96.1 101 98.5 104
Booker Group PLC 98.4 103 99.1 104
Bovis Homes Group PLC 96.6 102 95.5 100
Brewin Dolphin Holdings plc 96.5 101 96.6 101
BRIT PLC 3 0 0

17
British Empire Securities and General Trust 2 0 99.5 104
Britvic PLC 1 97.9 103 99.1 104
Brown (N) Group PLC 95.9 101 81.5 86
BTG PLC 95.1 100 99.3 104
Bwin.party digital entertainment plc 83.2 87 86.5 91
Cable & Wireless Communications PLC 97.3 102 89.9 94
Cairn Energy PLC 98.1 103 99.3 104
Caledonia Investments PLC 99.8 105 99.8 105
Capital & Counties Properties PLC 80.3 84 78.7 83
Card Factory PLC 3 0 0
Carillion PLC 96.1 101 95.7 101
Catlin Group Ltd 98.4 103 89.6 94
Centamin PLC 2 0 74.0 78
Cineworld Group PLC 86.5 91 71.1 75
City of London Investment Trust PLC 98.7 104 98.6 104
Close Brothers Group PLC 92.5 97 89.0 93
CLS Holdings PLC 82.4 87 91.1 96
Cobham PLC 98.4 103 97.1 102
Colt Group SA 94.9 100 98.1 103
Computacenter PLC 99.7 105 99.6 105
Countrywide plc 95.2 100 99.5 105
Cranswick PLC 72.8 76 100.0 105
Crest Nicholson Holdings plc 94.6 99 61.6 65
Croda International PLC 98.2 103 98.3 103
CSR PLC 93.7 98 94.8 100
Daejan Holdings PLC 97.9 103 99.5 105
Dairy Crest Group PLC 96.0 101 93.5 98
DCC PLC 98.9 104 99.2 104
De La Rue PLC 98.8 104 99.8 105
Debenhams PLC 98.7 104 99.8 105
Dechra Pharmaceuticals PLC 98.3 103 99.8 105
Derwent London PLC 99.5 105 98.1 103
Dignity PLC 98.2 103 99.0 104
Diploma PLC 93.8 98 99.6 105
Domino Printing Sciences PLC 97.8 103 96.4 101
Domino’s Pizza Group PLC 98.4 103 99.5 104
Drax Group PLC 94.1 99 82.7 87
Dunelm Group PLC 98.7 104 99.2 104
Edinburgh Investment Trust Plc 98.9 104 99.1 104
Electra Private Equity PLC 99.7 105 99.7 105
Electrocomponents PLC 99.3 104 99.3 104
Elementis PLC 97.5 102 97.0 102
Enterprise Inns PLC 99.8 105 99.3 104
Entertainment One Ltd 90.4 95 99.7 105
18
Essentra PLC 96.7 102 97.9 103
Esure Group plc 99.0 104 99.9 105
Euromoney Institutional Investor PLC 88.6 93 92.2 97
Evraz plc 99.3 104 99.4 104
F&C Commercial Property Trust Ltd 99.9 105 99.9 105
Fidelity China Special Situations PLC 99.3 104 99.4 104
Fidelity European Values PLC 99.1 104 99.3 104
Fidessa Group PLC 99.6 105 99.9 105
FirstGroup PLC 89.0 93 74.5 78
Fisher (James) & Sons PLC 98.2 103 99.3 104
Foreign & Colonial Investment Trust 92.7 97 93.0 98
Galliford Try PLC 98.1 103 99.5 104
Game Digital Plc 1 100.0 105 100.0 105
Genesis Emerging Markets Fund PLC 5 0 0
Genus PLC 99.4 104 99.0 104
Go-Ahead Group (The) PLC 97.1 102 97.9 103
Grafton Group PLC 98.2 103 99.9 105
Grainger PLC 88.7 93 92.5 97
Great Portland Estates PLC 96.7 102 98.1 103
Greencore Group PLC 1 98.8 104 99.1 104
Greene King PLC 95.8 101 99.5 105
Greggs PLC 98.0 103 99.9 105
Halfords Group PLC 97.0 102 99.3 104
Halma PLC 99.0 104 99.7 105
Hansteen Holdings plc 92.9 98 98.1 103
Hays PLC 92.6 97 98.6 104
Hellermanntyton Group PLC 95.4 100 98.2 103
Henderson Group PLC 89.7 94 72.2 76
HICL Infrastructure Company 2 0 98.2 103
Hikma Pharmaceuticals PLC 92.5 97 98.7 104
Hiscox Ltd 58.0 61 97.1 102
Home Retail Group PLC 94.9 100 98.8 104
Homeserve PLC 90.5 95 93.9 99
Howden Joinery Group PLC 98.4 103 98.8 104
Hunting PLC 91.5 96 98.4 103
ICAP PLC 67.4 71 99.8 105
IG Group Holdings PLC 96.1 101 99.5 104
IMI PLC 95.9 101 98.9 104
Inchcape PLC 96.5 101 97.3 102
Indivior PLC 3 0 0
Infinis Energy Plc 97.8 103 98.9 104
Informa PLC 93.9 99 98.6 104
Inmarsat PLC 96.7 102 98.4 103
Intermediate Capital Group PLC 79.9 84 77.3 81

19
International Personal Finance PLC 97.1 102 63.3 67
International Public Partnerships Limited 5 0 0
Interserve PLC 98.2 103 99.0 104
Investec PLC 56.0 59 90.0 95
IP Group PLC 99.9 105 99.9 105
Jardine Lloyd Thompson Group PLC 97.1 102 97.7 103
JD Sports Fashion PLC 95.5 100 86.4 91
Jimmy Choo PLC 3 0 0
John Laing Infrastructure Fund 5 0 0
JPMorgan American Investment Trust 99.7 105 99.7 105
JPMorgan Emerging Markets Inv Trust 99.7 105 99.8 105
Jupiter Fund Management PLC 96.9 102 99.8 105
Just Eat PLC 3 0 0
Just Retirement Group PLC 97.4 102 90.1 95
Kaz Minerals PLC (was Kazakhmys PLC) 99.3 104 86.9 91
Keller Group PLC 97.9 103 99.5 105
Kennedy Wilson Europe Real Estate plc 5 0 0
Kier Group PLC 98.9 104 88.5 93
Ladbrokes PLC 98.0 103 99.5 105
Laird PLC 94.7 100 98.0 103
Lancashire Holdings Ltd 90.1 95 69.9 73
Law Debenture Corporation 99.8 105 99.7 105
LondonMetric Property PLC 98.8 104 94.8 100
Lonmin PLC 82.8 87 89.4 94
Man Group PLC 96.5 101 96.5 101
Marston’s PLC 97.3 102 99.8 105
Melrose Industries PLC 77.4 81 95.8 101
Mercantile Investment Trust 99.7 105 99.7 105
Merlin Entertainments plc 99.4 104 99.8 105
Michael Page International PLC 98.7 104 98.2 103
Micro Focus International PLC 90.6 95 73.4 77
Millennium & Copthorne Hotels PLC 99.1 104 99.9 105
Mitchells & Butlers PLC 1 99.3 104 99.9 105
MITIE Group PLC 98.8 104 71.9 75
Moneysupermarket.com Group PLC 95.0 100 95.1 100
Monks Investment Trust 99.7 105 99.8 105
Morgan Advanced Materials PLC 97.8 103 99.6 105
Murray International Trust PLC 99.1 104 99.3 104
National Express Group PLC 88.5 93 64.0 67
NB Global Floating Rate Income Fund 2 0 99.7 105
NMC Health PLC 97.5 102 100.0 105
Northgate PLC 95.2 100 94.4 99
Nostrum Oil & Gas PLC 3 0 0
Ocado Group PLC 87.2 92 80.0 84
20
Ophir Energy PLC 98.9 104 74.2 78
Oxford Instruments PLC 98.8 104 99.6 105
Pace PLC 91.2 96 87.3 92
Paragon Group of Companies (The) PLC 91.4 96 93.7 98
PayPoint PLC 97.7 103 99.8 105
Pennon Group PLC 97.1 102 95.8 101
Perpetual Income and Growth Investment Trust Plc 99.7 105 99.7 105
Personal Assets Trust 97.9 103 97.7 103
Petra Diamonds Ltd 95.3 100 100.0 105
Petrofac Ltd 77.5 81 98.4 103
Pets at Home Group Plc 99.2 104 100.0 105
Phoenix Group Holdings 84.7 89 81.0 85
Playtech PLC 96.4 101 99.4 104
Polar Capital Technology Trust 99.4 104 99.3 104
Polymetal International plc 99.8 105 99.8 105
Poundland Group Plc 91.8 96 99.9 105
Premier Farnell PLC 95.4 100 98.0 103
Premier Oil PLC 86.1 90 98.6 104
Provident Financial PLC 96.0 101 96.0 101
PZ Cussons PLC 87.4 92 99.5 104
QinetiQ Group PLC 84.7 89 99.4 104
Rank Group (The) PLC 92.1 97 90.0 95
Rathbone Brothers plc 95.7 101 84.2 88
Redefine International plc 1 99.7 105 99.8 105
Redrow PLC 95.3 100 90.5 95
Regus PLC 99.6 105 98.3 103
Renishaw PLC 86.4 91 97.1 102
Rentokil Initial PLC 96.1 101 99.5 104
Restaurant Group (The) PLC 99.2 104 99.5 105
REXAM PLC 97.1 102 98.4 103
Rightmove PLC 98.6 104 99.8 105
RIT Capital Partners PLC 99.2 104 99.7 105
Riverstone Energy 5 0 0
Rotork PLC 96.6 102 98.6 104
RPC Group PLC 97.8 103 99.5 105
RPS Group PLC 89.7 94 94.6 99
Saga PLC 3 0 0
Savills PLC 99.7 105 99.6 105
Scottish Investment Trust 96.6 101 96.7 102
Scottish Mortgage Investment Trust plc 99.5 105 99.5 105
Segro PLC 98.6 104 95.6 100
Senior PLC 97.6 103 96.5 101
Serco Group PLC 98.1 103 99.6 105
Shaftesbury PLC 98.7 104 98.9 104

21
SIG PLC 99.7 105 99.6 105
Smith (DS) PLC 77.1 81 81.9 86
SOCO International PLC 98.4 103 98.7 104
Spectris PLC 98.2 103 99.1 104
Spirax-Sarco Engineering PLC 98.5 103 99.4 104
Spire Healthcare Group PLC 3 0 0
Spirit Pub Company PLC 99.3 104 99.6 105
SSP Group PLC 1 92.4 97 98.0 103
St Modwen Properties PLC 98.8 104 98.0 103
Stagecoach Group PLC 95.5 100 99.7 105
SuperGroup PLC 93.7 98 91.5 96
SVG Capital PLC 99.0 104 65.0 68
Synergy Health PLC 97.7 103 98.9 104
Synthomer plc 93.0 98 97.1 102
TalkTalk Telecom Group PLC 93.7 98 97.3 102
Tate & Lyle PLC 97.9 103 98.8 104
Ted Baker PLC 97.2 102 99.8 105
Telecity Group PLC 97.8 103 99.3 104
Telecom plus PLC 79.8 84 98.7 104
Temple Bar Investment Trust Plc 0 0
Templeton Emerging Markets Investment Trust 99.8 105 99.8 105
Thomas Cook Group PLC 98.9 104 99.6 105
TR Property Investment Trust 97.8 103 98.3 103
TSB Banking Group PLC 3 0 0
Tullett Prebon PLC 88.1 93 64.5 68
UBM PLC 95.8 101 99.3 104
UDG Healthcare PLC 99.1 104 87.6 92
UK Commercial Property Trust Ltd 5 0 0
Ultra Electronics Holdings PLC 98.0 103 99.6 105
UNITE Group PLC 99.8 105 98.9 104
Vedanta Resources PLC 99.3 104 93.3 98
Vesuvius PLC 97.9 103 99.4 104
Victrex PLC 97.7 103 98.1 103
Wetherspoon (J D) PLC 99.9 105 99.7 105
WH Smith PLC 1 98.6 104 98.6 104
William Hill PLC 97.7 103 99.3 104
Witan Investment Trust PLC 98.3 103 98.7 104
Wood Group (John) PLC 97.7 103 99.4 104
Workspace Group PLC 99.3 104 99.3 104
Worldwide Healthcare Trust PLC 97.1 102 98.3 103
WS Atkins PLC 89.5 94 91.1 96
Zoopla Property Group PLC 1 99.5 105 100.0 105
Average 95.2 95.2

22
Notes:1 2015 data used as Rem Policy included2 No Rem Policy in 2014 and meeting not yet occurred in 20153 New Issue - no AGM yet4 No Rem Policy or Rem Report vote in 20145 Vote Breakdown Not Disclosed

Are youprepared?
www.activistinsight.com
Activist Insight Online brings you the most extensive coverage of activist investors worldwide to ensure you know what to expect from their engagement. Stand out from the crowd with market leading knowledge of activist situations across the globe, whilst saving valuable time in your research efforts.