uk legal it 1995-2020 the market economics
TRANSCRIPT

There may
be Trouble ahead
UK Legal IT 1995-2020
The Market Economics

But while
there’sMoonlight

and Music

and Love

and Romance

Let’sface the
Music

Contents
UK Legal
IT 2020
A Personal View 4Executive Summary 51995-2020 The Changing Legal IT Spend 7The Market Maps 8Corporate & Business Strategy Issues 11Financial Fundamentals: Projections 13Financial Fundamentals: Benchmarks 15Investment Intensity 18Financial Fundamentals: Sectors 19
Uberisation? 20Sector comparison 21Law Firm Sectors 22
Employee Cost Dynamics 24Sales per employee 25Payroll as % Sales 26Average Employee Cost 27
Go-To Brands 28Rising Stars 29Bright Boutiques 30Go-To Brands: Documentation 31
A vibrant and creative market with much to
offer all providers of legal services.
The Small Law Firm Sector 32
Spend by Small Law Firms 33Market Fundamentals 34Benchmarks 36Investment Intensity 37Market Maps 39Market Structure Today 41Go-To Brands 42Entry Costs & Barriers 43M&A and Entry Barriers 44Consolidation Case Study 45
(LEAP)
The Mid-Market Law Firm Sector 46
Mid-Market Fundamentals 48Spend by Mid-Market Firms 49Benchmarks 50Investment Intensity 51Market Maps 53Market Structure Today 55Go-To Brands 56Barriers to Entry 57M&A and Entry Barriers 58M&A Case Study: CSG 59
The Big-Law Firm Sector 60
Market Fundamentals 62Spend by Big Law Firms 63Benchmarks 64Investment Intensity 65Market Maps 67Market Structure Today 69Go-To Brands 70Market Entry & Barriers 71Ones to Watch 72
Who’s Who 72
Market Share Trends for Top 70 Suppliers 74
Appendix: Research method 85CMA Case 86

and Dance

Reasons To Be Cheerful 1
UK Legal
IT 2020
A Personal View 4Executive Summary 51995-2020 The Changing Legal IT Spend 7The Market Maps 8Corporate & Business Strategy Issues 11Financial Fundamentals: Projections 13Financial Fundamentals: Benchmarks 15Investment Intensity 18Financial Fundamentals: Sectors 19
Uberisation? 20Sector comparison 21Law Firm Sectors 22
Employee Cost Dynamics 24Sales per employee 25Payroll as % Sales 26Average Employee Cost 27
Go-To Brands 28Rising Stars 29Bright Boutiques 30Go-To Brands: Documentation 31
A vibrant and creative market with much to
offer all providers of legal services.
The three things to look out for in the next 5 years?The professional’s worry list: The Strategic AgendaWhat did the market do before and what will it do next?The shape of the market now – visualisations of the relative strengths of each supplier.Market sector attractiveness and comparators: growth rates, nett new sales, profits/profitabilityThe key benchmarks which determine if you’re growing market share or not?Historic rates, run rates and projected rates for the market overall. Investment, profit, cyclicality and the future path.Law firm developers compared to other legal services market sectors.Strategic challenges, myths and reality.Document automation, GC services and eDiscovery/Litigation support compared.Big Law developers compared with the Mid-market and Small law firms software developers.
The largest and most complex cost strategically examined in detail.Historic trends through 3 recessions and projected.The importance of people to design and delivery, projected.The size of the squeeze: more from less and the trend in investment in staff.
The leading brands, the big cheeses, the ones you just can’t forget.Then the real challengers, some quiet winners stealing a march.You’ll know them, but maybe you just don’t know just how well they’re doing.Size isn’t everything: we highlight the long term ‘winners’; the 1st and 2nd rank suppliers; for the strongest sector in legal services automation currently here (but for each of the law firm software developer sectors too below).
The Macro Context: no hype; no hyperbole; no hunches; just hard facts.

Reasons To Be Cheerful 2
UK Legal
IT 2020
The Tool Box: real strategic marketing
benchmarks you can plan on.
The 1-25 fee earner specialists, identified, quantified and projected to 2020.
The market size, growth rates, profitability, success factors, M&A and innovation.All that – in pictures too.Key numbers: historic, run rates and projected; what good and great really look like.Cyclicality, profitability, replatforming; timing, cost and projections.The financial character of every supplier pictorially represented 1995-2010.Who’s who and the long term financial character of the main players mapped.Not by size; by long term graft; First rank and second rank suppliers highlighted.The sum of the lessons from new entrants, start-ups and entrepreneurs: what it costs.M&A myths, lessons; what the winners have stuck with (and the losers ignored).We look at groups by including the historical performance of the teams they acquire – it’s an economists approach, not the one the acquiring CFOs use and talks to both market development and the strategy of the acquirers (good or bad).
The 26-75 fee earner sector; and yes – we do apportion revenues for those with sales below this sector and above it too according to stated licence fee distribution (where available).Sales, growth, nett new sales, profits, and profitability from 1995 and projected to 2020.The fundamentals of growth, cyclicality and competitive intensity: projected too.Compound annual growth rates, nett growth rates, and economic fundamentals.One of the most hotly contested sectors; will the woes of old be repeated or not?The shape of the market; is big beautiful here? How to compete with the deep pockets.The financial character of the various suppliers compared visually.The 1st rank suppliers may surprise you; the 2nd rank are very strong too.What’s the impact of deep pockets taking holding positions; fighting on 3 fronts?M&A multiples, lessons and real examples from all the main acquirers. Real ratios?Has the biggest agglomeration in the market helped or hindered the market?
The Small Law Firm Sector 32
Spend by Small Law Firms 33Market Fundamentals 34Benchmarks 36Investment Intensity 37Market Maps 39Market Structure Today 41Go-To Brands 42Entry Costs & Barriers 43M&A and Entry Barriers 44Consolidation Case Study 45
(LEAP)
The Mid-Market Law Firm Sector 46
Mid-Market Fundamentals 48Spend by Mid-Market Firms 49Benchmarks 50Investment Intensity 51Market Maps 53Market Structure Today 55Go-To Brands 56Barriers to Entry 57M&A and Entry Barriers 58M&A Case Study: CSG 59

Reasons To Be Cheerful 3
UK Legal
IT 2020
A vibrant and creative market with much to
offer all providers of legal services.
The75+ fee earner clients, including silver, magic circle and global firms.
Is it the biggest market with the brightest potential?What are the traps and foibles of dealing with big clients? Who’s competing well with Elite?What’s the best some of the 30+ suppliers here can expect to achieve?Was there a step change post 2010 and what does it mean looking to 2020?Elite’s leadership was not pre-ordained and it is not unassailable; here’s why.How the specialists and the challengers shape up today.There is a duopoly, but smart players can carve solid positions here too. 1st and 2nd rank listed.The legal services hype quantified. The top 7 investments over 10 years plotted and quantified.Tracking the incursion made by Intapp is instructive. Here’s why.
189 suppliers tracked, listed and quantified; the definitive supply-side economic analysis.
Market share trends summarise a firms contribution to the market and its performance. Sharetaker or caretaker? Lifestyle or leader? The top 70 firms performance is illustrated; some will surprise; some will be news to you. Understanding which firms are floating on a fast moving stream and which firms are achieving hard results in tough markets is key. It’s the bedrock of any strategy, operationally or in investment prioritising.
Supply-side economic analysis is the preferred approach to understanding these markets by the market, competition and regulatory authorities. The research method is not unique or unusual; just hard. We do it so the participants in the market (you) can see what the regulators, acquirers and investors see. It’s not secret; it’s not even private information; but it is hard to do and hard to do right. We’ve been at it for decades and every major acquisition or divestment in the market has been based on these numbers and these techniques.
The Big-Law Firm Sector 60
Market Fundamentals 62Spend by Big Law Firms 63Benchmarks 64Investment Intensity 65Market Maps 67Market Structure Today 69Go-To Brands 70Market Entry & Barriers 71Ones to Watch 72
Who’s Who 72
Market Share Trends for Top 70 Suppliers 74
Appendix: Research method 85CMA Case 86
Interpreting Market Shares
UK Legal
IT 2020
Sharetakers or caretakers…
1. Long Term Share Trends
2. Abuse
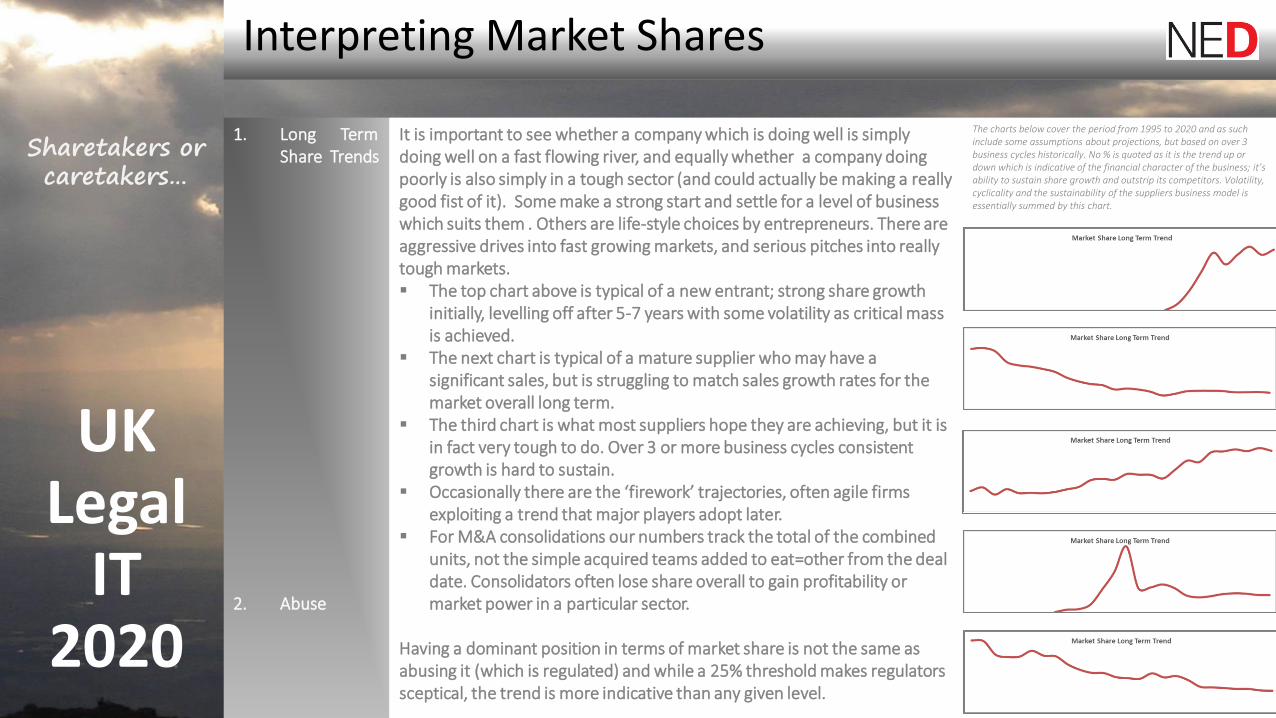
It is important to see whether a company which is doing well is simply doing well on a fast flowing river, and equally whether a company doing poorly is also simply in a tough sector (and could actually be making a really good fist of it). Some make a strong start and settle for a level of business which suits them . Others are life-style choices by entrepreneurs. There are aggressive drives into fast growing markets, and serious pitches into really tough markets. The top chart above is typical of a new entrant; strong share growth
initially, levelling off after 5-7 years with some volatility as critical mass is achieved.
The next chart is typical of a mature supplier who may have a significant sales, but is struggling to match sales growth rates for the market overall long term.
The third chart is what most suppliers hope they are achieving, but it is in fact very tough to do. Over 3 or more business cycles consistent growth is hard to sustain.
Occasionally there are the ‘firework’ trajectories, often agile firms exploiting a trend that major players adopt later.
For M&A consolidations our numbers track the total of the combined units, not the simple acquired teams added to eat=other from the deal date. Consolidators often lose share overall to gain profitability or market power in a particular sector.
Having a dominant position in terms of market share is not the same as abusing it (which is regulated) and while a 25% threshold makes regulators sceptical, the trend is more indicative than any given level.
The charts below cover the period from 1995 to 2020 and as such include some assumptions about projections, but based on over 3 business cycles historically. No % is quoted as it is the trend up or down which is indicative of the financial character of the business; it’s ability to sustain share growth and outstrip its competitors. Volatility, cyclicality and the sustainability of the suppliers business model is essentially summed by this chart.

1st Rank and 2nd Rank Suppliers
UK Legal
IT 2020
Sharetakers or caretakers…
The Rankings
The Criteria:
Size (critical Mass)
Net New Sales
Profit
Growth Rate
Market Share
A lot of effort is wasted comparing who’s biggest, then, now or in the future. So we decided to find a way of mapping what the market really knows is happening – who’s really in the lead, and by how much. The end result is a chart like the redacted one opposite for the small law sector. Can you place the brands in the boxes?
We’ve used the following criteria and weighted them to achieve a result which better reflects who the real leaders and real challengers are in each sector currently. Each is weighted differently to reveal the true achievers of ‘excellence’.
It is important to be a significant player, but size isn’t everything. Critical mass thresholds vary for each sector and can often be lower than you’d think.
The ability of a company to sustain long term nett growth is more important than an ability to rise a wave once in a while.
Profit is the key measure of whether you can do what clients want while being able to lead their expectations; sustaining it over time is difficult, and volatility often knocks a team’s ranking.
Empirical growth rates are important, especially when sustained.
The (complex) number which encapsulates whether a firm is in an easy sector or a tough one; this is the determinant of excellence.

A Personal View
UK Legal
IT 2020
What we’re measuring here is quite simple: pocket share; desk share. Spend.
It is the spend by law firms on legal IT from external suppliers, primarily. It begs the question of what is the spend by law firms on their internal teams (make or buy), but those figures are simply not available. That in turn begs the even bigger question of what is the spend by GCs on their own systems (cutting out or reducing the need for using law firms), which is more complex still, as many of their BPM/BPO projects would not even fall under the definition of ‘legal IT’ for some.
So we’ve placed the visible law firm spend in the context of the visible parts of the rest of the legal IT industry too. We compare law firm spend to related sectors such as GC software, document automation and litigation support (eDisclosure, etc). Law firms have no option but to invest in legal IT now more than ever. It does not mean that clients will stop investing in their own solutions, however, some of which will disintermediate the law firm services significantly.
We are not great believers in the sky falling just yet, however, whatever some futurists say. Lawyers, and now especially partners in law firms are tech literate, tech savvy even. Keeping the best talent means giving them the top tools for the job, and that’s no longer a library, or a PSL, but reliable and agile tech. We may be the first to say it, but having seen even large companies struggle with SAP implementations and commercial equivalents to what law firms face, in reality the legal sector is no worse than most, better than some, and quite insightful in others. Late arrivals perhaps, but not ingénues. To confuse a lawyers’ innate scepticism with ludditism is wrong. The professions are ready and eager now to tackle court process automation. The creativity among in-house teams to reduce legal risks through automation is growing apace. Distributed ledger technology could yet transform legal services delivery, and in the mean time document automation is delivering in spades. The sandbox is overflowing; the toolbox works well, and the window boxes are in full bloom. That’s why, despite the hard economics saying the deep pockets should have it, it’s too soon to call. There really is all to play for still.
It’s very much still a case of
‘Still all to play for’.
David R Johnston LLB MBA
‘This is not a market of also-rans. Quite the reverse. Much of this stuff is simply far too good to waste only on law firms…’

Replatforming
Marketing
Service with a smile