ugt - lysidata - svadss data management concepts 2015 · 2015-04-03 · data assignment ....
TRANSCRIPT

IN COOPERATION WITH
DATAMANAGEMENT CONCEPTS

LYSIDATA
Integrated Scientific Data Management System
The universal software system for measuring facilities
PART 1

Available LysiData Software Moduls
STANDARD SOFTWARE COMPONENTS
LysiData is a software package for measuring equipment and research institutes that consists of different, independent software modules, which can be scaled according to your requirements. It covers all aspects from data capture and data visualization/analysis to technical facility management.
LysiData is designed independent of hardware, logger and sensor manu-facturers. Existing or new measuring devices can be easily integrated after first time of establishing a LysiData Software System.
LysiData uses a central SQL database to store all data of system configura-tion, measurement and event data and settings to control the software mo-dules. The database system is individually designed and established to the customer.
Your SQL database can be installed locally on a computer, on a (data) server in your lab or department, or connected to a central database server in your data center. This way any college or technical operator who is authorized can work on your measuring data immediately after acquisition.

Database System
Workflow of a Research Facility
Datenbase Management
Automatic Data Acquistion
Data Collection / Management
Visualization
Facility Controlling
(Manual) Event Logging
Technical Facility Operation
(Scientific) Data Analysis
LysiData Software System offers you a Software-Module for any Requirement

Data Acquisition of a Research Facility
Default Environment without LysiData System
( ) Measuring Unit
Measuring Unit
Measuring Unit
Events/Errors
Protokolle
Data Acquiring
Manual Data Query
/ Copy
Data - Conversion - Preparation
Techn. plant operation
Operateur
Operateur
heterogeneous measurement environment
local, heterogeneous Data Repository
Logbook
-Service - Logging
Computer used As Data Store
Computer used As Data Store
Computer used As Data Store
New local, heterogeneous Data Repositories
Data Repository (Scientific) Data Processing / Analysis

Data Acquisition with LYSIDATA
Default Environment with LysiData Software System
( ) Measuring Unit
Measuring Unit
Measuring Unit
Events
Logging
Data Acquiring
Techn. facility operation
Operator
Heterogeneous measure- ment environment
Global, Homogen Data Repository
LDVisu LDControl LDProtocol
Computer +LDMess
Computer + LDMess
Computer + LDMess
Data Repository (Scientific) Data Processing / Analysis
Database System
Autom. Data-Transfer
Direct retrieval of Values, Events and Logs
+ LysiVisu +LDProtocol
+ LDVisu +LDProtocol
+ LDVisu
+ LDVisu Computer+LDMess

Database Architecture
All properties of the measuring units are mapped to configuration tables
All definitions and configurations are stored in configuration tables
Event- and Logbook-Tables provide clear evaluation of measurement conditions
Database System
Tables Lysimeter
Logger
Sensors
Lysimeter,…
ID Name etc. ...
Datenlogger
Name Address etc. ...
Sensor
Type Unit etc. ...
Computer
ID Name etc. ...
Definition
Hardware
Configuration
Software
Values with Event-ID
Data Values
Hardware-Events Logbook Entries
Logging and Protocol
Data Assignment
Configuration . . .
.
.
Metadata Tables
Value Tables

Available LysiData Software Moduls
STANDARD SOFTWARE COMPONENTS
LDMess – Automatic Data Acquiring
LDVisu – Data Visualization and Export
LDDBAdmin – Simple User Database Management
ADVANCED SOFTWARE COMPONENTS
LDWeb – WWW-Visualization
LDProtocol – Logbook and Data Mining
LDControl – Controlling Big Facilities
???? – Software-Moduls an Plugins for individual demand

LDMess – Data Aquisition
LDMess acquires your measurement data in regular and adjustable time
intervals from your dataloggers, evaluates this data and at last transmits
your data to the central database system. It comes with following benefits :

LDMess – Data Aquisition
Automatic Acquisition in free scalable Time Periods
Continuous Software Activity Protocol
TreeView of Measurement Unit, DataLoggers and Sensors
Detail Information Sensor e.g.
Actual Error Sensor List
Automatic Validation of measurements Values. Standard Validation :
Maximum, Minimum, Delta, Error -Values by Hardware
Custom Validations
Software-Side generated for Values in Time Periods:
Average, Maximum , Minimum, Dropped-Values
Custom Methods on Demand

LDMess – Data Aquisition
Popup-Alarm-Window if datalogger is not accessible for defined time intervall or last measurement values are older than specified
.Sending an email notice, if an irregular measurement state is happened ( needs a setup and integration of your email-server)
Automatic distribution of daily status reports regarding your measuring plots, data loggers and sensors(optional, needs a setup and integration of your email-server)

LDVisu – Data Visualization
LDVisu is used for the visualization of your data. You can view the data of
all your measuring devices in one visualization software/GUI.
The visualization Software LDVisu can be used from any computer which
has the privileges to access the database at the same time.

LDVisu – Data Visualization
Visualize 10 Sensors on 3 Axis at once
Viewing data over arbitrary, individual selected time period
Save and load individual chart config-urations including sensors, time period or until today and viewing details like graph-type and color selction for frequent or daily use
Export Data To Advanced Analysis Software-Tools

LDVisu – Data Visualization
Comfortable presentation and charting features :
Zoom in/out on x-/y-plain or visual selected area
automatic adaption to the actual measurement rang
Line-, Plot- ,bar-graphs or com-bined graphs for any sensor, individual color selectio
…

LDDBAdmin – Database Management
LDDBAdmin LDDBAdmin is used to process administrative tasks for
maintenance and best performance o SQL-Database with no need of
Database or SQL knowledge.
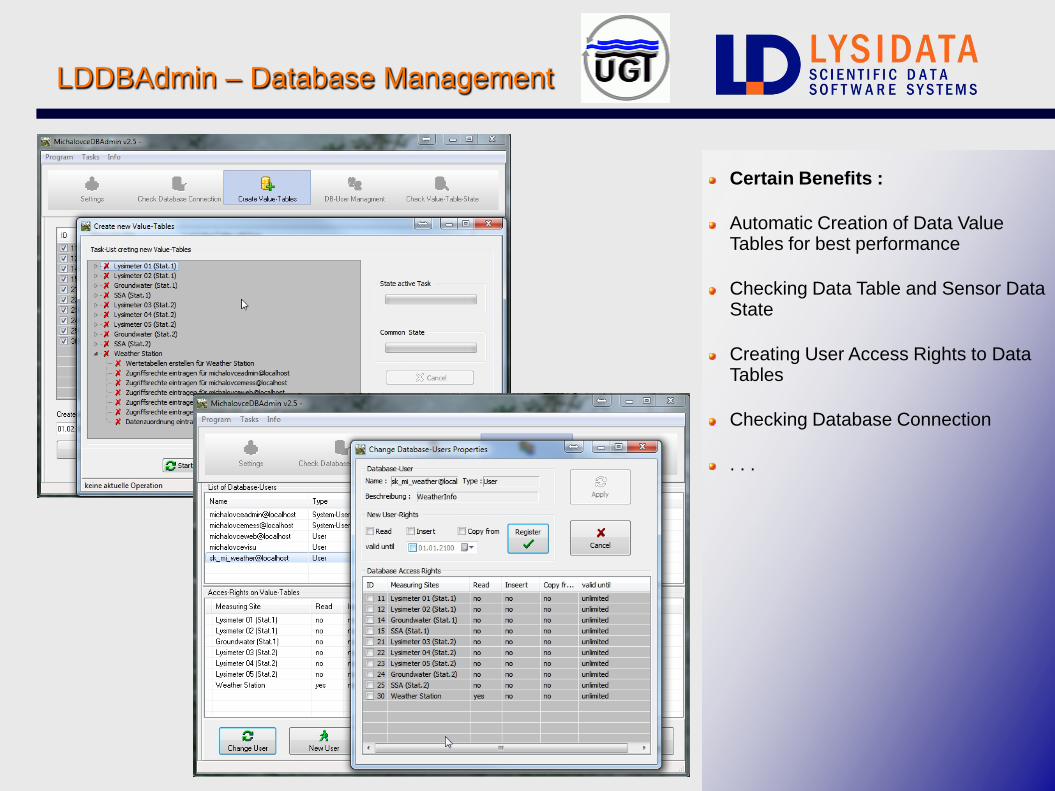
LDDBAdmin – Database Management
Certain Benefits :
Automatic Creation of Data Value Tables for best performance
Checking Data Table and Sensor Data State
Creating User Access Rights to Data Tables
Checking Database Connection
. . .

LDProtocol – Logbook/Data Mining
LDProtocol offers additional options for an ideal (technical) management
and maintenance of your facility/measurement equipment.
It is useful for leading a central electronical logbook and data mining /
creating reports on your facility.

LDProtocol – Logbook/Data Mining
Logbook :
Central logging / protocolling of all event data, which were not auto-matically generated:
Events like power or logger blackout, external damages or manually switched auxiliary devices (Heating, etc. …)
Service- und calibration activities
cultivation time periods and data
...

LDProtocol – Logbook/Data Mining
Data Mining / Report :
Generate reports/memorandums about all logbook entries and, in combination with LDControl, all measurement events from your sensors, loggers or measurement equipment :
Search for events or logbook entries over free defined time periods and combinations of sensors, dataloggers and measurement plot
Search for maintenance, service or calibration activities
Search for extended information like cultivation time periods and data
...
Save all search result and reports in files for later use

LDControl – Daily Facility Operating
LDControl is the ultimate software tool for the maintenance and operating
of all your sensors and measurement equipment in your facility.
LDControl comes with an clearly represented Graphic User Interface for
daily monitoring of your facility operations and shows all state messages
which will be generated, automatically by the software system or manuallly
by the operator(s) .

LDControl – Daily Facility Operating
LDControl GUI :
Main Window winth Sensor and Logger Events Overview in Treeviews with Details per unit, classified and grouped by sensors/logger and event.
Filter events by. processed / unpro-cessed events and event classification
List of event details
Automatic refresh of event states on free defined time periods(occured / terminated)
...

LDControl – Daily Facility Operating
LDControl Edit Events :
Detailed event informations
Extended event list on single events (occured / terminated)
Redefine event classification (Error, Warning,...)
Leaving comments on every event state or timestamp
postponement of events (e.g. outside humidity sensors in wintertime)
Manual or automatic removal of events from actual event list
Editing multiple events at one time
...

LDWeb – Online Visualisation
LDWeb is an online visualisation package for use in internet or intranet. It
is a webserver application to present or monitor your data on any common
used web browser without any software installation on client side.

LDWeb – Online Visualisation
Benefits :
Visualise 5 sensors on 3 axis at the same time
Free time period definition
Line-, point, bar- or area-charts on every axis
Redefine maximum and minimum on every axis
Normal- or widescreen visualisation (3/4 or 16/9) up to 2400 pixel width
Detailed measurement information (sensor, date/time and value/unit) on mouseover event
Multiple Window Visualisation , every subset can be shown in an own brow-ser-windows
...

LysiData Software System Benefits
INTEGRATED SOFTWARE SYSTEM
Based on a most flexible and intelligent SQL-Database Architecture
Easy extendable to nearly unlimited number of Sensors (limited by Hardware- / Database-System)
Distinct Long Time Data Storage and Accessibility
Individual adapted and equipped Database Model
Easy data access for scientists and operators
Modular and independent Software components for each individual demand
Independent from Measurement equipment / provider
One GUI/User-Interface for each operation task (e.g. data acquisition, visualisation, ...)
Software Components self configuring by the database system
All Software Modules are developed in C++/LabView
LysiData Scientific Software System is in progress since more then 12 years

LysiData Software System Benefits
TOP WORKFLOW DEMANDS
DATA ACQUISITION
Automatic Data Acquisition from nearly any resource into one data repository
Automatic Standard Data Evaluation
Easy Data Management in the data repository without SQL-Database knowledge
Extendable by integrating Software-PlugIns
(TECHNICAL) FACILITY OPERATION SUPPORT
Manual and automatic event logging and alarms
Facility Controlling by Visualization-, Controlling-,Data-Mining- and Logbook-Tools
Easy User and Database Management by specific Software-Module
Scientific Data Evaluation and Analysis
Extended Data Visualisation and Export Tools
Distinct Access to Measurement-, Operation- and Event-Logging

LysiData Software Systems References
REFERENCE PROJECTS
HELMHOLTZ CENTER D-MUNICH
IBOE : Lysimeter Station with 48 Lysimeter and Weather Station
Supported Since 2001 (about 800 Sensors)
EUS/BIOP : Phytotron, Sun Simulation and Climatic Chambers
Supported Since 2005 (about 1300 Sensors)
IBOE : Research Farm / Platform Scheyern
Supported Since 2010 (about 3500 Sensors)

LysiData Software Systems References
REFERENCE PROJECTS
BUNDESWEHR UNIVERSITY / TU MUNICH D-MUNICH
IfW/WWR : Climate and Soil Hydrology Station
Supported Since 2011 (about 80 Sensors) – Cooperation UGT
CVRV INSTITUTE SK-PIESTANY
Lysimeter and Weather Station
Supported Since 2013 (about 120 Sensors) – Cooperation UGT
CVRV INSTITUTE SK-MICHALOVCE
Lysimeter and Weather Station
2014 (about 800 Sensors) – Cooperation UGT

LysiData is ...
Person
Dirk Römermann, Munich • Born 1960 in Düsseldorf • Consulting und Software Engineering since 1992 • Working in Munich and Düsseldorf
Consulting und Software Development for Research Facilities
Development and Maintenance of Database and integrate Software Systems
COOPERATION with UGT since 2008 on different Software and Research Facility Projects
Activitiy Focus
LysiData is a Trademark of Dirk Römermann

SVADSS
Soil Vegetation Atmosphere Data Sensor Service
The best Online Data Management Service
PART 2

Activity Focus
Datamanagement Solution in environmental science • Online Allround Solution for small and medium measure- ment devices
No own Inhouse-IT-Infrastructur necessary
• Standard, Extended and Exclusive Data Management
packages available

Main Principle

Data Services
• Data Management Services • Automatic Data Acquisition
• Long Time Saving Data in SQL-Databases • Data Vaidation (automatic / manual) • Standard Statistik Routines
• mean value, sum, maximum, minimum, etc.
• Exclusive Data Services • Individual Charts und Data Export Interfaces • Individual Data Processing • Quality procedures and -verification

Sensor Services
• Sensor Management Services • Logging of Hardware-/Sensorstate and Events • Notification on Hardware events (E-Mail/SMS) • Exclusive Notifications on cumulated events from different sensors • Logbook and notification on service and maintainence •QM-Reports on sensors/equipment

Practical Unit
PART 3