uganda pharmaceutical sector baseline survey...
TRANSCRIPT

i
THE REPUBLIC OF UGANDA
UGANDA PHARMACEUTICAL SECTOR
BASELINE SURVEY
September 2002
MINISTRY OF HEALTH
WORLD HEALTH ORGANIZATION


UGANDA PHARMACEUTICAL SECTOR
BASELINE SURVEY
September 2002


i
Contents
CONTENTS................................................................................................................... i FOREWORD................................................................................................................ iii ACKNOWLEDGMENTS .................................................................................................. iv ABBREVIATIONS ......................................................................................................... vi EXECUTIVE SUMMARY ................................................................................................ vii 1. INTRODUCTION...................................................................................................... 1 a) Demographic characteristics ......................................................................................1 b) Health characteristics................................................................................................2 c) Health policy............................................................................................................2 d) Health system structure ............................................................................................2 e) The Pharmaceutical Sector.........................................................................................3
i) National Drug Policy ...........................................................................................3 ii) Drug supply system............................................................................................3 iii) Key pharmaceutical indicators..............................................................................3 iv) Pharmaceutical sector surveys .............................................................................4
2. STUDY DESIGN AND METHODOLOGY ...................................................................... 5 2.1 Objectives of the survey ..........................................................................................5 2.2 Methodology ..........................................................................................................5
a) Level I indicators ................................................................................................5 b) List of Level II indicators......................................................................................5 c) List of household survey indicators ........................................................................6 d) Training and Sampling.........................................................................................6 e) The survey.........................................................................................................6 f) Ethical Considerations .........................................................................................6
3. FINDINGS............................................................................................................... 7 Index of findings section ...............................................................................................7 3.1 Level I: Structures and processes of country pharmaceutical situation............................7 3.2 Level II: Core indicator results..................................................................................8
a) Summary of the Level II core indicator results ........................................................8 b) Accessibility to Drugs ..........................................................................................8 c) Stock-out duration in public health facilities and district warehouses......................... 10 d) % of prescribed drugs actually dispensed to patients in public health facilities ........... 11 e) Affordability of key drugs in public health facilities & private dispensing drug outlets .. 11 f) Prices of key drugs in public health facilities and private dispensing drug outlets........ 12 g) Quality of drugs................................................................................................ 14 h) Rational drug use ............................................................................................. 15
3.3 Household survey results ....................................................................................... 23 4. INTERPRETATION OF RESULTS............................................................................. 26 5. CONCLUSIONS AND RECOMMENDATIONS............................................................. 27 a) Conclusions: Positive aspects and areas for improvement identified............................... 27 b) Recommendations Summary.................................................................................... 29 ANNEXES .................................................................................................................. 31 Annex 1: Questionnaire on structures and processes of country pharmaceutical situation (Level I)...................................................................................................... 32 Annex 2: Results of Previous Pharmaceutical Sector Surveys............................................ 40 Annex 3: Adaptation of survey forms with country specific information for Uganda .............. 41 Annex 4: Survey Forms .............................................................................................. 43 Survey Form 1a: Central/District Warehouse: % Expired Drugs/Availability of Key Drugs ..... 44 Survey Form 2a: Central/District Warehouse: Stockout Duration....................................... 45 Survey Form 3a: Central/District Warehouse: Storage Checklist ....................................... 46 Survey Form 1b: Public Health Facility: % Expired Drugs/Availability of Key Drugs .............. 47 Survey Form 2b: Public Health Facility: Stockout Duration .............................................. 48 Survey Form 3b: Public Health Facility: Storage Checklist ................................................ 49 Survey Form 4a: Public Health Facility Pharmacy: Affordability of Key Drugs ...................... 50 Survey Form 4b: Private Pharmacy: Affordability of Key Drugs ......................................... 51 Survey Form 5: Private Pharmacy: % Expired Drugs ....................................................... 52 Survey Form 6: Public Health Facility: Rational Drug Use - Prescribing Indicator Form.......... 53
ii
Survey Form 7: Public Health Facility: Rational Drug Use - Patient Care Form ..................... 54 Survey Form 8: Public Health Facility: Standard Treatment Guidelines / EDL ...................... 55 Survey Form 9: Public Health Facility: Treatment of Diarrhoea, ARI, and Pneumonia............ 56 Survey Form 9 (cont.): Public Health Facility: Treatment of Other Tracer Diseases .............. 57 Survey Form 10: Household ........................................................................................ 58

iii
Foreword Access to health services, qualified healthcare staff and medicines are necessary components of any healthcare system. Of these 3 components, medicines are of special importance for various reasons: they save lives, improve health, promote trust and participation in health services and they are very costly. Communities, quite understandably, equate the quality of healthcare primarily with the availability of basic essential medicines. Acknowledging this fact, Uganda adopted a National Drug Policy (NDP) to contribute to the attainment of a good standard of health by the population, through ensuring the availability, accessibility and affordability at all times of essential drugs of appropriate quality, safety and efficacy, and by promoting their rational use. However, there has not been any systematic evaluation of the outcomes of the NDP since its adoption in 1993 and implementation to-date. Therefore the Ministry of Health, with financial and technical assistance from the World Health Organization and in collaboration with Health Action International, undertook this pharmaceutical sector baseline survey to monitor progress and identify any issues that need to be addressed in the pharmaceutical sector especially at this stage of initiating systematic implementation of the revised NDP. The results of this survey have provided us with key information that is being used to plan and implement evidence-based interventions to address the shortcomings identified during the survey that affect access, quality and rational use of essential medicines. This survey also provides a baseline for future periodic reviews that will monitor progress in the pharmaceutical sector to inform the Ministry of the necessary changes and priority areas that need support and focused attention to enable us realise the goals of the National Health policy in general and National Drug Policy in particular.
Prof. F.G. Omaswa Director General Health Services

iv
Acknowledgments This Pharmaceutical Sector Baseline survey was commissioned by the Ministry of Health and conducted with financial and technical assistance of the World Health Organisation, Department of Essential Drugs and Medicines Policy/Drug Action Programme and the WHO Country Office Uganda in collaboration with Health Action International - Africa. Special gratitude is extended to the Director General of Health Services, MOH – Prof. F.G. Omaswa and the Head of the Pharmaceutical Unit, MOH - Mr. Martin Oteba for their support and guidance to initiate and complete this survey. Similarly we are grateful to Dr. Helen Tata of EDM/DAP, Ms. Simona Chorliet and Mr. Martin Auton - WHO Consultants, Ms. Beryl Leach of HAI Africa, Dr. Josephine Namboze, Disease Control and Prevention Advisor and Mr. Joseph Serutoke, EDM Programme - WHO Uganda for their invaluable guidance and involvement during the preparations, commissioning and completion of the Survey. The support and technical guidance of Dr. Rufaro Chatora, DSD/AFRO and his EDM team of Dr. Jean Marie Trapsida, Dr. Moses Chisale and Dr. Abayneh Desta that facilitated the execution of this survey is gratefully acknowledged. Thanks also go to the staff of the MOH, UHSSP, NDA, NMS and PSU for their time and assistance in availing useful information relating to the objectives of the survey and the District teams and health workers in the districts of Bushenyi, Iganga, Kampala and Nakasongola who allowed the survey to be conducted in their facilities. The data collectors: Mr. Fred Mukasa, Mr. Fred Sebisubi, Mr. Joseph Mwoga, Mr. George Kibumba, Mr. Patrick Mubangizi, Mr. James Emokor, Mr. Sam Omara, Ms. Rossette Mutambi, Ms. Prima Kazora, Ms. Assumpta Byarugaba, Ms Hilda. A. Nsubuga and Mr. Sam Balyejjusa deserve special mention for it is their abilities in the field that made compilation and management of this data possible. We acknowledge with thanks the input of Mr. Apollo Muhairwe, WHO Temporary Consultant, who co-ordinated the Baseline Survey and drafted the initial report of the Survey and Dr. Moses Muwonge for the data entry and analysis. Special recognition is made of the invaluable assistance and input of Mr Chris Forshaw, DANIDA/UHSSP Pharmaceutical Advisor, Ministry of Health and National Drug Authority for proof reading and re-designing this report into its final form. This report has been edited by Joseph Serutoke and Martin Auton with the assistance of Martin Oteba, Beryl Leach, Patrick Mubangizi and Chris Forshaw. Last but not least we extend our gratitude to all those who have assisted us in one way or another to undertake this survey successfully.
Dr. Oladapo Walker WHO Representative, Uganda
Thanks are due to the World Health Organization for sponsoring a National Stakeholders workshop for dissemination of the findings and recommendations of the survey held on 8 December 2003 at the Grand Imperial Hotel, Kampala and to the following persons who participated in the workshop and provided valuable further inputs that led to the adoption and production of this final report: Dr Oladapo Walker, WHO Representative, Uganda Dr Jacinto Amandua, Commissioner Health Services – Clinical Services, Ministry of Health Mr Martin Oteba, Principal Pharmacist, Ministry of Health

v
Ms Beryl Leach, Coordinator, HAI-Africa Dr Gilles Forte, Technical Officer, EDM/DAP, WHO Geneva Mr Joseph Serutoke, National Programme Officer, EDM/WHO Uganda Ms Theresa Wagama, DNO, Bushenyi District Mr Apollo Muhairwe, Executive Secretary/Registrar, National Drug Authority Mr Senoga Mubandi, DHE, Kayunga District Mr James Tamale, Secretary, The Pharmaceutical Society of Uganda Ms Assumpta M Byarugaba, HEPS Uganda Mrs Neville Oteba, Registrar, Pharmacy Council, Ministry of Health Mr Patrick Mubangizi, Pharmacist, HEPS Uganda/HAI-Africa Ms Rosette Mutambi, Coordinator, HEPS Uganda Mr Steve Wilbur, Advisor, DELIVER Project, Ministry of Health Ms Prima Kazoora, Program Assistant, HEPS Uganda Ms Robina Kaitiritimba, National Coordinator, Uganda National Health Consumers Organization Mr Kees Ebskamp, General Manager, Joint Medical Stores Mr Sylvester Rugumambaju, C & D Officer, Joint Medical Stores Mr Chris Forshaw, DANIDA/UHSSP Pharmaceutical Advisor, Ministry of Health and NDA Mr Rishi Vadodaria, Managing Director, Rene Industries Ltd Ms JM Kajura Nakityo, DHE, Nakasongola District Dr Richard Odoi-Adome, Assoc. Prof., Dept. of Pharmacy, Makerere University Mr Allan Muwanga, Drug Regulatory & Assessment Officer, National Drug Authority Dr Erisa Owino, Head, Dept. of Pharmacy, Makerere University Dr Jasper Ogwal, Assoc. Prof., Dept. of Pharmacology, Makerere University/INRUD Uganda Mr Gabriel Kaddu, Ag. Chief Inspector of Drugs, National Drug Authority Mr Wilberforce Tibagendeka, Director General, Green World – Uganda Mr B Shem, Manager, Intercom (U) Ltd Mr Sam Omalla, District Inspector of Drugs, Tororo District Dr Maria Sentogo, Senior Medical Officer, Reproductive Health, Ministry of Health Mr Nazeem Mohamed, General Manager, Kampala Pharmaceutical Industries Mr E Buriituuza, Dep. Sec. Gen., Federation of Uganda Chambers of Commerce & Industries Mr George Kibumba, Pharmacist, Makerere-Johns Hopkins Universities Research Collaboration Mr Hanif Nazerali, DANIDA/UHSSP District Drug Management Programme Advisor, MOH Mr Sam Balyejjusa, Quality Assurance Officer, National Medical Stores Mr E Lakidi, Pharmacist, Lacor Hospital Dr Flavia Mpanga, Health Advisor, Irish AID/Embassy of Ireland, Uganda Mr James Isabirye, DHE, Iganga District Dr Margaret Mungherera, President, Uganda Medical Association

vi
Abbreviations
ADR Adverse Drug Reaction ARI/ARTI Acute Respiratory (Tract) Infection CAM Complementary/Alternative Medicine DfID Department for International Development,
Government of the United Kingdom DISH Delivery of Improved Services for Health [Project] DRC Danish Red Cross EDLU Essential Drug List of Uganda EDM Essential Drugs and Medicines Policy [Department, WHO Geneva] EML Essential Medicines List GDP Gross Domestic Product HAI Health Action International HC Health Centre UHSSP Uganda Health Sector Support Programme [DANIDA Project] INN International Non-proprietary Name JMS Joint Medical Stores MOH Ministry of Health NDA National Drug Authority NDP National Drug Policy NGO Non Governmental Organisation NMP National Medicines Policy NMS National Medical Stores NSTG National Standard Treatment Guidelines ORS Oral Rehydration Salts PSU Pharmaceutical Society of Uganda STG Standard Treatment Guidelines STI Sexually Transmitted Infection TM Traditional Medicine TRIPS Agreement on Trade Related Aspects of Intellectual Property Rights US$ United States Dollar UNEPI Uganda National Expanded Programme on Immunization UShs Uganda Shillings WHO World Health Organization

vii
Executive summary Monitoring, evaluating, and assessing the pharmaceutical situation in countries are important for determining if people have access to essential medicines that are safe, efficacious, and of good quality, and that are being used properly. The World Health Organization in collaboration with Health Action International – Africa supported the Ministry of Health, Uganda in carrying out a baseline survey assessing the pharmaceutical situation based on Levels I and II indicators as described in the Operational Package for Monitoring and Assessing the Pharmaceutical Situation in Countries. The assessment was carried out in four geographic and socio-economically representative districts with a study population of 20 randomly selected public health facilities, 20 public pharmacies, 20 private pharmacies/drug outlets, 5 central/district medicines warehouses, and 300 households. Using standard indicators, data were collected for the availability of key essential medicines, duration of stock-outs, rational drug use, household health care-seeking behaviour and access to prescribed medicines. The median percentage availability of key medicines was 75% in public health facilities, and 55% in district warehouses. The median stock out duration of the basket of key drugs in public health facilities and district warehouses was found to be 89.3 days (~3 months) and 182 days (~6 months) respectively. The median antibiotic and injection use in public health facilities was found to be 61.9% and 29.5% respectively. The majority of the households sought healthcare from public health services, and 28 percent of the people could not obtain prescribed medicines due to economic and availability factors. There was unacceptably high stock-out duration of key medicines and use of antibiotics and injections in public health facilities. This baseline survey provides key information that will be used to plan and implement interventions to address under-performing areas identified in the assessment, which affect access, quality and rational use of essential medicines. It also provides a baseline for periodic review of work in the pharmaceuticals area so that adjustments may be made according to needs and performance.

viii
1
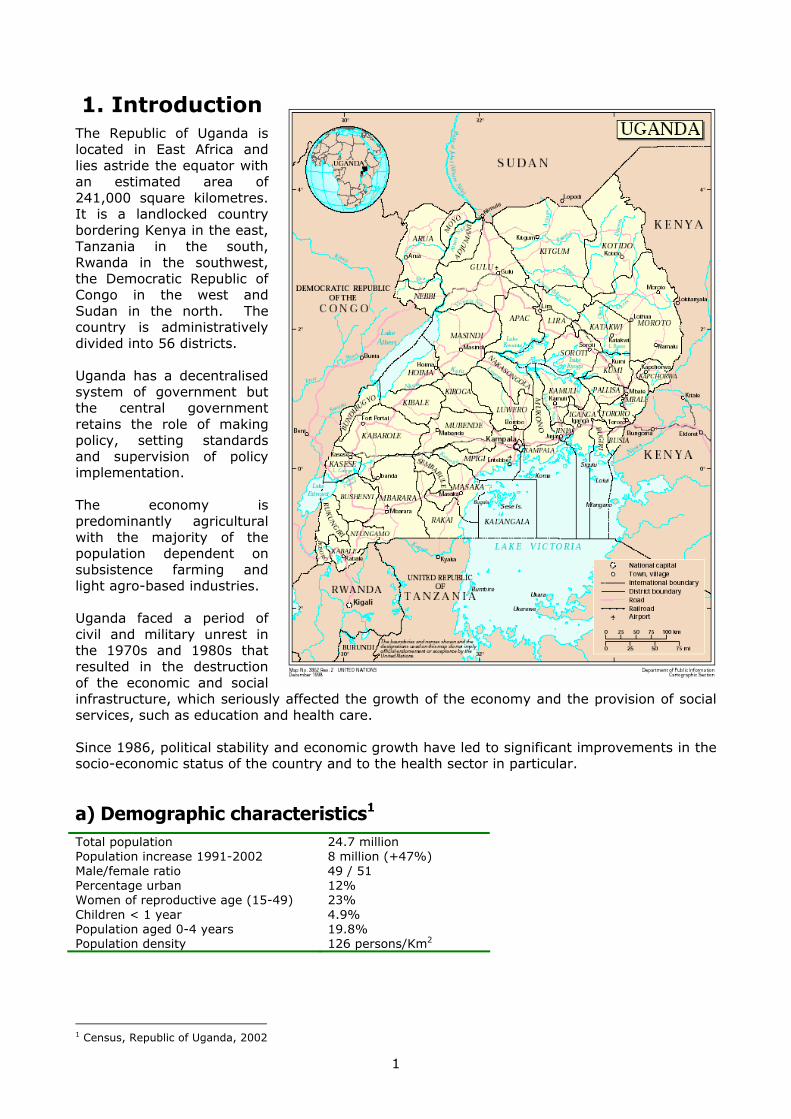
1. Introduction The Republic of Uganda is located in East Africa and lies astride the equator with an estimated area of 241,000 square kilometres. It is a landlocked country bordering Kenya in the east, Tanzania in the south, Rwanda in the southwest, the Democratic Republic of Congo in the west and Sudan in the north. The country is administratively divided into 56 districts. Uganda has a decentralised system of government but the central government retains the role of making policy, setting standards and supervision of policy implementation. The economy is predominantly agricultural with the majority of the population dependent on subsistence farming and light agro-based industries. Uganda faced a period of civil and military unrest in the 1970s and 1980s that resulted in the destruction of the economic and social infrastructure, which seriously affected the growth of the economy and the provision of social services, such as education and health care. Since 1986, political stability and economic growth have led to significant improvements in the socio-economic status of the country and to the health sector in particular.
a) Demographic characteristics1 Total population 24.7 million Population increase 1991-2002 8 million (+47%) Male/female ratio 49 / 51 Percentage urban 12% Women of reproductive age (15-49) 23% Children < 1 year 4.9% Population aged 0-4 years 19.8% Population density 126 persons/Km2
1 Census, Republic of Uganda, 2002

2
b) Health characteristics2 Life expectancy 43 years 2002 Infant mortality rate 88 per 1000 2000 Maternal mortality rate 504 per 100,000 2000 Total fertility rate 6.9 births per woman Population per doctor 18,700 Population per pharmacist 133,514 Population per nurse 3,065 nurses and midwifes combined Population per hospital bed 870 Health service physical accessibility 49% 1992/3 Per capita health expenditure UShs 23,000 (US$ 12.0) Target: UShs 59,000 (US$ 30.0) Per capita expenditure on drugs UShs 1,580 (US$ 0.8) Target: UShs 5,900 (US$ 3.0)
c) Health policy The National Health Policy (1999) and the Health Sector Strategic Plan (2000/01 - 2004/05) were formulated within the context and provisions of the Constitution of the Republic of Uganda 1995. The overall goal of the national health policy is to attain a good standard of health for all the people of Uganda in order to promote a healthy and productive life. To achieve this goal, the government plans to create a health care system in which all citizens have easy and equal access to appropriate and high-quality health care. Among the guiding principles of the health sector strategic plan is that primary health care shall remain the basic philosophy and strategy for national development and a minimum health care package will form the primary focus of service delivery.
d) Health system structure Uganda is divided into 56 districts and the health care system is aligned to the administrative structure described below:
Administrative structure Description Local Council Level
Corresponding Health Structure
Village I Health Centre I Parish II Health Centre II Sub county III Health Centre III County as sub-district or constituency IV Health Centre IV District V District/General hospital
There are 11 regional referral hospitals (which also act as District Hospitals in the areas where they are located) and 2 national referral hospitals (Mulago and Butabika). Mulago and Mbarara Hospitals also act as University Teaching Hospitals. Since 1972, the number of public, non-governmental and private health facilities has increased by 400 percent and the population has more than doubled. In spite of this, a 1993 inventory of health units found that geographical access to health care is limited to 49 percent of the population, i.e. population living within 5 kilometres (about one hour’s walking distance) of a health facility providing both curative and preventive health services (World Bank quoting Ministry of Health). Rural communities are particularly affected because health facilities are mostly located in towns and along main roads.
2 Statistical Abstract, Ministry of Health Uganda, April 2003

3
e) The Pharmaceutical Sector
i) National Drug Policy
Overall goal
The revised National Drug Policy (NDP) 2001 aims to contribute to the attainment of a good standard of health by the population of Uganda, through ensuring the availability, accessibility and affordability at all times of essential drugs of appropriate quality, safety and efficacy, and by promoting their rational use.
Main objectives
• To make essential drugs accessible to all those who need them by ensuring that they are affordable and always available in all parts of the country.
• To ensure that all drugs available to the public are of appropriate quality, safety, and efficacy.
• To promote the rational use of drugs actively and continuously and to provide objective, relevant and practical information to health workers, patients and the general public.
• To institute and sustain suitable drug financing mechanisms which will ensure the continuous availability of adequate quantities of the required essential drugs.
• To ensure the availability of sufficient suitably trained pharmaceutical and other relevant staff to enable effective implementation of NDP.
• To optimise use of available resources, knowledge and expertise in implementation of NDP through the establishment of an active partnership between the community, government bodies and private providers (profit and non-profit) involved in the pharmaceutical sector and through cooperation with regional and international agencies.
ii) Drug supply system The majority of the medicines and equipment for government health units are obtained from National Medical Stores (NMS), an autonomous government agency charged with the procurement, storage and distribution of essential drugs and supplies to the public sector. The main source of funding for drugs is Government subventions sent to the districts for primary health care activities. The missionary hospitals source their drugs and health supplies from Joint Medical Stores (JMS). Only when drugs and equipment are out of stock from NMS, can public health facilities source them from elsewhere including JMS. Currently there are 5 large-scale pharmaceutical manufacturers and 5 small-scale pharmaceutical manufacturers. There are 2939 public sector health facilities from which drugs may be dispensed, 215 private pharmacies and 2600 drug shops. Of the private pharmacies, nearly 80% are in the three major towns of Kampala, Jinja and Mbarara.
iii) Key pharmaceutical indicators The table below summarises key indicators for the pharmaceutical sector. Date of National Drug Policy 1993 Date of Essential Drug List 2001 Date of National Standard Treatment Guidelines 2003 Public sector medicines expenditure US$ 10 million (2002/3) Public sector per capita medicines expenditure US$ 1.2 (2002/3) Pharmaceutical sector market value US$ 70 million Number of registered pharmacists 185 (1: 133,514 people) Number of registered pharmacy technicians 400 Annex 1 contains a more detailed overview of the pharmaceutical sector through the completed questionnaire on the structures and processes of the pharmaceutical situation in Uganda (Level I indicators).

4
iv) Pharmaceutical sector surveys Annex 2 contains the results of several previous surveys carried out in the pharmaceutical sector between 1990 and 2000. Note: The terms “drugs” and “medicines” are used synonymously throughout the document.

5
2. Study Design and Methodology 2.1 Objectives of the survey The survey had the following overall objectives:
• To know if people have access to essential medicines • To know if they are getting medicines that are safe, efficacious and of good quality • To know if the medicines are being used properly • To collect baseline information on the pharmaceutical sector from available facility data
sets in order to obtain a clear picture of national and institutional problems and thereby identify priorities in the implementation of the revised NDP
2.2 Methodology The survey was conducted according to the WHO “Operational Package for Monitoring and Assessing the Pharmaceutical Situation in Countries –working draft” (version August 2002). The package contains survey tools for two levels of core indicators and a household survey tool: Level I - Structural and Process Indicators: were used to assess the existing structures and processes in the national pharmaceutical system. Level II - Outcome indicators: supported Level I indicators by providing specific data about the important pharmaceutical outcomes The household survey form complemented the level I and II indicators by examining issues on access and use of medicines in the community. Level I and II indicators are almost entirely focused on health structures and people visiting health facilities. This survey tool ensures data are collected about treatment-seeking behaviour and medicines consumption. The list of indicators is presented below and a description of the purpose of each indicator, together with instructions on how to collect, record and process the data can be found within the operational package.
a) Level I indicators See Annex 1 for the questionnaire (completely filled)
b) List of Level II indicators See Annex 4 for survey forms (Survey forms 1 – 9) Access Availability of key medicines in public health facilities and district warehouses supplying the public sector Stock out duration in public health facilities and district warehouses supplying the public sector % of prescribed medicines dispensed or administered to patients at public health facility dispensaries Affordability of key medicines (treating children with pneumonia without hospitalization) at public health facility dispensaries and private drug outlets Quality % of expired medicines in public health facility dispensaries, private drug outlets and district warehouses supplying the public sector Adequacy of storage in public health facility dispensaries and warehouses supplying the public sector Rational use of drugs % of drugs adequately labelled at public health facility dispensaries % of patients with adequate knowledge on how to take their medicines correctly at public health facility dispensaries Average number of drugs per prescription at public health facility dispensaries and public health facilities % of patients prescribed antibiotics at public health facilities % of patients prescribed injections at public health facilities % of prescribed drugs on the essential drugs list at public health facilities Availability of standard treatment guidelines at public health facilities Availability of essential drugs list at public health facilities Prescribing according to STG

6
c) List of household survey indicators Also see Annex 4 for survey form (Survey form 10)
Symptoms and source of consultation Source of first consultation Prescribing and obtaining the prescribed medicines Proportion of prescribed medicines obtained by patients Primary reasons for not obtaining all prescribed medicines Sources of obtaining medicines Taking the prescribed medicines Completion of course of prescribed medicines Family income/expenditure
d) Training and Sampling Adaptation of the survey forms for Uganda, training of data collectors, field-testing and district and facility sampling were carried out at the training workshop held 6-9 August 2002. Annexes 3 and 4 contain a summary of adaptations, the districts and facilities sampled and the adapted survey forms. The country was divided into 4 regions. The capital city and one randomly selected district from each region were identified. Districts where security risks existed were excluded from the sampling due to safety concerns. Within each district, the following facilities and households were selected: • 4 public health facilities plus the district hospital (in this survey public health facility refers
to either government or private-not-for-profit/NGO health facility) • 5 private pharmacies/drug outlets close to the selected public health facility • 1 central/district medicines warehouse/storage facility • 15 households within 5km of each selected public health facility.
e) The survey The survey was carried out from 2 through 6 September 2002. Patients were interviewed and information from patient records in health facilities was collected retrospectively as described in the operational package. Further information was gathered from facility records, observation and interviews of health facility staff, private pharmacies/drug outlet staff and household members.
f) Ethical Considerations The study was not expected to raise any significant ethical issues because the methods of study are regularly employed in similar studies in Uganda. The issues studied fall within the regular activities and mandate of the Ministry of Health (MOH), which commissioned the study. However, permission was sought and obtained from district authorities and private drug outlets before the actual survey could be conducted. Introductory letters by the Director General of Health Services MOH were given to data collectors to present for this purpose. Confidentiality was ensured for all information collected and no reference is made to specific patients or study units.

7
3. Findings Note on the use of medians and averages
Median and average values are presented in the summary table below. However, as averages can be skewed by outlying values, median values are used unless otherwise stated throughout the presentation of results and discussion as a better representation of the midpoint value.
Exchange rate
The exchange rate used is that of the time of the survey (August/September 2002): 1US$ = UShs1800.
Comparisons with previous surveys and benchmarks for indicators
Annex 2 contains a summary of results from previous pharmaceutical surveys. Comparisons within the findings section are limited to those that show a marked difference, as it is not certain that the methodologies were the same and hence the results are not fully comparable.
Index of findings section Page
Level I: Structures and processes of country pharmaceutical situation Annex 1: p32 Level II: Core indicators p8 Household survey p23
3.1 Level I: Structures and processes of country pharmaceutical situation The questionnaire on structures and processes of country pharmaceutical situation (Level I indicators) completed in July 2003, by the Ministry of Health and National Drug Authority, may be found in Annex 1: Page 32
8
3.2 Level II: Core indicator results
a) Summary of the Level II core indicator results
Public sector facilities
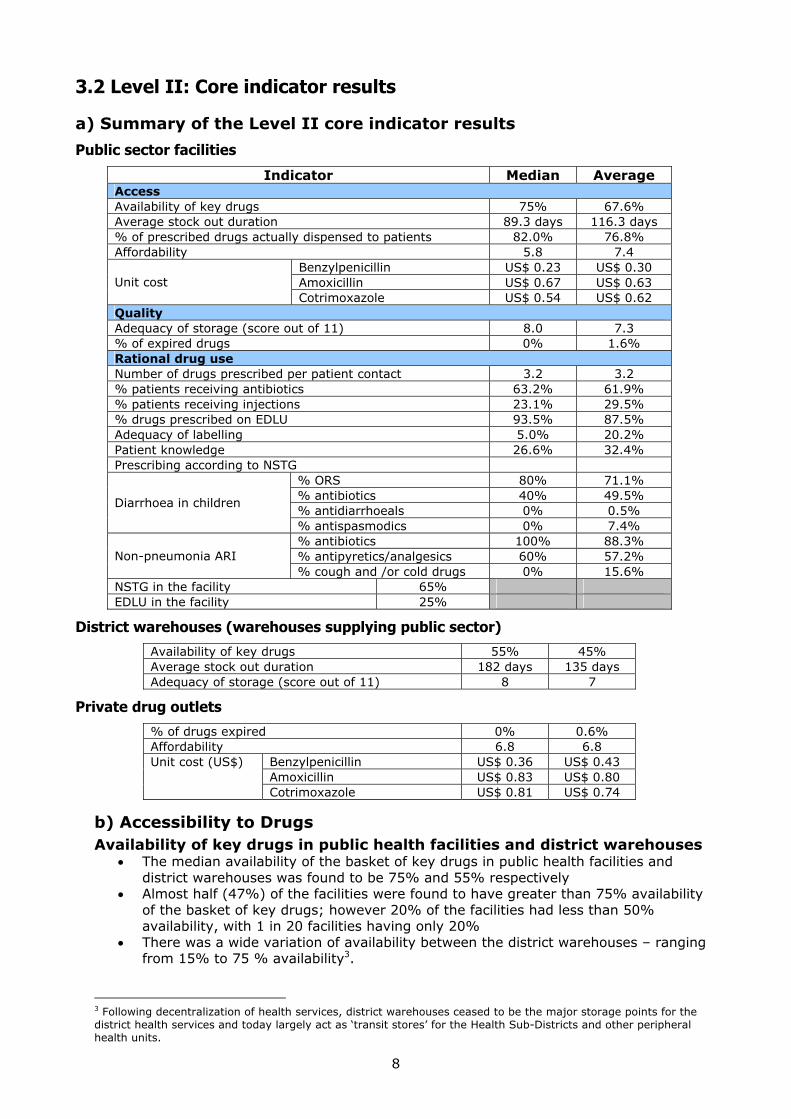
Indicator Median Average Access Availability of key drugs 75% 67.6% Average stock out duration 89.3 days 116.3 days % of prescribed drugs actually dispensed to patients 82.0% 76.8% Affordability 5.8 7.4
Benzylpenicillin US$ 0.23 US$ 0.30 Amoxicillin US$ 0.67 US$ 0.63
Unit cost Cotrimoxazole US$ 0.54 US$ 0.62 Quality Adequacy of storage (score out of 11) 8.0 7.3 % of expired drugs 0% 1.6% Rational drug use Number of drugs prescribed per patient contact 3.2 3.2 % patients receiving antibiotics 63.2% 61.9% % patients receiving injections 23.1% 29.5% % drugs prescribed on EDLU 93.5% 87.5% Adequacy of labelling 5.0% 20.2% Patient knowledge 26.6% 32.4% Prescribing according to NSTG
% ORS 80% 71.1% % antibiotics 40% 49.5% % antidiarrhoeals 0% 0.5%
Diarrhoea in children
% antispasmodics 0% 7.4% % antibiotics 100% 88.3% % antipyretics/analgesics 60% 57.2% Non-pneumonia ARI % cough and /or cold drugs 0% 15.6%
NSTG in the facility 65% EDLU in the facility 25%
District warehouses (warehouses supplying public sector)
Availability of key drugs 55% 45% Average stock out duration 182 days 135 days Adequacy of storage (score out of 11) 8 7
Private drug outlets
% of drugs expired 0% 0.6% Affordability 6.8 6.8
Benzylpenicillin US$ 0.36 US$ 0.43 Amoxicillin US$ 0.83 US$ 0.80
Unit cost (US$)
Cotrimoxazole US$ 0.81 US$ 0.74
b) Accessibility to Drugs Availability of key drugs in public health facilities and district warehouses
• The median availability of the basket of key drugs in public health facilities and district warehouses was found to be 75% and 55% respectively
• Almost half (47%) of the facilities were found to have greater than 75% availability of the basket of key drugs; however 20% of the facilities had less than 50% availability, with 1 in 20 facilities having only 20%
• There was a wide variation of availability between the district warehouses – ranging from 15% to 75 % availability3.
3 Following decentralization of health services, district warehouses ceased to be the major storage points for the district health services and today largely act as ‘transit stores’ for the Health Sub-Districts and other peripheral health units.

9
Availability of key drugs in public health facilities
5%
16%
32%
47%
0%
20%
40%
60%
80%
100%
<25 25-50 51-75 >75
% availability in public facilities
% fa
cilit
ies
median value = 75%
Availability of key drugs at district warehouses
55
25
75
15
55 55
0
20
40
60
80
100
A B C D E mediandistrict warehouse
% a
vaila
bilit
y
Recommendation Develop and implement interventions to address the poor availability of drugs in public health facilities

10
c) Stock-out duration in public health facilities and district warehouses
• The median stock-out duration of the basket of key drugs in public health facilities and district warehouses was found to be 89.3 days (~3 months) and 182 days (~6 months) respectively
• The average stock-out duration in district warehouses was twice that for facilities • In the health facilities, just over half (53%) of the facilities were found to have a
stock-out duration of less than 3 months; however almost half (47%) of the facilities were found to have a stock-out duration of more than 3 months
Stock-out duration in public health facilities
7%
47%
27%20%
0%
20%
40%
60%
80%
100%
<1 month 1-3 months 3-6 months > 6 months
% fa
cilit
ies
median value = 89.3 days (~3 months)
Recommendation Identify and develop interventions to address the very long stock-out durations found at most public health facilities
Availability and stock-out duration in public health facilities and district warehouses
75
55
89
182
availabilty public healthfacilities (%)
availability districtwarehouses (%)
stock-out duration publichealth facilities (days)
stock-out duration districtwarehouses (days)

11
d) Percentage of prescribed drugs actually dispensed to patients in public health facilities
• The median percentage of drugs actually dispensed in public health facilities was 82%
• 1 in 3 (35%) of the facilities was found to be dispensing over 95% of the drugs prescribed
• Just over half of the facilities was dispensing more than 75% of the drugs prescribed • However, 1 in 10 of the facilities was dispensing less than 50% of the drugs
prescribed
% of drugs dispensed in public health facilities
0%
12%
35%
18%
35%
0%
20%
40%
60%
80%
100%
<25 26-50 51-75 76-95 >95
% drugs actually dispensed
% fa
cilit
ies median value = 82%
Recommendation Identify and develop interventions to ensure that all the prescribed medicines are dispensed to patients in public health facilities
e) Affordability of key drugs in public health facilities and private dispensing drug outlets Lowest weekly (5 days/40 hours) Government Salary ≡ US$ 10.4 Based on this salary the number of hours of work needed to pay for a course of treatment for a child with pneumonia without hospitalisation is on average 34% more in a private drug outlet than a public health facility4
Number of hours of work needed for a course of treatment5 (based on lowest paid Government worker)
Treatment regimen for children with pneumonia based on:
Public health facility Private drug outlet Benzylpenicillin 3.5 4.6 Amoxicillin 2.6 3.2 Cotrimoxazole 2.1 3.1 Recommendation Develop and implement strategies to ensure equitable access to essential medicines through efficient and sustainable financing mechanisms. Such financing mechanisms should be affordable and ensure continuous access to essential medicines especially for the poor, disadvantaged and medically needy groups of the population
4 Refer to footnote No. 6 for explanation of public health facility drug costs (p12) 5 See Annex 3 for details of treatment regimens

12
f) Prices of key drugs in public health facilities and private dispensing drug outlets • The price that a patient has to pay for key drugs was found to be 43% more in a private
dispensing drug outlet than that in a public health facility6 • There is a large price variation between private dispensing drug outlets for the same
items: 10% were selling a 600mg vial of benzylpenicillin for less than US$ 0.15 and 28% of the outlets were selling the same item for more than US$ 0.46 (i.e. 3 times the public sector price)
Median price US$
Drug Dosage
form and strength
Unit size Public health
facility Private drug
outlet
% difference between prices
Benzylpenicillin Injection 600mg (1 MU)
1 0.23 0.36 57%
Amoxicillin Suspension 125mg/5ml
100ml 0.67 0.83 24%
Cotrimoxazole (sulphamethoxazole + trimethoprim)
Suspension 200mg + 40mg/5ml
100ml 0.54 0.81 50%
Average 43%
Comparison of median prices of the 3 indicator drugs
in public health facilities and private dispensing drug outlets
0
0.2
0.4
0.6
0.8
1
benzylpenicillin amoxicillin cotrimoxazole
US$
public health facility private drug outlet
6 The public health facility drug price is the cost of the drug from NMS or JMS Price catalogue and not the cost paid by the patient as drugs are dispensed free of charge in public health facilities. This cost refers to what it costs the public health facility to provide the drug to patients.
+57%
+24% +50%

13
Price of benzylpenicillin in private dispensing drug outlets
11%
28% 28% 28%
0%0%
20%
40%
60%
80%
100%
0.15 0.15-0.30 0.31-0.45 0.46-1 >1
US$ per 600mg vial of benzylpenicillin
% o
utle
ts
median value = US$ 0.36
Price of amoxicillin in private dispensing drug outlets
0%
21%
71%
7%
0%
20%
40%
60%
80%
100%
0.5 0.5-0.75 0.76-1 >1
US$ per 100mL amoxicillin syrup
% o
utle
ts
median value = US$ 0.67
Recommendation Design, establish and maintain a system for the regular monitoring and effective dissemination of the cost of essential drugs to both suppliers and consumers to foster price awareness and ensure the availability of essential drugs to the community at the minimum possible prices
14
g) Quality of drugs
Storage conditions in public health facilities and district warehouses
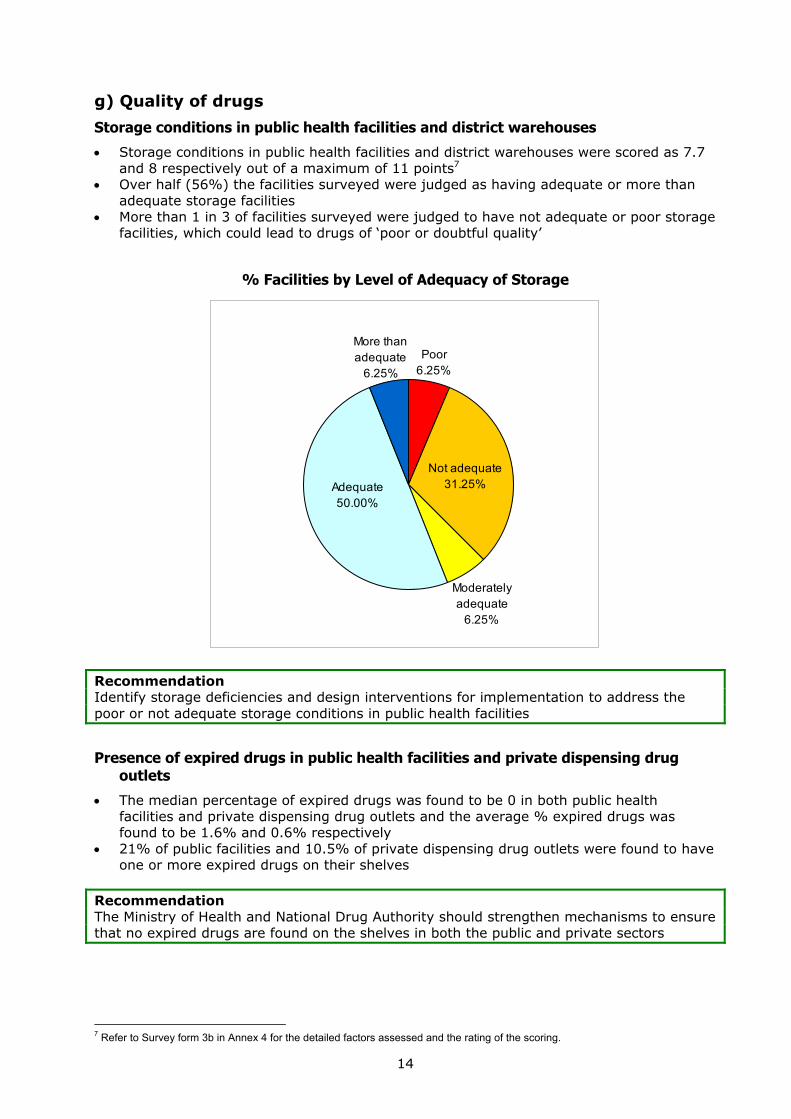
• Storage conditions in public health facilities and district warehouses were scored as 7.7 and 8 respectively out of a maximum of 11 points7
• Over half (56%) the facilities surveyed were judged as having adequate or more than adequate storage facilities
• More than 1 in 3 of facilities surveyed were judged to have not adequate or poor storage facilities, which could lead to drugs of ‘poor or doubtful quality’
% Facilities by Level of Adequacy of Storage
Moderately adequate
6.25%
Poor6.25%
More than adequate
6.25%
Adequate50.00%
Not adequate31.25%
Recommendation Identify storage deficiencies and design interventions for implementation to address the poor or not adequate storage conditions in public health facilities
Presence of expired drugs in public health facilities and private dispensing drug outlets
• The median percentage of expired drugs was found to be 0 in both public health facilities and private dispensing drug outlets and the average % expired drugs was found to be 1.6% and 0.6% respectively
• 21% of public facilities and 10.5% of private dispensing drug outlets were found to have one or more expired drugs on their shelves
Recommendation The Ministry of Health and National Drug Authority should strengthen mechanisms to ensure that no expired drugs are found on the shelves in both the public and private sectors
7 Refer to Survey form 3b in Annex 4 for the detailed factors assessed and the rating of the scoring.

15
h) Rational drug use
i) Number of drugs prescribed per patient contact at public health facilities
• The average number of drugs prescribed per patient at public health facilities was found to be 3.2 (i.e. each patient received 3 or 4 drugs)
• Almost 3 out of 4 facilities prescribed an average of more than 3 drugs • 12% of facilities were prescribing an average of over 4 drugs per patient • 29% of facilities were prescribing less than 3 drugs per patient • In comparison with survey findings over the period 1990-2000 there has been a notable
increase in the average number of drugs prescribed per patient
Number of drugs prescribed per patient in public health facilities
6%
22%
61%
11%
0%
20%
40%
60%
80%
100%
1-2 2-3 3-4 >4Number of drugs prescribed
% fa
cilit
ies
median value = 3.2 drugs
Results from previous similar surveys 8
Year Average number of drugs per prescription (average)
1990 1.9 1993 2.2 1997 2.0 2000 2.9
Recommendation Identify and develop interventions for implementation to address the significant increase in the number of drugs prescribed per patient contact
8 See Annex 2 for more detail

16
ii) Percentage of patients receiving an antibiotic at public health facilities
• The median percentage of patients receiving one or more antibiotics at public health facilities was 63.2%
• In 6 out of 10 facilities over 60% patients received an antibiotic • In 25% of facilities, over 71% of patients received an antibiotic • In another 25% of facilities, less than 50% of patients received an antibiotic • There is an approximately 20% increase in the prescribing of antibiotics since 1990 –
this might be expected considering the increased proportion of patients presenting with opportunistic infections associated with HIV/AIDS over the period 1990-2002.
Percentage of patients receiving an antibiotic in public health facilities
25%
15%
35%
25%
0%0%
20%
40%
60%
80%
100%
<50 51-60 61-70 71-80 >81% patients prescribed an antibioitic
% fa
cilit
ies
median value = 63.2%
Results from previous similar surveys 9
Year Average % patients prescribed an antibiotic
1990 56.0% 1993 52.9% 1997 41.5% 2000 56.6%
Recommendation Identify and develop interventions for implementation to address the significant increase in the number of antibiotics prescribed per patient contact
9 See Annex 2 for more detail

17
iii) Percentage of patients receiving an injection at public health facilities
• The median percentage of patients receiving one or more injections at public health facilities was found to be 23.1%
• In 15% of the facilities more than half of the patients received an injection • There has been a notable decrease of approximately 50% points in the prescribing of
injections from similar surveys over the period 1990 - 2000
Percentage of patients receiving an injection in public health facilities
5%
40%
30%
10%5%
0%
10%
0%
20%
40%
60%
80%
100%
0 1-20 21-40 41-50 51-60 61-70 >70% patients prescribed an injection
% fa
cilit
ies
median value = 23.1%
Results from previous similar surveys 10
Year Average % patients prescribed an injection
1990 48% 1993 36% 1997 51% 2000 32%
Recommendation Identify, develop and continue implementing interventions to further decrease the number of patients receiving injections
10 See Annex 2 for more detail

18
iv) Percentage of prescribed drugs on EDLU in public health facilities
• The median percentage of drugs prescribed that were on the Essential Drugs List of Uganda (EDLU) in public health facilities was 93.5%, which is similar to a previous survey in 1993 11 where an average of 97.5% of prescribing was found to be according to the EDLU
• Over 80% of prescribing at 3 out of 4 facilities was found to be according to the EDLU
Percentage of prescribed drugs on the EDLU in public health facilities
5%0%
10% 10% 10%
65%
0%
20%
40%
60%
80%
100%
<50 51-60 61-70 71-80 81-90 91-100
% prescribed from EDLU
% fa
cilit
ies
median value = 93.5%
v) Adequacy of labelling at public health facilities
• The median adequacy of labelling at public health facilities was 5% i.e. only 1 in 20 labels were found to be adequate
• This is a marked decrease since a similar survey in 199312 where an average 36.5% of labels were found to be adequately labelled
• In just under half of the facilities none of the labelling was found to be adequate • Only 1 in 8 facilities were found to have adequate labels in 75% of cases
Adequacy of labelling in public health facilities
82%
18%
0%
20%
40%
60%
80%
100%
< 50% of labels > 50% of labelsAdequacy of labelling
% fa
cilit
ies
47% of facilities =
zero
Recommendation Develop, disseminate and enforce clear guidelines and training on the importance of labelling for dispensed medicines. This should include consumer-targeted and community-based information, education and communication campaigns
11 See Annex 2 for more detail 12 See Annex 2 for more detail

19
vi) Adequacy of patient knowledge of how to take medicines at public health facilities
• The median adequacy of patient knowledge at public health facilities was 26.6% - in similar surveys carried out in 1993 and 2000 13 28.7% patients knew how to take their medicines
• This means that almost 3 out of 4 patients did not know how to take their medicines • In 71% facilities less than half the patients understood how to take their medication • In almost 1 in 5 facilities none of the patients knew how to take their medicines
Adequacy of patient knowledge of how to take medicines in public health facilities
71%
29%
0%
20%
40%
60%
80%
100%
< 50% of patients > 50% of patients
adequacy of patient knowledge
% fa
cilit
ies
18% of facilities = zero adequacy
Adequacy of labelling and patient knowledge
5
27
0
10
20
30
40
adequacy of labelling adequacy of patient knowledge
med
ian
%
Recommendation Develop, disseminate and enforce clear guidelines and training on the importance of ensuring that patients know how to take their medicines correctly. These initiatives should include consumer-targeted and community-based information, education and communication campaigns.
13 See Annex 2 for more detail

20
vii) Prescribing according to STGs at public health facilities
Diarrhoea
• The median percentages of child patients with diarrhoea at public health facilities that were prescribed ORS was 80% - this compares with results from similar surveys in 1990 and 1993 of 54.4% and 82.5% respectively
• The median percentages of child patients with diarrhoea at public health facilities prescribed an antibiotic was 40% - this compares with results from similar surveys in 1990 and 1993 of 64.3% and 13.2% respectively
• 25% of public health facilities prescribed antispasmodics • 10% of facilities prescribed antidiarrhoeals
Prescribing by group of drugs in children with diarrhoea
80
40
0 00
20
40
60
80
100
ORS antibiotic antidiarrhoeal antispasmodicPrescribing in children with diarrhoea
med
ian
% p
resc
ribed
% children prescribed ORS for diarrhoea
17%
28%
33%
22%
0%
10%
20%
30%
40%
<50 50-75 76-99 100% prescribing of ORS in children with diarrhoea
% fa
cilit
ies
median value = 80%
% children prescribed an antibiotic for diarrhoea
5%
16%
47%
11%
21%
0%
10%
20%
30%
40%
50%
60%
0 0-25 26-50 51-75 >75% prescribing of antibiotics in children with diarrhoea
% fa
cilit
ies
median value = 40%

21
Acute respiratory tract infection
• The median percentage of patients prescribed an antibiotic for ARI was 100% • In 56% of facilities, all patients were prescribed an antibiotic for ARI, only in 11% of
facilities were less than half the patients prescribed an antibiotic • 44% of facilities were prescribing cough/cold preparations to some or all of their
patients with ARI
Prescribing in ARI
100
60
00
20
40
60
80
100
antibiotic antipyretic/analgesic cough/cold preparation
Prescribing in ARI
med
ian
% p
resc
ribed
% patients prescribed an antibiotic for non-pneumonia ARI
11%6%
28%
56%
0%
10%
20%
30%
40%
50%
60%
70%
<50 51-75 76-99 100
% prescribing of antibiotics in ARI
% fa
cilit
ies median value = 100%

22
% patients prescribed a cough/cold preparation for non-pneumonia ARI
56%
28%
6% 6% 6%
0%
10%
20%
30%
40%
50%
60%
70%
0 <25 26-50 51-99 100
% prescribing of cough/cold preparations in ARI
% facilities
median value = 0%
Recommendations Investigate and develop interventions for the treatment of diarrhoea in children <5 years: - Why are 40% of children receiving antibiotics? - Why are 20% of children not receiving ORS? - Why are 25% of facilities prescribing antispasmodics? - Why are 10% of facilities prescribing antidiarrhoeals? Investigate and develop interventions to address the very poor adherence to the standard treatment guideline for ARI
viii) Availability of STGs and EDLU at public health facilities
• National Standard Treatment Guidelines were found in 65% of the facilities • Essential Drugs List of Uganda (EDLU) was found in 25% of the facilities - in a similar
survey14 the EDLU was found in 80.3% of the facilities surveyed in 1993 • However the median percentage drugs prescribed that were on the Essential Drugs List
of Uganda (EDLU) was found to be 93.5% (previously reported indicator) Recommendation The Ministry of Health should ensure that the Uganda Clinical Guidelines (the replacement for the old National Standard Treatment Guidelines) and the EDLU are disseminated and distributed to all health facilities and that health staff are trained in their correct use.
14 See Annex 2 for more detail

23
3.3 Household survey results a) Characteristics of survey population
Sex of Survey Populationmale40%
female60%
Age distribution of survey population
6-1516%
>557% 1-5
33%
<1 7%
16-5437%
b) Symptoms and source of first consultation
Common disease symptoms reported
• Fever, cough and diarrhoea accounted for 98% of the symptoms reported
Reported symptomsother2%
fever52% cough
31%
diarrhoea15%
Source of first consultation
• 64% consulted a clinic or hospital in the public or private sectors • 7% consulted a pharmacy or drug seller • 5% consulted a traditional healer • 13% self-medicated or used medicines remaining after another illness
Type of first consultation
consulted drug seller, 7%
used medicine left from another illness, 5%
consulted traditional healer, 5%
consulted pharmacist, 2%
sought advice form friend/neighbour/family, 1%
bought medicine without consultation, 11%
did nothing, 9%private clinic/hospital, 17%
public clinic/hospital, 43%

24
c) Prescribing and obtaining the prescribed medicines
• 91% of the consultations resulted in medicines being prescribed • Of the medicines prescribed, the following proportions were obtained:
All of the medicines dispensed 68.7% Some of the medicines dispensed 27.7% None of the medicines dispensed 3.6%
Primary reasons for not obtaining all of the prescribed medicines: • In 87.2% of cases, availability and price were stated as the primary factors • Of these 45.7% related to availability in either the public or private sectors and • 41.5% related to price and/or availability of money
Primary reason for not obtaining all of the
prescribed medicines
public pharmacy did not have all,
43.6%
did not believe were needed, 2.1%
started to feel better, 5.3%
not enough money/unable to borrow, 26.6%
price was too high, 14.9%
other, 5.4%
private pharmacy did not have all,
2.1%
Sources of medicines obtained: • 2 out of 3 obtained their medicines from a public or private health centre/hospital • 1 in 10 obtained their medicines from a pharmacy and another 1 in 10 obtained their
medicines from a retailer other than a pharmacy • 4% obtained their medicines from a traditional healer
Sources of medicines obtained
Public health centre/hospital,
45.9%
Medicines already owned, 1.0%
Friend/neighbour/family, 0.3%
Traditional healer, 4.0%
Other, 6.6%
Pharmacy, 10.2%
Local store/marketplace,
11.2%Private health
center/hospital, 20.8%

25
d) Taking prescribed medicines
• 3 in every 10 patients did not take the full course of prescribed medicine • Almost 1 in 20 took none of the medicines that were prescribed
All was taken 70.3% Some was taken 25.1% None was taken 4.6%
e) Estimated family weekly income/ total weekly household expenses15
Average income/expenses per week ≡ US$ 9.77 Findings from 2002/3 household surveys16 Average size of household 5 Average monthly consumption expenditure per household (national) Rural Urban
UShs 139,300 (US$ 77) UShs 113,300 UShs 266,100
Share of monthly household expenditure on health (national average) Rural Urban
4% 5% 3%
From the 2002/3 Uganda National household surveys, households in the rural areas, which are generally poorer than the urban households, spend more on health. This provides one way of viewing equity in access and utilisation of health services by examining the financial burden seeking healthcare places on households of different income levels. Recommendations Develop and implement strategies that ensure equitable access, affordability and sustainable financing for health services in general and access to essential medicines in particular. Design and implement consumer-targeted and community-based information, education and communication campaigns to improve rational use of medicines in the community.
15 Household expenditures for a 7-day recall were collected from the surveyed household and equated to the family weekly income 16 Uganda National Household Survey 2002/2003, Uganda Bureau of Statistics, Nov. 2003
26
4. INTERPRETATION OF RESULTS In the surveyed public health facilities, 75% of the key drugs were available but with a high stock-out duration of 3 months. The availability of essential drugs, especially at the health centre level where the majority of people seek healthcare services and equate the quality of healthcare primarily with the availability of basic essential drugs, should be a cause of concern and the Ministry of Health should implement corrective strategies and measures to improve the availability of essential drugs. On a positive note, the survey found that more than half (56%) of the facilities had adequate or more than adequate storage facilities for drugs. The presence of expired drugs both in the public and private sectors was minimal though existing mechanisms should be strengthened and enforced to ensure that there are no expired drugs on the shelves as they can mistakenly be dispensed to patients. There was unacceptably high use of antibiotics and injections (63.2% and 23.1% respectively) and unless prompt measures are taken to improve the prescribing habits and the use of these types of drugs, there is little doubt that Uganda will face serious problems of increasing resistance to currently cost-effective antibiotics and increased costs and risk to the patient from the overuse of injections. To correct this situation the Ministry of Health should support the establishment of district drug and therapeutic committees to coordinate monitoring of adherence to recommended treatment protocols. The survey also looked at patient knowledge on taking their medicines and found that 3 out of 4 patients did not know how to take their medicines. Unless urgent and effective measures are taken to improve this situation, the gains made in improving the availability of essential drugs could be lost through widespread inappropriate use of dispensed medicines and failure to achieve the expected treatment outcomes. Indicator-based surveys are cost-effective tools that measure complex systems in a relatively short time and give a snapshot of an overall trend in the sector. Other studies and data, specifically targeting the role and performance of the private sector, are needed to get an overall and complete picture of the situation in the pharmaceutical sector. This factor should be taken into consideration in interpreting the results of this survey.

27
5. CONCLUSIONS and RECOMMENDATIONS a) Conclusions: Positive aspects and areas for improvement identified
Indicator Positive aspects
emanating from the survey Areas for improvement
apparent from the survey
Accessibility to Drugs Availability of key drugs Almost half the facilities had >75% availability 20% of the facilities had <50% availability Stock-out duration Stock-out duration in public health facilities and district
warehouses was found to be 3 and 6 months respectively 47% of facilities were found to have a stock-out duration of >3 months
% prescribed drugs actually dispensed 1 in 3 facilities were found to be dispensing >95% of the drugs prescribed and just over half of the facilities dispensing >75%
1 in 10 facilities were dispensing <50% of prescribed drugs
Affordability
Price of key drugs There is a large price variation between private dispensing drug outlets for the same items: 10% were selling a 1g vial of benzylpenicillin for <US$ 0.15 and 28% of the outlets were selling the same item for >US$ 0.46 (i.e. 300% of the public sector price)
Quality of drugs Adequacy of storage in public health facilities and district warehouses
Over half (56%) the facilities were judged as having adequate or more than adequate storage facilities
Over 1 in 3 of the facilities surveyed were judged to have not adequate or poor storage facilities which could lead to having drugs of “poor or doubtful quality”
Presence of expired drugs 21% of public facilities and 10.5% of private dispensing drug outlets were found to have one or more expired drugs on their shelves.
Rational drug use Number of drugs prescribed per patient
29% of facilities prescribed an average of <3 drugs/patient
12% of facilities were prescribing an average of >4 drugs per patient There has been a significant average increase of over 1 drug prescribed/patient compared with similar survey findings over the period 1990-2000
% patients receiving an antibiotic 25% of facilities prescribed an antibiotic to <50% of patients
25% of facilities prescribed an antibiotic to >71% of patients

28
Indicator Positive aspects
emanating from the survey Areas for improvement
apparent from the survey % patients receiving an injection There has been a significant decrease of
approximately 50% in prescribing of injections compared with similar surveys over the period 1990-2000
In 15% of facilities >half of patients received an injection
Prescribing according to the Essential Drugs List of Uganda (EDLU)
Percentage drugs prescribed that were on the EDLU was found to be 93.5%
Adequacy of labelling Only 1 in 20 labels were found to be adequate In just under half of the facilities none of the labelling was found to be adequate
Adequacy of patient knowledge 3 out of 4 patients did not know how to take their medicines In almost 1 in 5 facilities none of the patients knew how to take their medicines
Prescribing according to STG 80% of children with diarrhoea were prescribed ORS
40% of children with diarrhoea were prescribed an antibiotic 25% of facilities prescribed antispasmodics and 10% prescribed antidiarrhoeals for children with diarrhoea In 56% of facilities all patients were prescribed an antibiotic for ARI 44% of facilities prescribed cough/cold preparations to some or all of their patients with ARI
Availability of NSTGs and EDLU National Standard Treatment Guidelines were found in 65% of the facilities
The Essential Drugs List of Uganda (EDLU) was found in only 25% of the facilities

29
b) Recommendations Summary Access to drugs • Develop and implement interventions to address the poor availability of drugs in public health facilities
• Identify and develop interventions to address the very long stock-out durations at most public health facilities • Identify and develop interventions to ensure that all the prescribed medicines are dispensed to patients in public
health facilities • Develop and implement strategies to ensure equitable access to essential medicines through efficient and
sustainable financing mechanisms. Such financing mechanisms should be affordable and ensure continuous access to essential medicines especially for the poor, disadvantaged and medically needy groups of the population
• Design, establish and maintain a system for the regular monitoring and effective dissemination of the cost of essential drugs to both suppliers and consumers to foster price awareness and ensure the availability of essential drugs to the community at the minimum possible prices
Quality of drugs • Identify storage deficiencies and design interventions for implementation to address the poor or not adequate storage conditions in public health facilities
• The Ministry of Health and National Drug Authority should strengthen mechanisms to ensure that no expired drugs are found on the shelves in both the public and private sectors
Rational drug use • Identify and develop interventions for implementation to address the significant increase in the number of drugs prescribed per patient contact
• Identify and develop interventions for implementation to address the significant increase in the number of antibiotics prescribed per patient contact
• Identify, develop and continue implementing interventions to further decrease the number of patients receiving injections
• Develop, disseminate and enforce clear guidelines and training on the importance of labelling for dispensed medicines
• Develop, disseminate and enforce clear guidelines and training on the importance of ensuring that patients know how to take their medicines correctly. These initiatives should include consumer-targeted and community-based information, education and communication campaigns
• Investigate and develop interventions for the treatment of diarrhoea in children under 5: Why are 40% of children receiving antibiotics? Why are 20% not receiving ORS? Why are 25% of facilities prescribing antispasmodics? Why are 10% of facilities prescribing antidiarrhoeals?
• Investigate and develop interventions to address the very poor adherence to the standard treatment guideline for ARI
• The Ministry of Health should ensure that the Uganda Clinical Guidelines (the replacement for the old NSTGs) and the EDLU are disseminated and distributed to all health facilities and that health staff are trained in their correct use
• Design and implement consumer-targeted and community-based information, education and communication campaigns to improve rational use of medicines in the community
Household • Develop and implement strategies that ensure equitable access, affordability and sustainable financing for health services in general and access to essential medicines in particular

30
Recommendations Summary (cont) The survey clearly indicates that drug management systems and capacity, especially at peripheral health units, need to be strengthened in all aspects of drug supply chain management, such as selection, quantification, procurement, inventory and stores management. Urgently required reforms in policy and management of essential drugs to increase efficiency in the provision of pharmaceutical services are already being put in place by the Ministry of Health through the implementation of a comprehensive revised National Drug Policy (NDP) and additional funds are being earmarked by the Government for the procurement and supply of essential drugs to the population. NDP implementation activities should be intensified and strengthened. The findings and recommendations of this survey should facilitate efforts to build on the significant progress already made in improving drug management in Uganda by strengthening institutional and human resource capacity to manage pharmaceutical supplies, service provision and regulation at all levels of the healthcare system. There is need to design and implement district-focused capacity building and training in drug management procedures and promotion of rational drug use in order to improve the availability, management and use of essential drugs. The approaches should include public and private sector collaboration particularly with NGOs, Civil Society and Faith-Based Organisations.

31
ANNEXES 1 Questionnaire on Structures and Processes of Country Pharmaceutical Situation (Level I)
(completed July 2003)
2 Results of Previous Surveys: Drug Use Indicators in Public Health Facilities in Uganda
3 Designation of Key Drugs, Guidelines and Geographic / Facility Sampling
4 Survey Forms (Level II, Household)

32
Annex 1: Questionnaire on structures and processes of country pharmaceutical situation (Level I)
Country: Uganda (AFRO) Date: 18/07/2003
Name of respondent(s): Mr. Sebisubi Fred Musoke Position(s): Ag. Principal Pharmacist, Ministry of Health
Ms. Kate Kikule Ag. Senior Inspector of Drugs, NDA
Indicator 2003 Latest WHO
Data
1. NATIONAL MEDICINES (DRUG) POLICY (NMP) 1.1 Is there a National Medicines Policy (NMP) document? (See glossary for a definition of NMP) If no, skip to 1.4.
Yes/No/Don’t Know Yes
Yes
Is it an official or draft document? Official/Draft/Don’t Know Official Official
What year was it last updated? Year 1993 1993
1.2 Is there an NMP implementation plan that sets activities, responsibilities, budgets, and timeline?
Yes/No/Don’t Know Yes
Official
If yes, when was it last updated? Year 2002 1994
1.3 Is the NMP integrated into a published/official national health policy/plan? If yes, when was it last updated?
Yes/No/Don’t Know No Year
1.4 Is there a national policy on traditional and complementary/ alternative medicine (TM/CAM) either as part of the medicines policy or health policy or as a separate document? (TM/CAM is defined in the glossary)
Yes/No/Don’t Know Yes
If yes, when was it last updated? Year 1993
1.5 Has a national assessment/indicator study been conducted? If yes, what areas have been studied and when was the most recent study covering each area conducted?
Yes/No/Don’t Know Yes
Overall pharmaceutical situation: Yes/No/Don’t Know Yes Year 2002
Rational use/prescription audit: Yes/No/Don’t Know Yes Year 2002
Access: Yes/No/Don’t Know Yes Year 2002
2. LEGISLATION/REGULATION 2.1 Is there a medicines law? If yes, when was it last updated? Which of the following areas are covered by medicines legislation and when was each last updated?
Yes/No/Don’t Know Yes Year 1993
Establishment of regulatory authority: Yes/No/Don’t Know Yes Year 1993 Yes
Marketing authorisation of pharmaceuticals: Yes/No/Don’t Know Yes Year 1993 Yes 1993
Manufacturing of medicines: Yes/No/Don’t Know Yes Year 1995 Yes 1993
Distribution of medicines: Yes/No/Don’t Know Yes Year 1995 Yes 1993
Promotion & advertising of medicines: Yes/No/Don’t Know Yes Year 1995 Yes 1993
Importation of medicines: Yes/No/Don’t Know Yes Year 1995 Yes 1993
Exportation of medicines: Yes/No/Don’t Know Yes Year 1995
Licensing & practice of prescribers: Yes/No/Don’t Know Yes Year 1996 Yes 1996
Licensing & practice of pharmacy: Yes/No/Don’t Know Yes Year 1970 Yes 1970
Herbal medicines (See glossary for definition): Yes/No/Don’t Know Yes Year 1993
Empowers inspectors to enter premises and collect samples and documentation:
Yes/No/Don’t Know Yes Year 1993
Requires transparency, accountability and code of conduct in regulatory work:
Yes/No/Don’t Know Yes Year 1995
2.2 System and operation of medicines registration:
a) Is marketing authorisation required for medicines to be sold? If yes, how many medicinal products have been approved to be marketed? (express as number of dosage forms & strengths)
Yes/No/Don’t Know Yes
Total______ 2,993
Is marketing authorisation required for herbal medicines to be sold?If yes, how many herbal medicinal products have been approved to be marketed? (express as number of dosage forms & strengths) (See glossary for a definition of herbal medicines)
Yes/No/Don’t Know Yes
Total______ 66

33
Indicator 2003 Latest WHO
Data
b) Are there detailed written guidelines, including reference guidelines and criteria, for submitting applications for the registration of medicinal products? Are there guidelines covering the registration of herbal medicines?
Yes/No/Don’t Know Yes
Yes/No/Don’t Know Yes
c) Is the WHO Certification Scheme certificate required as part of the marketing authorisation process?
Yes/No/Don’t Know Yes
d) Is INN used in the registration of medicines? Yes/No/Don’t Know Yes
e) Is a list of all registered products publicly accessible? (Registered product is defined in the glossary)
Yes/No/Don’t Know Yes Yes
2.3 Is there a computerised registration system that facilitates retrieval of information on registered products? (Registration system is defined in the glossary)
Yes/No/Don’t Know Yes
2.4 Is there a medicines regulatory authority website providing publicly accessible information on any of the following: legislation, regulatory procedures, prescribing information (such as indications, contraindications, side effects, etc.), authorised companies, and/or approved medicines?
Yes/No/Don’t Know Yes
Is licensing a requirement? (Licensing is defined in the glossary) If yes, is it based on site inspection of:
Yes/No/Don’t Know Yes
Manufacturers: Yes/No/Don’t Know Yes Yes
Importers/wholesalers: Yes/No/Don’t Know Yes
Retail distributors/pharmacies: Yes/No/Don’t Know Yes Yes
2.5 Are there written national guidelines/codes/checklists for the inspection of:
Manufacturers: Yes/No/Don’t Know Yes
Importers/wholesalers: Yes/No/Don’t Know Yes
Retail distributors/pharmacies: Yes/No/Don’t Know Yes
Is prescribing by generic name obligatory in the:
Public sector: Yes/No/Don’t Know Yes Yes
Private sector: Yes/No/Don’t Know No No
2.6 Is generic substitution permitted at: (Generic substitution is defined in the glossary)
Public pharmacies: Yes/No/Don’t Know Yes Yes
Private pharmacies: Yes/No/Don’t Know Yes Yes
2.7 Is promotion/advertisement of medicines regulated by:
Company self-regulation: Yes/No/Don’t Know No
Government agency or medicines regulatory authority: Yes/No/Don’t Know Yes Government
agency
Are civil society/non-governmental organisations involved in review, assessment, or surveillance of promotion/ advertisement of medicines?
Yes/No/Don’t Know No
Do regulations on promotion/advertisement of medicines include: (See glossary for the distinction between promotion and advertisement)
Published ethical criteria for medicines promotion: Yes/No/Don’t Know Yes
Pre-approval for promotional materials: Yes/No/Don’t Know Yes
Pre-approval for advertisement materials: Yes/No/Don’t Know Yes
Explicit prohibition on advertising prescription medicines: Yes/No/Don’t Know Yes Yes
Detailed restrictions on advertising non-prescription medicines: Yes/No/Don’t Know Yes
2.8 Are adverse drug reactions (ADR) monitored? If yes, what is the total number of each of the following for the most recent year for which data is available?
Yes/No/Don’t Know No
Total number of validated ADR reports received: ____ (Year ) DK
Total number of reporting physicians: ____ (Year ) DK
Total number of physicians in country: ____ (Year ) DK
Are ADR of herbal medicines monitored?
Yes/No/Don’t Know No

34
Indicator 2003 Latest WHO
Data
3. QUALITY CONTROL OF PHARMACEUTICALS 3.1 Testing of medicines samples collected last year for regulatory purposes (ie. including drug registration and post-marketing surveillance, but excluding testing done in conjunction with procurement activities):
Total number of samples
Total number of samples collected: ____ 875 Don’t Know
Total number of samples tested: ____ 735 Don’t Know
Total number of samples that failed identity or assay: ____ 32 Don’t Know
Where have the above samples (see 3.1) been tested: % of total samples tested
Government quality control laboratory: 100% Don’t Know
Local academic institutions: % Don’t Know
Quality control laboratory in another country: % Don’t Know
Private quality control laboratory: % Don’t Know
4. ESSENTIAL MEDICINES LIST (EML) Are there Essential Medicines Lists (EML)? (An Essential Medicines List is a government-approved selective list of medicines or national reimbursement list)
Total number of medicines
Year of last update
Total no.
meds
Year
up-
dated
National EML: Yes/No/DK Yes 339____ 2001 Yes 335 1996
State or provincial list: Yes/No/DK No ____
List for primary health care: Yes/No/DK No ____
4.2 Are EMLs being used in: Public sector procurement: Yes/No/Don’t Know Yes
Public insurance reimbursement: Yes/No/Don’t Know No
Private insurance reimbursement: Yes/No/Don’t Know No
4.3 Are local herbal medicines included on the national EML? Yes/No/Don’t Know No
5. MEDICINES SUPPLY SYSTEM 5.1 Who is responsible for public sector drug procurement and distribution? What percentage of the total cost is each responsible for? Ministry/Department of Health:
Procurement
Yes/No/DK Yes 80%
Distribution
Yes/No/DK Yes 90%
Non-governmental organisation (NGO): Yes/No/DK Yes 10% Yes/No/DK No %
Private institution contracted by the government: Yes/No/DK Yes 8% Yes/No/DK Yes 5%
Individual health institutions: Yes/No/DK Yes 2% Yes/No/DK Yes 5%
5.2 Is government procurement limited to medicines on the EML? Yes/No/Don’t Know Yes Yes
If no, is a percentage of the budget set aside for non-EML items? Yes/No/Don’t Know
What is the percentage? %
5.3 Type of tender and percentage of the total cost for each: (Tender is the process by which competing bids are entered for a particular contract) National competitive tender:
Yes/No/DK Yes Percentage of
total cost 15% 10%
International competitive tender: Yes/No/DK Yes 80% 90%
Negotiation/direct purchasing: Yes/No/DK Yes 5%
5.4 Is drug registration a prerequisite for government purchases? Yes/No/Don’t Know Yes
6. MEDICINES FINANCING 6.1 What is the total public or government budget for medicines in US$ for the most recent year for which data is available?
$ 10 million Year 2002/3
6.2 Are there guidelines on medicines donations that cover the public sector, the private sector, or NGOs?
Public Sector
Yes/No/DK Yes
Private Sector
Yes/No/DK Yes
NGO
Yes/No/DK Yes
6.3 Which medicines are free at primary public health facilities:
All medicines are free of charge:
Yes/No/Don’t Know Yes Yes
Malaria medicines are free: Yes/No/Don’t Know Yes
Tuberculosis medicines are free: Yes/No/Don’t Know Yes
Sexually transmitted diseases medicines are free: Yes/No/Don’t Know Yes
HIV/AIDS-related medicines are free: Yes/No/Don’t Know Yes
Medicines are free to those who cannot afford them: Yes/No/Don’t Know Yes
Medicines are free for children under 5 years of age: Yes/No/Don’t Know Yes
Medicines are free for pregnant women: Yes/No/Don’t Know Yes
Medicines are free for elderly persons: Yes/No/Don’t Know Yes

35
Indicator 2003 Latest WHO
Data
No medicines are free of charge: (Don’t Know )
6.4 Which fees are charged in public health facilities:
Registration/Consultation fees:
Yes/No/Don’t Know No
Dispensing fees: Yes/No/Don’t Know No
Flat fees for medicines: Yes/No/Don’t Know No
Flat rate co-payments: Yes/No/Don’t Know No
Percentage co-payments:
(Co-payments cover part of the cost of medicines, the other part being paid by an insurer or government)
Yes/No/Don’t Know No
6.5 Is revenue from fees or drug sales used to pay the salaries of public health personnel in the same facility?
Always/Frequently/Occasionally/Never/DK Never
6.6 Health insurance: (Health insurance is any prepayment scheme for health care costs additional to but excluding subsidies funded through the Ministry of Health budget)
What percentage of the population has health insurance?
Public
All/Some/None/DKNone
Private
All/Some/None/DKSome
Public
Private
Are medicines covered by health insurance? All/Some/None/DKNone All/Some/None/DKSome No No
Of the covered medicines, what percentage of the cost is covered: % 100%
6.7 Is there a pricing policy on medicines that covers the public sector, the private sector, or non-governmental organisations? If yes, does it apply to:
Public sector
Yes/No/DK No
Private sector
Yes/No/DK No
NGO
Yes/No/DK No
All medicines, some or none: All/Some/None/DK None
All/Some/None/DK None
All/Some/None/DK None
Is maximum wholesale mark up established in laws/regulations: Yes/No/DK No Yes/No/DK No Yes/No/DK No
If yes, amount: % % %
Maximum retail mark up established in laws/regulations: Yes/No/DK No Yes/No/DK No Yes/No/D KNo
If yes, amount: % % %
Duty on imported raw pharmaceutical materials: Yes/No/DK No Yes/No/DK No Yes/No/DK No
Duty on imported finished pharmaceutical products: Yes/No/DK No Yes/No/DK No Yes/No/DK No
7. ACCESS TO ESSENTIAL MEDICINES 7.1 In your opinion, what percentage of the population has regular access to essential medicines? (i.e. minimum of 20 most essential medicines available and affordable at public and private facilities within a one-hour walking distance)
57% 70%
7.2 What percentage of:
The population is within 1 hour walking distance to:
Public health facility
40%
Private health facility
60%
Public or private retail drug outlet
70%
Facilities have essential medicines available: 60% 90% 90%
The population can afford essential medicines at: 100% 60% 60%
8. PRODUCTION 8.1 What is the medicines production capability in the country?
Research and development of new active substances:
Yes/No/Don’t Know No
Production of pharmaceutical active starting materials: Yes/No/Don’t Know No
Formulation from pharmaceutical starting materials: Yes/No/Don’t Know Yes
Repackaging of finished dosage forms: Yes/No/Don’t Know Yes
8.2 For each of the following types of local production, indicate number of factories and total annual sales in US$ for the most recent year for which data is available:
Starting materials:
Number of factories
0____
Sales in US$
$ ____
Year
Don’t know
DK
Finished products: 5____ $10 million ___2002 DK
Products containing active substances developed/marketed for the first time during the last 5 years:
____ $ ____ DK
8.3 What is the total volume and US$ value of the medicines market?
Generic medicines compose what percentage of market volume andvalue?
Volume ____, Value $70 million____
Volume ____%, Value 80____%

36
Indicator 2003 Latest WHO
Data
9. RATIONAL USE OF MEDICINES 9.1 Are there standard treatment guidelines (STGs) produced by the health ministry/department for major conditions? (STGs are recommendations about how to treat a clinical condition)
National STG:
Yes/No/DKYes Number of conditions/ diseases
All____
Year of publication or review
2003
Year of public’n or review
1993
STG for hospital level: Yes/No/DK No ____
STG for primary health care level: Yes/No/DK No ____
9.2 Is there a National Medicines Formulary manual? (A formulary manual contains summary drug information) If yes, does it cover only medicines on the Essential Medicines List?
Yes/No/Don’t Know No
Yes/No/Don’t Know
What year was it last published/reviewed: Year
9.3 Are any of the following aspects of the essential medicines concept generally part of the basic curricula in most health training institutions/universities for: (Essential medicines are those that satisfy the priority health care needs of the population. See glossary for a definition of problem-based pharmacotherapy)
Doctors:
Essential Medicines List
Yes/No/DK
Yes
Standard Treatment Guidelines
Yes/No/DK
Yes
Problem-based pharmacotherapy
Y/N/DK Yes
Rational prescribing
Y/N/DK
Yes
Yes
Nurses: Yes/No/DKYes
Yes/No/DKYes
Y/N/DK No Y/N/DK Yes
Yes
Pharmacists: Yes/No/DKYes
Yes/No/DKYes
Y/N/DK Yes
Y/N/DK Yes
Yes
Pharmacy assistants: Yes/No/DKYes
Yes/No/DKYes
Y/N/DK No Y/N/DK Yes
Yes
Paramedical staff: Yes/No/DKYes
Yes/No/DKYes
Y/N/DK No Y/N/DK Yes
9.4 Are there independent publicly or non-commercially funded obligatory continuing education programs which include use of medicines for: Doctors:
Yes/No/Don’t Know
Yes Yes
Nurses/midwives/paramedical staff: Yes/No/Don’t Know Yes No
Pharmacists: Yes/No/Don’t Know Yes Yes
Pharmacy aides/assistants: Yes/No/Don’t Know Yes No
9.5 Is there a public or independently funded nationally accessible (eg. by phone) medicines information centre or service co-ordinated by the Ministry of Health, academia, and/or a non-commercial non-governmental organisation that provides information on demand to: Prescribers:
Yes/No/Don’t Know No
No
Dispensers: Yes/No/Don’t Know No No
Consumers: Yes/No/Don’t Know No
9.6 Has there been any public education campaign concerning rational medicines use in the previous two years conducted by Ministry of Health/non-governmental organisation/academia on the following topics: Use of antibiotics:
Yes/No/Don’t Know Yes
Use of injections: Yes/No/Don’t Know Yes
Other topics/issues: Yes/No/Don’t Know Yes
9.7 How often do the following personnel prescribe at the primary health care level in the public sector? Doctors:
Always/Frequently/Occasionally/Never/DKOccasionally
Nurses/midwives/paramedical staff: Always/Frequently/Occasionally/Never/DK Always
Pharmacists: Always/Frequently/Occasionally/Never/DK Never
Pharmacy aides/assistants: Always/Frequently/Occasionally/Never/DK Never
Personnel with less than one month formal health training: Always/Frequently/Occasionally/Never/DKOccasionally
9.8 Is there a government department with a specific mandate to promote the rational use of medicines and co-ordinate medicines use policies?
Yes/No/Don’t Know Yes
9.9 What proportion of facilities have a drugs and therapeutics committee? (A drugs and therapeutics committee promotes the safe and effective use of medicines in the facility or area under its jurisdiction) Referral hospitals:
All/Most/Half/Few/None/Don’t Know Few
General hospitals: All/Most/Half/Few/None/Don’t Know Few
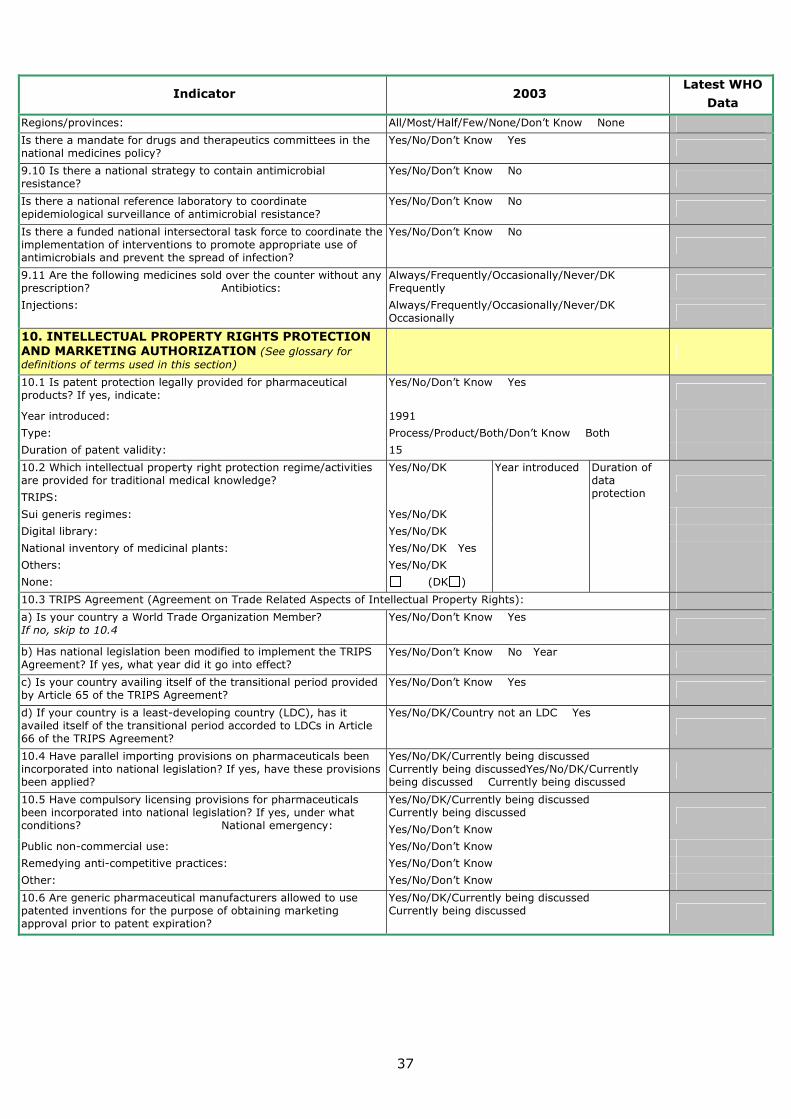
37
Indicator 2003 Latest WHO
Data
Regions/provinces: All/Most/Half/Few/None/Don’t Know None
Is there a mandate for drugs and therapeutics committees in the national medicines policy?
Yes/No/Don’t Know Yes
9.10 Is there a national strategy to contain antimicrobial resistance?
Yes/No/Don’t Know No
Is there a national reference laboratory to coordinate epidemiological surveillance of antimicrobial resistance?
Yes/No/Don’t Know No
Is there a funded national intersectoral task force to coordinate the implementation of interventions to promote appropriate use of antimicrobials and prevent the spread of infection?
Yes/No/Don’t Know No
9.11 Are the following medicines sold over the counter without any prescription? Antibiotics:
Always/Frequently/Occasionally/Never/DKFrequently
Injections: Always/Frequently/Occasionally/Never/DKOccasionally
10. INTELLECTUAL PROPERTY RIGHTS PROTECTION AND MARKETING AUTHORIZATION (See glossary for definitions of terms used in this section)
10.1 Is patent protection legally provided for pharmaceutical products? If yes, indicate:
Yes/No/Don’t Know Yes
Year introduced: 1991
Type: Process/Product/Both/Don’t Know Both
Duration of patent validity: 15
10.2 Which intellectual property right protection regime/activities are provided for traditional medical knowledge?
TRIPS:
Yes/No/DK Year introduced
Duration of data protection
Sui generis regimes: Yes/No/DK
Digital library: Yes/No/DK
National inventory of medicinal plants: Yes/No/DK Yes
Others: Yes/No/DK
None: (DK )
10.3 TRIPS Agreement (Agreement on Trade Related Aspects of Intellectual Property Rights):
a) Is your country a World Trade Organization Member? If no, skip to 10.4
Yes/No/Don’t Know Yes
b) Has national legislation been modified to implement the TRIPS Agreement? If yes, what year did it go into effect?
Yes/No/Don’t Know No Year
c) Is your country availing itself of the transitional period provided by Article 65 of the TRIPS Agreement?
Yes/No/Don’t Know Yes
d) If your country is a least-developing country (LDC), has it availed itself of the transitional period accorded to LDCs in Article 66 of the TRIPS Agreement?
Yes/No/DK/Country not an LDC Yes
10.4 Have parallel importing provisions on pharmaceuticals been incorporated into national legislation? If yes, have these provisions been applied?
Yes/No/DK/Currently being discussed Currently being discussedYes/No/DK/Currently being discussed Currently being discussed
10.5 Have compulsory licensing provisions for pharmaceuticals been incorporated into national legislation? If yes, under what conditions? National emergency:
Yes/No/DK/Currently being discussed Currently being discussed
Yes/No/Don’t Know
Public non-commercial use: Yes/No/Don’t Know
Remedying anti-competitive practices: Yes/No/Don’t Know
Other: Yes/No/Don’t Know
10.6 Are generic pharmaceutical manufacturers allowed to use patented inventions for the purpose of obtaining marketing approval prior to patent expiration?
Yes/No/DK/Currently being discussed Currently being discussed

38
Comments on Level 1 Indicators Indicator Comment
1.1 The 1993 NMP was reviewed & a new revised NMP 2001 draft is ready awaiting Ministry of Health official endorsement.
1.3 The new NMP is to be incorporated into the National Health Policy and the Health Sector Strategic Plan.
1.4 A comprehensive TM/CAP policy and regulatory framework is under development
6.4 Public hospitals only are allowed to have private wings where those who can afford to pay for health services may go
9.2 A National Medicines Formulary Manual is under development
9.8 Currently this is a Section under the Department for Clinical Services with an established staff of one pharmacist. A proposal is in advanced stages to upgrade to a full Department with 5-6 Pharmacists
10.2 This is further being developed as under 1.4
10.3 (b) There is a Draft Industrial Property Bill, January 2002 under discussion and drafting to make Uganda compliant
with TRIPS.
Glossary of Terms Used in Annex 1 Advertisement: A set of activities undertaken to advertise medicines usually targeted at the general public and usually limited to over-the-counter medicines.
Compulsory licensing: This term is used when the judicial or administrative authority is allowed by law to grant a license, without permission from the holder, on various grounds of general interest (absence of working, public health, economic development, and national defence). “Working” of a patent is the execution of the invention in the country of registration.
Co-payments: cover part of the cost of medicines, the other part being paid by an insurer or government.
Drugs and therapeutics committee: promotes safe and effective use of medicines in the facility or area under its jurisdiction.
Essential Medicines List: a government-approved selective list of medicines or national reimbursement list.
Essential medicines: those medicines that satisfy the priority health care needs of the population.
Generic substitution: The practice of substituting a product, whether marketed under a trade name or generic name, by an equivalent product, usually a cheaper one, containing the same active ingredient(s).
Health insurance: any prepayment scheme for health care costs additional to but excluding subsidies funded through the Ministry of Health budget. The purpose of question 6.6 is to identify how much protection the population has against exposure to the cost of medicines at the time people are sick. Prepaid financing is the usual method for providing such protection. Public funding through the (prepaid) Ministry of Health budget is the most widespread form of prepayment. Question 6.5 attempts to identify additional prepayment protection (percentage of the population covered and degree of protection against medicine costs) such as private or employer-based health insurance, community prepayments schemes, social health insurance (health care funded through social security systems), etc.
Herbal Medicines: plant-derived material or preparations with therapeutic or other human health benefits, which contain either raw or processed ingredients from one or more plants. Herbal medicines include herbs, herbal materials, herbal preparations and finished herbal products, which are classified in the medicines category according to a national regulatory framework. Finished herbal products and mixture herbal products may contain excipients in addition to the active ingredients, however, finished products or mixture products to which chemically defined active substances have been added, including synthetic compounds and/or isolated constituents from herbal materials, are not considered to be herbal. In some countries, herbal medicines may also contain, by tradition, natural organic or inorganic active ingredients which are not of plant origin.
Licensing: a system that subjects all premises to evaluation against a set of requirements before a specific activity (e.g. manufacturing, storage etc.) is authorised to take place.
Medicines formulary manual: contains summary drug information.
National medicines (drug) policy (NMP): an expression of the government’s goals and priorities for the medium to long term for the pharmaceutical sector. It also identifies the main strategies for attaining them. It provides a framework within which the activities of the pharmaceutical sector can be coordinated. It covers both the public and private sectors, and involves all the main actors in the pharmaceutical field.
Parallel importing: importation, without the consent of the patent-holder, of a patented product marketed in another country either by the patent-holder or with the patent-holder’s consent. Parallel importation enables promotion of competition for the patented product by allowing importation of equivalent patented products marketed at lower prices in other countries.
Problem-based pharmacotherapy: a problem-based practical approach to teaching prescribing.
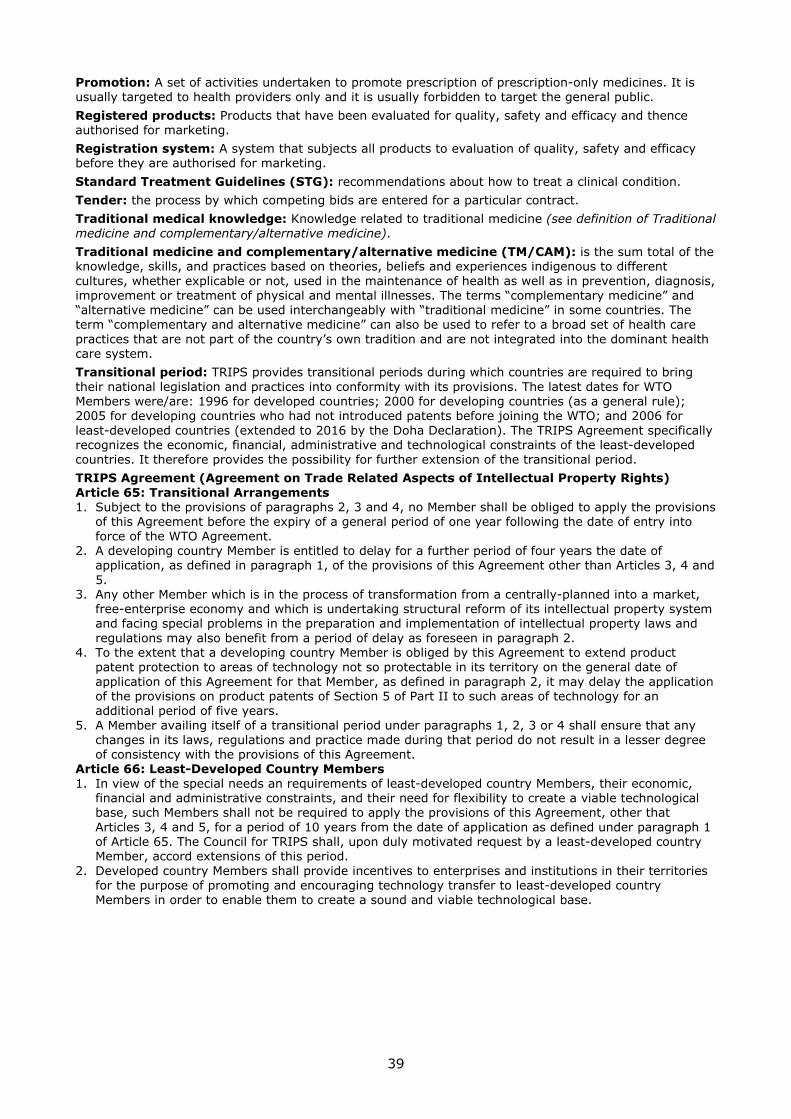
39
Promotion: A set of activities undertaken to promote prescription of prescription-only medicines. It is usually targeted to health providers only and it is usually forbidden to target the general public.
Registered products: Products that have been evaluated for quality, safety and efficacy and thence authorised for marketing.
Registration system: A system that subjects all products to evaluation of quality, safety and efficacy before they are authorised for marketing.
Standard Treatment Guidelines (STG): recommendations about how to treat a clinical condition.
Tender: the process by which competing bids are entered for a particular contract.
Traditional medical knowledge: Knowledge related to traditional medicine (see definition of Traditional medicine and complementary/alternative medicine).
Traditional medicine and complementary/alternative medicine (TM/CAM): is the sum total of the knowledge, skills, and practices based on theories, beliefs and experiences indigenous to different cultures, whether explicable or not, used in the maintenance of health as well as in prevention, diagnosis, improvement or treatment of physical and mental illnesses. The terms “complementary medicine” and “alternative medicine” can be used interchangeably with “traditional medicine” in some countries. The term “complementary and alternative medicine” can also be used to refer to a broad set of health care practices that are not part of the country’s own tradition and are not integrated into the dominant health care system.
Transitional period: TRIPS provides transitional periods during which countries are required to bring their national legislation and practices into conformity with its provisions. The latest dates for WTO Members were/are: 1996 for developed countries; 2000 for developing countries (as a general rule); 2005 for developing countries who had not introduced patents before joining the WTO; and 2006 for least-developed countries (extended to 2016 by the Doha Declaration). The TRIPS Agreement specifically recognizes the economic, financial, administrative and technological constraints of the least-developed countries. It therefore provides the possibility for further extension of the transitional period.
TRIPS Agreement (Agreement on Trade Related Aspects of Intellectual Property Rights) Article 65: Transitional Arrangements 1. Subject to the provisions of paragraphs 2, 3 and 4, no Member shall be obliged to apply the provisions
of this Agreement before the expiry of a general period of one year following the date of entry into force of the WTO Agreement.
2. A developing country Member is entitled to delay for a further period of four years the date of application, as defined in paragraph 1, of the provisions of this Agreement other than Articles 3, 4 and 5.
3. Any other Member which is in the process of transformation from a centrally-planned into a market, free-enterprise economy and which is undertaking structural reform of its intellectual property system and facing special problems in the preparation and implementation of intellectual property laws and regulations may also benefit from a period of delay as foreseen in paragraph 2.
4. To the extent that a developing country Member is obliged by this Agreement to extend product patent protection to areas of technology not so protectable in its territory on the general date of application of this Agreement for that Member, as defined in paragraph 2, it may delay the application of the provisions on product patents of Section 5 of Part II to such areas of technology for an additional period of five years.
5. A Member availing itself of a transitional period under paragraphs 1, 2, 3 or 4 shall ensure that any changes in its laws, regulations and practice made during that period do not result in a lesser degree of consistency with the provisions of this Agreement.
Article 66: Least-Developed Country Members 1. In view of the special needs an requirements of least-developed country Members, their economic,
financial and administrative constraints, and their need for flexibility to create a viable technological base, such Members shall not be required to apply the provisions of this Agreement, other that Articles 3, 4 and 5, for a period of 10 years from the date of application as defined under paragraph 1 of Article 65. The Council for TRIPS shall, upon duly motivated request by a least-developed country Member, accord extensions of this period.
2. Developed country Members shall provide incentives to enterprises and institutions in their territories for the purpose of promoting and encouraging technology transfer to least-developed country Members in order to enable them to create a sound and viable technological base.

40
Annex 2: Results of Previous Pharmaceutical Sector Surveys
Indicator Year
1990 1993 1997 2000
Number of facilities 42 127 64 205 Source of data DRC/EDMP DRC/EDMP NDA DISH Project Average No. of drugs per prescription 1.9 2.2 2.0 2.9 % Patients given antibiotics 56% 52.9% 41.5% 56.6% % Patients given injectables 48% 36% 51.8% 32% % Drugs generic - 86.3 - - % Patients with adequate knowledge - 28.7% - 28.7% % Patients given proper instructions - 45.4% - - % Drugs in stock - 90.9% - - % Drugs on EDLU - 97.3% - - % Cases treated according NSTG - 23.9% - - % Drugs adequately labelled - 36.5% - - % Heath units with EDLU - 80.3% - - % Health units using EDLU - 20.6% - - % Drugs dispensed 90.5% - - % Diarrhoea child <5 cases receiving ORS 54.4% 82.5% - - % Diarrhoea child <5 cases given antibiotics 64.3% 13.2% - - % Diarrhoea child <5 cases given injections 49.4% - - % Diarrhoea child <5 cases treated as in NSTG - 29.2% - -
National Standard Rational Drug Use Indicators
Indicator National Standard (Target) Figures
Average Number of drugs prescribed <1.6 % Cases given antibiotics <20% % Cases given injectables <15% % Drugs in generic 100% % Drugs on EDLU 100% Average No. of drugs dispensed 1.6 % Drugs dispensed 100% % Patients given proper dispensing instructions 100% % Drugs properly labelled 100% % Patients knowledgeable about dosage 70% % General cases treated according to NSTGS 80% % Malaria treated according to NSTGS 100% % <5 diarrhoea cases treated according to NCTGS 100% % Diarrhoea cases given ORS 100% % Drugs for diarrhoea that are antibiotics 0% % Drugs for diarrhoea that are injectable 0% % Drugs in stock for 5 conditions 100% % Health units with EDL 100% % Health units using EDL 100%
Source: Rational Drug Use in Rural Health Units of Uganda: Effect of National Treatment Guidelines on Rational Drug Use, Uganda Essential Drugs Management Programme, Ministry of Health, April 1996.

41
Annex 3: Adaptation of survey forms with country specific information for Uganda a) List of key drugs (Survey forms 1, 2 and 5)
1. Amoxicillin capsules 250mg 2. Acetylsalicylic acid (aspirin) tablets 300mg 3. Chloroquine tablets 150mg base 4. Cotrimoxazole tablets 480mg 5. Ferrous sulphate + folic acid tablets 200mg + 400mcg* 6. Mebendazole tablets 100mg 7. Metronidazole tablets 200mg 8. Retinol (vitamin A) capsule (drops) 100,000 IU** 9. Sulphadoxine/pyrimethamine tablets 500/25mg 10. Benzylpenicillin injection 1g (1MU) 11. Methylergometrine injection 200mcg/mL 12. Gentamicin injection 40mg/mL 13. Hydralazine injection 20mg/mL 14. Magnesium sulphate injection 50% 15. Measles vaccine 16. Medroxyprogesterone injection 150mg/mL (Depo-Provera®) 17. Benzoic acid + salicylic acid ointment 6% + 3% 18. Paracetamol syrup 120mg/5mL 19. Oral Rehydration Salts (ORS) 20. Tetracycline eye ointment 1% Notes: * Ferrous sulphate tablets 200mg is an allowed alternative ** 50,000 and 200,000 IU strengths are allowed alternatives
b) STGs in force at the time (Survey form 8):
• The National Standard Treatment Guidelines (NSTG), Uganda Essential Drugs Management Programme, 1993
• Guidelines for the Diagnosis and Treatment of Malaria, Malaria Control Programme, MOH Uganda, 2001
• Syndromic Management of Common Sexually Transmitted Diseases, STD/AIDS Control Programme, MOH (undated)
• Manual of the National TB/Leprosy Programme in Uganda, 1st edition, MoH, 1992.
c) Treatment regimen for drugs to treat outpatient children with pneumonia (Survey form 4)
Drug Strength Unit No. of units per
treatment regimen Regimen
Benzylpenicillin injection
1g (1 MU) 1 amp 2 ampoules + 2 syringes + 2 x 5ml water for injection
50,000 IU/kg IM every 6 hours for 2 days - then continue with oral drug below for 5 days
Amoxicillin syrup/susp
125mg/5ml 100ml 1 x 100ml 125mg every 8 hours for 5 days
Cotrimoxazole syrup/susp
200mg sulfamethoxazole/ 40mg trimethoprim/5ml
60ml or 100ml
2 x 60ml or 1 x 100ml
24mg/kg twice daily for 5 days
d) Designation of Essential Drug List and Standard Treatment Guidelines for Availability of Guidelines Indicator (Survey form 8)
• Essential Drugs List of Uganda, The National Drug Authority 2001 • National Standard Treatment Guidelines, Uganda Essential Drugs Management
Programme, 1993

42
e) Districts and Facilities Sampled
District Hospital HC IV HC III HC II Other Iganga Iganga Kiyunga Bubenge
Bugobi Kawete
Iganga District Drug Store
Bushenyi Kitagata Kyabugimbi Bihanga Kabira Kigarama
Bushenyi District Drug Store
Nakasongola Nakasongola Nabiswera Kakooge Mayirikiti Kalungi
Nakasongola District Drug Store
Kampala Old Mulago St.Citizens, Luzira
Kisenyi
J.O.Y Medical Centre Kampala City Council Drug Store Nsambya General Clinic

43
Annex 4: Survey forms
Survey Forms Code
Survey Form
SF 1a SF 2a SF 3a SF 1b SF 2b SF 3b SF 4a SF 4b SF 5 SF 6 SF 7 SF 8 SF 9 SF 10
for central/district warehouses for central/district warehouses for central/district warehouses for public health facility pharmacies for public health facility pharmacies for public health facility pharmacies for public health facility pharmacies for private pharmacies for private pharmacies for public health facilities for public health facilities for public health facilities for public health facilities for Households

44
Survey form 1a: Central/District Warehouse Indicators: % of expired drugs Availability of key drugs
Facility Date
Location Investigator
Key drugs to treat common conditions [A] Drugs in stock
[B] Yes=1, No=0
Drugs in stock that have expired [C] Yes=1, No=0
1. Amoxicillin capsules 250mg 2. Acetylsalicylic acid (aspirin) tablets 300mg 3. Chloroquine tablets 150mg base 4. Cotrimoxazole tablets 480mg 5. Ferrous sulphate + folic acid tablets 200mg/400mcg 6. Mebendazole tablets 100mg 7. Metronidazole tablets 200mg 8. Retinol (vitamin A) capsule (drops) 100,000 IU 9. Sulphadoxine/pyrimethamine tablets 500/25mg 10. Benzylpenicillin injection 1g (1MU) 11. Gentamicin injection 40mg/mL 12. Hydralazine injection 20mg/mL 13. Magnesium sulphate injection 50% 14. Measles vaccine 15. Medroxyprogesterone injection 150mg/mL 16. Methylergometrine injection 200mcg/mL 17. Benzoic acid + salicylic acid ointment 6% + 3% 18. Paracetamol syrup 120mg/5mL 19. Oral Rehydration Salts (ORS) 20. Tetracycline eye ointment 1% Total no. of key drugs [A1] = [B1] = [C1] = % drugs in stock [B2] = % drugs expired [C2] = Notes: [A] List of 20 key drugs previously identified at national level must be printed
before starting the survey. The process is described on page 21. Add the total number of key drugs [A1].
[B] Mark 1 if stock is available (even if only one dosage form is available). Mark 0 if the drug is not physically available. Add the total at the bottom [B1].
[B2] % key drugs in stock = No. of key drugs in stock[B1] x 100 Total no. of key drugs [A1] [C] For all drugs in stock, check if expired or not. If any of the strengths has an
expiry problem, the answer for the drug should be “Yes”. Add all the “Yes” answers = [C1]
[C2] % drugs expired = Total no. of yes answers [C1] x 100 Total no. of key drugs [A1]
Central/ District Warehouse
Facility #____ (1-5)
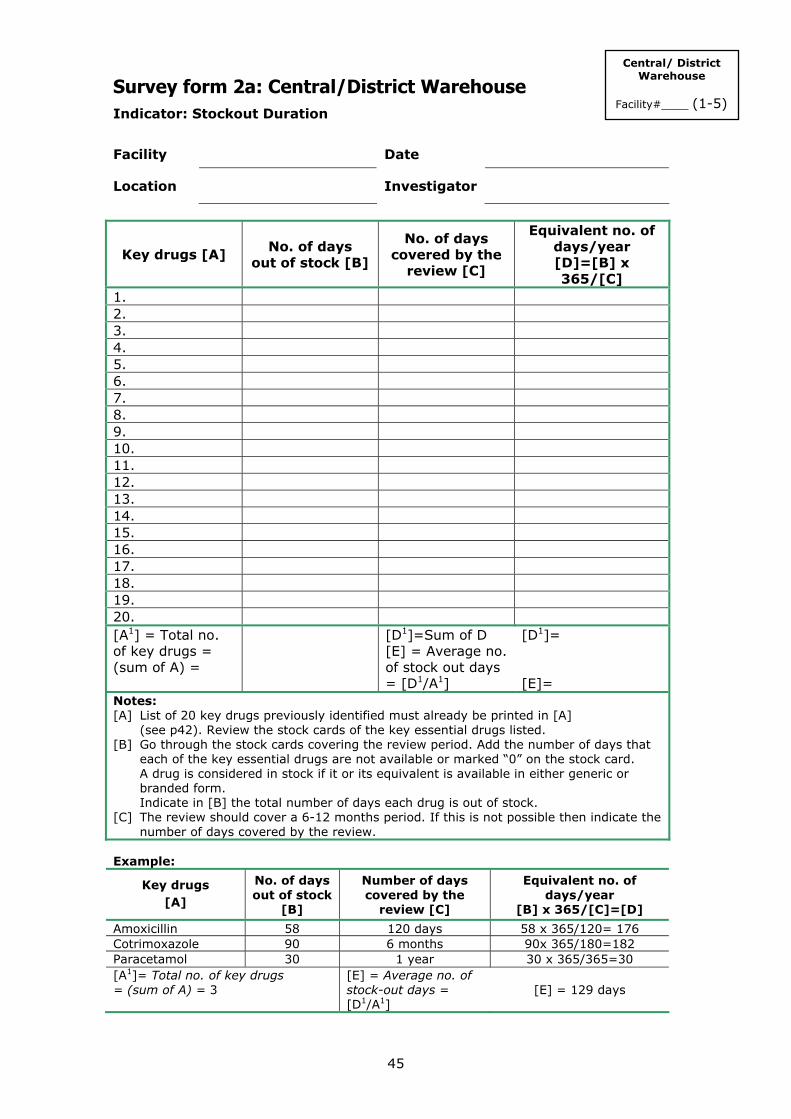
45
Survey form 2a: Central/District Warehouse Indicator: Stockout Duration
Facility Date
Location Investigator
Key drugs [A] No. of days
out of stock [B]
No. of days covered by the
review [C]
Equivalent no. of days/year [D]=[B] x 365/[C]
1. 2. 3. 4. 5. 6. 7. 8. 9. 10. 11. 12. 13. 14. 15. 16. 17. 18. 19. 20. [A1] = Total no. of key drugs = (sum of A) =
[D1]=Sum of D [E] = Average no. of stock out days = [D1/A1]
[D1]= [E]=
Notes: [A] List of 20 key drugs previously identified must already be printed in [A] (see p42). Review the stock cards of the key essential drugs listed. [B] Go through the stock cards covering the review period. Add the number of days that
each of the key essential drugs are not available or marked “0” on the stock card. A drug is considered in stock if it or its equivalent is available in either generic or branded form.
Indicate in [B] the total number of days each drug is out of stock. [C] The review should cover a 6-12 months period. If this is not possible then indicate the
number of days covered by the review. Example:
Key drugs [A]
No. of days out of stock
[B]
Number of days covered by the
review [C]
Equivalent no. of days/year
[B] x 365/[C]=[D]
Amoxicillin 58 120 days 58 x 365/120= 176 Cotrimoxazole 90 6 months 90x 365/180=182 Paracetamol 30 1 year 30 x 365/365=30 [A1]= Total no. of key drugs = (sum of A) = 3
[E] = Average no. of stock-out days = [D1/A1]
[E] = 129 days
Central/ District Warehouse
Facility#____ (1-5)

46
Survey form 3a: Central/District Warehouse: Storage Checklist Indicator: Adequate storage Facility Date
Location Investigator
Storage Pharmacy Checklist
(check the box if Yes) Are there locks which are working in the storage area?
Storage and shelves area are clean (no dust or litter)
No evidence of pests seen in the area
There is a ceiling
There are windows that can be opened or there are air vents
No direct sunlight should enter the area, glass window panes painted white, or with curtains/blinds to protect against sunrays
Area free from moisture (leaking drains and taps). Drugs should not be stored directly on the floor
There is a separate storage and dispensing area for issuing drugs
Drugs are sorted in a systematic way (alphabetical, first expiry-first out)
There is a stock record system
There is cold storage with a temperature chart
Rating for the facility: = {[A]+[B]}/2. If only one exists just use [A] or [B]. Rating =
[A]= [B]=
Facility storage Rating (check) Equivalent rating for
quality of drugs
• Poor 0-3 Quality may be poor
• Not adequate 4-5 Quality may be doubtful
• Moderately adequate 6-7 Acceptable quality
• Adequate 8-10 Acceptable quality
• More than adequate 11 Good quality
Central/ District Warehouse
Facility #____ (1-5)

47
Survey form 1b: Public Health Facility Indicators: % of expired drugs Availability of key drugs
Facility Date
Location Investigator
Key drugs in stock to treat common conditions [A]
In stock [B] Yes=1, No=0
Drugs in stock that have expired [C] Yes=1, No=0
1. Amoxicillin capsules 250mg 2. Acetylsalicylic acid (aspirin) tablets 300mg 3. Chloroquine tablets 150mg base 4. Cotrimoxazole tablets 480mg 5. Ferrous sulphate/folic acid tablets 200mg/400mcg 6. Mebendazole tablets 100mg 7. Metronidazole tablets 200mg 8. Retinol (vitamin A) capsule (drops) 100,000 IU 9. Sulphadoxine/pyrimethamine tablets 500/25mg 10. Benzylpenicillin injection 1g (1MU) 11. Methylergometrine injection 200mcg/mL 12. Gentamicin injection 40mg/mL 13. Hydralazine injection 20mg/mL 14. Magnesium sulphate injection 50% 15. Measles vaccine 16. Medroxyprogesterone injection 150mg/mL 17. Benzoic acid + salicylic acid ointment 6% + 3% 18. Paracetamol syrup 120mg/5mL 19. Oral Rehydration Salts (ORS) 20. Tetracycline eye ointment 1% Total no. of key drugs [A1] = [B1] = [C1] = % key drugs in stock [B2] = % drugs expired [C2] = Notes: [A] List of 20 key drugs previously identified at national level must be printed
before starting the survey. The process is described on page 21. Add the total number of key drugs [A1].
[B] Mark 1 if stock is available (even if only one dosage form is available). Mark 0 if the drug is not physically available. Add the total at the bottom [B1].
[B2] % key drugs in stock = No. of key drugs in stock[B1] x 100 Total no. of key drugs [A1] [C] For all drugs in stock, check if expired or not. If any of the strengths has an
expiry problem, the answer for the drug should be “Yes”. Add all the “Yes” answers = [C1]
[C2] % drugs expired = Total no. of yes answers [C1] x 100 Total no. of key drugs [A1]
Public Health Facility Pharmacy
Facility #____ (1-30)

48
Survey form 2b: Public Health Facility Indicator: Stockout duration
Facility Date
Location Investigator
Key drugs [A] No. of days
out of stock [B]
No. of days covered by the
review [C]
Equivalent no. of days/year [D]=[B] x 365/[C]
1. 2. 3. 4. 5. 6. 7. 8. 9. 10. 11. 12. 13. 14. 15. 16. 17. 18. 19. 20. [A1] = Total no. of key drugs = (sum of A) =
[D1]=Sum of D [E] = Average no. of stock out days = [D1/A1]
[D1]= [E]=
Notes: [A] List of 20 key drugs previously identified must already be printed in [A] (see p42). Review the stock cards of the key essential drugs listed. [B] Go through the stock cards covering the review period. Add the number of days that
each of the key essential drugs are not available or marked “0” on the stock card. A drug is considered in stock if it or its equivalent is available in either generic or branded form.
Indicate in [B] the total number of days each drug is out of stock. [C] The review should cover a 6-12 months period. If this is not possible then indicate the
number of days covered by the review. Example:
Key drugs [A]
No. of days out of stock
[B]
Number of days covered by the
review [C]
Equivalent no. of days/year
[B] x 365/[C]=[D] Amoxicillin 58 120 days 58 x 365/120= 176 Cotrimoxazole 90 6 months 90x 365/180=182 Paracetamol 30 1 year 30 x 365/365=30 [A1]= Total no. of key drugs = (sum of A) = 3
[E] = Average no. of stock out days = [D1/A1]
[E] = 129 days
Public Health Facility Pharmacy
Facility #____ (1-30)

49
Survey form 3b: Public Health Facility Storage Checklist Indicator: Adequate storage Facility Date
Location Investigator
Storage Pharmacy Checklist
(check the box if Yes)
Are there locks which are working in the storage area?
Storage and shelves area are clean (no dust or litter)
No evidence of pests seen in the area
There is a ceiling
There are windows that can be opened or there are air vents
No direct sunlight should enter the area, glass window panes painted white, or with curtains/blinds to protect against sunrays
Area free from moisture (leaking drains and taps). Drugs should not be stored directly on the floor
There is a separate storage and dispensing area for issuing drugs
Drugs are sorted in a systematic way (alphabetical, first expiry-first out)
There is a stock record system
There is cold storage with a temperature chart
Rating for the facility: = {[A]+[B]}/2. If only one exists just use [A] or [B]. Rating =
[A]= [B]=
Facility storage Rating (check) Equivalent rating for
quality of drugs
• Poor 0-3 Quality may be poor
• Not adequate 4-5 Quality may be doubtful
• Moderately adequate 6-7 Acceptable quality
• Adequate 8-10 Acceptable quality
• More than adequate 11 Good quality
Public Health Facility Pharmacy
Facility #____ (1-30)

50
Survey form 4a: Public Health Facility Pharmacy Indicator: Affordability of key drugs (treating children with pneumonia without hospitalization)
Facility Date
Location Investigator
Unit price
(inj. vial, tab, or cap) Drug/INN Preparation
Local US$
No. of units needed to complete treatment
Total cost US$
[E]/[G] x100=
[A] [B] [C] [C] [D] [E] [F] Benzylpenicillin + syringe
600mg (1 MU) vial
Amoxicillin 125mg/5ml syrup/suspension)
Cotrimoxazole 200mg sulfamethoxazole + 40mg trimethoprim/ 5ml (syrup/susp)
[G]= Lowest weekly (or 5 day) government salary (US$) = [H]= [F] with lowest value = Notes • Get the prices of drugs listed in the above table. Choose the lowest priced product/brand • Identify other preparations only when necessary or if the above are not available • If there are other preparations these should be written in columns [A] & [B] before
starting the survey. (See page 21-22, Identifying drugs to treat outpatient children with pneumonia.)
[B] Only one preparation will be used for each drug. [C] The field worker will indicate the unit price in the local currency.
If there are flat charges paid for each drug given to patients, then this amount should be recorded as the price of the drug. Indicate “0” if drugs are given free. After the surveys are complete, a data analyzer will make the conversions to US$.
[D] Before starting the field test, check the STG to determine the number of units needed for the duration of treatment. Print this number on the form for each drug listed.
[E] Total cost of treatment = [C] x [D]. Only one drug (antibiotic) should be used to calculate cost of treatment and not a combination of drugs.
[F] Treatment cost (per drug) as a % of the lowest government weekly salary = [E]/[G] x 100
[G] Get the lowest weekly (or 5 day) salary of government worker/public servant. [H] Affordability: the [F] with the lowest value will be used as a measure the affordability of
treatment at the facility.
Public Health Facility Pharmacy
Facility #____ (1-30)

51
Survey form 4b: Private Pharmacy Indicator: Affordability of key drugs (treating children with pneumonia without hospitalization)
Facility Date
Location Investigator
Unit price
(inj. vial, tab, or cap) Drug/INN Preparation
Local US$
No. of units needed to complete treatment
Total cost US$
[E]/[G] x100=
[A] [B] [C] [C] [D] [E] [F] Benzylpenicillin + syringe
600mg (1 MU) vial
Amoxicillin 125mg/5ml syrup/suspension)
Cotrimoxazole 200mg sulfamethoxazole + 40mg trimethoprim/ 5ml (syrup/susp)
[G]= Lowest weekly (or 5 day) government salary (US$) = [H]= [F] with lowest value = Notes • Get the prices of drugs listed in the above table. Choose the lowest priced product/brand • Identify other preparations only when necessary or if the above are not available • If there are other preparations these should be written in columns [A] & [B] before
starting the survey. (See page 21-22, Identifying drugs to treat outpatient children with pneumonia.)
[B] Only one preparation will be used for each drug. [C] The field worker will indicate the unit price in the local currency.
If there are flat charges paid for each drug given to patients, then this amount should be recorded as the price of the drug. Indicate “0” if drugs are given free. After the surveys are complete, a data analyzer will make the conversions to US$.
[D] Before starting the field test, check the STG to determine the number of units needed for the duration of treatment. Print this number on the form for each drug listed.
[E] Total cost of treatment = [C] x [D]. Only one drug (antibiotic) should be used to calculate cost of treatment and not a combination of drugs.
[F] Treatment cost (per drug) as a % of the lowest government weekly salary = [E]/[G] x 100
[G] Get the lowest weekly (or 5 day) salary of government worker/public servant. [H] Affordability: the [F] with the lowest value will be used as a measure the affordability of
treatment at the facility.
Private Pharmacy Facility #____ (1-30)

52
Survey form 5: Private Pharmacy Indicator: % of expired key drugs
Facility Date
Location Investigator
Drugs in stock
that have expired [B] Key drugs in stock
to treat common conditions [A] (Yes=1, No=0)
1. Amoxicillin capsules 250mg 2. Acetylsalicylic acid (aspirin) tablets 300mg 3. Chloroquine tablets 150mg base 4. Cotrimoxazole tablets 480mg 5. Ferrous sulphate/folic acid tablets 200mg/400mcg 6. Mebendazole tablets 100mg 7. Metronidazole tablets 200mg 8. Retinol (vitamin A) capsule (drops) 100,000 IU 9. Sulphadoxine/pyrimethamine tablets 500/25mg 10. Benzylpenicillin injection 1g (1MU) 11. Methylergometrine injection 200mcg/mL 12. Gentamicin injection 40mg/mL 13. Hydralazine injection 20mg/mL 14. Magnesium sulphate injection 50% 15. Measles vaccine 16. Medroxyprogesterone injection 150mg/mL 17. Benzoic acid + salicylic acid ointment 6% + 3% 18. Paracetamol syrup 120mg/5mL 19. Oral Rehydration Salts (ORS) 20. Tetracycline eye ointment 1% Total no. of key drugs [A1]= % of expired drugs [B2]=
[B1]=
Notes [A] List of 20 key drugs previously identified at national level must be printed
before the survey. The process is described on page 21. Add the total number of key drugs [A1]
[B] Check if expired or not. If any of the strengths has an expiry problem the answer for the drug should be “Yes”.
[B1] Add all the “Yes” answers. [B2] % drugs expired = Total no. of yes answers [B1] x 100 Total no. of key drugs [A1]
Private Pharmacy Facility #____ (1-30)

53
Survey form 6: Public Health Facility Rational Drug Use - Prescribing Indicator Form Indicators: Average number of drugs % patients receiving injection % drugs on EDL % patients receiving antibiotics
Facility Date
Location Investigator
Seq.
Patient No.
Type (R/P)
[A]
Date of Rx
No. of drugs
[B]
Antibiotics (yes=1, no=0)
[C]
Injections (yes=1, no=0)
[D]
No. of drugs on EDL
[E] 1. 2. 3. 4. 5. 6. 7. 8. 9. 10. 11. 12. 13. 14. 15. 16. 17. 18. 19. 20. 21. 22. 23. 24. 25. 26. 27. 28. 29. 30. Total [B1] = [C1] = [D1] = [E1] = Average [B2] = Percentage [C2] = [C1]/No. of
cases x 100 = [D2] = [D1]/No. of cases x 100 =
[E2] = E1]/[B1] x 100 =
Notes [A] Select 30 outpatients seen within a 12 month period (R=retrospective [from records], P= prospective [those
currently being treated]). Sample of cases can be a combination of P and R
[B] Count number of drugs prescribed for each case ([B1]=Total no. of drugs). Count as 1 a drug given in different preparations, eg. paracetamol tablet and injection, two brands of a similar chemical entity/INN/generic name
[B2] Average no. of drugs prescribed = [B1]/Number of cases [C] Indicate 0 if no antibiotic prescribed and 1 if one or more types of antibiotics were given.
[C1]= Total cases with antibiotics. [D] Indicate 0 if no injection given and 1 if one or more injections were given. [D1]= Total cases with injection [E] From the number of drugs prescribed for the case, count those included on the EDL.
[E1] = total number of drugs listed in EDL
Public Health Facility
Facility #____ (1-30)

Survey form 7: Public Health Facility Rational Drug Use - Patient Care Form Indicators: % of drugs dispensed % drugs with adequate label % of patients who know how to take drugs
Facility Date
Location Investigator
Seq. No.
No. of drugs prescribed
[A]
No. of drugs dispensed
[B]
No. of drugs adequately labelled
[C]
Patient has adequate knowledge
(yes=1, no =0) [D] 1. 2. 3. 4. 5. 6. 7. 8. 9. 10. 11. 12. 13. 14. 15. 16. 17. 18. 19. 20. 21. 22. 23. 24. 25. 26. 27. 28. 29. 30. Total Total B = Total C = Total D = Average Percentage [B1]=% dispensed
= Total [B]/ No. prescribed x 100 =____
[C1]=% w/adequate label = Total [C]/ Total [B] x 100 = ____
[D1]=% of patients with adequate knowledge = Total [D]/cases asked x 100 =____
Notes [A] Interview 30 patients leaving the dispensing area/pharmacy [B] Check how many drugs (chemical entity/INN/generic) were given to each patient [C] Check which are adequately labelled (name of drug, dosage and duration plus any additional criteria specified
by country). A drug is adequately labelled only if all criteria are met. [D] Determine if patient has adequate knowledge about the drugs dispensed.
Ask patient if he/she knows how to take each drug. Indicate: (1) If patient can correctly give the name of all drugs or state what the drugs are for and how they should be
taken plus any additional criteria specified by country. (0) If the patient cannot give the name of even one drug, cannot state what a drug is for, does not know how to take one of the drugs given, or does not meet any additional criteria specified by country.
Public Health Facility
Facility #____ (1-30)

55
Survey form 8: Public Health Facility - Standard Treatment Guidelines / EDL Indicator: Availability of STG for common local conditions Availability of Essential Drug List (EDL) at the facility
Facility Date
Location Investigator
Tick box with correct answer
Standard treatment guidelines available Yes1 No
National STG
STG for URTI
STG for Diarrhoea
STG for Pneumonia
STG for Malaria
STG for Tuberculosis
Others:
EDL available Yes1 No
National EDL
Provincial/District
Primary EDL
Others:
STG is available in this facility2 Yes1 No
EDL is available in this facility3 Yes1 No
Notes 1. Mark “yes” only if the facility is able to show you the document. 2. The facility is considered to have an STG if any one of the above STGs is available provided it was
developed by an independent group and is not associated with promoting pharmaceutical products. 3. Before the survey, the most up-to-date version of EDL must be identified.
The facility is considered to have an EDL if any one of the above EDLs is available.
Public Health Facility
Facility #____ (1-30)

56
Survey form 9: Public Health Facility: Treatment of Diarrhoea, ARI, and Pneumonia Indicator: % tracer cases treated using recommended treatment
Facility Date
Location Investigator
Notes: Select at random 30 patients (10 with diarrhoea, 10 with ARI & 10 with pneumonia). Choose only single disease encounters. Always write 1 or 0 for all drugs enumerated. For assessment (level 1 & 2) write A, B, C, D or E on the appropriate spaces. % A= total number of As/total number of cases x 100. Repeat formula for B, C, D and E.
Cases (yes=1, no=0) Diseases/Drug prescribed 1 2 3 4 5 6 7 8 9 10
Total yes (1)/no. of cases x100
Diarrhoea in Children ORS Antibiotic
Antidiarrhoeal Antispasmodic Other drugs given Level 1 assessment (A, B) % A=___, % B=___ Level 1 assessment: A = appropriate = (all criteria: ORS 1, antibiotic 0, antidiarrhoeal 0, antispasmodic 0, other drug 0)
B = not appropriate = (one or all criteria: ORS 0, antibiotic 1, antidiarrhoeal 1, antispasmodic 1, other drug 1)
Non-pneumonia acute respiratory tract infection (ARI) Antibiotic prescribed Level 1 assessment (A, B) % A=___ % B=___ Antipyretic/analgesic Cough and/or cold drugs Other drugs given Level 2 assessment (C, D) % C=___ % D =___ Level 1 assessment: A = appropriate = (antibiotic 0) B = not appropriate = (antibiotic 1)
Level 2 assessment: (only if level 1 is A) C = appropriate = (all criteria: antipyretic/analgesic 1 or 0, cough/cold 1 or 0, other drug 0) D = not appropriate = (other drug 1)
Mild/moderate Pneumonia Benzylpenicillin Amoxicillin Cotrimoxazole No. of other antibiotics: 0 1 >1 Level 1 assessment (A, B, C)
% A=___ % B=___ % C=___
Antipyretic/analgesic Cough and/or cold drugs Other drugs given Level 2 assessment (D, E) % D=___ % E=___ Level 1 assessment A = appropriate = (only one: benzylpenicillin or amoxicillin or cotrimoxazole is 1, number of other types of antibiotic 0) B = not certain = if none of benzylpenicillin or amoxicillin or cotrimoxazole was prescribed, then no. of other types of antibiotic can be 0 or 1 (the other antibiotic may be appropriate or not) C = not appropriate = (any combination of benzylpenicillin, amoxicillin, cotrimoxazole and other type of antibiotics. It means more than one type of antibiotic was given in the case.
Level 2 assessment: only if level 1 is A D = appropriate = (all criteria: antipyretic/analgesic 1 or 0, cough/cold 1 or 0, other drug 0) E = not appropriate (other drugs 1)
Public Health Facility
Facility #____ (1-30)

57
Survey form 9 (cont.): Public Health Facility: Treatment of Other Tracer Diseases Indicator: % tracer cases treated using recommended treatment
Facility Date
Location Investigator
Note: Countries may choose to include other diseases for assessment of compliance to STG or recommended treatment protocol.
Cases (yes=1, no=0) Diseases/Drug prescribed
1 2 3 4 5 6 7 8 9 10
Total yes (1)/no. of cases x100
Tracer Disease 4: Drug/treatment prescribed: Assessment
Tracer Disease 5: Drug/Treatment Prescribed:
Assessment
Public Health Facility
Facility #____ (1-30)

58
Survey form 10: Household Indicator: Access to medicines Use of medicines 1. Have you or any members of the household been ill in the last 2 weeks? (exclude hospital admission) □ Yes □ No 2. Sex of person who has been ill* □ Male □ Female 3. Age (in years) of person who has been ill □ Under 1 □ 1–5 □ 6–15 □ 16–54 □ 55 and older 4. What were the person’s symptoms? (mark one or more) □ Diarrhoea □ Cough □ Fever □ Others (specify) _____________________________________________________________ 5. What was done? (mark one or more)
□ Consulted traditional healer □ Consulted public health clinic/hospital □ Consulted private health clinic/hospital □ Consulted pharmacist □ Consulted drug seller
□ Sought advice from friend/neighbour/family □ Bought medicine without consultation □ Used medicine left from another illness □ Did nothing (If no one was consulted, go to question 10)
6. What was the person’s diagnosis, if any? 7. Was medication prescribed? □ Yes □ No 8. Which medicines were obtained? □ All □ Some □ None
9. If not all, why not? (mark one or more)
□ Price was too high □ Did not have enough money □ Not able to borrow enough money □ Too many medicines were prescribed □ Did not believe all the medicines were needed □ Started to feel better □ No time to get all the medicines
□ Traditional healer did not have all the medicines □ Public pharmacy did not have all the medicines □ Private pharmacy did not have all the medicines □ Drug seller did not have all the medicines □ Already had some of the medicines at home □ Other
10. How much of the prescribed medicine was taken? □ All □ Some □ None
Amount spent (write 0 if free)
Mark an X through the source as numbered (1–9)
11. What medicines were used? (include traditional medicines) list one per line
Local US$
1. Traditional healer 2. Public health centre/ hospital 3. Private health centre/hospital 4. Public pharmacy 5. Private pharmacy
6. Local store/marketplace 7. Friends/neighbours/family 8. Medicines already owned 9. Other
1 2 3 4 5 6 7 8 9
1 2 3 4 5 6 7 8 9
1 2 3 4 5 6 7 8 9
1 2 3 4 5 6 7 8 9
1 2 3 4 5 6 7 8 9
1 2 3 4 5 6 7 8 9
1 2 3 4 5 6 7 8 9
12. Estimated family weekly income OR total household expenses last week Local ____________________ US$
* Record only one illness episode per household even if more than one person has been ill