ueda2016 symposium -the emerging ultra-long acting basal insulin- ibrahim el ibrashy
TRANSCRIPT

The Emerging ultra-long acting basal insulin
Insulin Degludec
Ibrahim El EbrashyProf. Internal Medicine
Head of the Diabetes & Endocrinology Center Faculty Of Medicine-Cairo University.


• Control fasting BG with one injection per day for all individuals
• Flexible dosing time
Longer duration of action
Lower risk of hypoglycaemiaFlat time-action profile
Potential for titration to lower FPG target without hypoglycaemia
(More predictable action)
Less day-to-day variability
Objectives of developing a new basal insulin
BG, blood glucose; FPG, fasting plasma glucose


MOP video


Half-life of insulin degludec is double that of insulin glargine
*Insulin glargine was undectable after 48 hoursResults from 66 patients with type 1 diabetes (T1D)IDeg, insulin degludec; IGlar, insulin glargineHeise et al. Diabetes 2011;60(Suppl. 1):LB11; Heise et al. Diabetologia 2011;54(Suppl. 1):S425
Insulin degludec Insulin glargine
0.4 U/kg 0.6 U/kg 0.8 U/kg 0.4 U/kg 0.6 U/kg 0.8 U/kg
Half-life (hours) 25.9 27.0 23.6 11.5 12.9 11.9
Mean half-life 25.4 12.1

Mean and individual blood glucose profiles during 42-hour clamp in T1D
Kurtzhals et al. Diabetologia 2011;54(Suppl. 1):S426; Diabetes 2011;60(Suppl. 1A):LB12
Figure shows mean and individual blood glucose profiles following once-daily s.c. dosing of IDeg (0.6 U/kg) for 8 days
Individual patient profileMean profile
Time since injection (hours)
Blo
od g
lucose level
(mm
ol/
L)

Flat time-action profile of insulin Degludec
0
1
2
3
0 4 8 12 16 20 24
GIR
(m
g/k
g/m
in)
Time (hours)
AUCGIR,0–12h AUCGIR,12–24h
AUCGIR,0–6h AUCGIR,6–12h AUCGIR,12–18h AUCGIR,18–24h
AUCx–y, area under the curve for a specified time interval after injectionGIR, glucose infusion rateType 2 diabetes, 49 patients, randomised, 2-period, 12-day trialVariability was assessed at steady state by clamps on days 6 and 12

Insulin Degludec has 4 times lower variabilitythan insulin Glargine
0
20
40
60
80
100
120
140
160
180
200
220 IDegIGlar
Area under the GIR curve (time interval, hours)
Day-t
o-d
ay v
ariability
(coeffic
ient
of variation %
)
Endpoint IDeg CV (%) IGlar CV (%) p value
AUCGIR,0-24h 20 82 p<0.0001
Heise et al. Diabetes Obes Metab 2012;14:859-64; 54 patients with type 1 diabetes


Flexible and convenient dosing

Steady state in a biological systemInsulin with a T½ of ~ 24 h
Input
Output
Depot
Injected s.c.
In s.c.
Eliminated(at receptors)
5U
10U10UDay 1:
ClinicalSteadyState
10UDay 2: 15U
~9U
10UDay 3: 17.5U
~10U
10UDay 4: 19U
10U
10UDay 5: 20U
7.5U

Insulin degludec concentration reaches steady state in 3 days
54320 1 6
Days since first dose
Seru
m I
Deg c
oncentr
ation
Pro
port
ion o
f D
ay 6
level (%
)
120
110
100
90
80
70
60
50
40
30
20
10
0
Type 2 diabetes
0 1 2 3 4
Seru
m I
Deg c
oncentr
ation
Pro
port
ion o
f D
ay 4
level (%
)
120
110
100
90
80
70
60
50
40
30
20
10
0
Days since first dose
Type 1 diabetes
Type 1 diabetes trial, n=66; Type 2 diabetes trial, n=49T1D trial, 0.4, 0.6 or 0.8 U/kg; T2D trial, 0.4, 0.6 or 0.8 U/ kgEstimated ratios and 95% CIHeise et al. Diabetes 2012;61(Suppl. 1):A259

Pharmacokinetics of insulin degludec in special populations Age
Hepatic functionRenal function
Geriatric (≥65)Younger adults (18–35)
The PK properties of insulin degludec are not affected by increasing age, renal impairment or hepatic impairment
0
2000
4000
6000
8000
10000
0 4 8 12 16 20 24
Insulin d
eglu
dec
concentr
ation (
pm
ol/
L)
Time since injection (hours)
Normal
Mild
Moderate
Severe
0
2000
4000
6000
8000
10000
0 4 8 12 16 20 24
Insulin d
eglu
dec
concentr
ation (
pm
ol/
L)
Time since injection (hours)
Normal
Child-Pugh A
Child-Pugh B
Child-Pugh C
0 4 8 12 16 20 24
Time since injection (hours)
2000
4000
6000
8000
10000
Insulin d
eglu
dec
concentr
ation (
pm
ol/
L)
0
PK, pharmacokineticKupčová et al. Clin Drug Investig 2014;34:127–33; Kiss et al. Clin Pharmacokinet 2014;53:175–83; Korsatko et al. Drugs Aging 2014;31:47–53

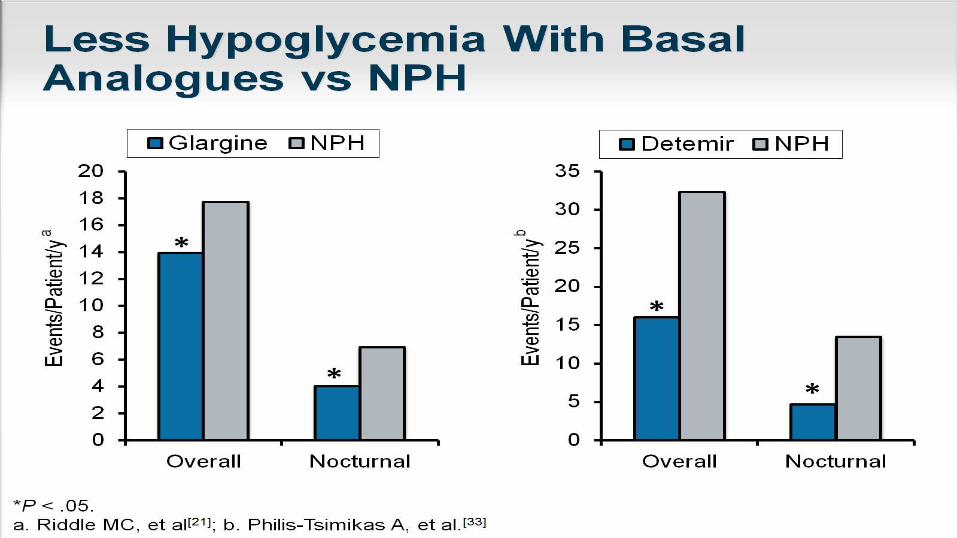
Hypoglycaemia


Summary


Insulin degludec:
•Shows significantly lower rates of both overall and nocturnal confirmed hypoglycaemia in T2D
•Lower hypoglycaemia rates are especially evident in insulin-naïve patients with T2D based on meta-analysis results
•Allows for flexibility in the timing of insulin administration when needed, without compromising glycaemic control or hypoglycaemia


Thank You