ü meghan bargar – assistant principal student services · · 2017-08-22ü meghan bargar –...
TRANSCRIPT
ü Meghan Bargar – Assistant Principal Student Servicesü Wilbur Borrero - Deanü Laureen Carl – Career Technology Educationü Jamie D’Andrea–Teachers’ Associationü Andrew Ehrhardt - Social Studiesü Aryan Haren - Assistant Principal C & Iü Trey Hickey - Fine Artsü Bradford Hubbard – Principalü Kirk Langenkamp–Student Servicesü Barb Mason - ILC Directorü Oscar Najera–World Languagesü Marni Polakow - Physical Educationü Helene Schulze– Special Educationü Kelly Taylor – Englishü Stacy Terlep - Scienceü Megan Webster - Mathematics
D117 Mission
Belief 1
Belief 2
Belief 3Belief 4
Belief 5
Belief 6
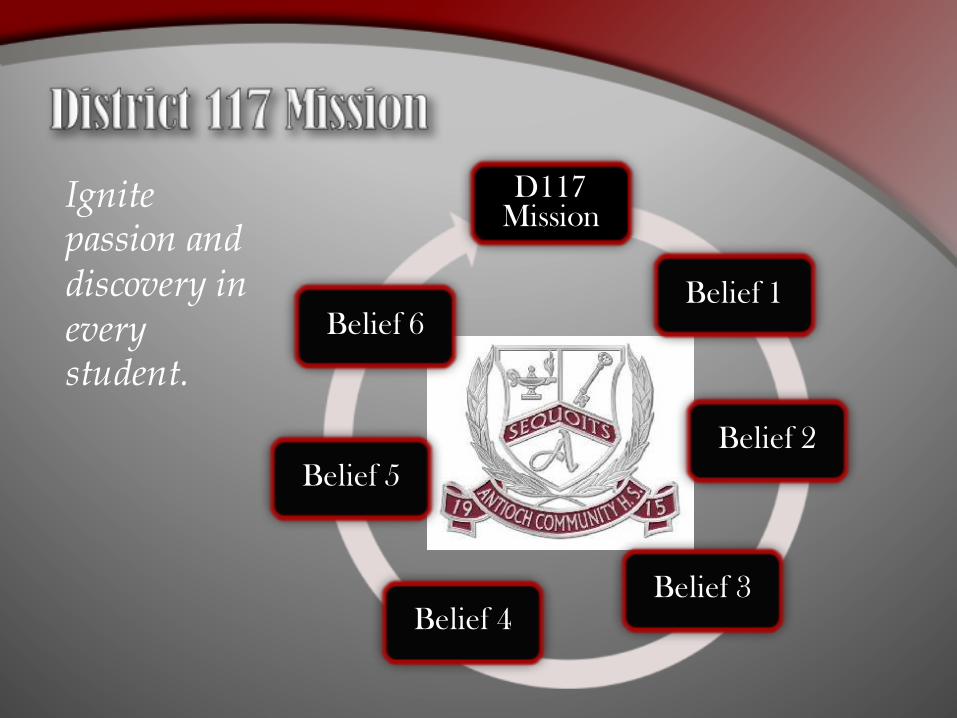
Ignite passion and discovery in every student.

The unique potential of each student is cultivated.Belief 1
School climate is safe, supportive and respectful.
The curriculum is rigorous, relevant and engaging.
All staff members are highly skilled and compassionate.
A strong partnership between school and home is established.
Resources are managed responsibly and efficiently.
Student Achievement and Growth are Maximized when:
Belief 2
Belief 3
Belief 4
Belief 5
Belief 6
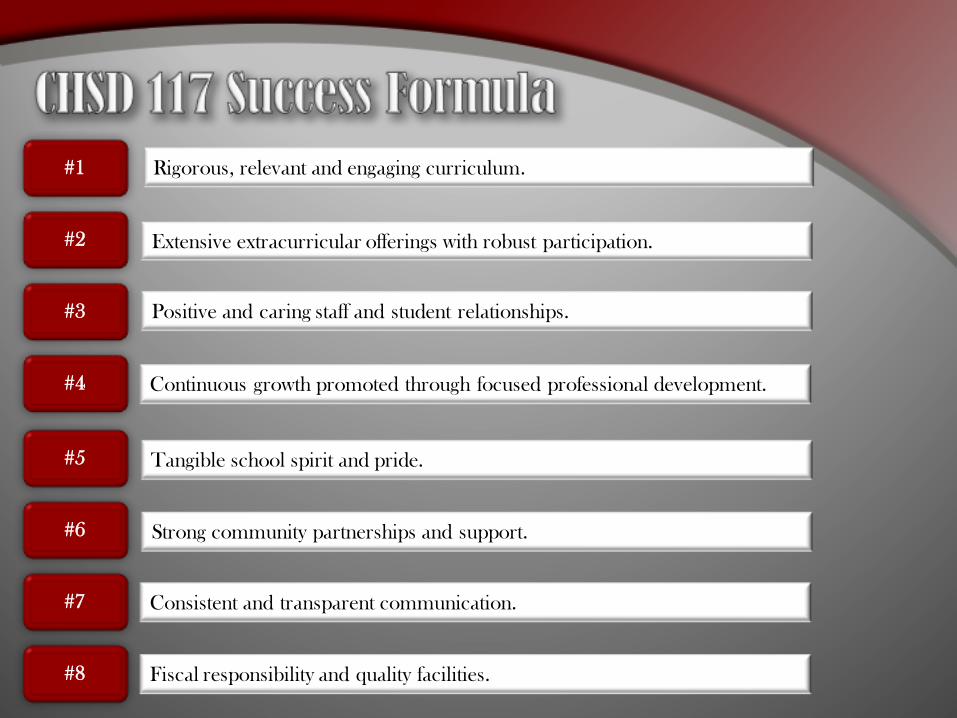
Fiscal responsibility and quality facilities.
#2
#4
#5
#6
#7
#8
#3
Extensive extracurricular offerings with robust participation.
Positive and caring staff and student relationships.
Tangible school spirit and pride.
Strong community partnerships and support.
Consistent and transparent communication.
#1 Rigorous, relevant and engaging curriculum.
Continuous growth promoted through focused professional development.
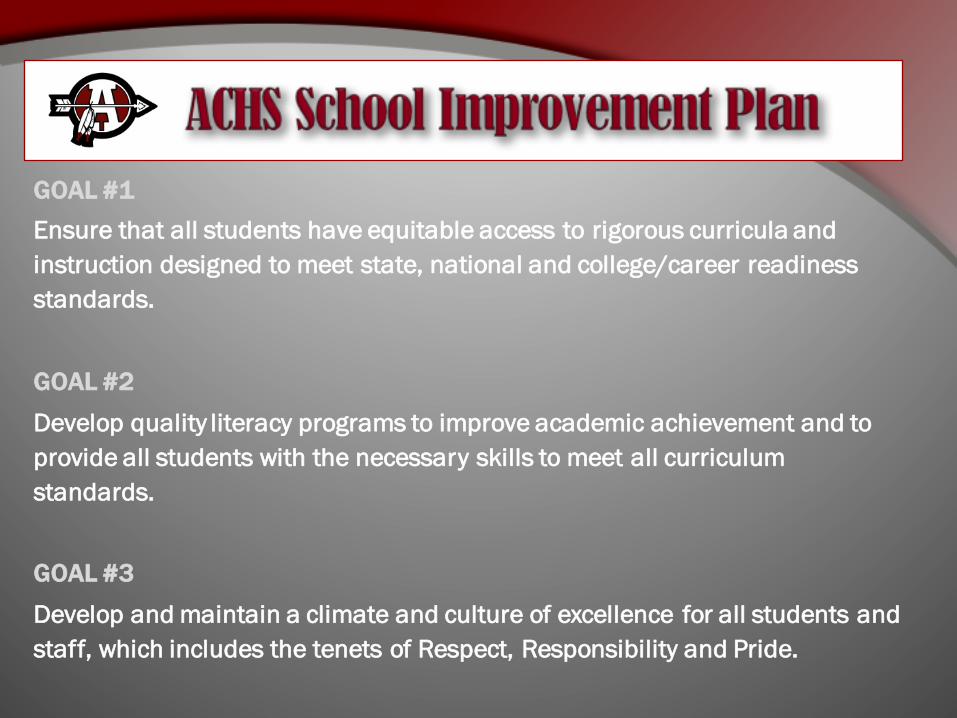
GOAL #1Ensure that all students have equitable access to rigorous curricula and instruction designed to meet state, national and college/career readiness standards.
GOAL #2
Develop quality literacy programs to improve academic achievement and to provide all students with the necessary skills to meet all curriculum standards.
GOAL #3
Develop and maintain a climate and culture of excellence for all students and staff, which includes the tenets of Respect, Responsibility and Pride.
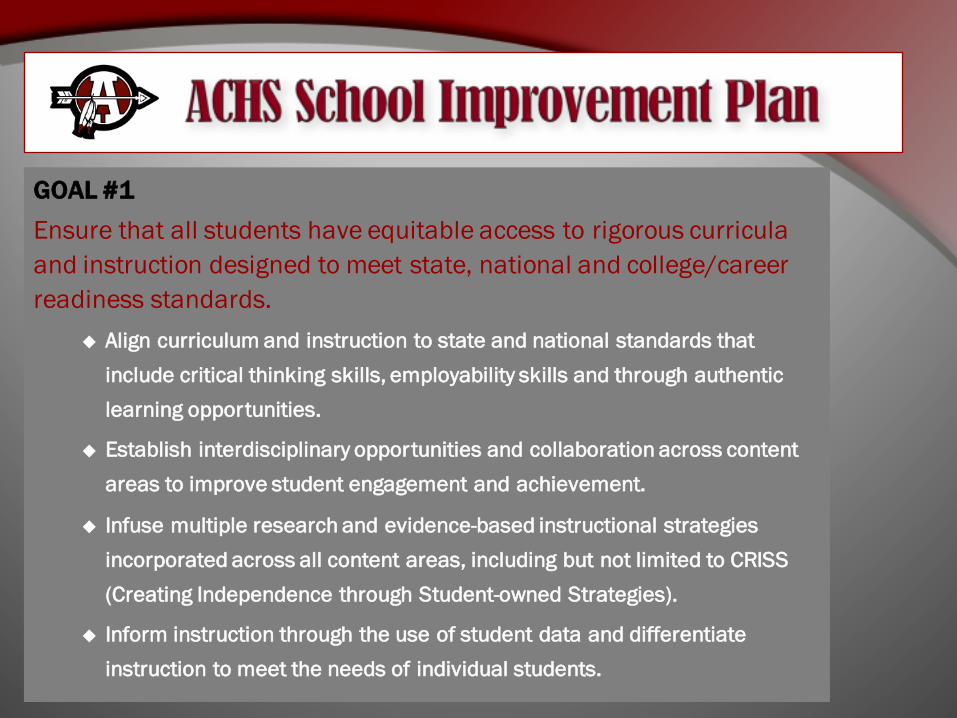
GOAL #1Ensure that all students have equitable access to rigorous curricula and instruction designed to meet state, national and college/career readiness standards.
u Align curriculum and instruction to state and national standards that include critical thinking skills, employability skills and through authentic learning opportunities.
u Establish interdisciplinary opportunities and collaboration across content areas to improve student engagement and achievement.
u Infuse multiple research and evidence-based instructional strategies incorporated across all content areas, including but not limited to CRISS (Creating Independence through Student-owned Strategies).
u Inform instruction through the use of student data and differentiate instruction to meet the needs of individual students.
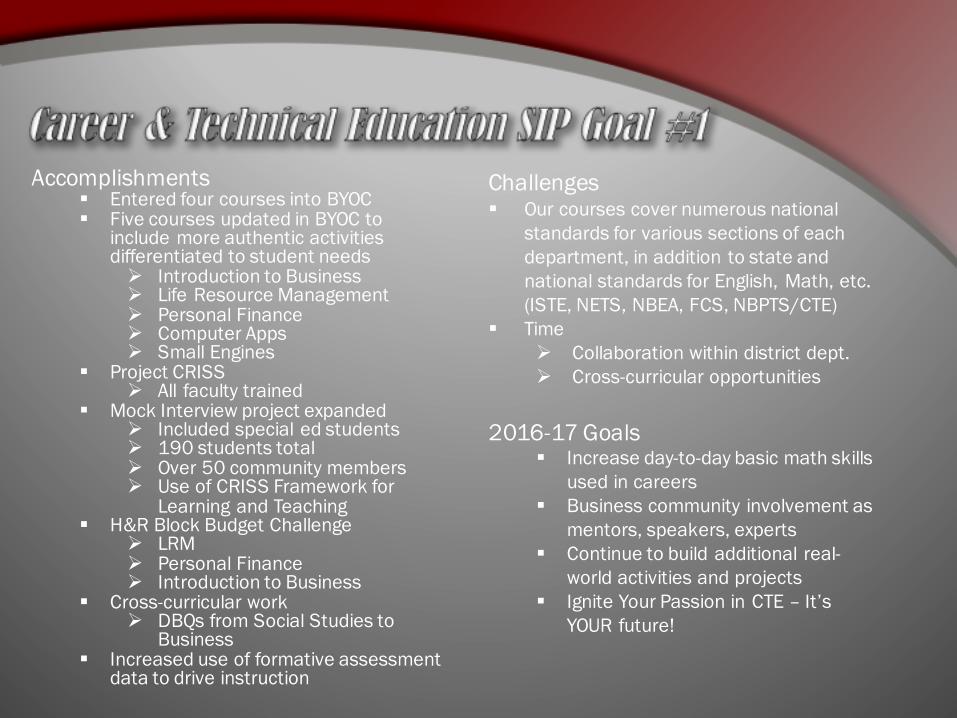
Accomplishments§ Entered four courses into BYOC§ Five courses updated in BYOC to
include more authentic activities differentiated to student needsØ Introduction to BusinessØ Life Resource ManagementØ Personal FinanceØ Computer AppsØ Small Engines
§ Project CRISSØ All faculty trained
§ Mock Interview project expanded Ø Included special ed studentsØ 190 students totalØ Over 50 community membersØ Use of CRISS Framework for
Learning and Teaching§ H&R Block Budget Challenge
Ø LRMØ Personal FinanceØ Introduction to Business
§ Cross-curricular workØ DBQs from Social Studies to
Business§ Increased use of formative assessment
data to drive instruction
Challenges§ Our courses cover numerous national
standards for various sections of each department, in addition to state and national standards for English, Math, etc. (ISTE, NETS, NBEA, FCS, NBPTS/CTE)
§ TimeØ Collaboration within district dept.Ø Cross-curricular opportunities
2016-17 Goals§ Increase day-to-day basic math skills
used in careers§ Business community involvement as
mentors, speakers, experts§ Continue to build additional real-
world activities and projects§ Ignite Your Passion in CTE – It’s
YOUR future!
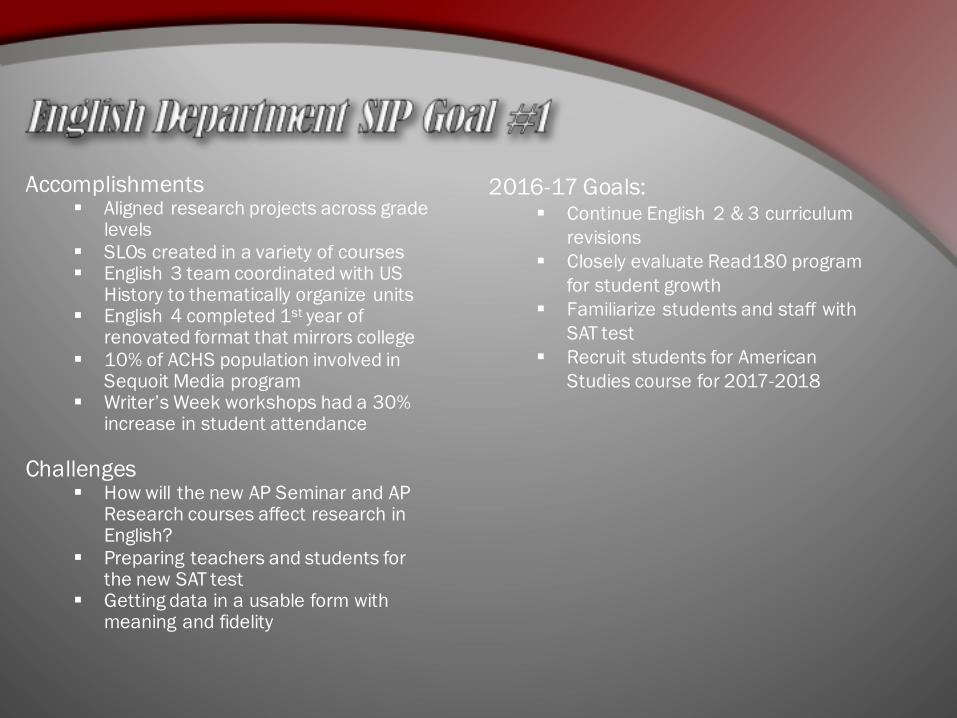
Accomplishments§ Aligned research projects across grade
levels§ SLOs created in a variety of courses§ English 3 team coordinated with US
History to thematically organize units§ English 4 completed 1st year of
renovated format that mirrors college§ 10% of ACHS population involved in
Sequoit Media program§ Writer’s Week workshops had a 30%
increase in student attendance
Challenges§ How will the new AP Seminar and AP
Research courses affect research in English?
§ Preparing teachers and students for the new SAT test
§ Getting data in a usable form with meaning and fidelity
2016-17 Goals:§ Continue English 2 & 3 curriculum
revisions§ Closely evaluate Read180 program
for student growth§ Familiarize students and staff with
SAT test§ Recruit students for American
Studies course for 2017-2018
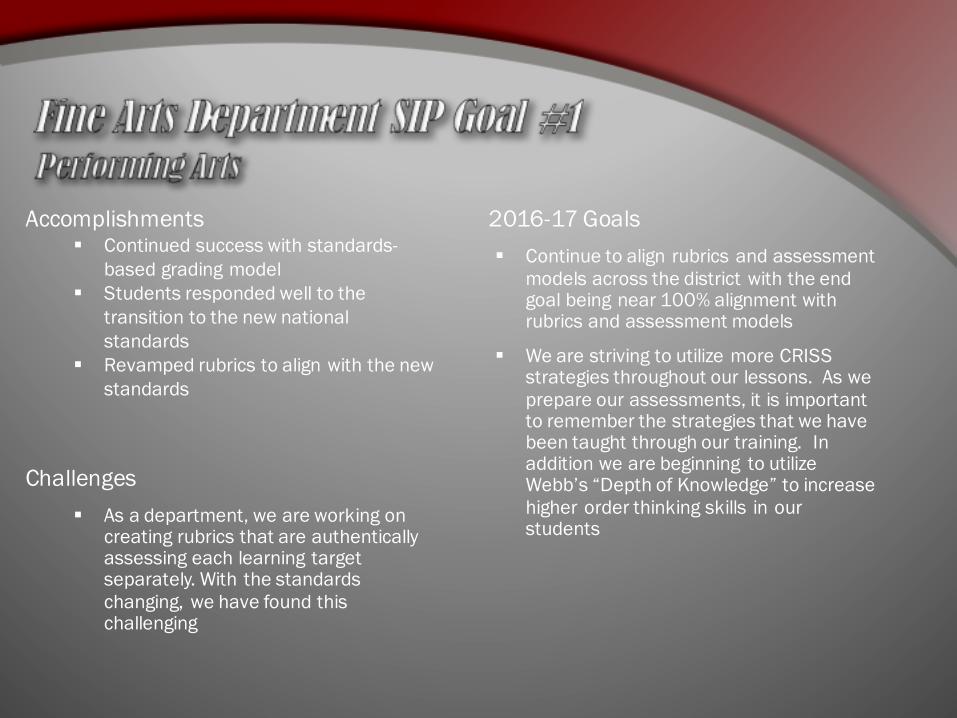
Accomplishments§ Continued success with standards-
based grading model§ Students responded well to the
transition to the new national standards
§ Revamped rubrics to align with the new standards
Challenges§ As a department, we are working on
creating rubrics that are authentically assessing each learning target separately. With the standards changing, we have found this challenging
2016-17 Goals§ Continue to align rubrics and assessment
models across the district with the end goal being near 100% alignment with rubrics and assessment models
§ We are striving to utilize more CRISS strategies throughout our lessons. As we prepare our assessments, it is important to remember the strategies that we have been taught through our training. In addition we are beginning to utilize Webb’s “Depth of Knowledge” to increase higher order thinking skills in our students

Accomplishments§ Became more comfortable and found
success using the standards-based grading model for the second year
§ Revamped current rubrics to reflect the SBG model and the new national standards
§ Implemented language from national AP rubrics into project rubrics
Challenges§ As a department, we are working on
creating rubrics that are authentically assessing each learning target separately. With the standards changing, we have found this challenging
2016-17 Goals
§ Continue to align rubrics and assessment models across the district with the end goal being near 100% alignment with rubrics and assessment models
§ We are striving to utilize more CRISS strategies throughout our lessons. As we prepare our assessments, it is important to remember the strategies that we have been taught through our training. In addition we are beginning to utilize Webb’s “Depth of Knowledge” to increase higher order thinking skills in our students
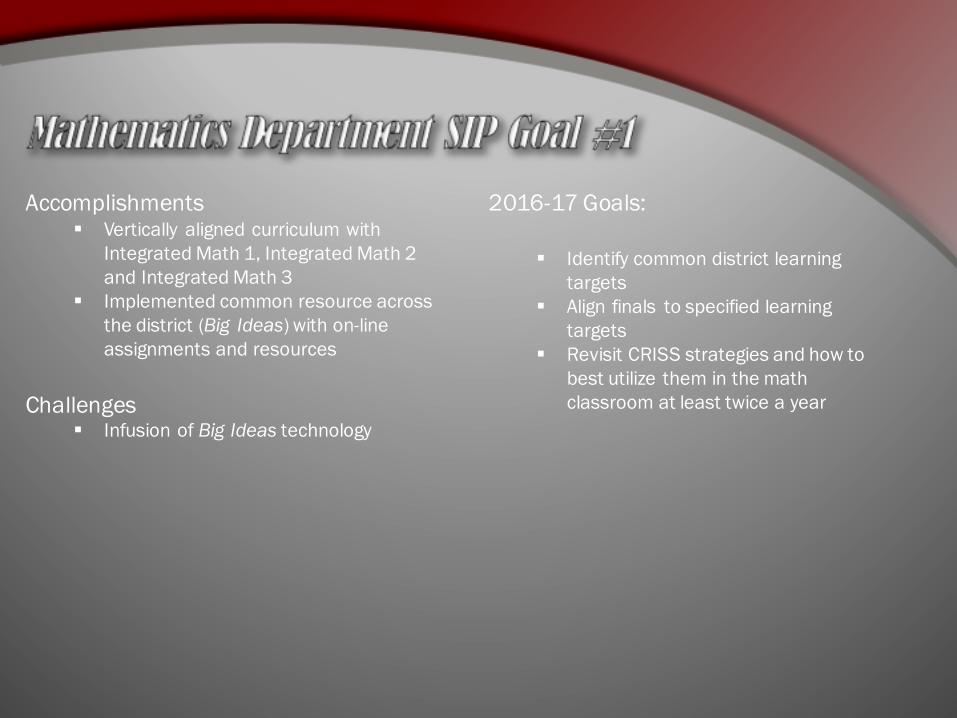
Accomplishments§ Vertically aligned curriculum with
Integrated Math 1, Integrated Math 2 and Integrated Math 3
§ Implemented common resource across the district (Big Ideas) with on-line assignments and resources
Challenges§ Infusion of Big Ideas technology
2016-17 Goals:
§ Identify common district learning targets
§ Align finals to specified learning targets
§ Revisit CRISS strategies and how to best utilize them in the math classroom at least twice a year
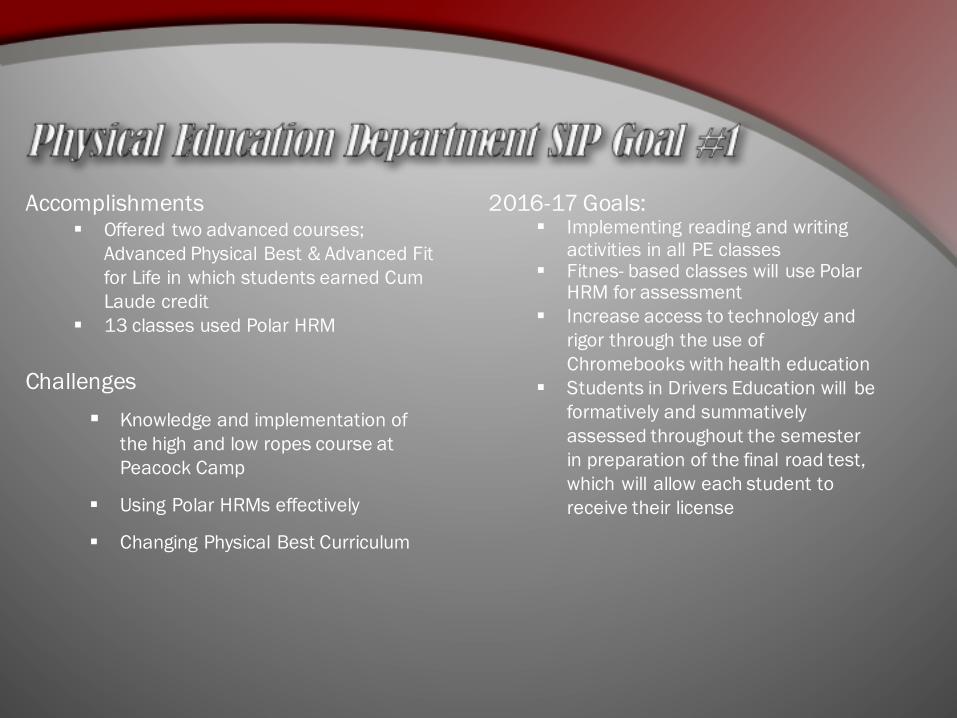
Accomplishments§ Offered two advanced courses;
Advanced Physical Best & Advanced Fit for Life in which students earned Cum Laude credit
§ 13 classes used Polar HRM
Challenges§ Knowledge and implementation of
the high and low ropes course at Peacock Camp
§ Using Polar HRMs effectively
§ Changing Physical Best Curriculum
2016-17 Goals:§ Implementing reading and writing
activities in all PE classes§ Fitnes- based classes will use Polar
HRM for assessment§ Increase access to technology and
rigor through the use of Chromebooks with health education
§ Students in Drivers Education will be formatively and summativelyassessed throughout the semester in preparation of the final road test, which will allow each student to receive their license

Accomplishments§ Designed and implemented NGSS
through summer work and curriculum time
§ Collaborated with math team on ways to connect key concepts
§ All teachers have been CRISS trained and have had updates led by Tom Deichsel on uses of strategies.
§ Three individuals used standards-based grading to help narrow learning gaps
§ Offered 5 Advanced Placement classes with a total of 10 sections
Challenges§ The number of cross curricular
activities has not been real high without time to meet and work together
2016-17 Goals:§ Work through the newly implemented
earth science standards that have been placed within the physics, chemistry, and biology curriculums
§ Create content team collaborative time to design and analyze common formative assessments within building and summative assessments across district
§ Due to the implementation of Next Generation Science Standards for the 2016-2017 school year, our goals is to continue to align curriculum, instruction, and assessment to NGSS in Physics, Chemistry, and Biology, specifically the Science and Engineering practices and use best practices to help students meet these standards
§ CRISS training for the new teachers in the department

Accomplishments§ Democracy School acceptance§ Voter Registration Drive§ Development of and collaboration on
question and discussion techniques§ Common DBQ Practices throughout
required SS courses§ Use of document readers in all US
History courses§ Professional Development focused on
engagement and student achievement§ Constitutional Rights Foundation of
Chicago§ Gilder Lehrmann Summer Institutes§ Illinois Civic Mission Coalition
Convening
Challenges§ Continue to focus on the intellectual
engagement of students and seek interdisciplinary connections
§ Challenge students to advance their reading and writing skills
§ Provide a culture in which students can develop their ability to understand, evaluate, and articulate ideas
2016-17 Goals:
§ Individually review the Illinois Learning Standards for Social Science 9-12 and analyze what is expected. The purpose behind this step is to clearly understand what exists within the standards regarding expectations
§ Examine the endurance, leverage, and readiness of the standards in order to identify the power standards for each Social Studies class. These standards will become the basis for developing assessment, instructional design, grading, and reporting
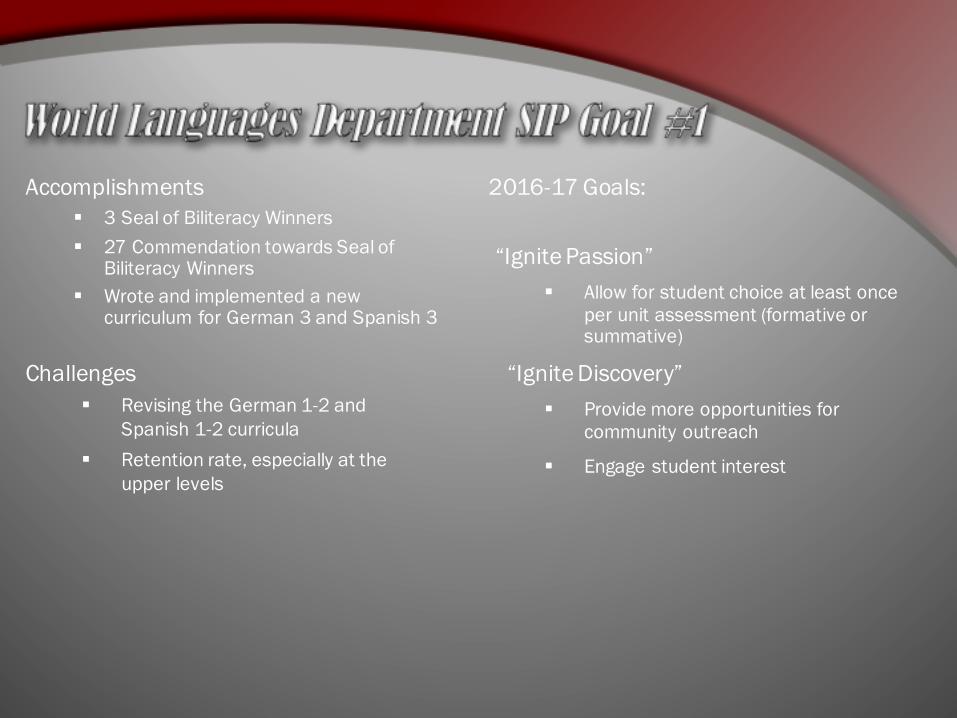
Accomplishments§ 3 Seal of Biliteracy Winners§ 27 Commendation towards Seal of
Biliteracy Winners§ Wrote and implemented a new
curriculum for German 3 and Spanish 3
Challenges§ Revising the German 1-2 and
Spanish 1-2 curricula § Retention rate, especially at the
upper levels
2016-17 Goals:
“Ignite Passion”§ Allow for student choice at least once
per unit assessment (formative or summative)
“Ignite Discovery”§ Provide more opportunities for
community outreach
§ Engage student interest
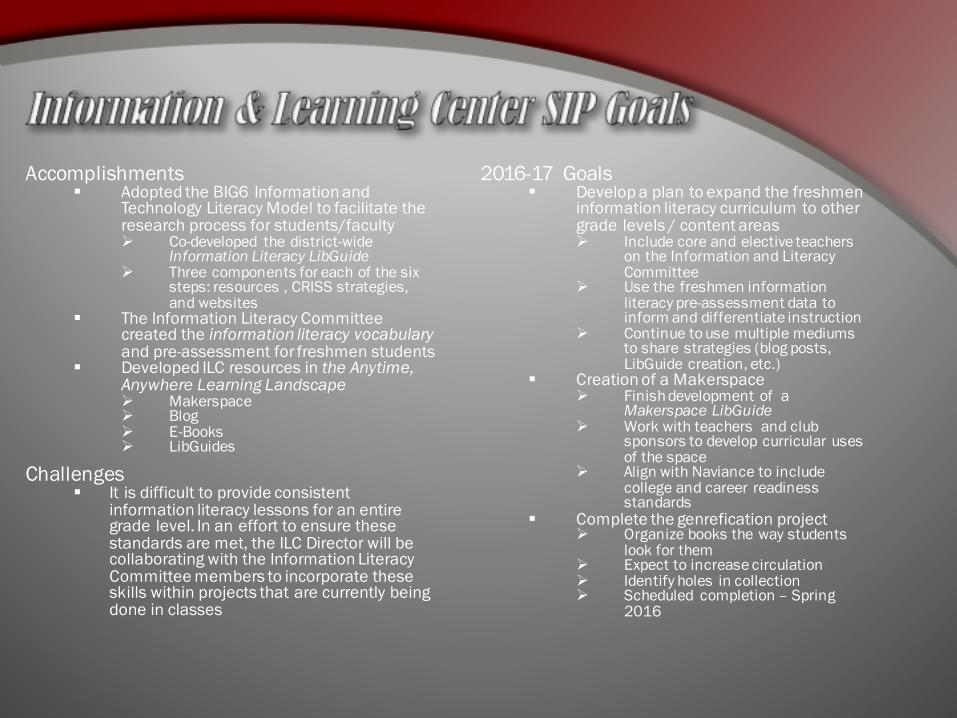
Accomplishments§ Adopted the BIG6 Information and
Technology Literacy Model to facilitate the research process for students/facultyØ Co-developed the district-wide
Information Literacy LibGuideØ Three components for each of the six
steps: resources , CRISS strategies, and websites
§ The Information Literacy Committee created the information literacy vocabularyand pre-assessment for freshmen students
§ Developed ILC resources in the Anytime, Anywhere Learning LandscapeØ MakerspaceØ BlogØ E-BooksØ LibGuides
Challenges§ It is difficult to provide consistent
information literacy lessons for an entire grade level. In an effort to ensure these standards are met, the ILC Director will be collaborating with the Information Literacy Committee members to incorporate these skills within projects that are currently being done in classes
2016-17 Goals§ Develop a plan to expand the freshmen
information literacy curriculum to other grade levels / content areasØ Include core and elective teachers
on the Information and Literacy Committee
Ø Use the freshmen information literacy pre-assessment data to inform and differentiate instruction
Ø Continue to use multiple mediums to share strategies (blog posts, LibGuide creation, etc.)
§ Creation of a MakerspaceØ Finish development of a
Makerspace LibGuideØ Work with teachers and club
sponsors to develop curricular uses of the space
Ø Align with Naviance to include college and career readiness standards
§ Complete the genrefication projectØ Organize books the way students
look for themØ Expect to increase circulationØ Identify holes in collectionØ Scheduled completion – Spring
2016

GOAL #2Develop quality literacy programs to improve academic achievement and to provide all students with the necessary skills to meet all curriculum standards.
u Develop and implement a comprehensive process of identifying struggling readers and writers, and afford these students access to appropriate research-based interventions and supports.
u Create a common language with regards to research literacy for use across all content areas.
u Identify and adopt specific academic vocabulary as a focus for each grade level (departmental and global).

GOAL #3Develop and maintain a climate and culture of excellence for all students and staff, which includes the tenets of Respect, Responsibility and Pride.
u Provide positive, safe learning environment in which students will be provided multiple opportunities to be successful and be recognized for positive choices and decision-making.
u Create a focus on creating more ways for students and families to be engaged in academic decision-making and the school planning process.
u Students are provided with supports and opportunities for social and emotional learning.
u Foster and expand partnerships with stakeholders to enhance opportunities for career development and community volunteerism.
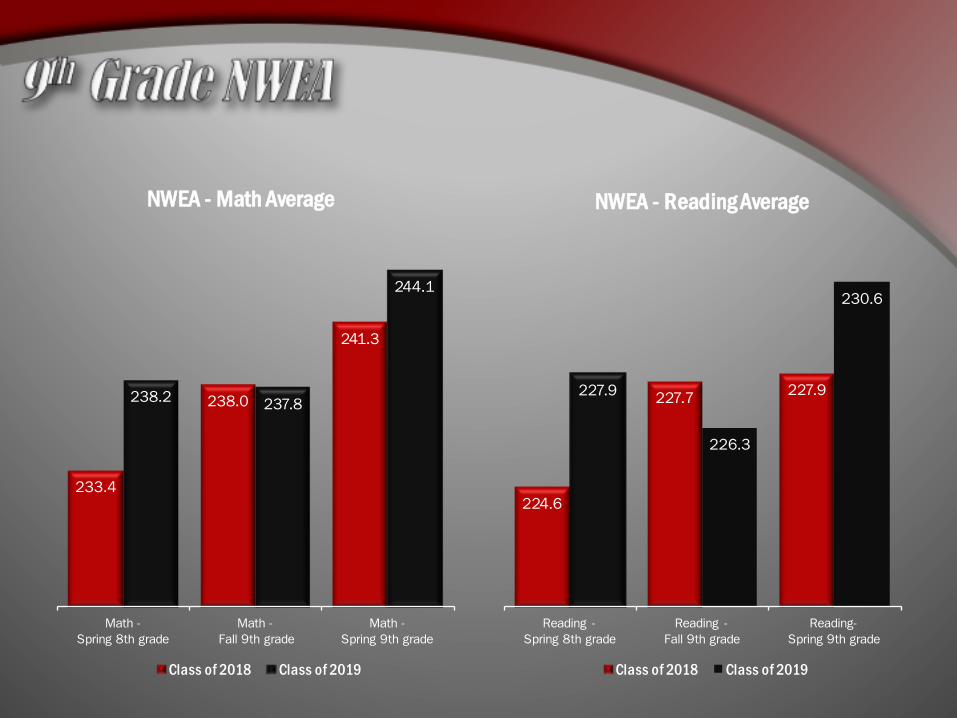
233.4
238.0
241.3
238.2 237.8
244.1
Math -Spring 8th grade
Math -Fall 9th grade
Math -Spring 9th grade
NWEA - Math Average
Class of 2018 Class of 2019
224.6
227.7 227.9227.9
226.3
230.6
Reading -Spring 8th grade
Reading -Fall 9th grade
Reading-Spring 9th grade
NWEA - Reading Average
Class of 2018 Class of 2019

20.8 21.021.8 22.1
20.6
22.321.6 21.3 21.5
US Avg (2016) Class of 2010 Class of 2011 Class of 2012 Class of 2013 Class of 2014 Class of 2015 Class of 2016 Class of 2017

20.1
20.6
21.3
20.8 20.8
21.0
21.2
21.8
21.5 21.5
English Mathematics Reading Science Composite
US Avg (2016)
Class of 2017

18
22 2223
21.2 20.921.5 21.2
English Math Reading Science
ACT Becnhmarks for College Readiness
Class of 2016 ACT Scores

Practice Explore
Practice PLAN
15.5 15.6 15.9 15.816.4 16.6 16.8
0.0 0.0 0.0 0.0
17.9 17.5 17.4
18.8 18.819.5
18.719.5
18.6
22.1
20.6
22.321.6 21.3 21.5
Class 2012 Class 2013 Class 2014 Class 2015 Class 2016 Class 2017 Class 2018
Explore 8th Grade Explore 9th Grade Plan ACT
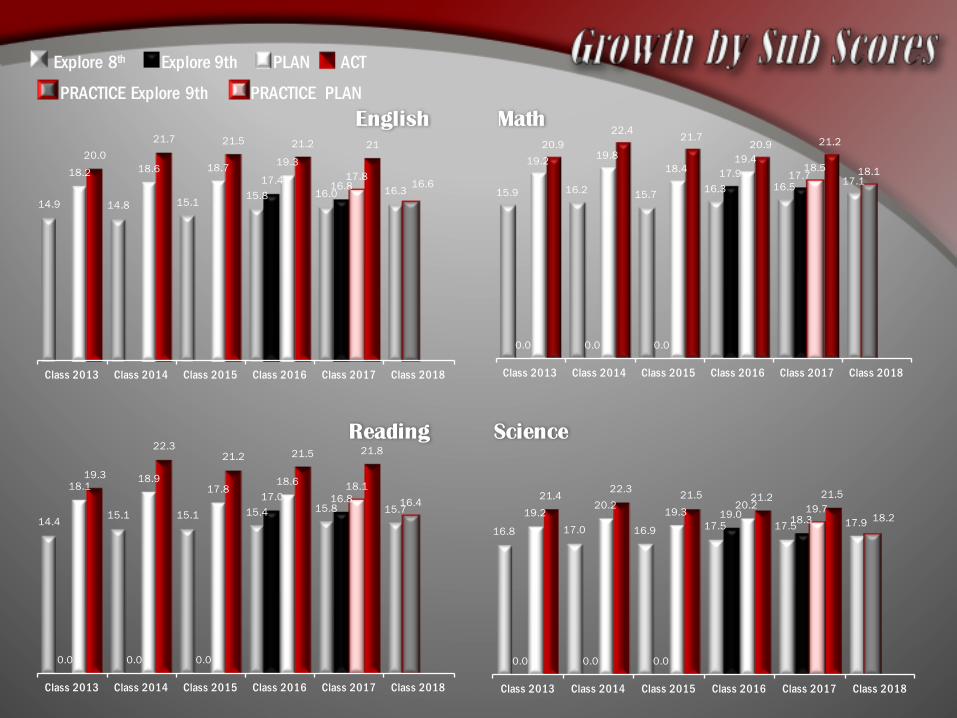
English Math
Reading Science
Explore 8th Explore 9th PLAN ACT
14.9 14.8 15.1 15.8 16.0 16.317.4 16.8 16.6
18.2 18.6 18.7 19.317.8
20.021.7 21.5 21.2 21
Class 2013 Class 2014 Class 2015 Class 2016 Class 2017 Class 2018
15.9 16.2 15.7 16.3 16.5 17.1
0.0 0.0 0.0
17.9 17.7 18.119.2 19.8
18.419.4
18.5
20.922.4 21.7
20.9 21.2
Class 2013 Class 2014 Class 2015 Class 2016 Class 2017 Class 2018
14.4 15.1 15.1 15.4 15.8 15.7
0.0 0.0 0.0
17.0 16.8 16.418.1
18.917.8
18.6 18.119.3
22.321.2 21.5 21.8
Class 2013 Class 2014 Class 2015 Class 2016 Class 2017 Class 2018
16.8 17.0 16.9 17.5 17.5 17.9
0.0 0.0 0.0
19.0 18.3 18.219.220.2
19.320.2 19.7
21.422.3 21.5 21.2 21.5
Class 2013 Class 2014 Class 2015 Class 2016 Class 2017 Class 2018
PRACTICE Explore 9th PRACTICE PLAN
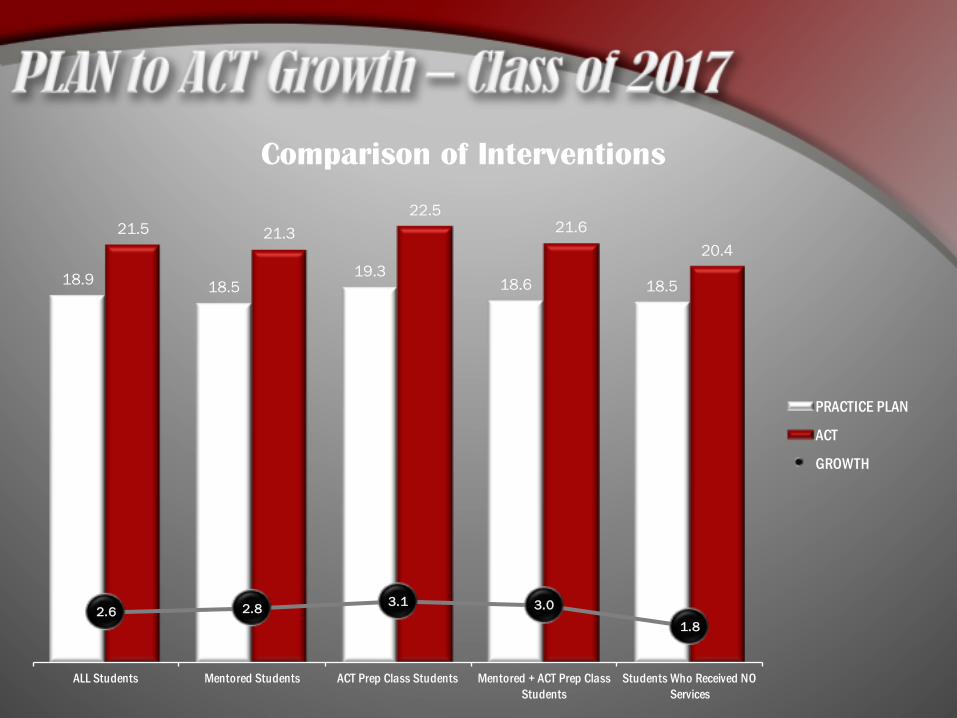
Comparison of Interventions
18.9 18.519.3
18.6 18.5
21.5 21.322.5
21.620.4
2.6 2.8 3.1 3.0
1.8
ALL Students Mentored Students ACT Prep Class Students Mentored + ACT Prep Class Students
Students Who Received NO Services
PRACTICE PLAN
ACT
GROWTH
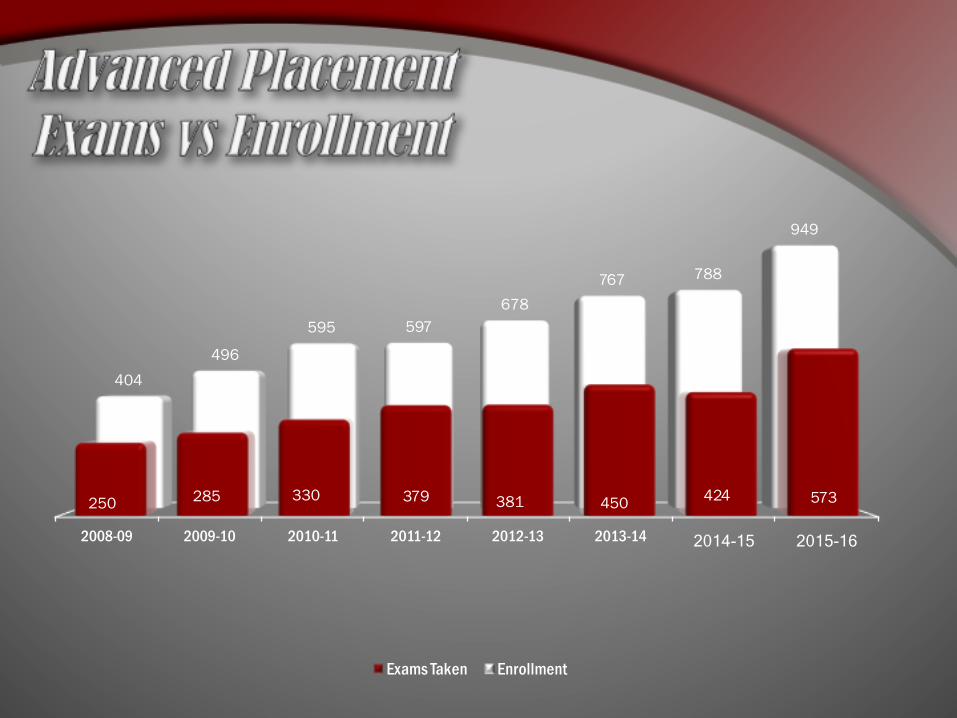
2008-09 2009-10 2010-11 2011-12 2012-13 2013-14 2014-15 2015-16
250 285 330 379 381 450 424 573
404496
595 597678
767 788
949
Exams Taken Enrollment
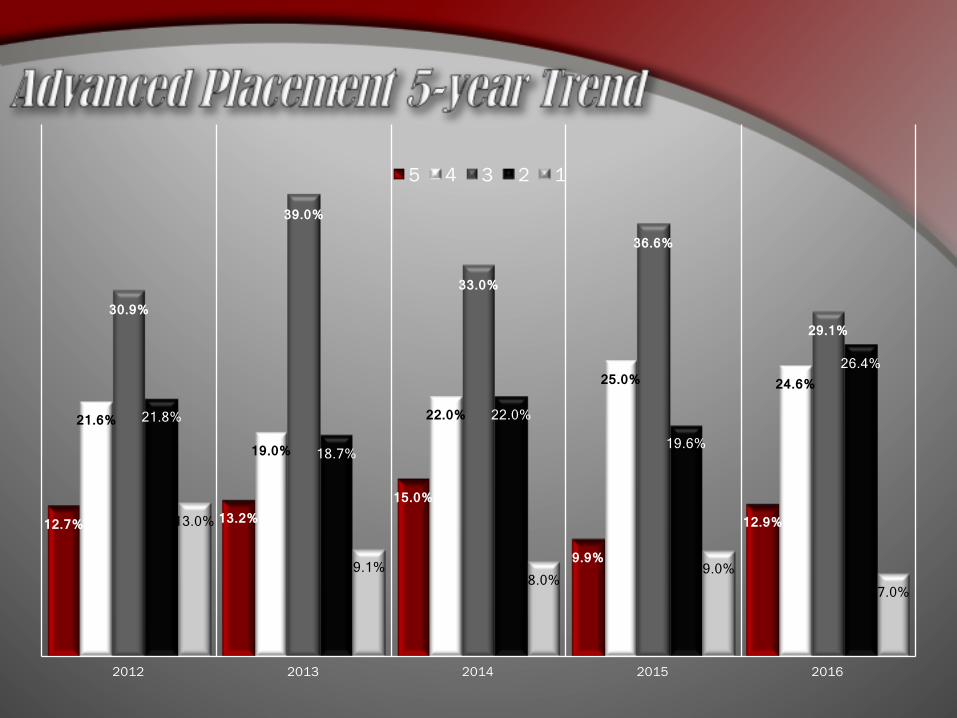
12.7% 13.2% 15.0%
9.9%
12.9%
21.6%
19.0%
22.0%
25.0% 24.6%
30.9%
39.0%
33.0%
36.6%
29.1%
21.8%
18.7%
22.0%
19.6%
26.4%
13.0%
9.1% 8.0%
9.0% 7.0%
2012 2013 2014 2015 2016
5 4 3 2 1
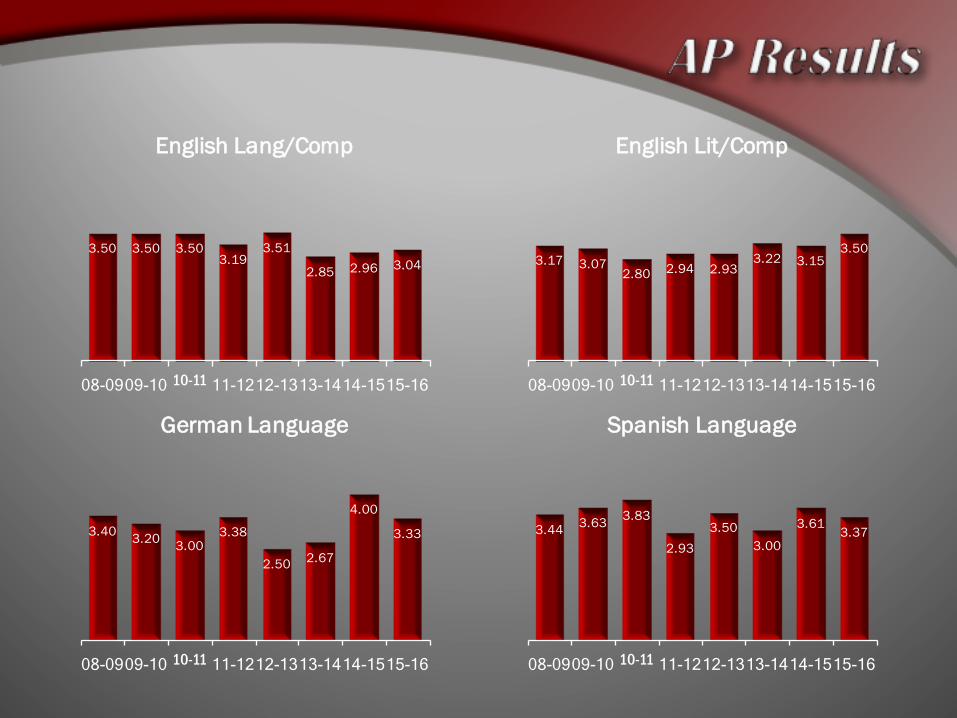
3.50 3.50 3.503.19
3.51
2.85 2.96 3.04
08-09 09-10 10-11 11-12 12-13 13-14 14-15 15-16
English Lang/Comp
3.17 3.072.80 2.94 2.93
3.22 3.153.50
08-09 09-10 10-11 11-12 12-13 13-14 14-15 15-16
English Lit/Comp
3.40 3.20 3.003.38
2.50 2.67
4.00
3.33
08-09 09-10 10-11 11-12 12-13 13-14 14-15 15-16
German Language
3.44 3.63 3.83
2.933.50
3.00
3.613.37
08-09 09-10 10-11 11-12 12-13 13-14 14-15 15-16
Spanish Language

2.96 2.83 2.71
1.87
3.23 3.21 3.07 2.94
08-09 09-10 10-11 11-12 12-13 13-14 14-15 15-16
Biology
3.57 3.56
2.88 2.663.14
2.83
08-09 09-10 10-11 11-12 12-13 13-14 14-15 15-16
Chemistry
4.00 4.00 4.00
3.17 3.27
08-09 09-10 10-11 11-12 12-13 13-14 14-15 15-16
Enviornmental Science
4.00 4.00 3.804.17 4.20
08-09 09-10 10-11 11-12 12-13 13-14 14-15 15-16
Physics C: Mechanics
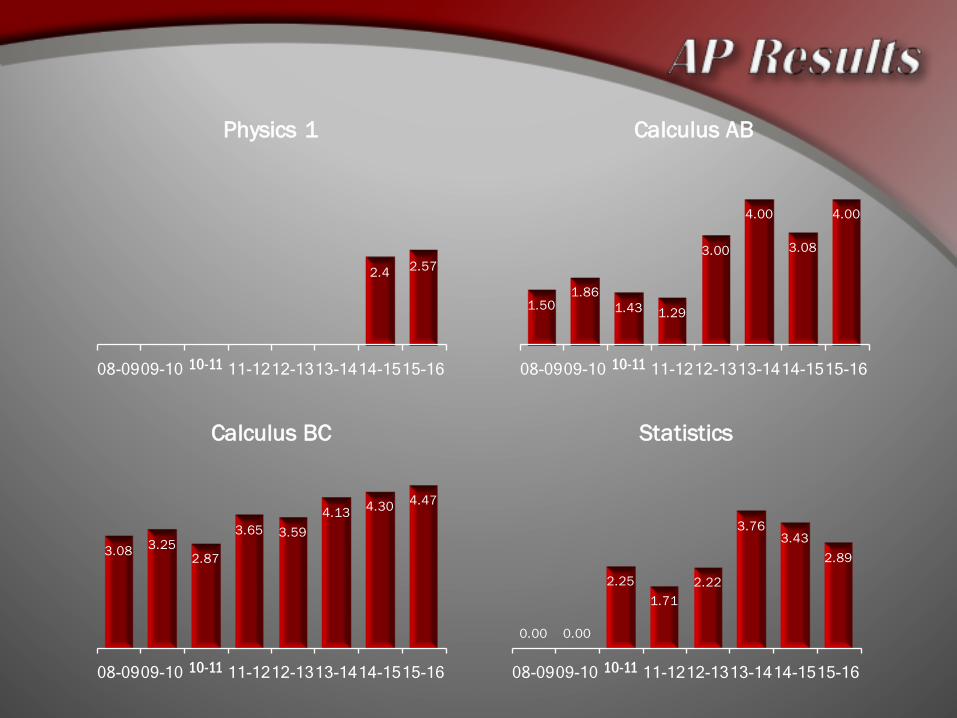
2.4 2.57
08-09 09-10 10-11 11-12 12-13 13-14 14-15 15-16
Physics 1
1.501.86
1.43 1.29
3.00
4.00
3.08
4.00
08-09 09-10 10-11 11-12 12-13 13-14 14-15 15-16
Calculus AB
3.08 3.252.87
3.65 3.594.13 4.30 4.47
08-09 09-10 10-11 11-12 12-13 13-14 14-15 15-16
Calculus BC
0.00 0.00
2.251.71
2.22
3.763.43
2.89
08-09 09-10 10-11 11-12 12-13 13-14 14-15 15-16
Statistics
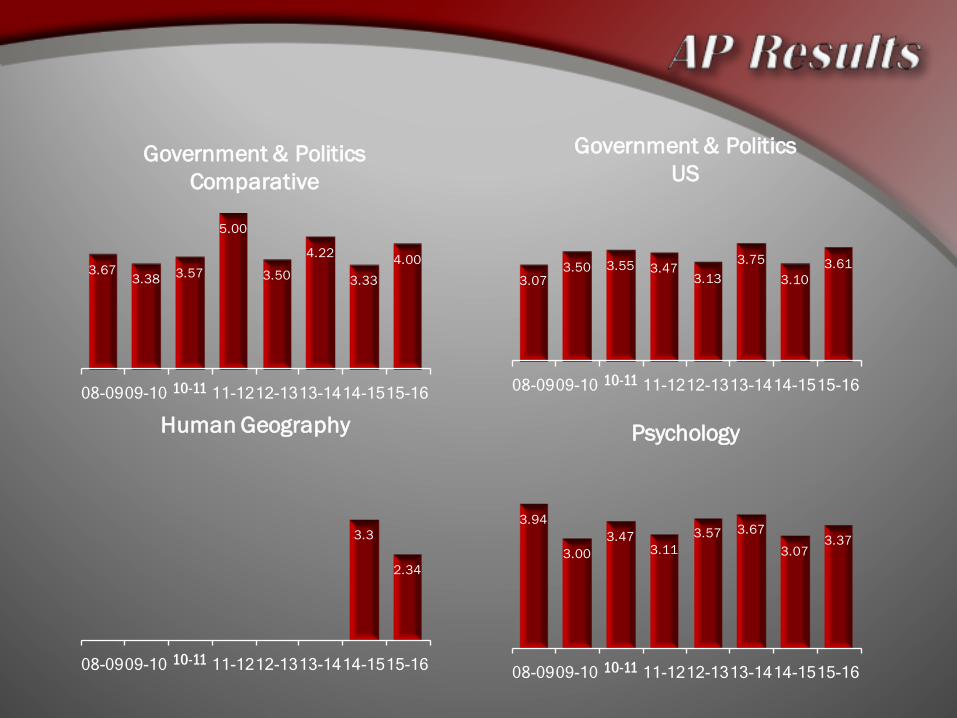
3.673.38 3.57
5.00
3.50
4.22
3.334.00
08-09 09-10 10-11 11-12 12-13 13-14 14-15 15-16
Government & Politics Comparative
3.073.50 3.55 3.47
3.133.75
3.103.61
08-09 09-10 10-11 11-12 12-13 13-14 14-15 15-16
Government & Politics US
3.94
3.003.47
3.113.57 3.67
3.073.37
08-09 09-10 10-11 11-12 12-13 13-14 14-15 15-16
Psychology
3.3
2.34
08-09 09-10 10-11 11-12 12-13 13-14 14-15 15-16
Human Geography
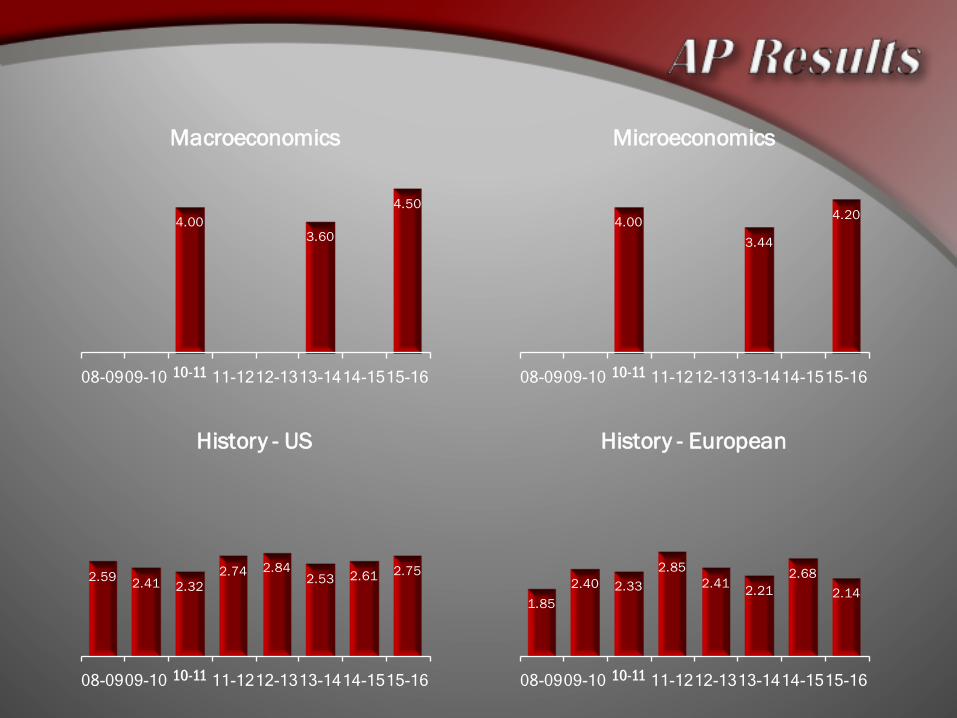
4.003.60
4.50
08-09 09-10 10-11 11-12 12-13 13-14 14-15 15-16
Macroeconomics
4.003.44
4.20
08-09 09-10 10-11 11-12 12-13 13-14 14-15 15-16
Microeconomics
2.59 2.41 2.322.74 2.84
2.53 2.61 2.75
08-09 09-10 10-11 11-12 12-13 13-14 14-15 15-16
History - US
1.852.40 2.33
2.852.41 2.21
2.682.14
08-09 09-10 10-11 11-12 12-13 13-14 14-15 15-16
History - European
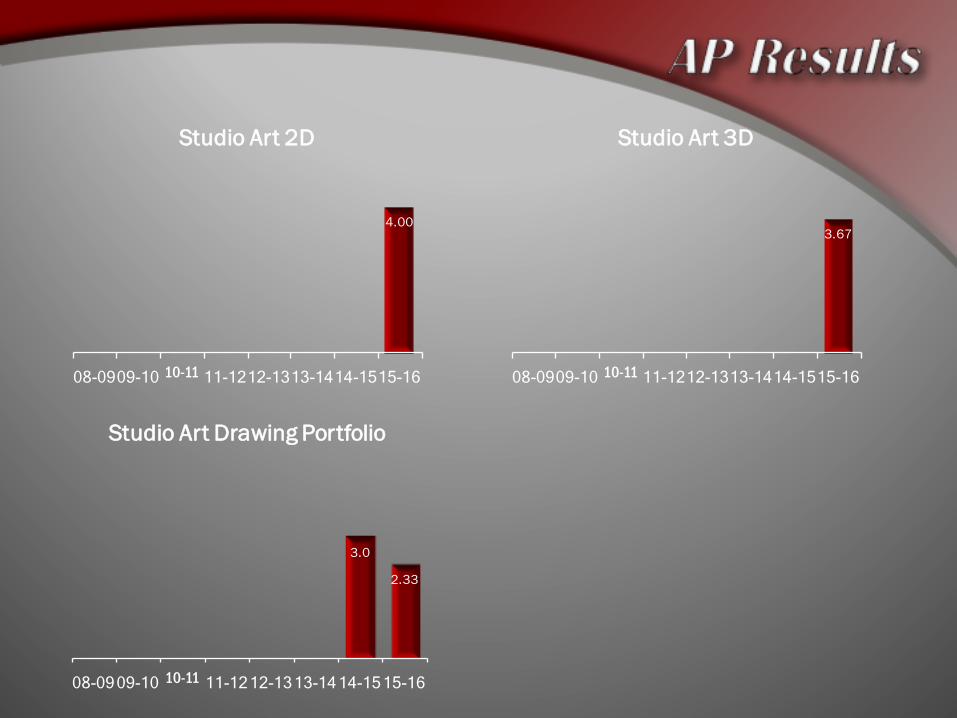
4.00
08-09 09-10 10-11 11-12 12-13 13-14 14-15 15-16
Studio Art 2D
3.67
08-09 09-10 10-11 11-12 12-13 13-14 14-15 15-16
Studio Art 3D
3.0
2.33
08-09 09-10 10-11 11-12 12-13 13-14 14-15 15-16
Studio Art Drawing Portfolio

AP ExamExams Taken
(08-09)
Exams Taken
(09-10)
Exams Taken
(10-11)
Exams Taken
(11-12)
Exams Taken
(12-13)
Exams Taken
(13-14)
Exams Taken
(14-15)
Exams Taken(15-16)
Biology 24 29 34 30 44 24 54 63Calc AB 12 7 7 7 8 10 12 11Calc BC 13 12 15 17 17 16 10 17
Chemistry 0 7 0 16 16 29 7 6Comp Sci 1 0 0 0 0 0
Econ-MAC 0 0 2 0 0 10 10
Econ-MIC 0 0 2 0 0 9 10
Eng-lang/Comp 6 2 2 53 61 65 68 82Eng-lit/Comp 24 27 25 17 28 27 26 16
Environ Science 0 0 1 1 0 4 6 11Euro History 41 52 43 33 32 48 28 42
German 5 5 1 8 2 3 2 9Gov & Pol-Comparative 6 8 7 2 6 9 6 8
Gov & Pol-US 29 38 38 34 40 51 31 33Human Geography 37 29
Music Theory 1 0 7 1 3 5 3Physics 1 10 7
Physics B 14 12 17 19 8 12Physics C: Mechanics 1 1 10 6 15
Psychology 33 29 47 47 30 27 29 67
Spanish 9 8 6 14 6 8 18 19Statistics 0 0 16 14 18 21 14 19
Studio Art Drawing Portfolio 3 3Studio Art 2D 1Studio Art 3D 3
US History 32 49 60 66 62 62 54 92
Total # of Exams 218 236 331 380 319 450 424 573
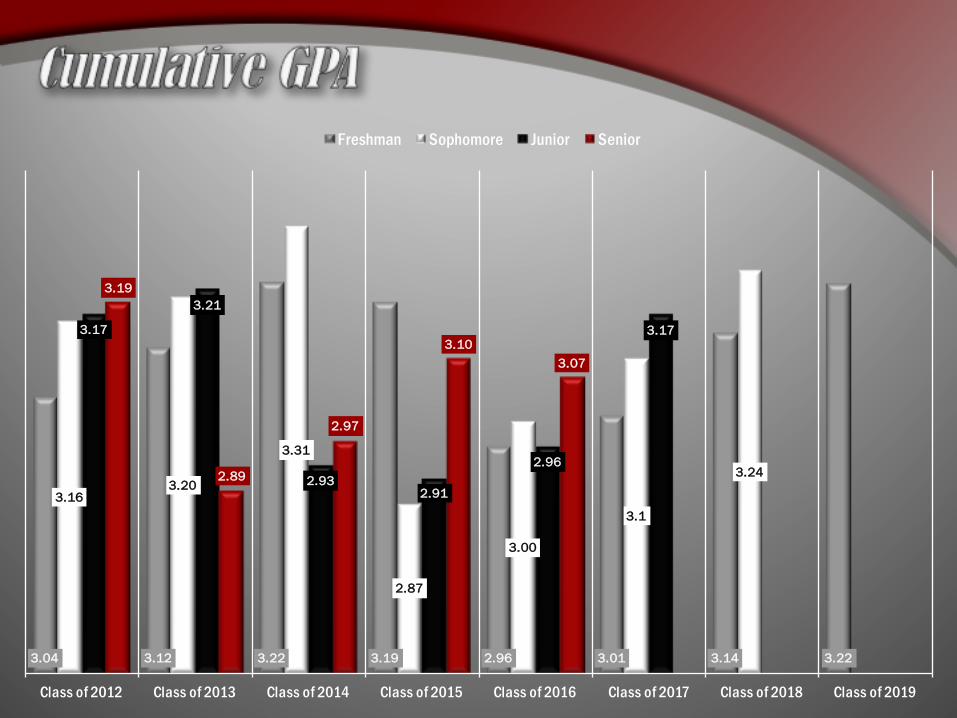
3.04 3.12 3.22 3.19 2.96 3.01 3.14 3.22
3.163.20
3.31
2.87
3.00
3.1
3.24
3.17
3.21
2.932.91
2.96
3.17
3.19
2.89
2.97
3.103.07
Class of 2012 Class of 2013 Class of 2014 Class of 2015 Class of 2016 Class of 2017 Class of 2018 Class of 2019
Freshman Sophomore Junior Senior

3.44%
14.54%
25.45%
31.87%
24.69%
2.76%
12.01%
24.35%
33.61%
27.26%
3.05%
11.92%
22.59%
33.70%
28.74%
3.45%
11.56%
23.63%
32.06%
29.29%
2.76%
9.94%
21.19%
33.10%
32.11%
3.15%
10.03%
19.96%
33.21%
33.65%
2.4%
9.2%
20.2%
32.8%
35.4%
2.24%
8.19%
17.97%
32.70%
38.90%
0.00% 5.00% 10.00% 15.00% 20.00% 25.00% 30.00% 35.00% 40.00% 45.00%
F
D
C
B
A
2015-16 2014-15 2013-14
2012-13
2011-12
2010-11
2009-10
2008-09

18.1 18.6 19.5 19.7 19.2
21.2 20.9 21.5 21.2 21.3
22.1 21.5 22.1 21.7 22.0
4.0 2.9 2.6 2.0 2.8
English Math Reading Science Composite
2015 ACT Poverty Achievement GapFree /Reduced Students
All Students
Non-Free / Reduced Students
Poverty Achievement Gap
17.4 18.4 17.9 19.1 18.6
21.0 21.3 21.8 21.6 21.6
21.6 21.7 22.4 22.0 22.1
4.2 3.3 4.52.9 3.5
English Math Reading Science Composite
2016 ACT Poverty Achievement GapFree /Reduced Students
All Students
Non-Free / Reduced Students
Poverty Achievement Gap
4.0
2.92.6
2.0
2.8
4.2
3.3
4.5
2.93.5
English Math Reading Science Composite
Pover ty Achievement Gap Over Time
2015
2016
(Data determined from each student’s Highest ACT Score)

9.8%
0.0%
9.8%
2.4%
78.0%
12.2%
5.8%
0.0%
5.8%
0.0%
88.5%
9.6%
Hispanic
Black
Asian, Hawain/Pacific Islander
Multi-Racial
White
Free / Reduced
Percentage of Cum Laude Graduatesby Demographic
15-16 14-15
12.1%
0.0%
44.4%
7.1%
12.7%
5.1%
10.7%
0.0%
60.0%
0.0%
17.4%
7.8%
Hispanic
Black
Asian, Hawain/Pacific Islander
Multi-Racial
White
Free / Reduced
Percentage of this Demographic Population Achieving Cum Laude Status
15-16 14-15
42%
81%
16%
57%
31% 44% 50%
86%
18%
64%
36% 50%
Scholarship Character Volunteerism Responsibility Excellence Pride
Percentage of Senior Class Achieving Each Criteria
2014-2015 2015-2016
Percentage of Cum Laude Graduates Based on Total Number of Graduating Seniors
Percentage Cum Laude Graduates
TOTAL Graduates
2014-2015 14.1% 41 2902015-2016 17.2% 52 302
88% 72%
55%
29% 19% 14%
90% 74%
60%
41% 25%
17%
1 of 6 Criteria 2 of 6 Criteria 3 of 6 Criteria 4 of 6 Criteria 5 of 6 Criteria 6 of 6 Criteria
Percentage of Senior Class Earning Full or Partial Criteria
2014-2015 2015-2016
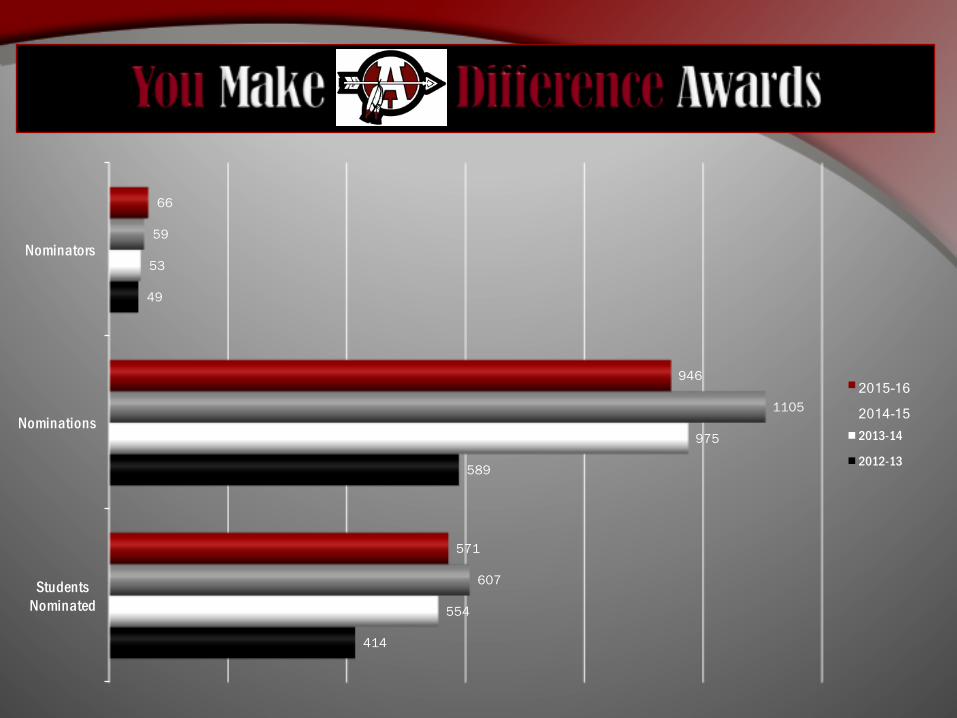
Students Nominated
Nominations
Nominators
414
589
49
554
975
53
607
1105
59
571
946
66
2015-16
2014-15 2013-14
2012-13
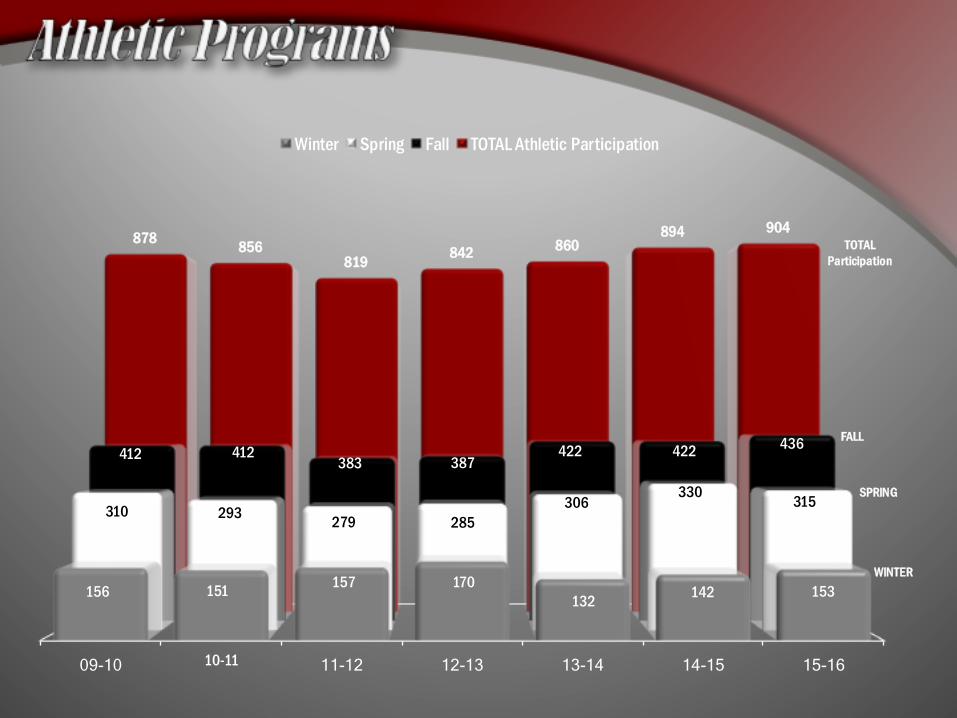
09-10 10-11 11-12 12-13 13-14 14-15 15-16
156 151 157 170132 142 153
310 293 279 285306
330 315
412 412383 387
422 422 436
878 856819 842 860
894 904
Winter Spring Fall TOTAL Athletic Participation
TOTALParticipation
SPRING
FALL
WINTER
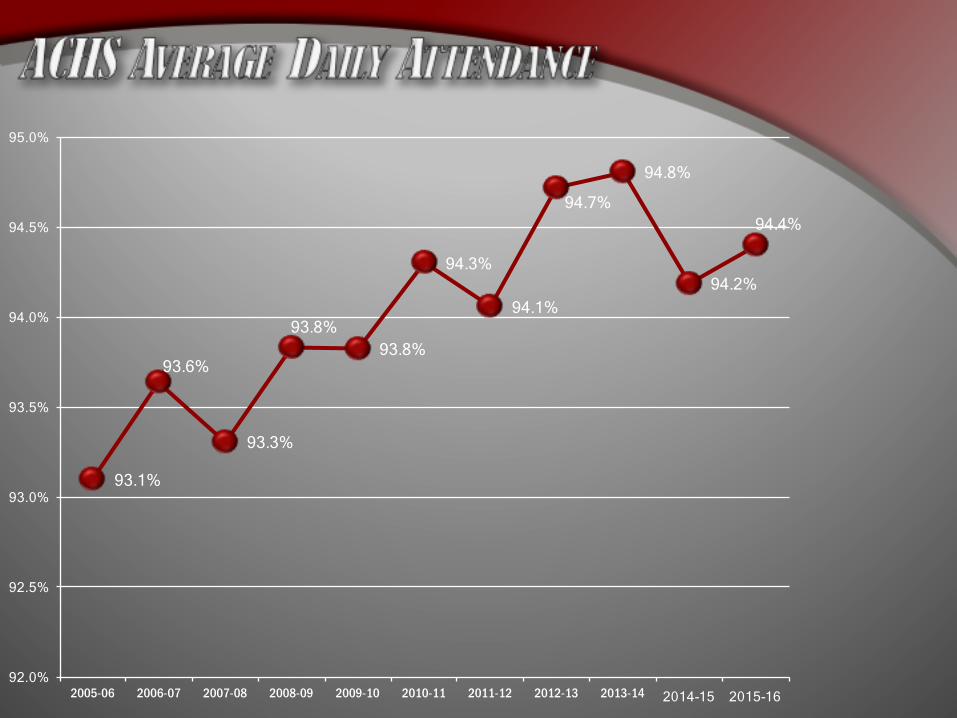
93.1%
93.6%
93.3%
93.8% 93.8%
94.3%
94.1%
94.7% 94.8%
94.2%
94.4%
92.0%
92.5%
93.0%
93.5%
94.0%
94.5%
95.0%
2005-06 2006-07 2007-08 2008-09 2009-10 2010-11 2011-12 2012-13 2013-14 2014-15 2015-16
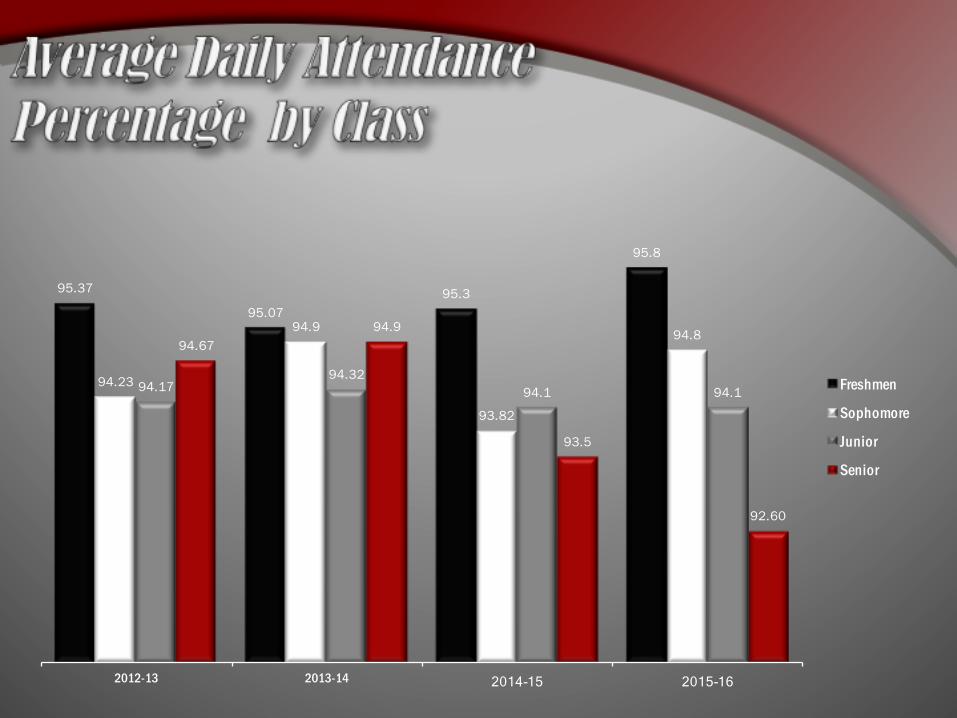
95.37
95.0795.3
95.8
94.23
94.9
93.82
94.8
94.1794.32
94.1 94.1
94.6794.9
93.5
92.60
2012-13 2013-14 2014-15 2015-16
Freshmen
Sophomore
Junior
Senior

6.3%
5.6%
5.7%
5.3%
5.0%
4.7%
4.5%
5.0%
4.7%
0.4%
0.6%
0.5%
0.4%
0.7%
0.7%
0.7%
0.8%
0.9%
2007-08
2008-09
2009-10
2010-11
2011-12
2012-13
2013-14
2014-15
2015-16
0.0% 1.0% 2.0% 3.0% 4.0% 5.0% 6.0% 7.0%
Unexcused Absence % Excused Absence %

85.2% = College Bound49.6% = 4 yr college35.6% = 2 yr college
95.3% 96.1%
89.3%
95.0% 94.0%
93.2% 92.1%
95.3%
08-09 09-10 10-11 11-12 12-13 13-14 14-15 15-16
Graduation Rate
1421
1231
1339
1383
13201318
12771298
13221335
1341
2005 -2006
2006 -2007
2007 -2008
2008 -2009
2009 -2010
2010 -2011
2011 -2012
2012 -2013
2013 -2014
2014 -2015
2015-2016
Enrollment
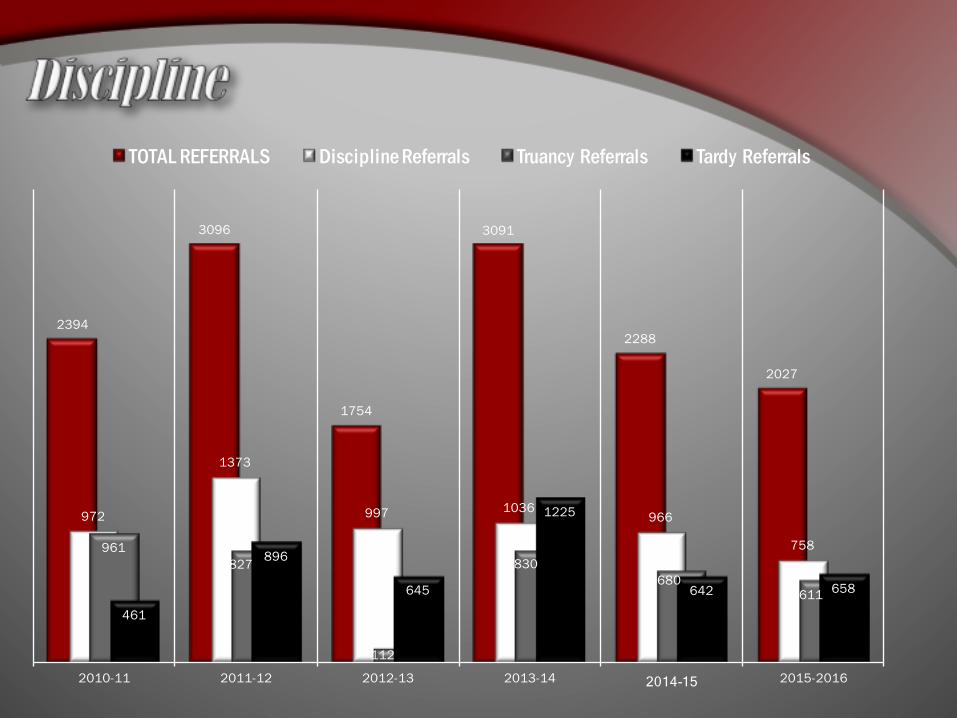
2394
3096
1754
3091
2288
2027
972
1373
997 1036966
758961827
112
830680
611461
896
645
1225
642 658
2010-11 2011-12 2012-13 2013-14 2014-15 2015-2016
TOTAL REFERRALS Discipline Referrals Truancy Referrals Tardy Referrals
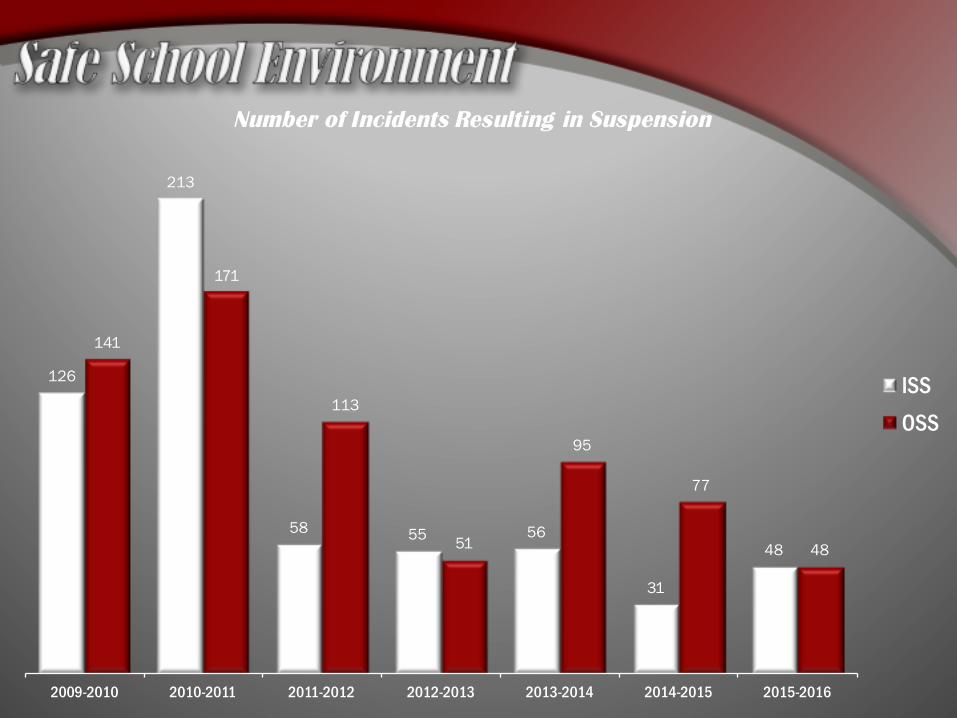
Number of Incidents Resulting in Suspension
126
213
58 55 56
31
48
141
171
113
51
95
77
48
2009-2010 2010-2011 2011-2012 2012-2013 2013-2014 2014-2015 2015-2016
ISSOSS
