ucla advanced neuroimaging summer school,...
TRANSCRIPT
Percent Change and PowerCalculation
UCLA Advanced NeuroImagingSummer School, 2007
Outline
• Calculating %-change– How to do it– What featquery does
• Power analysis– Why you should use power calculations– How to carry out power calculations
Why %-Change?
• As it is, parameter estimates do notreflect a specific unit
• T-stats are okay (they are unitless)• What if we want to tell other people how
large our activation was?– Convert to %-change
%-change
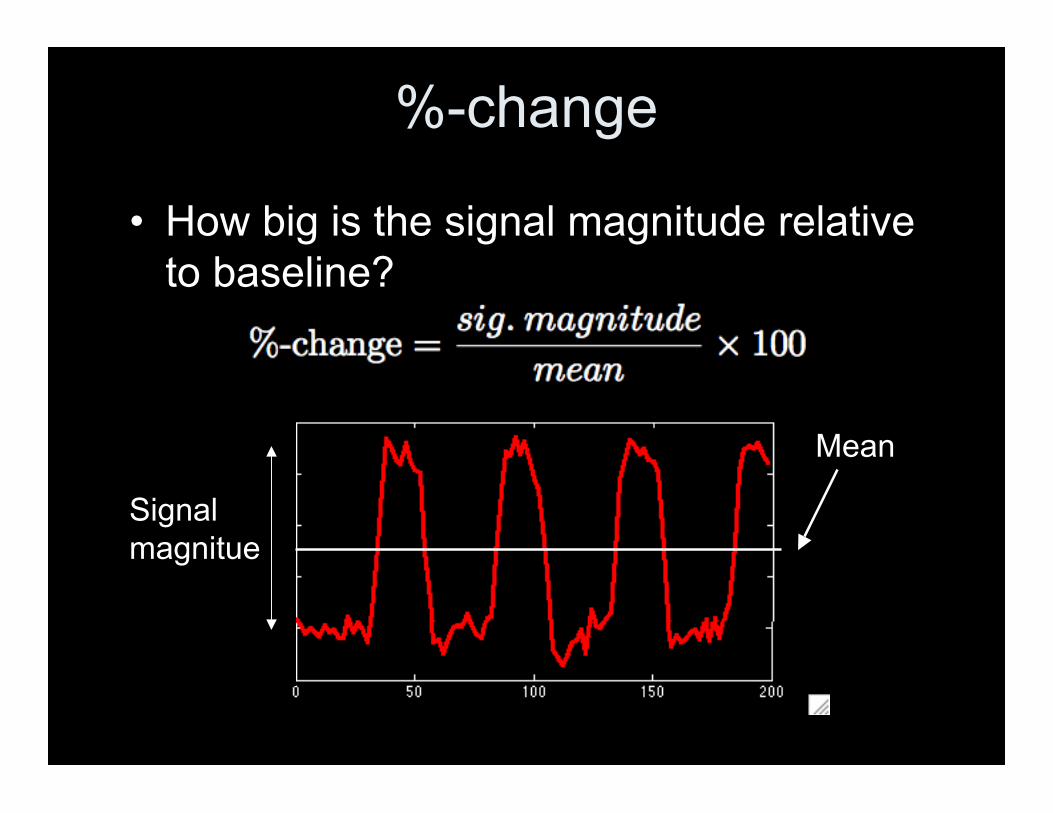
• How big is the signal magnitude relativeto baseline?
Mean
Signalmagnitue
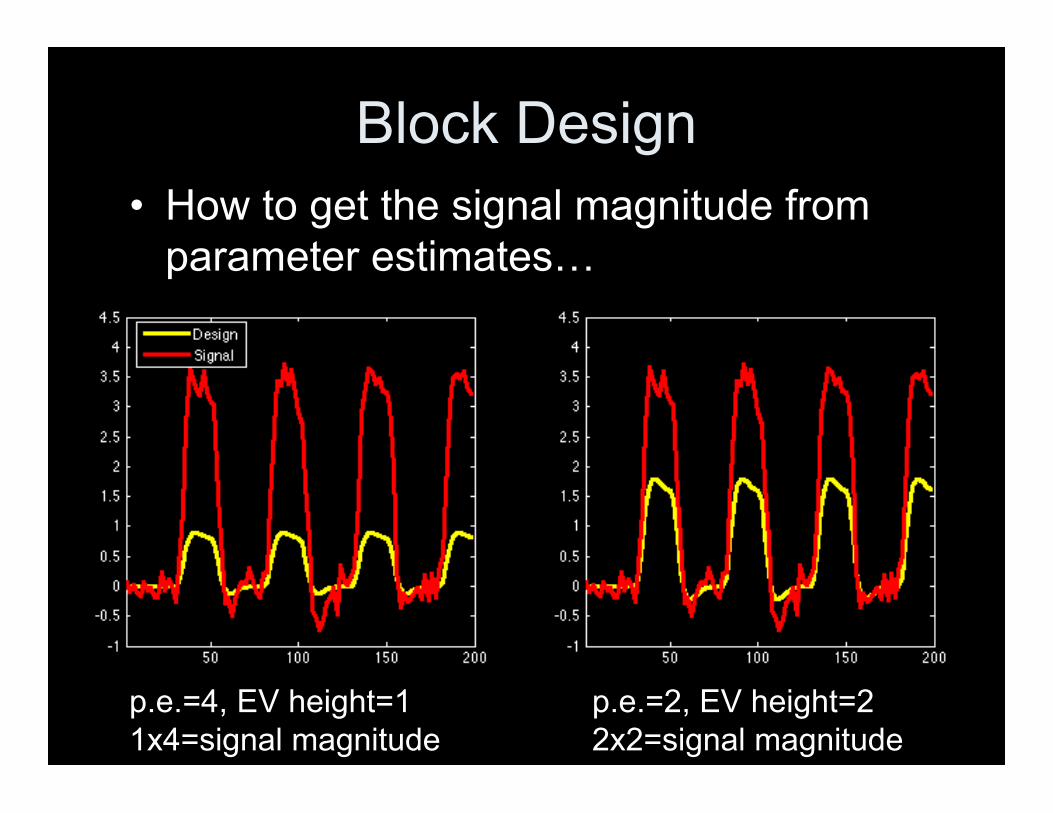
Block Design• How to get the signal magnitude from
parameter estimates…
p.e.=4, EV height=11x4=signal magnitude
p.e.=2, EV height=22x2=signal magnitude
Block Design
• To make life easier, set min/max rangeof EV’s=1!– In FSL the Grand Mean Scaling sets
mean~1002 in all voxels– PE/100=%-change! (roughly)– To be completely accurate you should
divide by the true mean
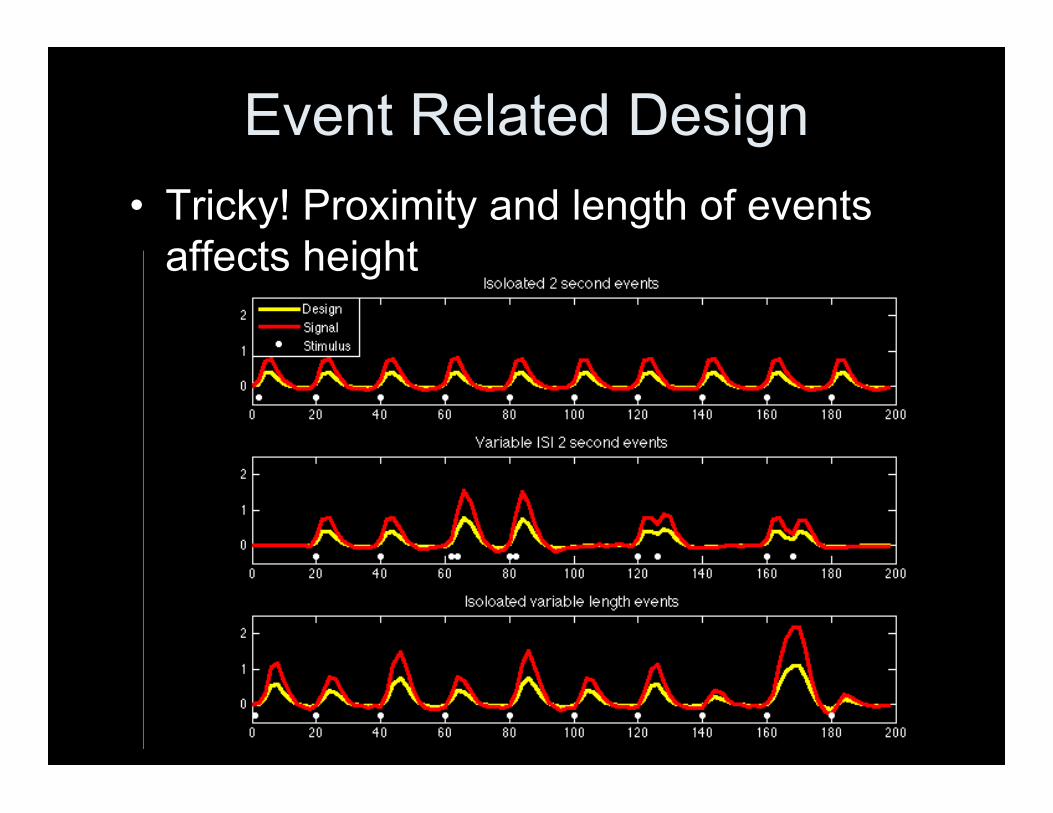
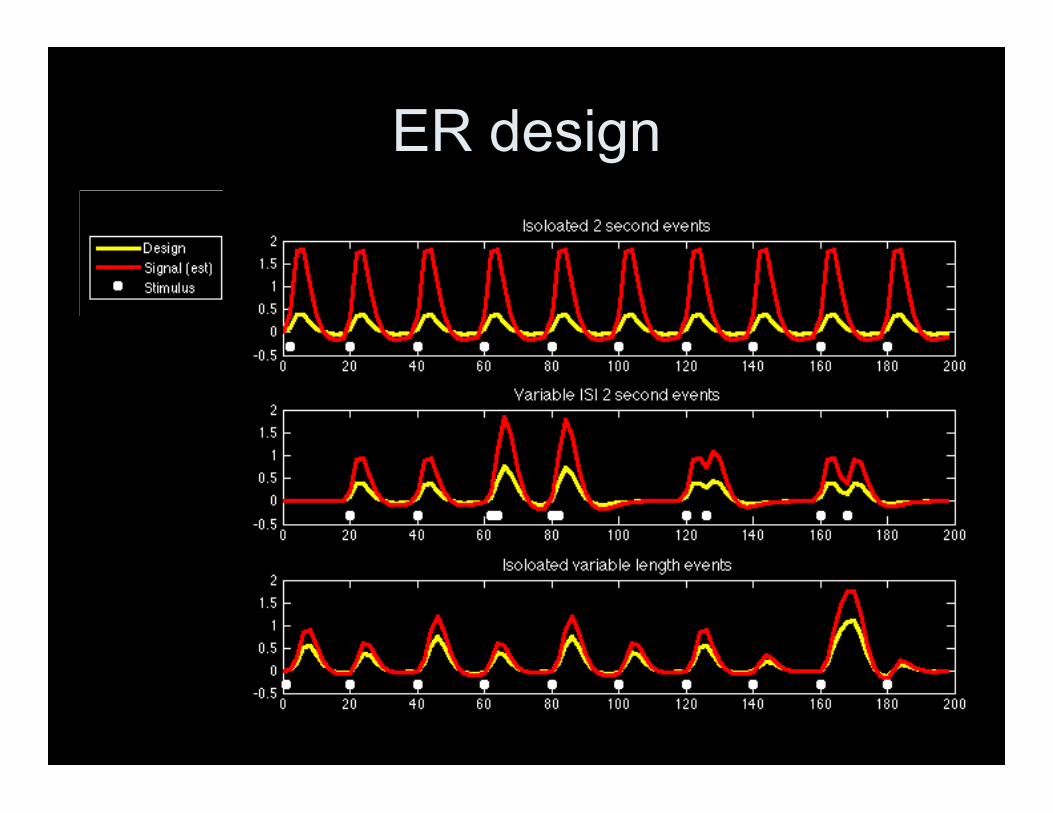
Event Related Design• Tricky! Proximity and length of events
affects height
Event Related Design
• How about using min/max range?– Is it interpretable?– I tell you I found a 2% change, calculated
using the min/max range. Can youinterpret this with your own design?
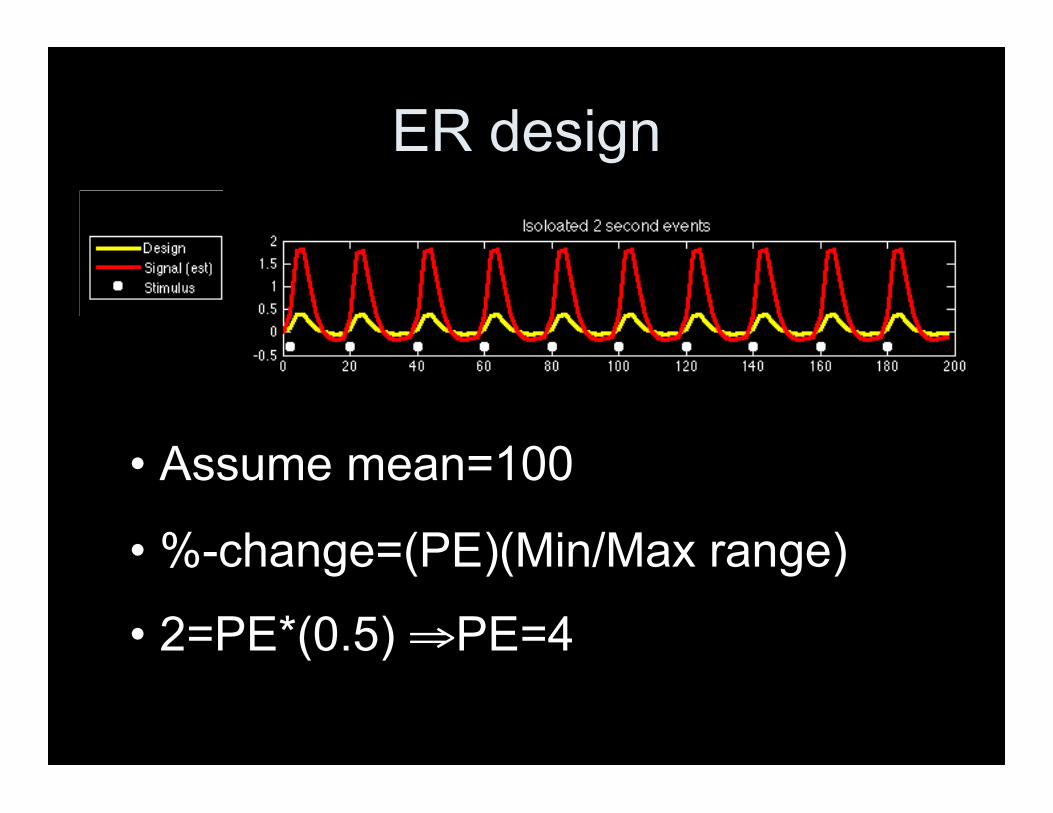
ER design
• Assume mean=100
• %-change=(PE)(Min/Max range)
• 2=PE*(0.5) ⇒PE=4
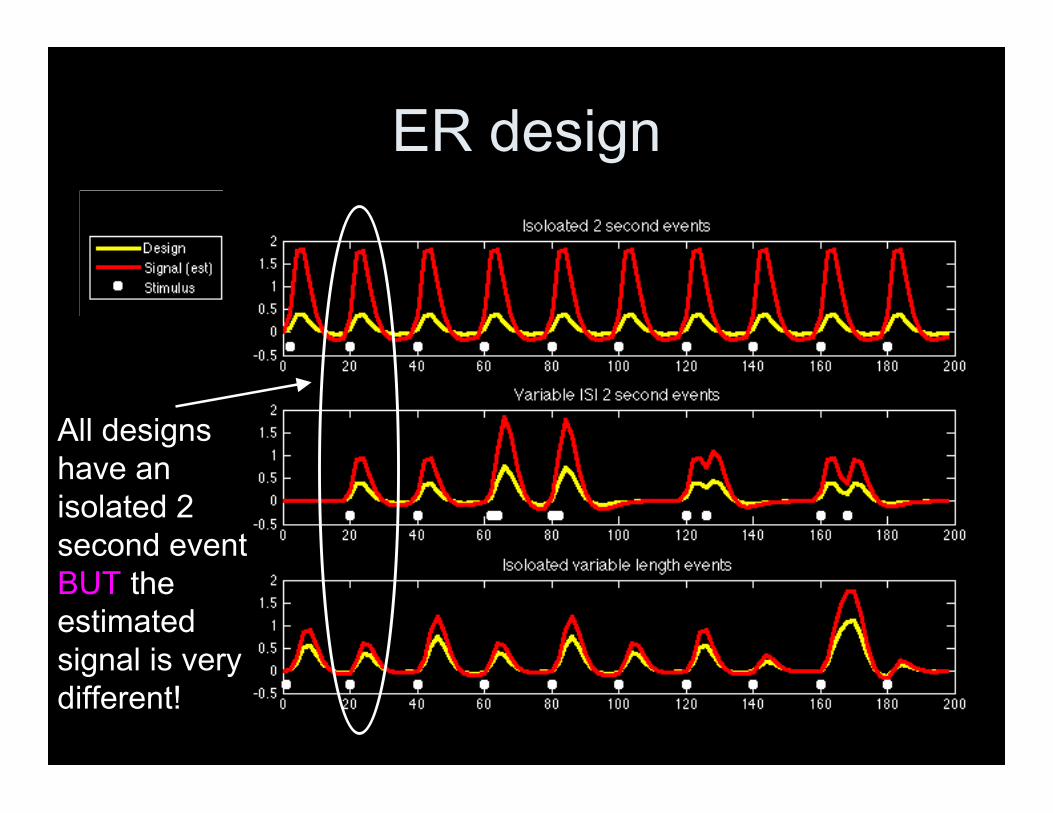
ER design
ER design
All designshave anisolated 2second eventBUT theestimatedsignal is verydifferent!
ER Design
• Min/max range doesn’t work as well forevent related design– Doesn’t translate well to other designs.– *warning* Featquery uses min/max range
• Instead of min/max range, choosesomething specific (isolated 2 secondevent) and make sure to report whatyou used!
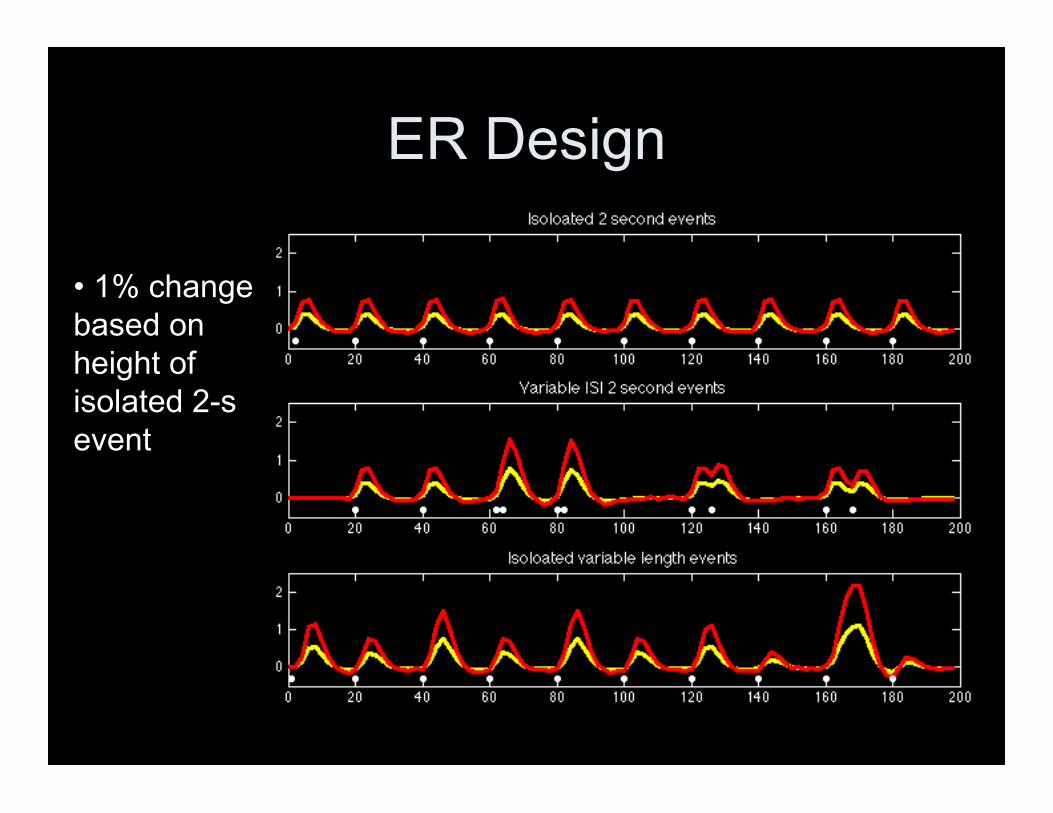
ER Design
• 1% changebased onheight ofisolated 2-sevent
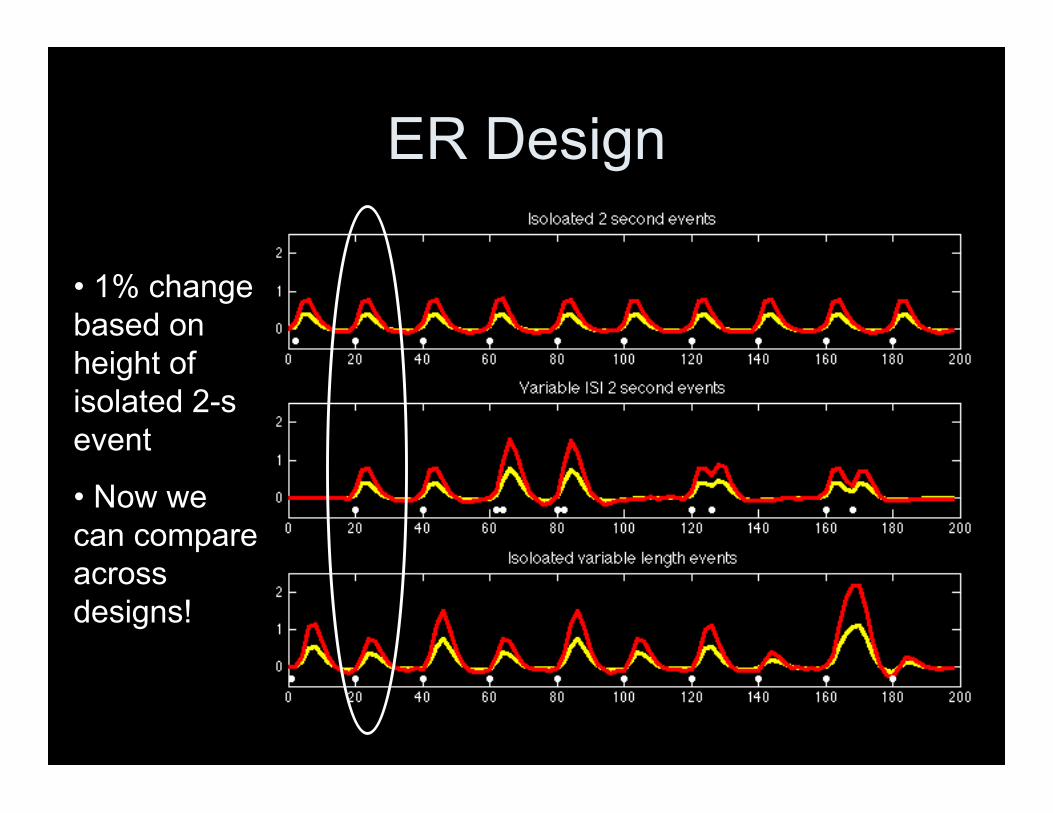
ER Design
• 1% changebased onheight ofisolated 2-sevent
• Now wecan compareacrossdesigns!
A note about contrasts
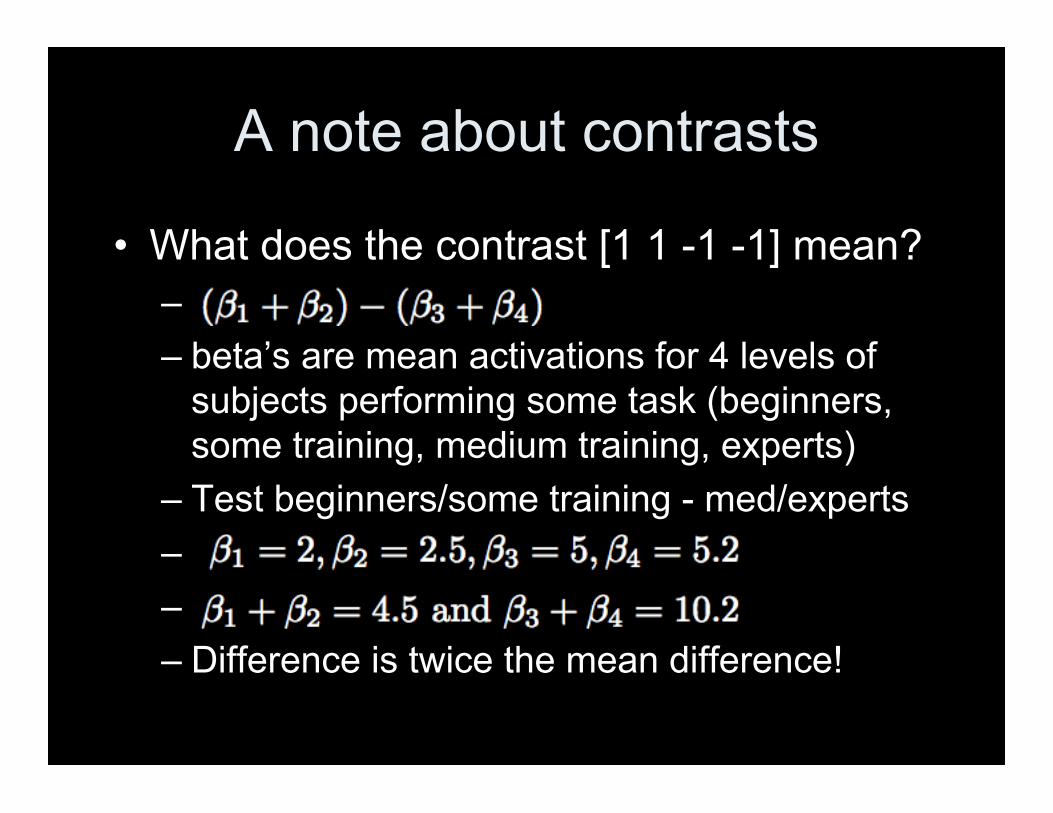
• What does the contrast [1 1 -1 -1] mean?–– beta’s are mean activations for 4 levels of
subjects performing some task (beginners,some training, medium training, experts)
– Test beginners/some training - med/experts––– Difference is twice the mean difference!
A note about contrasts
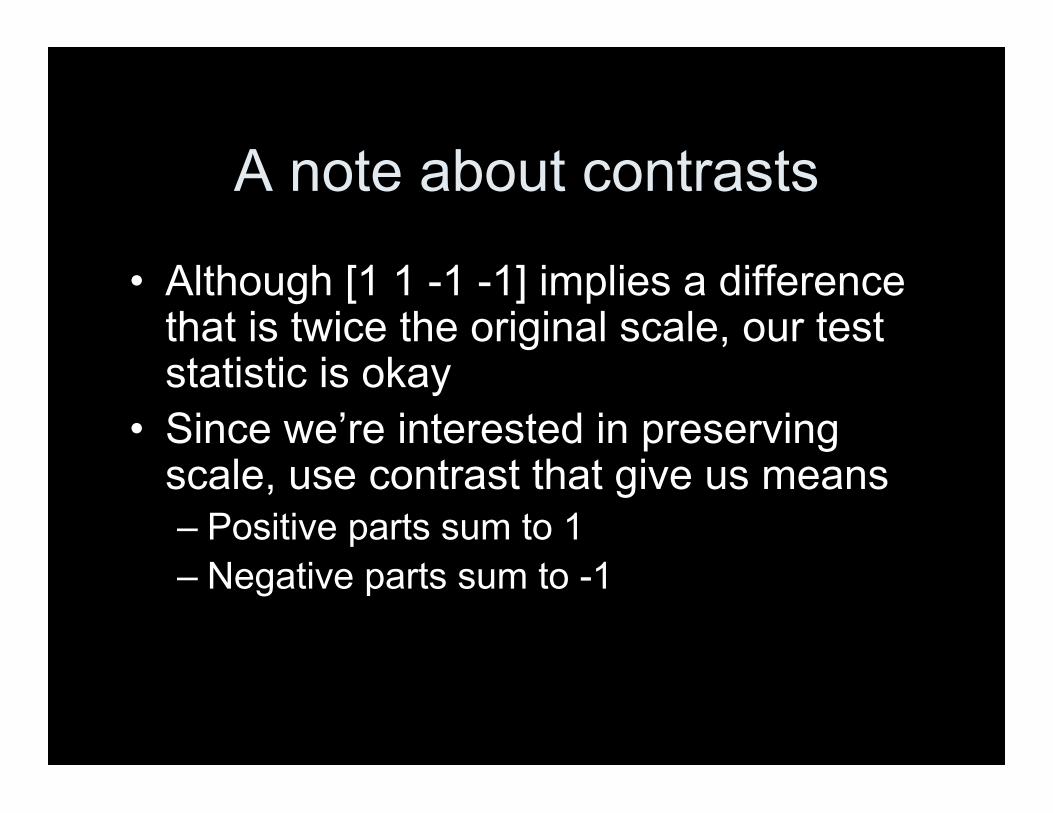
• Although [1 1 -1 -1] implies a differencethat is twice the original scale, our teststatistic is okay
• Since we’re interested in preservingscale, use contrast that give us means– Positive parts sum to 1– Negative parts sum to -1
Rules to get *almost* %-change in FSL
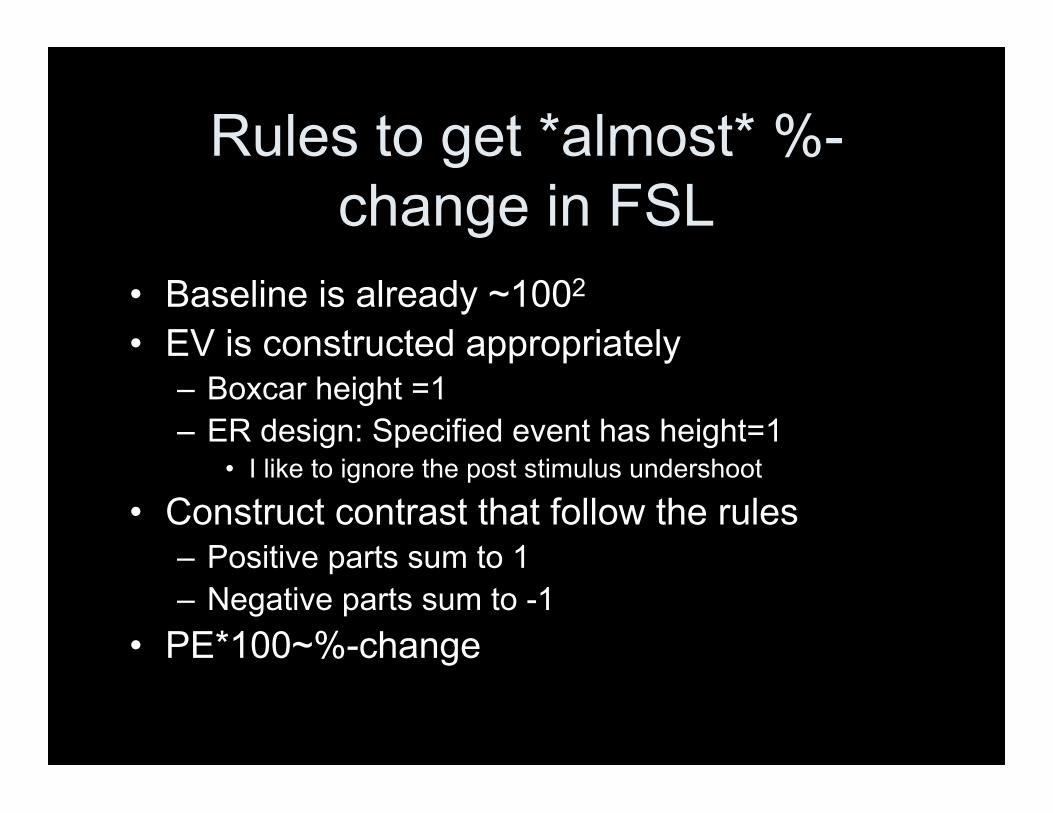
• Baseline is already ~1002
• EV is constructed appropriately– Boxcar height =1– ER design: Specified event has height=1
• I like to ignore the post stimulus undershoot
• Construct contrast that follow the rules– Positive parts sum to 1– Negative parts sum to -1
• PE*100~%-change
What if you didn’t follow therules
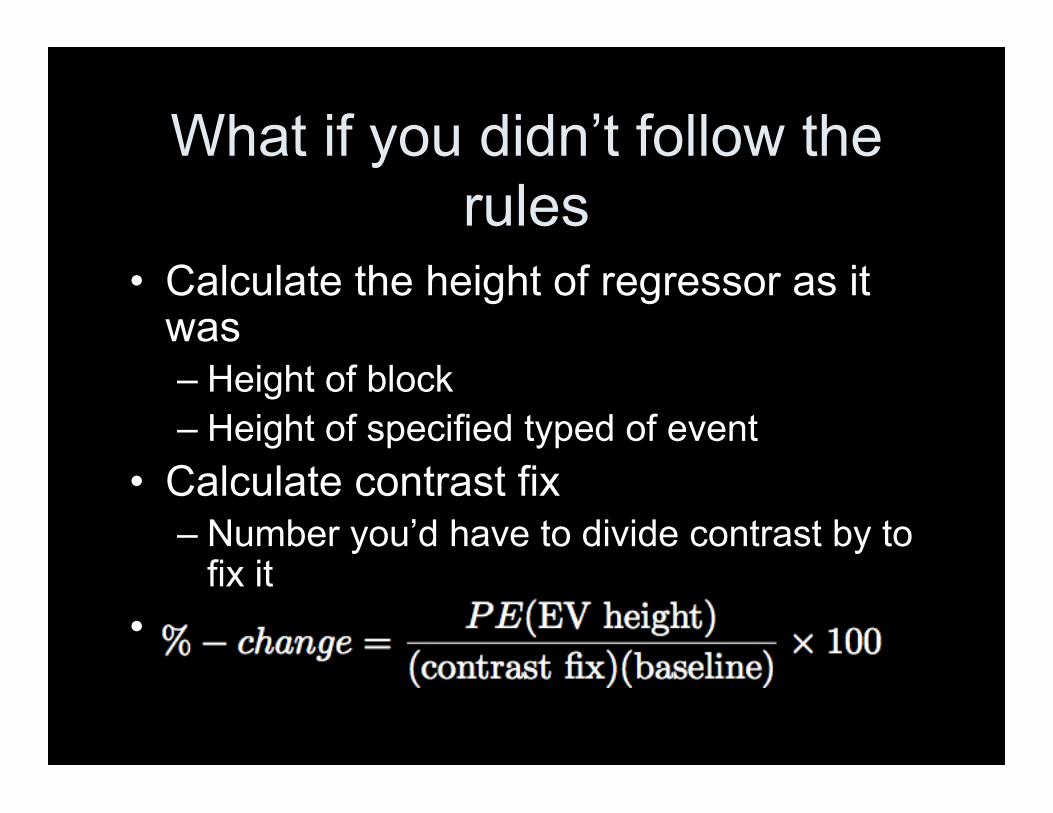
• Calculate the height of regressor as itwas– Height of block– Height of specified typed of event
• Calculate contrast fix– Number you’d have to divide contrast by to
fix it•
Example
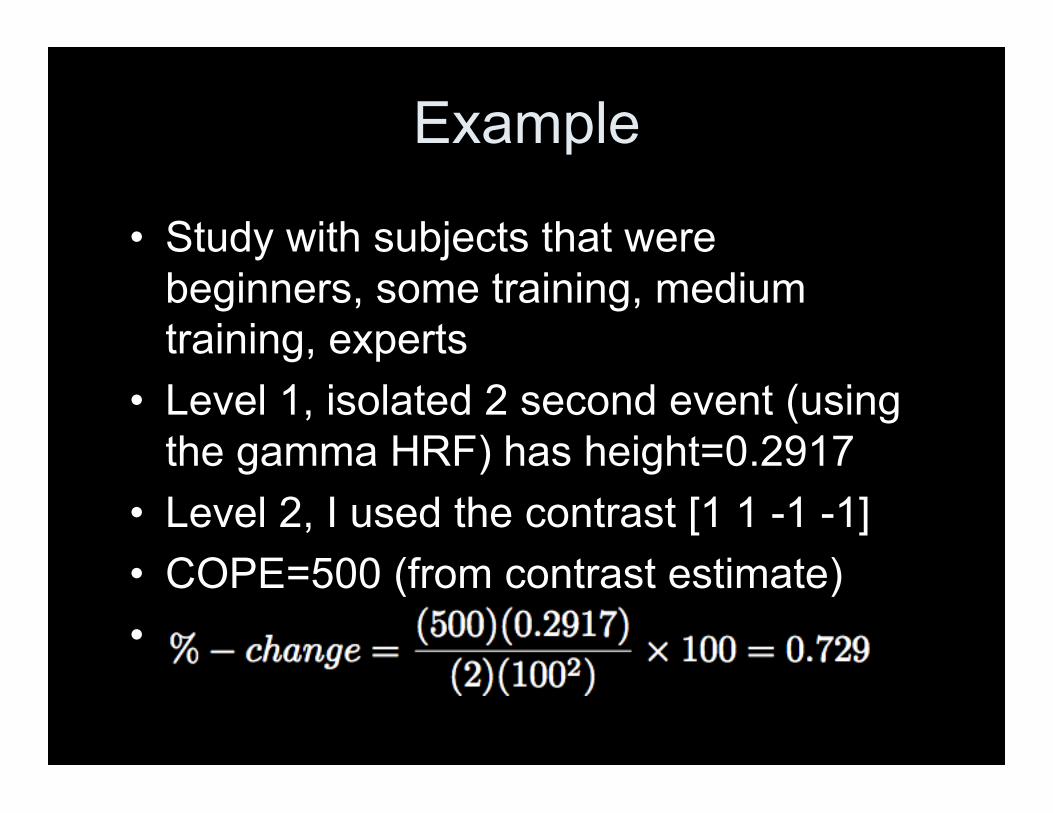
• Study with subjects that werebeginners, some training, mediumtraining, experts
• Level 1, isolated 2 second event (usingthe gamma HRF) has height=0.2917
• Level 2, I used the contrast [1 1 -1 -1]• COPE=500 (from contrast estimate)•
Featquery
• Featquery calculates %-change for ROI’s• Uses min/max range of ‘effective regressor
height’– Roughly speaking effective regressor corrects
violation of the contrast rule and correlationbetween regressors
• Probably works fine for block design• Very bad to run separately on first level runs
for ER studies!– Will use a different scale factor for each subject
• Min/Max range isn’t best for ER design
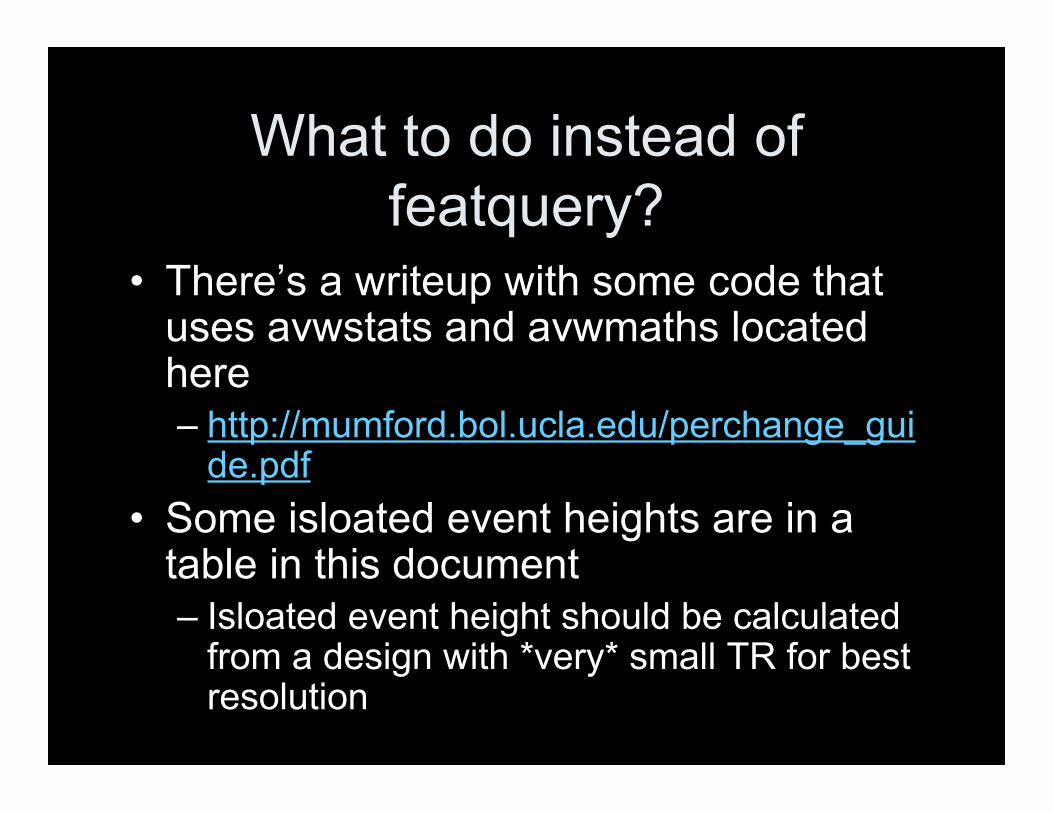
What to do instead offeatquery?
• There’s a writeup with some code thatuses avwstats and avwmaths locatedhere– http://mumford.bol.ucla.edu/perchange_gui
de.pdf• Some isloated event heights are in a
table in this document– Isloated event height should be calculated
from a design with *very* small TR for bestresolution
Power Analysis-Why?
• To answer the question….– How many subjects do I need for my
study?– How many runs per subject should I
collect?• To create thorough grant applications
that will make reviewers happy!– Don’t waste money on underpowered
studies OR collecting data on moresubjects than you need
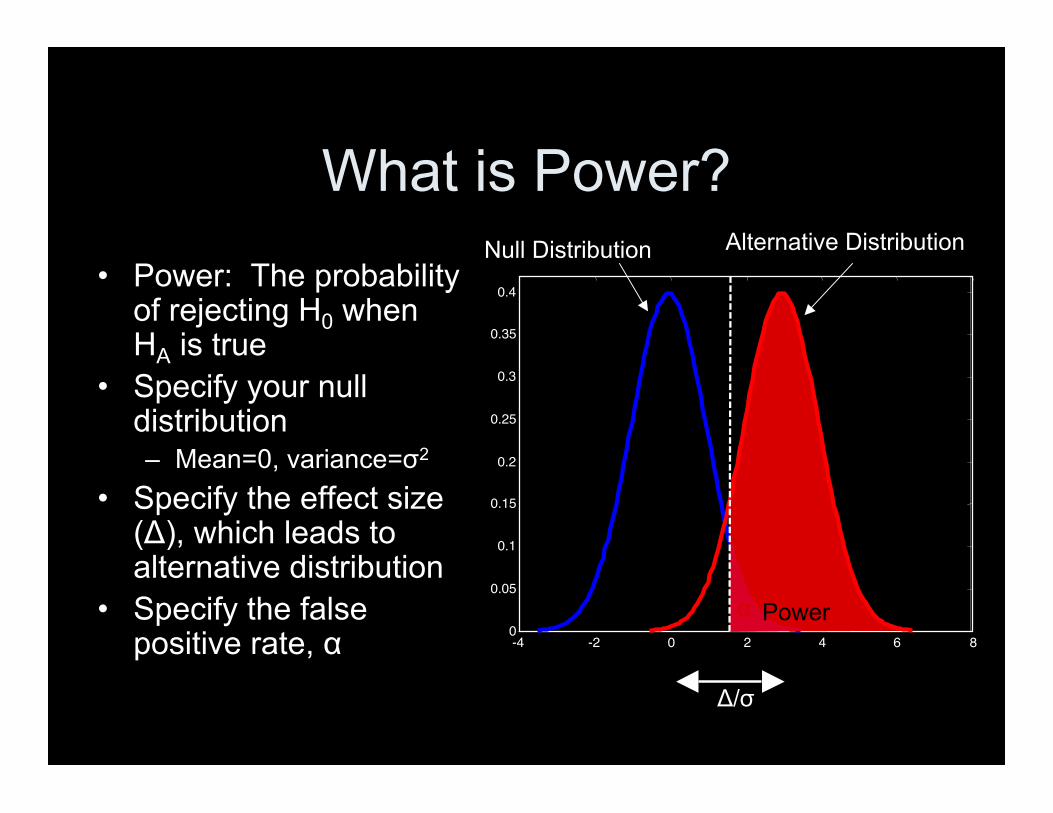
What is Power?• Power: The probability
of rejecting H0 whenHA is true
• Specify your nulldistribution– Mean=0, variance=σ2
• Specify the effect size(Δ), which leads toalternative distribution
• Specify the falsepositive rate, α 0 2 4 6 8-4 -2
0
0.05
0.1
0.15
0.2
0.25
0.3
0.35
0.4
α Power
Null Distribution Alternative Distribution
Δ/σ
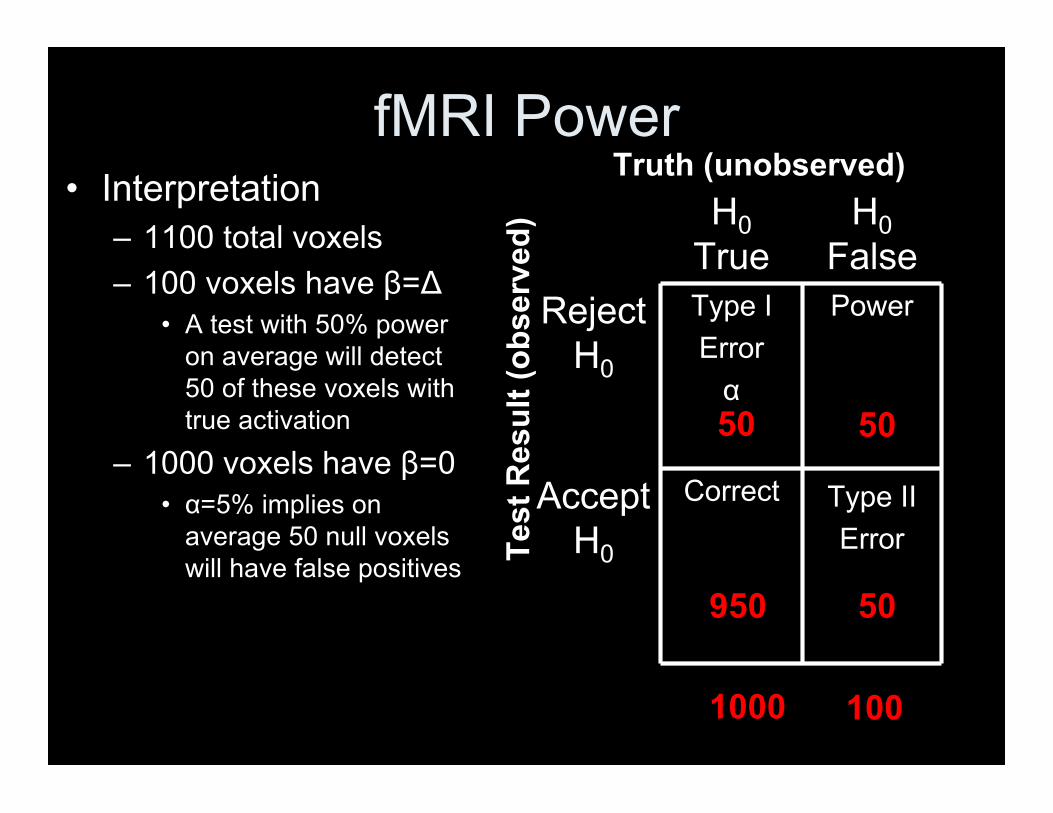
fMRI Power• Interpretation
– 1100 total voxels– 100 voxels have β=Δ
• A test with 50% poweron average will detect50 of these voxels withtrue activation
– 1000 voxels have β=0• α=5% implies on
average 50 null voxelswill have false positives
Type IIError
CorrectAcceptH0
PowerType IErrorα
RejectH0
H0False
H0True
Truth (unobserved)
Test
Res
ult (
obse
rved
)
1000
950
50
100
50
50
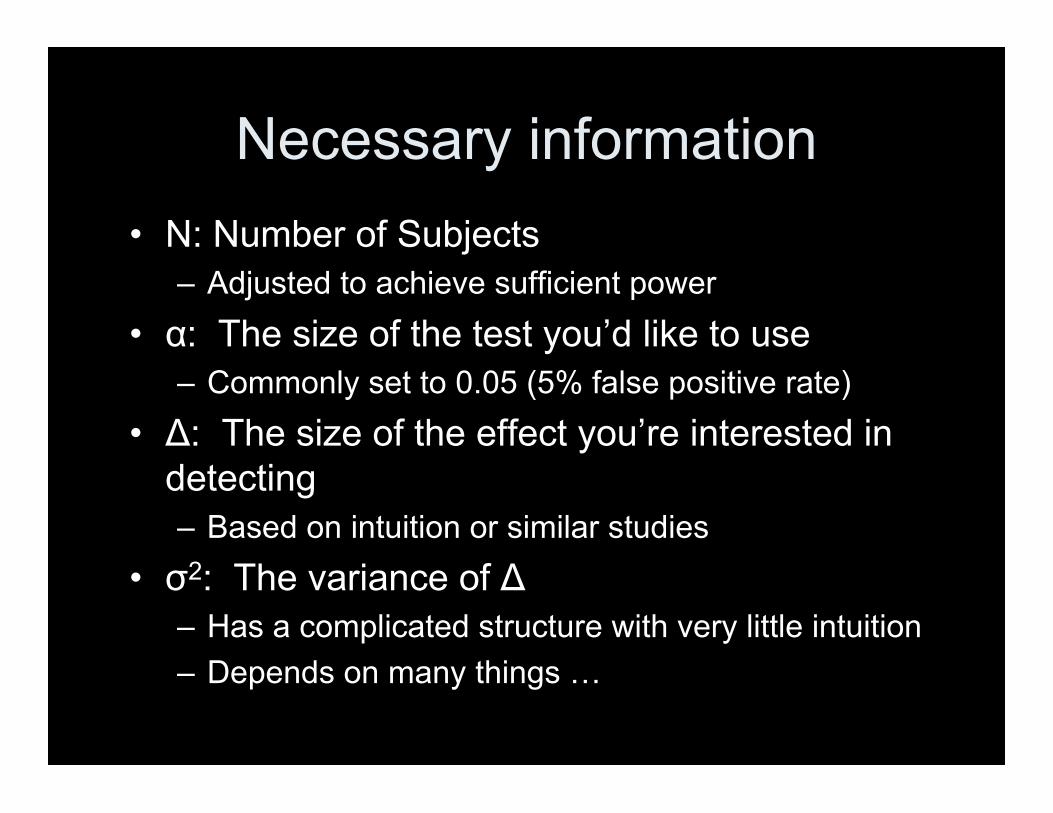
Necessary information• N: Number of Subjects
– Adjusted to achieve sufficient power• α: The size of the test you’d like to use
– Commonly set to 0.05 (5% false positive rate)• Δ: The size of the effect you’re interested in
detecting– Based on intuition or similar studies
• σ2: The variance of Δ– Has a complicated structure with very little intuition– Depends on many things …
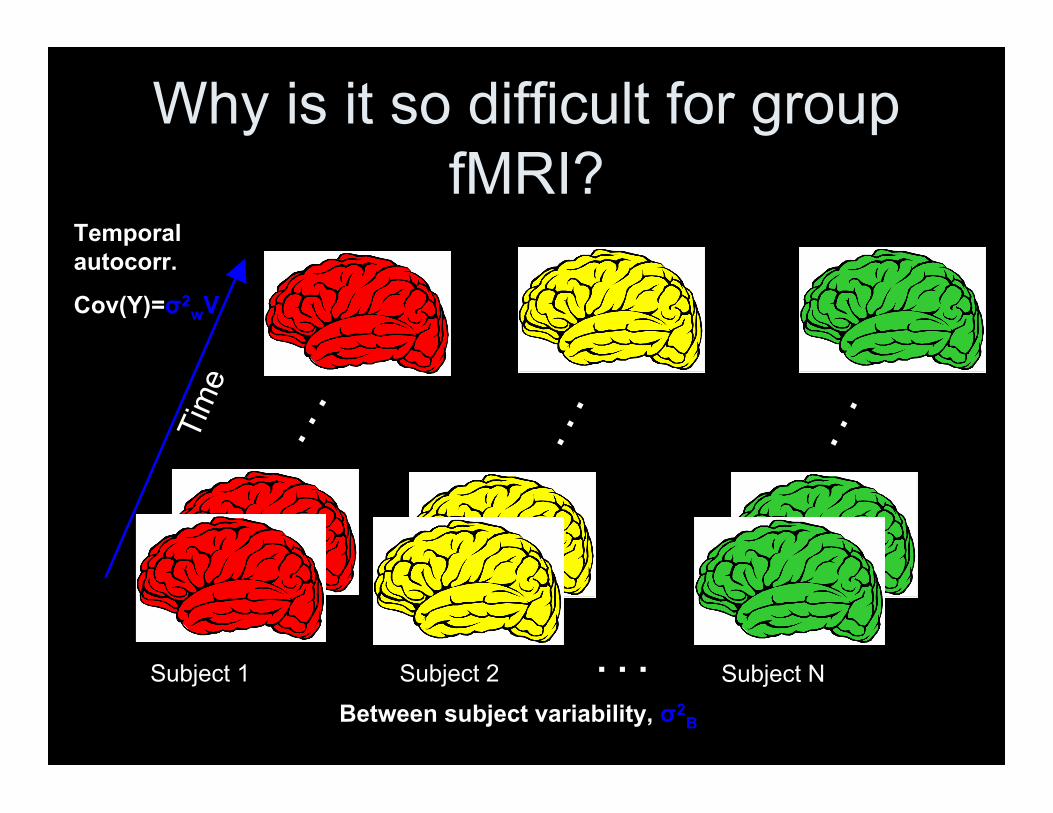
Why is it so difficult for groupfMRI?
. . .
Tim
e
Subject 1
Temporalautocorr.
Cov(Y)=σ2wV
Subject N. . .Between subject variability, σ2
B
. . .
. . .
Subject 2
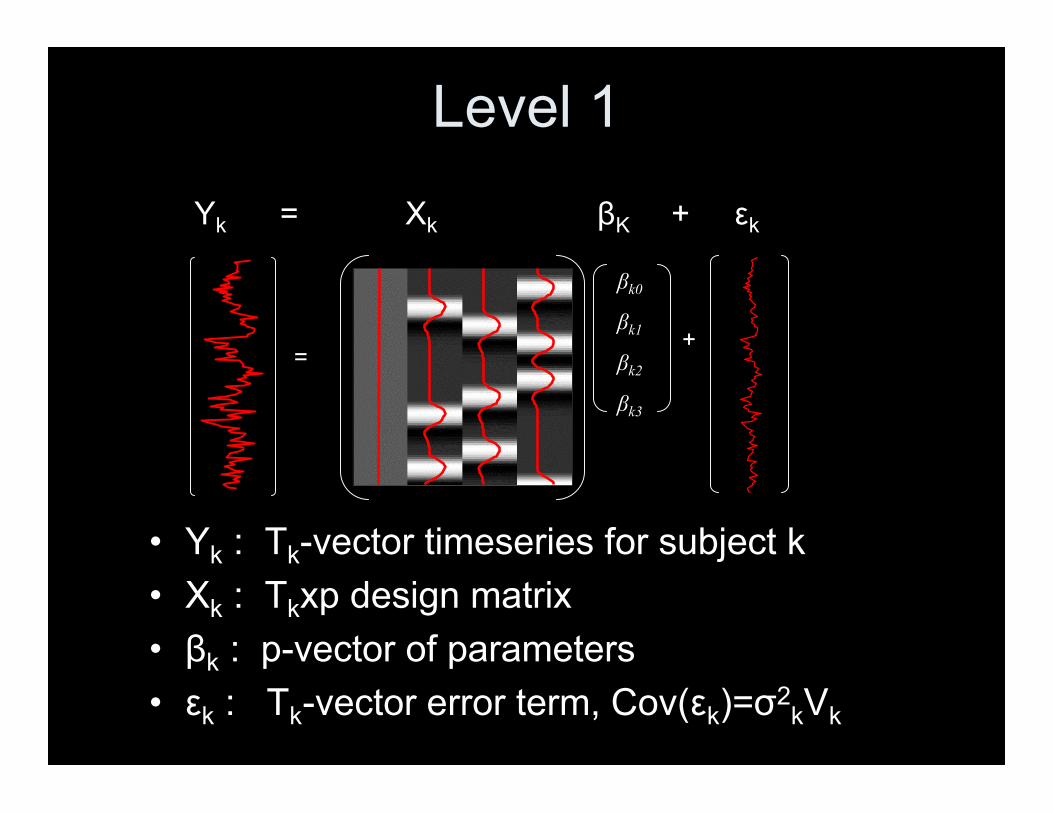
Level 1
• Yk : Tk-vector timeseries for subject k• Xk : Tkxp design matrix• βk : p-vector of parameters• εk : Tk-vector error term, Cov(εk)=σ2
kVk
=
βk0βk1βk2βk3
+
Yk = Xk βK + εk
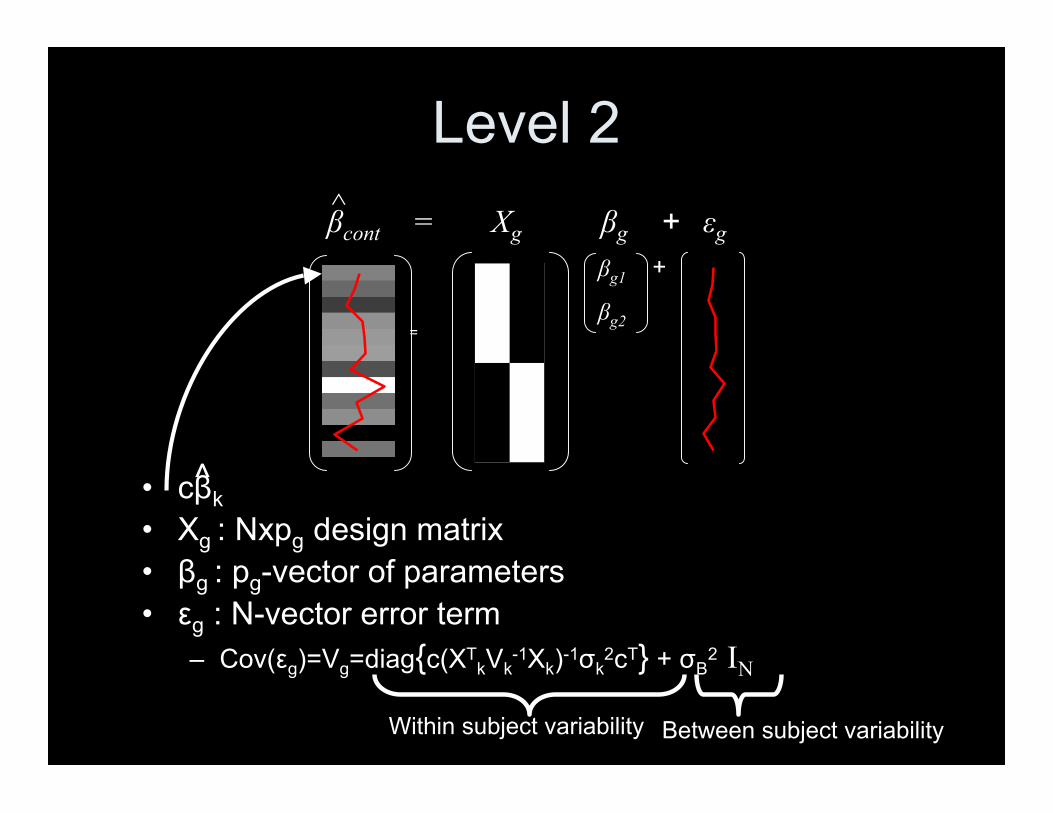
Level 2
• cβk• Xg : Nxpg design matrix• βg : pg-vector of parameters• εg : N-vector error term
– Cov(εg)=Vg=diag{c(XTkVk
-1Xk)-1σk2cT} + σB
2 IN
^
βcont^
=
βg1βg2
+
= Xg βg + εg
Within subject variability Between subject variability
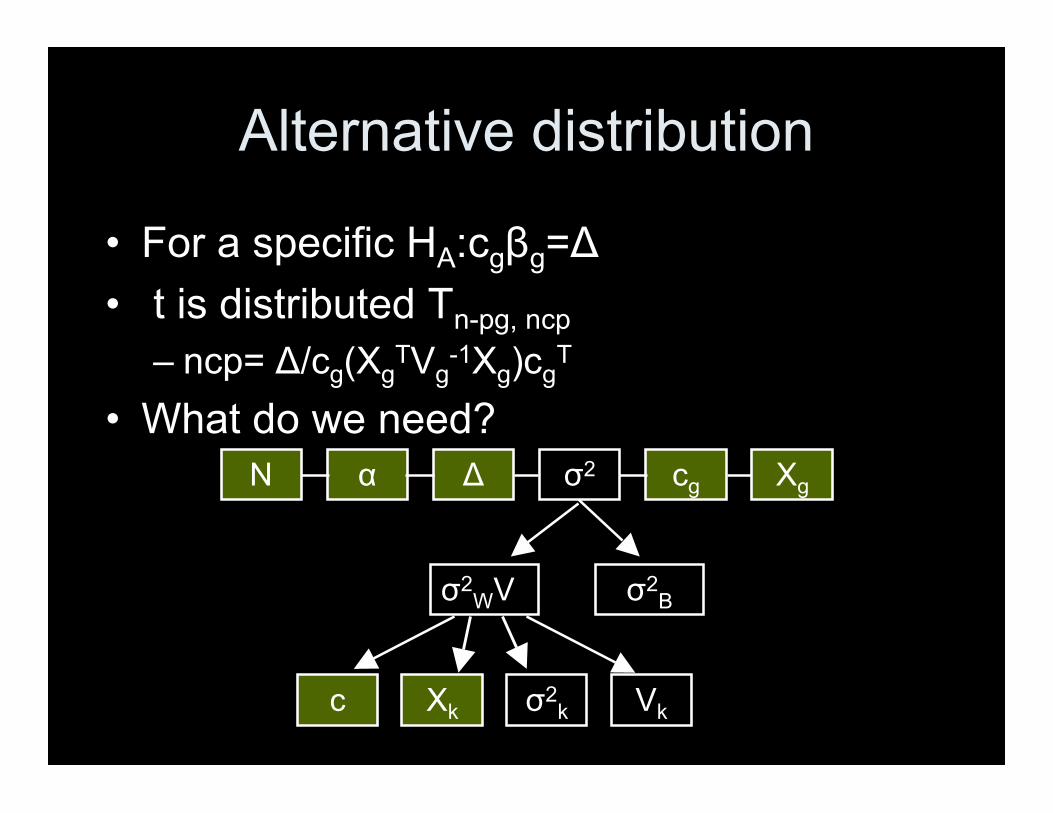
Alternative distribution
• For a specific HA:cgβg=Δ• t is distributed Tn-pg, ncp
– ncp= Δ/cg(XgTVg
-1Xg)cgT
• What do we need?N α Δ σ2 cg Xg
σ2WV σ2
B
c Xk σ2k Vk
Estimating Parameters
• How to you estimate parameters for afuture study?– Look at other people’s study results for
similar studies– Look at your own similar studies
• Average parameter estimates overROIs of interest
Estimating σ2kVk
• Use covariance estimate supplied by software– FSL uses a unstructured covariance that can have
up to 13 or more parameters– SPM2 uses a 2 parameter AR(1) approximation
• Fit AR(1)+WN model to software estimate– Only 3 parameters– Summarize parameters over ROI’s– Simple parameterization is easy to report and
bridges covariance estimates across software– Assume covariance is same over all subjects
(necessary to extrapolate to larger populations)
Estimating σ2B
• SPM2 doesn’t estimate, but we stillneed to approximate it for the powercalculation– You can see my paper for the details
• FSL estimates and saves thisparameter in an image file– Average over the ROI
Model
• Block design 15s on 15s off• TR=3s• Hrf: Gamma, sd=3• Parameters estimated from Block study
– FIAC single subject data– Read 3 little pigs
• Same/different speaker, same/different sentence• Looked at blocks with same sentence same speaker
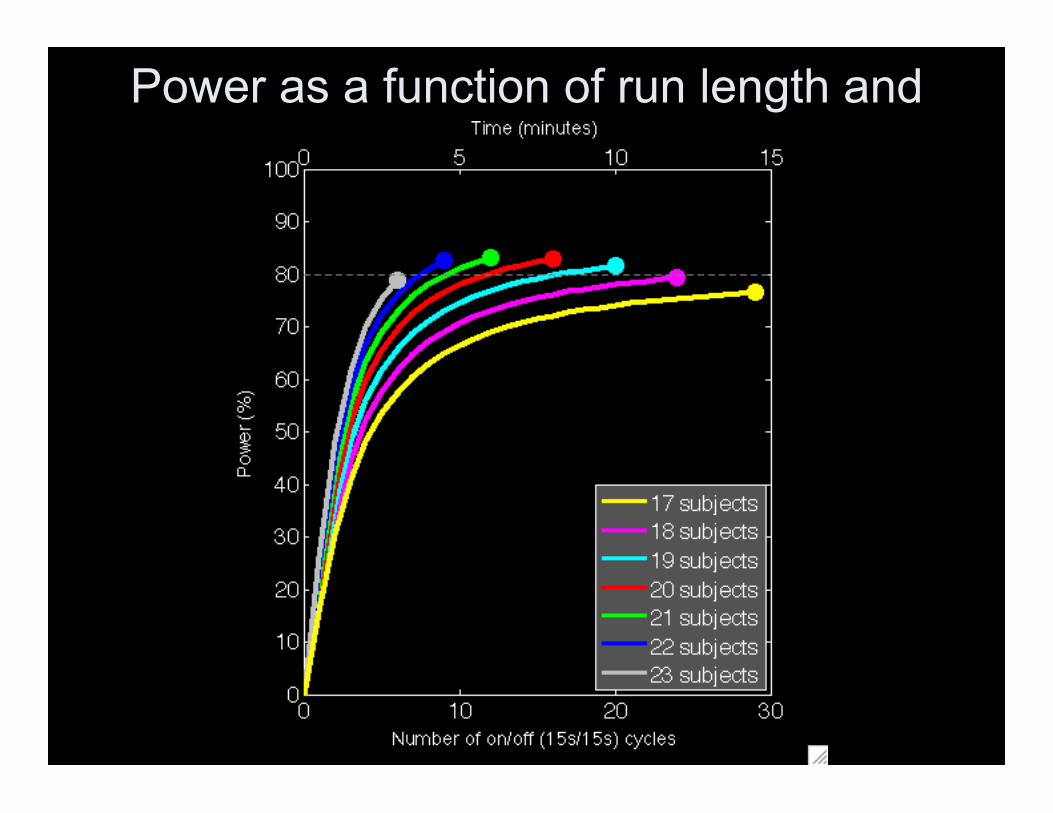
Power as a function of run length andsample size
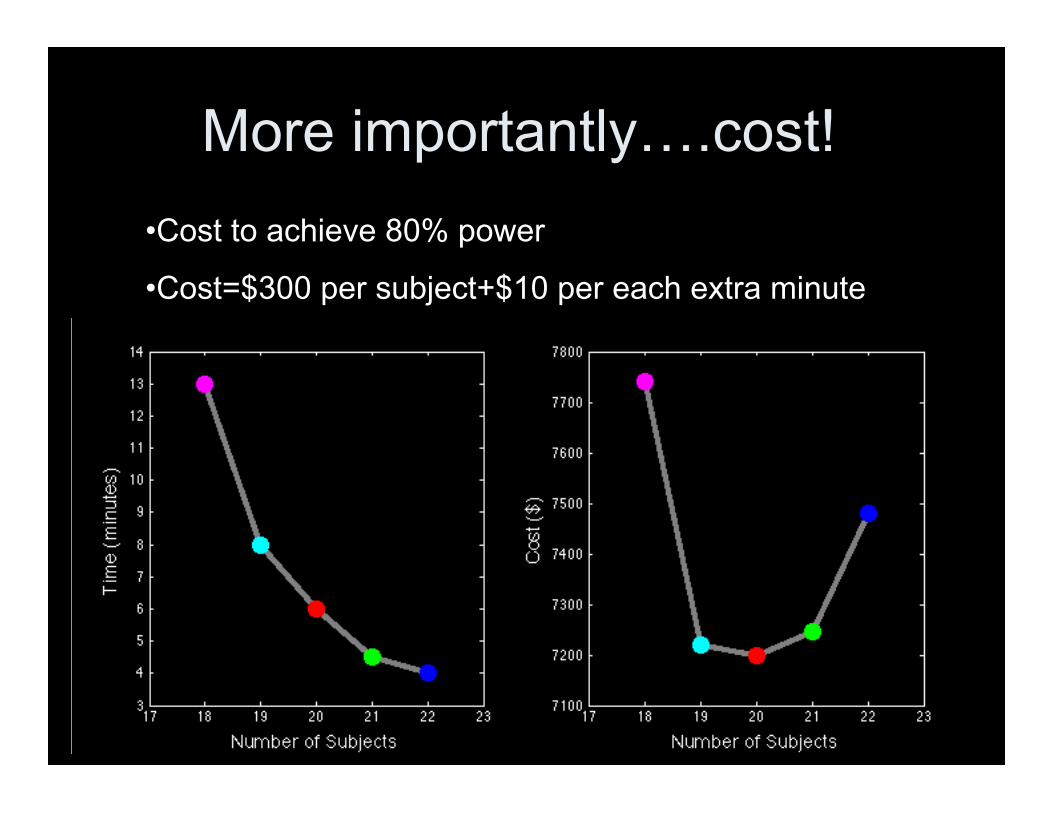
More importantly….cost!•Cost to achieve 80% power
•Cost=$300 per subject+$10 per each extra minute
How Many Runs?
• Can also expand to a 3 level model andstudy impact of adding runs
• Example– ER study– Study used 3 runs per subject– Estimate between run variability– Assume within subject variability is the
same across subjects– Assume study design is same across
subjects
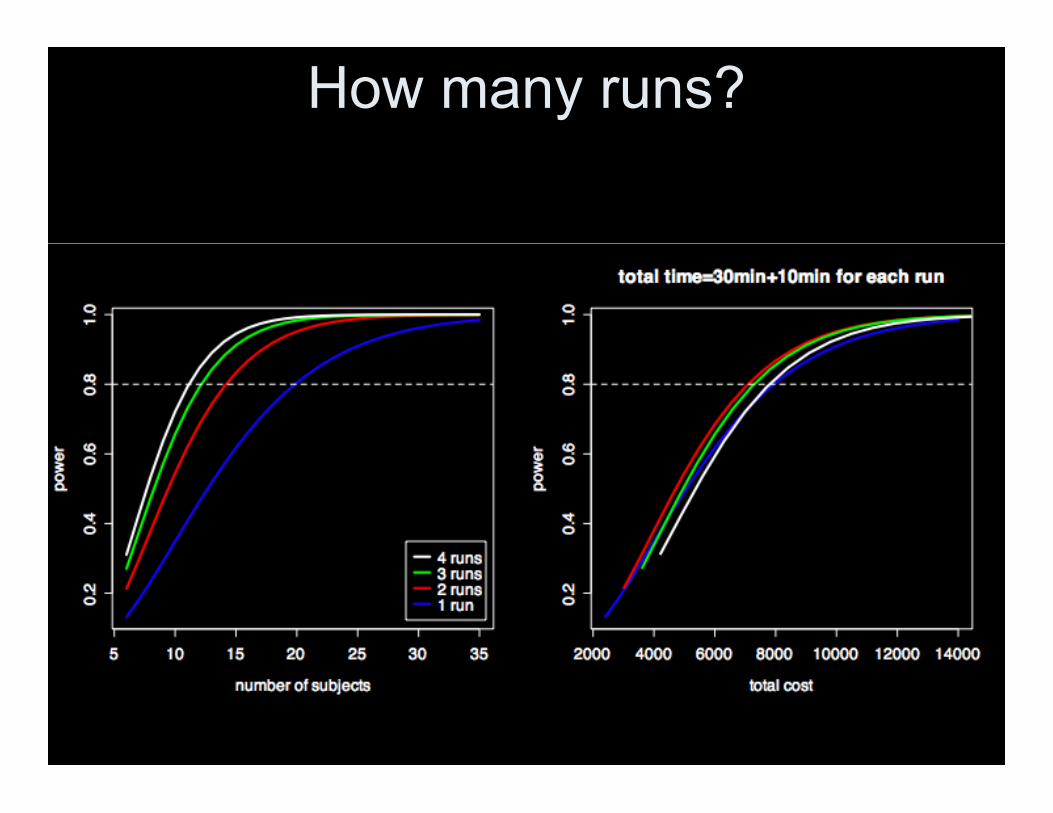
How many runs?
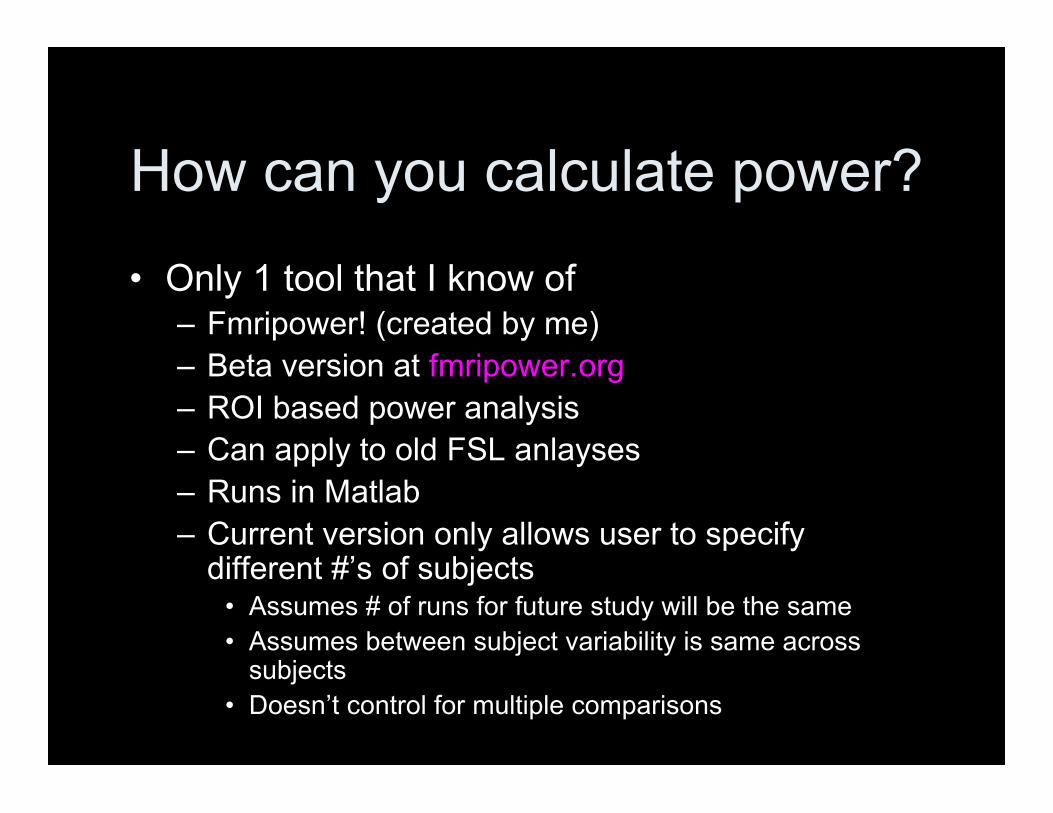
How can you calculate power?
• Only 1 tool that I know of– Fmripower! (created by me)– Beta version at fmripower.org– ROI based power analysis– Can apply to old FSL anlayses– Runs in Matlab– Current version only allows user to specify
different #’s of subjects• Assumes # of runs for future study will be the same• Assumes between subject variability is same across
subjects• Doesn’t control for multiple comparisons
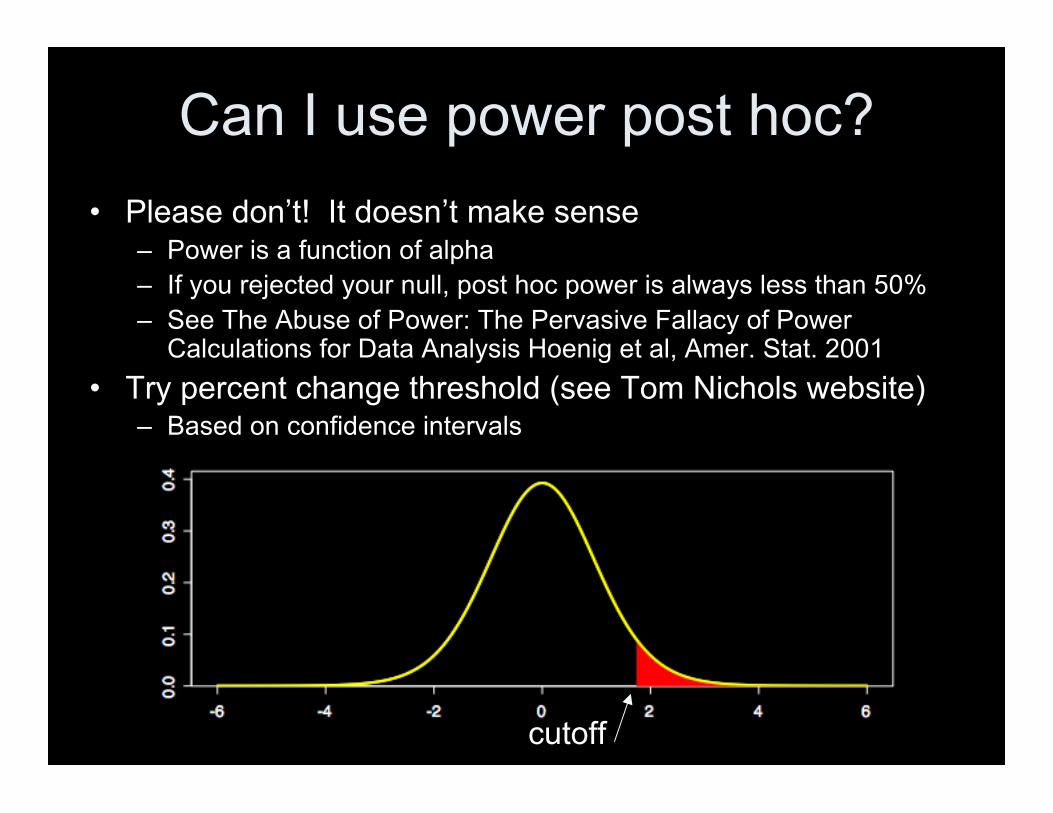
Can I use power post hoc?• Please don’t! It doesn’t make sense
– Power is a function of alpha– If you rejected your null, post hoc power is always less than 50%– See The Abuse of Power: The Pervasive Fallacy of Power
Calculations for Data Analysis Hoenig et al, Amer. Stat. 2001• Try percent change threshold (see Tom Nichols website)
– Based on confidence intervals
cutoff
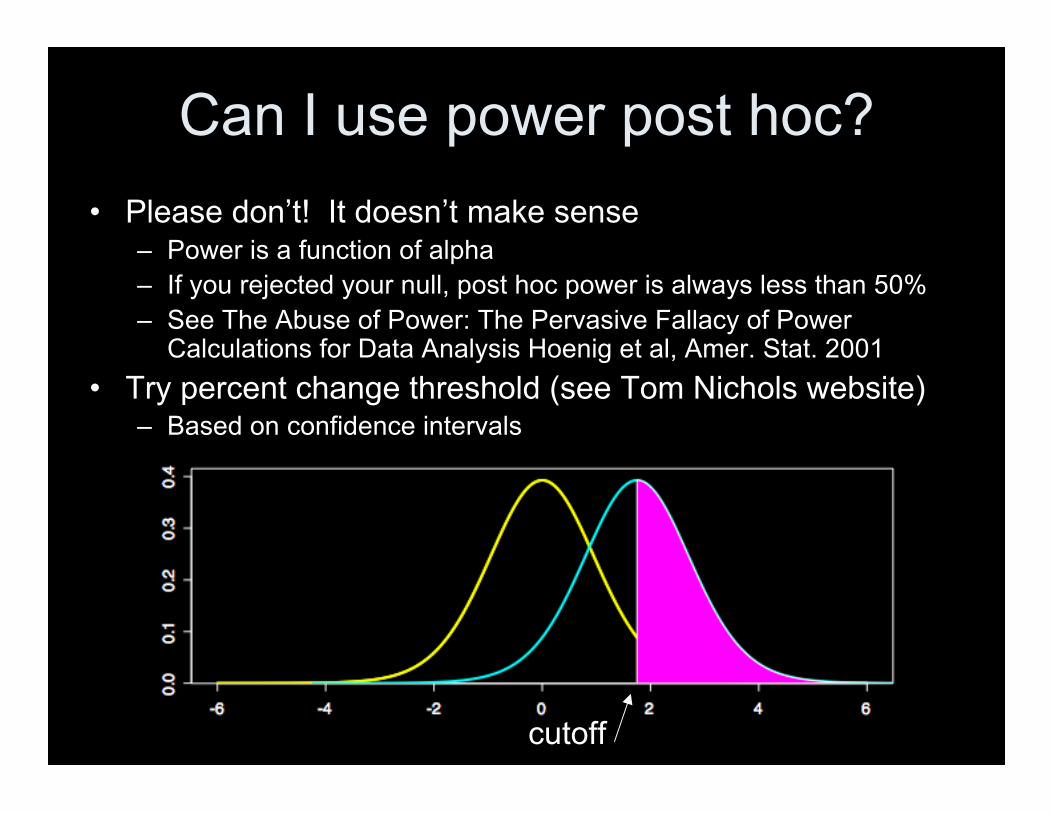
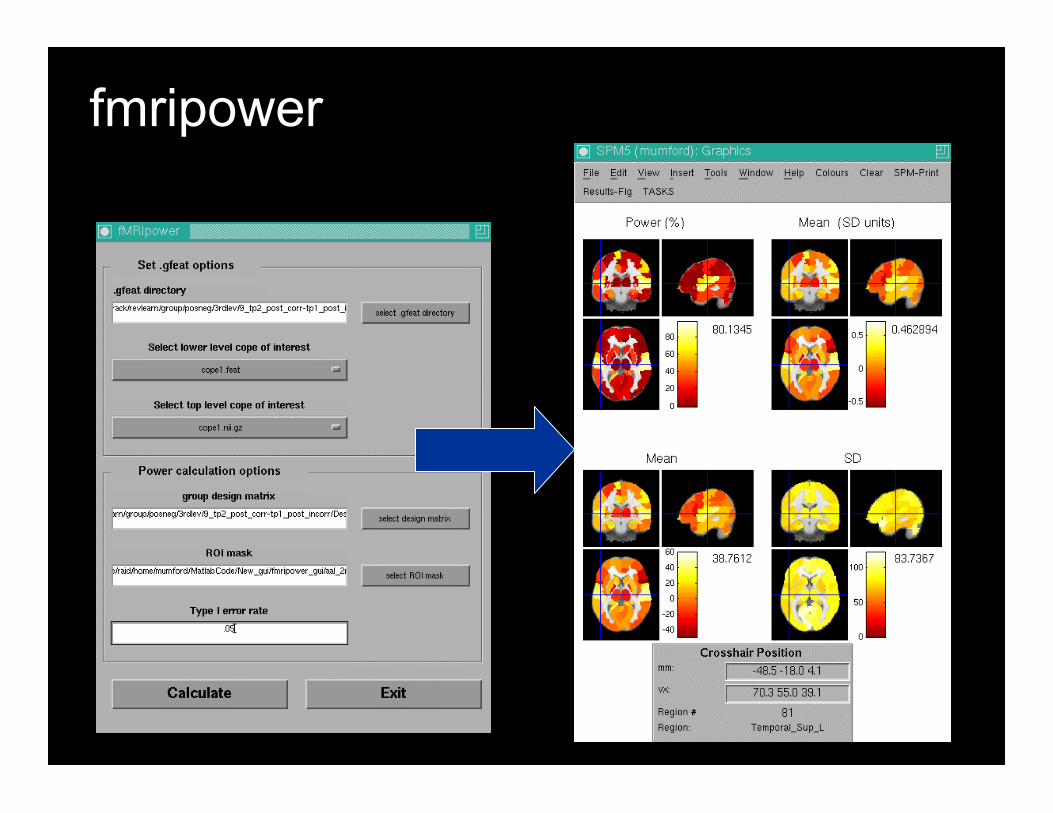
fmripower
Conclusion
• Percent change should be calculated in amanner that is interpretable– Min/max range does not lead to interpretable %-
change– Interpretable %-change is very handy for power
calculations• Power calculations can save you time and
money– Scan enough subjects to see an effect, don’t
waste time on an underpowered study– Don’t keep subjects in the scanner too long if you
don’t need to