ubs redbook
TRANSCRIPT

GENERALLY ACCESSIBLE
October 2008
UBS MBA Investment Banking Recruiting Guide
2008 - 2009
[Jacqueline M. Dinella] [printed: October 30, 2008 9:22 PM] [saved: October 27, 2008 2:59 PM] S:\Global Sourcing\Fall2008-Spring2009\MBA\IBD\Recruiting Guide\UBS MBA Recruiting GuideFINAL 10_27_08.doc
Table of Contents
SECTION 1 UBS Overview _____________________________________________________________________________________ 1
SECTION 2 Internship Timeline ______________________________________________________________________________ 14
SECTION 3 Overview of Investment Banking_______________________________________________________________ 17
SECTION 4 Interview Preparation ___________________________________________________________________________ 24
SECTION 5 UBS Technical Reference Guide _________________________________________________________________ 35

[Jacqueline M. Dinella] [printed: October 30, 2008 9:22 PM] [saved: October 27, 2008 2:59 PM] S:\Global Sourcing\Fall2008-Spring2009\MBA\IBD\Recruiting Guide\UBS MBA Recruiting GuideFINAL 10_27_08.doc
1
SECTION 1
UBS Overview
[Jacqueline M. Dinella] [printed: October 30, 2008 9:22 PM] [saved: October 27, 2008 2:59 PM] S:\Global Sourcing\Fall2008-Spring2009\MBA\IBD\Recruiting Guide\UBS MBA Recruiting GuideFINAL 10_27_08.doc
2
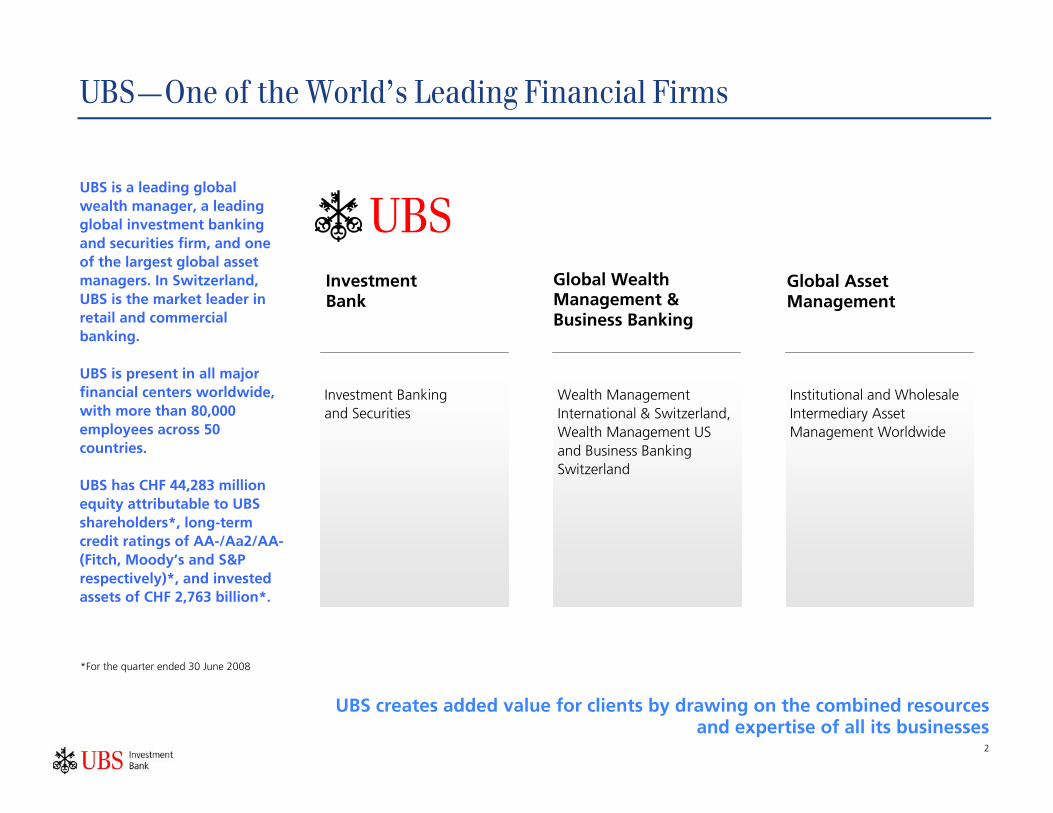
UBS—One of the World’s Leading Financial Firms
UBS creates added value for clients by drawing on the combined resources and expertise of all its businesses
Investment Banking and Securities
Institutional and Wholesale Intermediary Asset Management Worldwide
Wealth Management International & Switzerland, Wealth Management US and Business Banking Switzerland
UBS is a leading global wealth manager, a leading global investment banking and securities firm, and one of the largest global asset managers. In Switzerland, UBS is the market leader in retail and commercial banking. UBS is present in all major financial centers worldwide, with more than 80,000 employees across 50 countries. UBS has CHF 44,283 million equity attributable to UBS shareholders*, long-term credit ratings of AA-/Aa2/AA-(Fitch, Moody’s and S&P respectively)*, and invested assets of CHF 2,763 billion*.
Global Wealth Management & Business Banking
Global Asset Management
Investment Bank
*For the quarter ended 30 June 2008
[Jacqueline M. Dinella] [printed: October 30, 2008 9:22 PM] [saved: October 27, 2008 2:59 PM] S:\Global Sourcing\Fall2008-Spring2009\MBA\IBD\Recruiting Guide\UBS MBA Recruiting GuideFINAL 10_27_08.doc
3
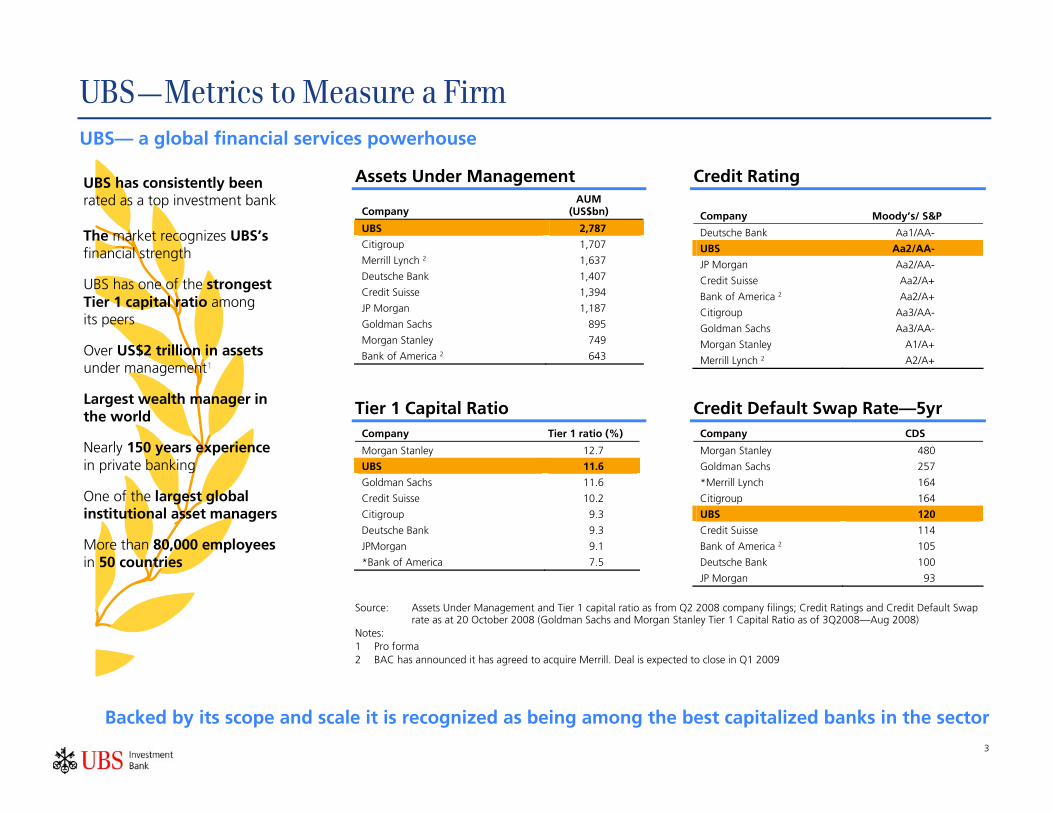
UBS—Metrics to Measure a Firm UBS— a global financial services powerhouse
Assets Under Management Credit Rating
Company AUM
(US$bn)
UBS 2,787
Citigroup 1,707
Merrill Lynch 2 1,637
Deutsche Bank 1,407
Credit Suisse 1,394
JP Morgan 1,187
Goldman Sachs 895
Morgan Stanley 749
Bank of America 2 643
Company
Moody’s/ S&P
Deutsche Bank Aa1/AA-
UBS Aa2/AA-
JP Morgan Aa2/AA-
Credit Suisse Aa2/A+
Bank of America 2 Aa2/A+
Citigroup Aa3/AA-
Goldman Sachs Aa3/AA-
Morgan Stanley A1/A+
Merrill Lynch 2 A2/A+
Tier 1 Capital Ratio Credit Default Swap Rate—5yr Company Tier 1 ratio (%)
Morgan Stanley 12.7
UBS 11.6
Goldman Sachs 11.6
Credit Suisse 10.2
Citigroup 9.3
Deutsche Bank 9.3
JPMorgan 9.1
*Bank of America 7.5
Company CDS
Morgan Stanley 480
Goldman Sachs 257
*Merrill Lynch 164
Citigroup 164
UBS 120
Credit Suisse 114
Bank of America 2 105
Deutsche Bank 100
JP Morgan 93
Source: Assets Under Management and Tier 1 capital ratio as from Q2 2008 company filings; Credit Ratings and Credit Default Swap rate as at 20 October 2008 (Goldman Sachs and Morgan Stanley Tier 1 Capital Ratio as of 3Q2008—Aug 2008)
Notes: 1 Pro forma 2 BAC has announced it has agreed to acquire Merrill. Deal is expected to close in Q1 2009
Backed by its scope and scale it is recognized as being among the best capitalized banks in the sector
UBS has consistently been rated as a top investment bank
The market recognizes UBS’s financial strength
UBS has one of the strongest Tier 1 capital ratio among its peers
Over US$2 trillion in assetsunder management1
Largest wealth manager in the world
Nearly 150 years experiencein private banking
One of the largest global institutional asset managers
More than 80,000 employeesin 50 countries

[Jacqueline M. Dinella] [printed: October 30, 2008 9:22 PM] [saved: October 27, 2008 2:59 PM] S:\Global Sourcing\Fall2008-Spring2009\MBA\IBD\Recruiting Guide\UBS MBA Recruiting GuideFINAL 10_27_08.doc
4
Q3 Remaining Leveraged Loan and Real Estate Exposure
73
6459
36 35 3532
4
(5.0)
15.0
35.0
55.0
75.0
Citi Deutsche
Bank
Merrill Lynch Morgan
Stanley
Goldman
Sachs
Credit Suisse JP Morgan UBS
Leverage Loans Residential CMBS
Source: CEO Mgmt Office and Public Documents Note: Deutsche Bank and Credit Suisse exposure as of Q2 as they have not yet reported

[Jacqueline M. Dinella] [printed: October 30, 2008 9:22 PM] [saved: October 27, 2008 2:59 PM] S:\Global Sourcing\Fall2008-Spring2009\MBA\IBD\Recruiting Guide\UBS MBA Recruiting GuideFINAL 10_27_08.doc
5
Clients Look to their Trusted M&A Advisor During Volatile Times
Rank Mkt Share Rank Mkt Share Rank Mkt Share Rank Mkt ShareM&A 6 5.8 4 6.1 4 7.1 3 7.2
FY 2007FY 2006 YTD 2008FY 2005
Notable 2008 M&A Transactions
US$10.0 bn, Advisor for Constellation Energy on their sale to MidAmerican Energy Holding Company, a Berkshire Hathaway subsidiary. UBS capital commitment of US$ 1.0 bn
GB£15.3 bn, Advisor, Bookrunner, and Sponsor to Lloycs TSB Group PLC on the revised terms for their acquisition of HBOS PLC, their capital raise of GB£ 5.5bn with the support of HM Treasury
US$6.5 bn, Advisor for Eli Lilly and finance arranger for cash offer for IMCLONE Systems, Inc. UBS made an undisclosed capital commitment to Eli Lilly.
GB£ 20.0 bn & GB£12.2 bn, Advisor, Bookrunner, and Sponsor to RBS’ on their rights issuance with HM Treasury and Bookrunner on their fully underwritten issuance where UBS made a capital commitment of GB£ 2.4 billion.
US$6.0 bn, Advisor for International Paper on acquisition of Weyerhauser and lead arranger of debt financing. UBS capital commitment of US$ 1.2 bn to Baa3 rated International Paper.
EUR 11.9bn, Advisor and joint mandated lead arranger of debt financing to INA Schaeffler KG on its tender offer for all outstanding shares of Continental AG. UBS capital commitment of US$ 1.6 bn.
US$4.4 bn, Advisor on Cadbury Schweppes PLC’s demerger of Dr. Pepper Snapple Group and lead arranger of debt financing. UBS capital commitment of USD 880 m to Baa2 rated Cadbury Schweppes PLC.
US$35.9 bn, Exclusive advisor and joint lead financing arranger for Gas Natural’s acquisition of Union Fenosa. UBS capital commitment of US$3.1 bn.
US$2.9 bn, Lead financial advisor to Vodafone on its 45% owned US affiliate Verizon Wireless’ acquisition of Alltel. UBS capital commitment of US$ 1.2 bn.
US$2.3 bn, Exclusive advisor and exclusive financing arranger for Illinois Tool Works acquisition of Enodis plc. UBS capital commitment of US$2.6 bn.
US$4.1 bn Advisor for Reed Elsevier and lead finance arranger for recommended cash offer for Choicepoint Inc. UBS capital commitment of US$ 1.5 bn to Baa1 rated Reed Elsevier.
US$6.7 bn, Lead advisor to Invitrogen Corp. on its acquisition of Applied Biosystems, creating the second largest pure-play life sciences company in the world. UBS capital commitment of US$795m.
US$3.9 bn, Exclusive advisor on Grey Wolf Inc’s merger of equals with Basic Energy Services, Inc. and lead arranger of debt financing. UBS capital commitment of US$ 462m.
US$20.5 bn, Lead advisor to Allied Waste Industries, Inc. in its definitive merger agreement with Republic Services, Inc
US$18.6 bn, Sole financial advisor to St.George Bank Limited on merger offer from Westpac Banking.
[Jacqueline M. Dinella] [printed: October 30, 2008 9:22 PM] [saved: October 27, 2008 2:59 PM] S:\Global Sourcing\Fall2008-Spring2009\MBA\IBD\Recruiting Guide\UBS MBA Recruiting GuideFINAL 10_27_08.doc
6
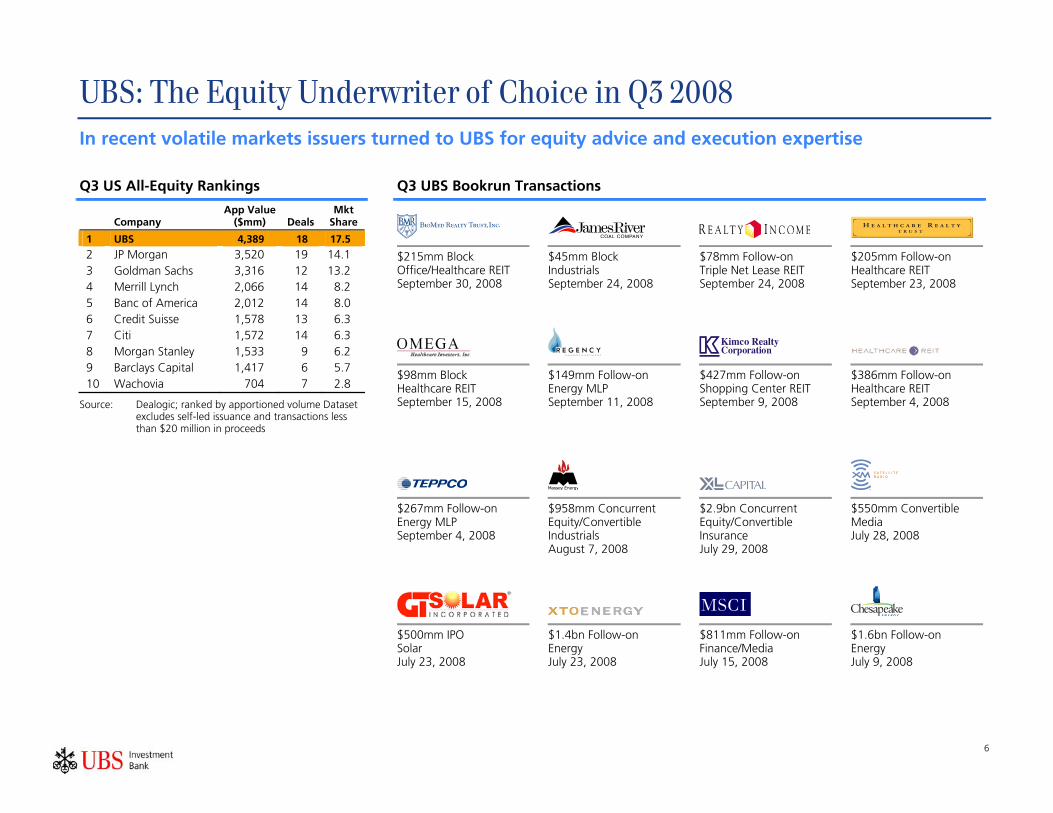
UBS: The Equity Underwriter of Choice in Q3 2008 In recent volatile markets issuers turned to UBS for equity advice and execution expertise
Q3 US All-Equity Rankings
Q3 UBS Bookrun Transactions
Company App Value
($mm) Deals Mkt
Share
1 UBS 4,389 18 17.5
2 JP Morgan 3,520 19 14.1 3 Goldman Sachs 3,316 12 13.2 4 Merrill Lynch 2,066 14 8.2 5 Banc of America 2,012 14 8.0 6 Credit Suisse 1,578 13 6.3 7 Citi 1,572 14 6.3 8 Morgan Stanley 1,533 9 6.2 9 Barclays Capital 1,417 6 5.7 10 Wachovia 704 7 2.8
Source: Dealogic; ranked by apportioned volume Dataset excludes self-led issuance and transactions less than $20 million in proceeds
$215mm Block Office/Healthcare REIT September 30, 2008
$45mm Block Industrials September 24, 2008
$78mm Follow-on Triple Net Lease REIT September 24, 2008
$205mm Follow-on Healthcare REIT September 23, 2008
$98mm Block Healthcare REIT September 15, 2008
$149mm Follow-on Energy MLP September 11, 2008
$427mm Follow-on Shopping Center REIT September 9, 2008
$386mm Follow-on Healthcare REIT September 4, 2008
$267mm Follow-on Energy MLP September 4, 2008
$958mm Concurrent Equity/Convertible Industrials August 7, 2008
$2.9bn Concurrent Equity/Convertible Insurance July 29, 2008
$550mm Convertible Media July 28, 2008
$500mm IPO Solar July 23, 2008
$1.4bn Follow-on Energy July 23, 2008
$811mm Follow-on Finance/Media July 15, 2008
$1.6bn Follow-on Energy July 9, 2008
[Jacqueline M. Dinella] [printed: October 30, 2008 9:22 PM] [saved: October 27, 2008 2:59 PM] S:\Global Sourcing\Fall2008-Spring2009\MBA\IBD\Recruiting Guide\UBS MBA Recruiting GuideFINAL 10_27_08.doc
7
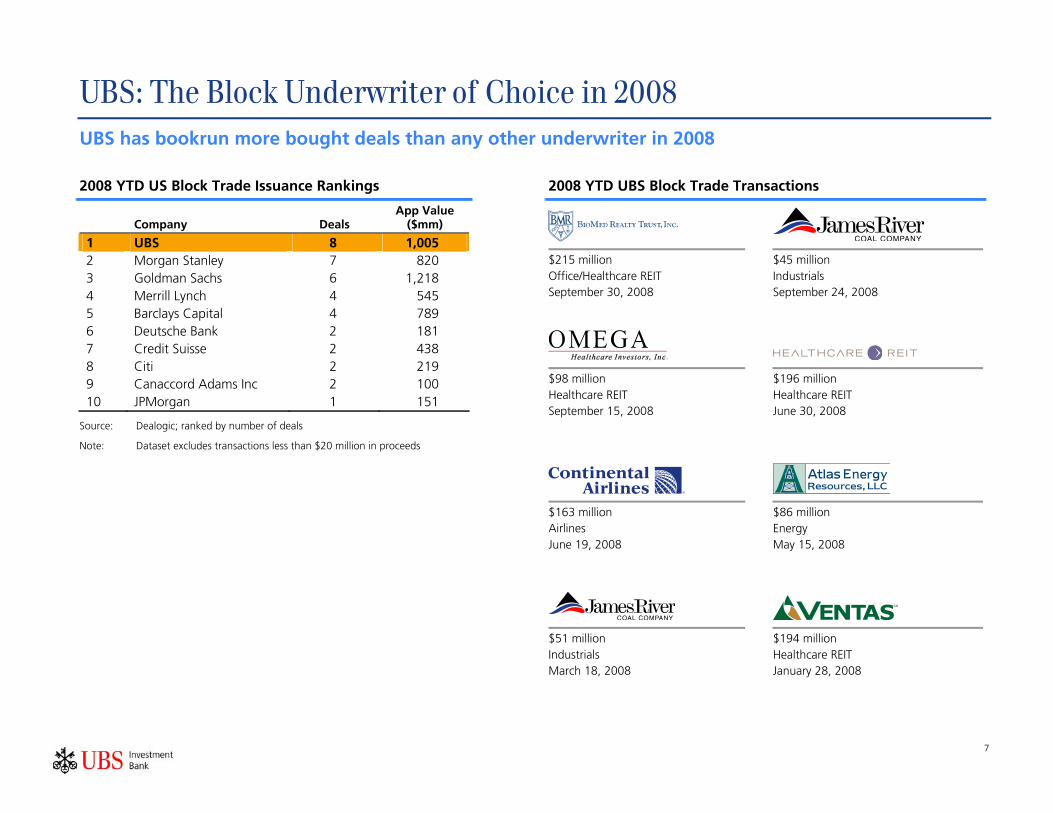
UBS: The Block Underwriter of Choice in 2008 UBS has bookrun more bought deals than any other underwriter in 2008
2008 YTD US Block Trade Issuance Rankings
2008 YTD UBS Block Trade Transactions
Company Deals App Value
($mm)
1 UBS 8 1,005 2 Morgan Stanley 7 820 3 Goldman Sachs 6 1,218 4 Merrill Lynch 4 545 5 Barclays Capital 4 789 6 Deutsche Bank 2 181 7 Credit Suisse 2 438 8 Citi 2 219 9 Canaccord Adams Inc 2 100 10 JPMorgan 1 151
Source: Dealogic; ranked by number of deals
Note: Dataset excludes transactions less than $20 million in proceeds
$215 million Office/Healthcare REIT September 30, 2008
$45 million Industrials September 24, 2008
$98 million Healthcare REIT September 15, 2008
$196 million Healthcare REIT June 30, 2008
$163 million Airlines June 19, 2008
$86 million Energy May 15, 2008
$51 million Industrials March 18, 2008
$194 million Healthcare REIT January 28, 2008

[Jacqueline M. Dinella] [printed: October 30, 2008 9:22 PM] [saved: October 27, 2008 2:59 PM] S:\Global Sourcing\Fall2008-Spring2009\MBA\IBD\Recruiting Guide\UBS MBA Recruiting GuideFINAL 10_27_08.doc
8
UBS: The Top-Ranked Trader of Equities in the US In the midst of unprecedented volatility, clients turned to UBS for their superior trading platform. This resulted in increased market share and a No. 1 ranking
2008 US Trading Rankings
January 1 to September 12, 2008 September 15 to September 30, 2008
Rank Company Mkt. Share (%)
1 Morgan Stanley 14.2 2 UBS 13.6 3 Merrill Lynch 13.3 4 Credit Suisse 8.6 5 Deutsche Bank 8.1 6 Citi 7.2 7 Barclays Capital (Lehman) 6.8 8 JP Morgan 6.0 9 RBC Capital 3.3 10 Goldman Sachs 3.0
Rank Company Mkt. Share (%)
1 UBS 19.7 2 Merrill Lynch 12.1 3 Morgan Stanley 11.4 4 Credit Suisse 10.6 5 Citi 9.0 6 Deutsche Bank 6.9 7 JP Morgan 6.4 8 Goldman Sachs 4.2 9 RBC Capital 3.6 10 Banc of America 3.0
Rank Company Mkt. Share (%)
1 UBS 14.8 2 Morgan Stanley 13.5 3 Merrill Lynch 9.2 4 Credit Suisse 7.6 5 Citi 7.3 6 Barclays Capital (Lehman) 7.2 7 JP Morgan 5.8 8 Goldman Sachs 4.6 9 RBC Capital 4.6 10 Banc of America 3.8
Rank Company Mkt. Share (%)
1 UBS 16.3 2 Morgan Stanley 13.2 3 Credit Suisse 9.2 4 Merrill Lynch 9.0 5 Citi 7.3 6 JP Morgan 7.1 7 Goldman Sachs 5.3 8 Deutsche Bank 5.2 9 Banc of America 4.5 10 RBC Capital 3.1
Source: Autex

[Jacqueline M. Dinella] [printed: October 30, 2008 9:22 PM] [saved: October 27, 2008 2:59 PM] S:\Global Sourcing\Fall2008-Spring2009\MBA\IBD\Recruiting Guide\UBS MBA Recruiting GuideFINAL 10_27_08.doc
9
H1 2008 Performance
* BAC has announced it has agreed to acquire Merrill Lynch. Deal is expected to close in Q1 2009
(1,057)
(224)
449
554
1,082
1,145
1,355
(1,314)
(1,750) (1,250) (750) (250) 250 750 1,250 1,750
DB
C
CS
MS
MER*
GS
JPM
UBS
US$ in millions
UBS maintained or increased its market position ranking in the majority of regions in H1 2008 from FY 2007
21BRIC
11Australia
79Japan
41Asia ex Japan
11APAC
13EMEA
32LatAm
89North America
88AMERICAS
55GLOBAL
H1 2008FY 2007
UBS Market Share (Rank)
21BRIC
11Australia
79Japan
41Asia ex Japan
11APAC
13EMEA
32LatAm
89North America
88AMERICAS
55GLOBAL
H1 2008FY 2007
UBS Market Share (Rank)
Source: Dealogic as of 30 June 2008
Consistent and measured achievements
H1 2008 financial performance - net of leveraged loan write-downs
[Jacqueline M. Dinella] [printed: October 30, 2008 9:22 PM] [saved: October 27, 2008 2:59 PM] S:\Global Sourcing\Fall2008-Spring2009\MBA\IBD\Recruiting Guide\UBS MBA Recruiting GuideFINAL 10_27_08.doc
10
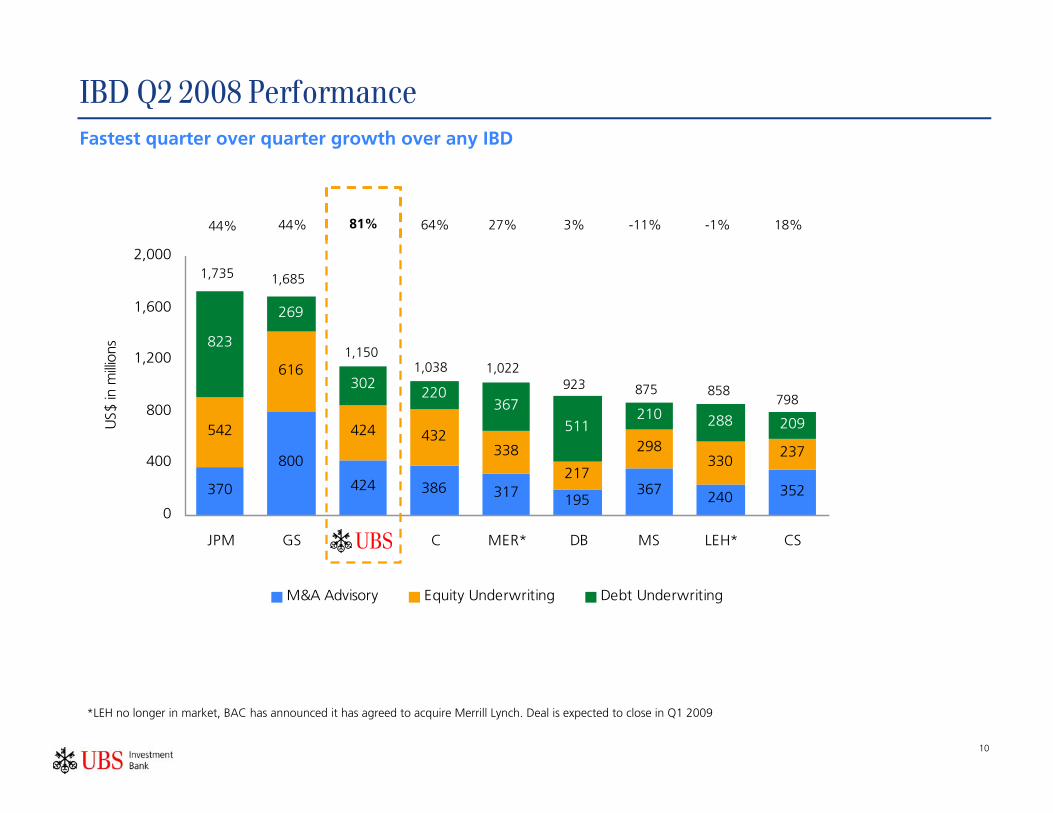
IBD Q2 2008 Performance Fastest quarter over quarter growth over any IBD
44% 44% 81% 64% 27% 3% -11% -1% 18%
370
800
424 386 317 195367 240 352
542
616
424 432338
217
298330
237
823
269
302220
367
511210 288 209
0
400
800
1,200
1,600
2,000
JPM GS UBS C MER* DB MS LEH* CS
US$
in m
illion
s
M&A Advisory Equity Underwriting Debt Underwriting
1,735 1,685
1,1501,038 1,022
923 875 858798
44% 44% 81% 64% 27% 3% -11% -1% 18%
370
800
424 386 317 195367 240 352
542
616
424 432338
217
298330
237
823
269
302220
367
511210 288 209
0
400
800
1,200
1,600
2,000
JPM GS UBS C MER* DB MS LEH* CS
US$
in m
illion
s
M&A Advisory Equity Underwriting Debt Underwriting
44% 44% 81% 64% 27% 3% -11% -1% 18%
370
800
424 386 317 195367 240 352
542
616
424 432338
217
298330
237
823
269
302220
367
511210 288 209
0
400
800
1,200
1,600
2,000
JPM GS UBS C MER* DB MS LEH* CS
US$
in m
illion
s
M&A Advisory Equity Underwriting Debt Underwriting
370
800
424 386 317 195367 240 352
542
616
424 432338
217
298330
237
823
269
302220
367
511210 288 209
0
400
800
1,200
1,600
2,000
JPM GS UBS C MER* DB MS LEH* CS
US$
in m
illion
s
M&A Advisory Equity Underwriting Debt Underwriting
1,735 1,685
1,1501,038 1,022
923 875 858798
*LEH no longer in market, BAC has announced it has agreed to acquire Merrill Lynch. Deal is expected to close in Q1 2009

[Jacqueline M. Dinella] [printed: October 30, 2008 9:22 PM] [saved: October 27, 2008 2:59 PM] S:\Global Sourcing\Fall2008-Spring2009\MBA\IBD\Recruiting Guide\UBS MBA Recruiting GuideFINAL 10_27_08.doc
11
What Do Investment Bankers Do?
Intermediary
Investment Bankers
Principal
Research
BrokersCapital Markets
Sales& Trading
♦ Equity♦ Debt♦ Risk Management♦ FX/Commodities
Advisory
♦ Mergers & Acquisitions
♦ Corporate Finance♦ Restructuring
♦ Capital
♦ Risk Assumption
♦ Proprietary Trading
Corporations
Governments
Financial Institutions
Private Equity Sponsors
Clients(…need capital)
Retail InvestorsIndividuals
Investor Clients(…have capital)
Institutional Investors
Mutual fundsPension fundsHedge funds
Analysts
Intermediary
Investment Bankers
Principal
Research
BrokersCapital Markets
Sales& Trading
♦ Equity♦ Debt♦ Risk Management♦ FX/Commodities
Advisory
♦ Mergers & Acquisitions
♦ Corporate Finance♦ Restructuring
♦ Capital
♦ Risk Assumption
♦ Proprietary Trading
Corporations
Governments
Financial Institutions
Private Equity Sponsors
Clients(…need capital)
Retail InvestorsIndividuals
Investor Clients(…have capital)
Institutional Investors
Mutual fundsPension fundsHedge funds
Institutional Investors
Mutual fundsPension fundsHedge funds
Analysts

[Jacqueline M. Dinella] [printed: October 30, 2008 9:22 PM] [saved: October 27, 2008 2:59 PM] S:\Global Sourcing\Fall2008-Spring2009\MBA\IBD\Recruiting Guide\UBS MBA Recruiting GuideFINAL 10_27_08.doc
12
Client Groups
IBD Serves the Following Primary Client Groups GIG and Financial Institutions Represent the Largest Super Sectors
Sovereigns / Agencies
Banks / Financial Intermediaries
Asset Managers
Hedge Funds
Corporates
Financial Sponsors
Insurance Companies
General Partners (GPs)
Sovereigns / Agencies
Banks / Financial Intermediaries
Asset Managers
Hedge Funds
Corporates
Financial Sponsors
Insurance Companies
General Partners (GPs)
Revenues by Super Sector (2007)
GIG24%
FIG19%
REL&L12%
Tele.2%
Health.11%
Tech.7%
Util.5%
Energy5%
Other Sectors
5%
Media4%
CP&R3%
PFG2% Infra.
1%
`

[Jacqueline M. Dinella] [printed: October 30, 2008 9:22 PM] [saved: October 27, 2008 2:59 PM] S:\Global Sourcing\Fall2008-Spring2009\MBA\IBD\Recruiting Guide\UBS MBA Recruiting GuideFINAL 10_27_08.doc
13
IBD—An Established Franchise in the US With revenues doubling and over 200 additional bankers since 2002, UBS has built a world class IBD franchise in the US
Solid Business Model ♦ UBS franchise in the US has the size and expertise to compete across all products and sectors
♦ Continuing to build on the momentum to achieve the goal of Top 5 position
Strong US Presence ♦ Over 900 bankers and 14 global heads based in the US
♦ Major offices in New York, Chicago, Los Angeles, San Francisco and Houston
Unrivaled Global Capabilities
♦ No. 1 franchise in APAC is well positioned to take advantage of expected growth in China and other emerging countries
♦ A solid EMEA franchise with ambitions to be No. 1

[Jacqueline M. Dinella] [printed: October 30, 2008 9:22 PM] [saved: October 27, 2008 2:59 PM] S:\Global Sourcing\Fall2008-Spring2009\MBA\IBD\Recruiting Guide\UBS MBA Recruiting GuideFINAL 10_27_08.doc
14
SECTION 2
Internship Timeline
[Jacqueline M. Dinella] [printed: October 30, 2008 9:22 PM] [saved: October 27, 2008 2:59 PM] S:\Global Sourcing\Fall2008-Spring2009\MBA\IBD\Recruiting Guide\UBS MBA Recruiting GuideFINAL 10_27_08.doc
15
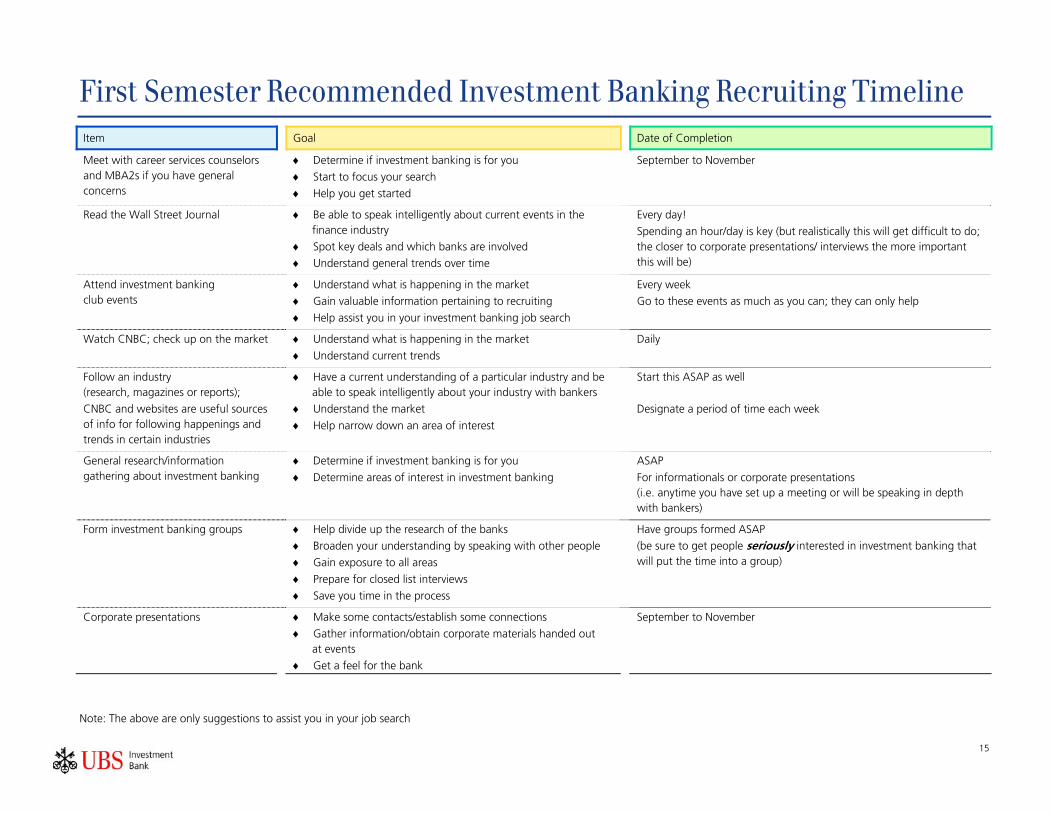
First Semester Recommended Investment Banking Recruiting Timeline Item Goal Date of Completion
Meet with career services counselors and MBA2s if you have general concerns
♦ Determine if investment banking is for you
♦ Start to focus your search
♦ Help you get started
September to November
Read the Wall Street Journal ♦ Be able to speak intelligently about current events in the finance industry
♦ Spot key deals and which banks are involved
♦ Understand general trends over time
Every day!
Spending an hour/day is key (but realistically this will get difficult to do; the closer to corporate presentations/ interviews the more important this will be)
Attend investment banking club events
♦ Understand what is happening in the market
♦ Gain valuable information pertaining to recruiting
♦ Help assist you in your investment banking job search
Every week
Go to these events as much as you can; they can only help
Watch CNBC; check up on the market ♦ Understand what is happening in the market
♦ Understand current trends
Daily
Follow an industry (research, magazines or reports);
CNBC and websites are useful sources of info for following happenings and trends in certain industries
♦ Have a current understanding of a particular industry and be able to speak intelligently about your industry with bankers
♦ Understand the market
♦ Help narrow down an area of interest
Start this ASAP as well
Designate a period of time each week
General research/information gathering about investment banking
♦ Determine if investment banking is for you
♦ Determine areas of interest in investment banking
ASAP
For informationals or corporate presentations (i.e. anytime you have set up a meeting or will be speaking in depth with bankers)
Form investment banking groups ♦ Help divide up the research of the banks
♦ Broaden your understanding by speaking with other people
♦ Gain exposure to all areas
♦ Prepare for closed list interviews
♦ Save you time in the process
Have groups formed ASAP
(be sure to get people seriously interested in investment banking that will put the time into a group)
Corporate presentations
♦ Make some contacts/establish some connections
♦ Gather information/obtain corporate materials handed out at events
♦ Get a feel for the bank
September to November
Note: The above are only suggestions to assist you in your job search

[Jacqueline M. Dinella] [printed: October 30, 2008 9:22 PM] [saved: October 27, 2008 2:59 PM] S:\Global Sourcing\Fall2008-Spring2009\MBA\IBD\Recruiting Guide\UBS MBA Recruiting GuideFINAL 10_27_08.doc
16
First Semester Recommended Investment Banking Recruiting Timeline Item Goal Date of Completion
Corporate events ♦ Attend those designated specifically towards areas of interest
♦ Make some contacts/get your name out there
♦ Get a feel for the bank
All fall and recruiting season
Put together a strong resume; includes reviewing with a career counselor, peers and those in the industry
♦ Attend career services events and workshops
♦ Have a resume that is focused on investment banking
♦ Know how to tailor a specific resume in investment banking terms
♦ Have a working resume ASAP; it is better to have a decent resume in case bankers or anyone needs to see something before your “official” resume is posted
Start putting this together ASAP, but gather information from club and career services events to help you.
DO NOT WAIT UNTIL THE LAST MINUTE
(The resume deadline sneaks up quickly)
The bulk of this work should be done during October
Resumes completed ♦ Have a strong working resume for investment banking events
♦ Have one main resume which you will always use (not great to have floating copies of former resumes going out to the banks)
October/November
Specific bank analysis; industry information
♦ Be able to speak intelligently to bankers about their specific bank
Before informational interviews
Set up and prepare for informationals ♦ Help make contacts for closed lists
♦ Understand the bank better
♦ Demonstrate what a good candidate you are
♦ Show interest and do your homework
Usually time period of mid-to-late October to Winter Break
Some banks make lists earlier than others
(Start with junior bankers first)
Send out resumes and cover letters ♦ GET ON CLOSED LISTS SO YOU CAN INTERVIEW Usually around Thanksgiving; allow sufficient time, it takes longer than you think to come up with good cover letters and gather all of the addresses
Pay attention to club and career services reminders as the semester progresses
Complete informationals; attend remaining recruiting events
♦ Help make contacts for closed lists
♦ Meet more people and get your name out there
By closed list deadlines (usually before Winter Break is the very last chance to visit—check each bank’s deadlines so you don’t miss out!)
Note: The above are only suggestions to assist you in your job search

[Jacqueline M. Dinella] [printed: October 30, 2008 9:22 PM] [saved: October 27, 2008 2:59 PM] S:\Global Sourcing\Fall2008-Spring2009\MBA\IBD\Recruiting Guide\UBS MBA Recruiting GuideFINAL 10_27_08.doc
17
SECTION 3
Overview of Investment Banking
[Jacqueline M. Dinella] [printed: October 30, 2008 9:22 PM] [saved: October 27, 2008 2:59 PM] S:\Global Sourcing\Fall2008-Spring2009\MBA\IBD\Recruiting Guide\UBS MBA Recruiting GuideFINAL 10_27_08.doc
18
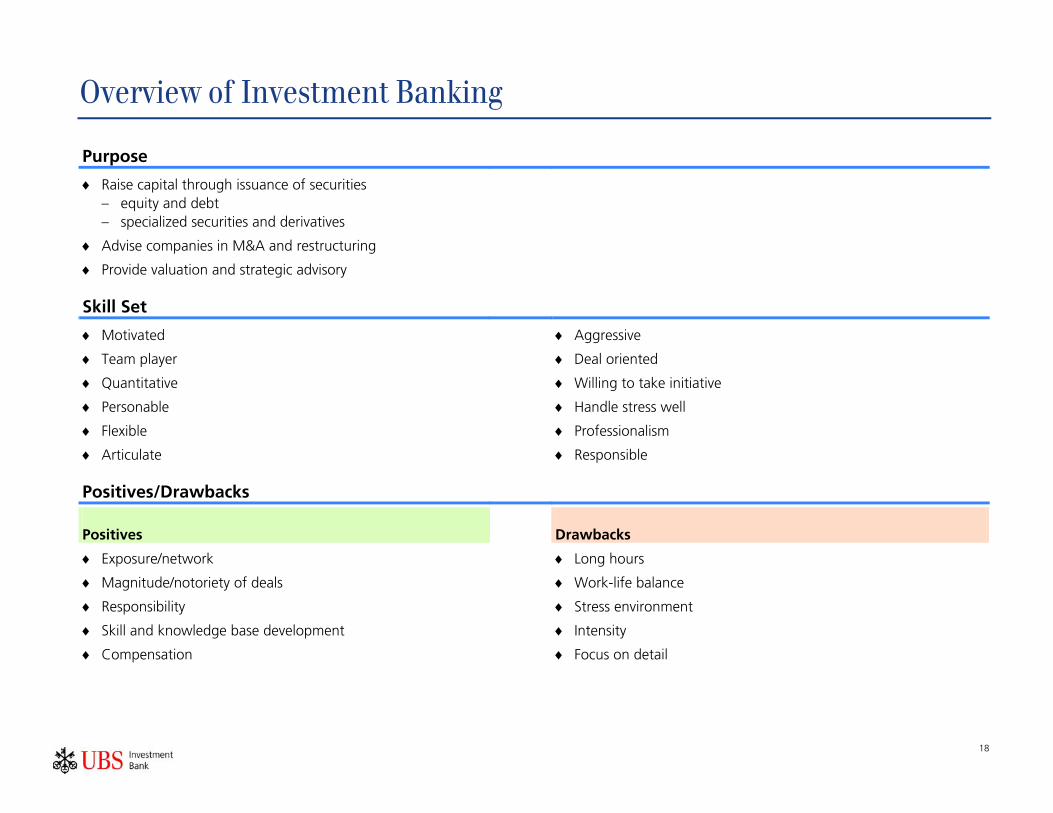
Overview of Investment Banking
Purpose
♦ Raise capital through issuance of securities – equity and debt – specialized securities and derivatives
♦ Advise companies in M&A and restructuring
♦ Provide valuation and strategic advisory
Skill Set
♦ Motivated
♦ Team player
♦ Quantitative
♦ Personable
♦ Flexible
♦ Articulate
♦ Aggressive
♦ Deal oriented
♦ Willing to take initiative
♦ Handle stress well
♦ Professionalism
♦ Responsible
Positives/Drawbacks
Positives Drawbacks
♦ Exposure/network
♦ Magnitude/notoriety of deals
♦ Responsibility
♦ Skill and knowledge base development
♦ Compensation
♦ Long hours
♦ Work-life balance
♦ Stress environment
♦ Intensity
♦ Focus on detail
[Jacqueline M. Dinella] [printed: October 30, 2008 9:22 PM] [saved: October 27, 2008 2:59 PM] S:\Global Sourcing\Fall2008-Spring2009\MBA\IBD\Recruiting Guide\UBS MBA Recruiting GuideFINAL 10_27_08.doc
19
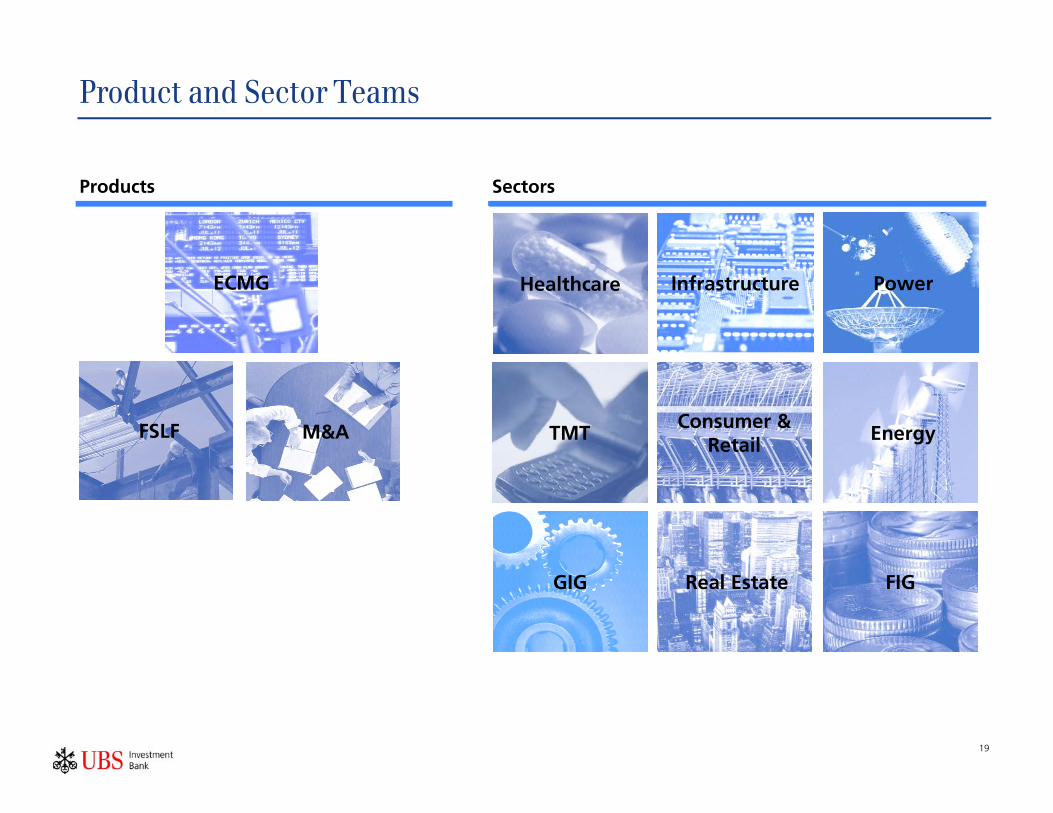
Product and Sector Teams
Products Sectors
ECMG
FSLF M&A
ECMG
FSLF M&A
Healthcare Infrastructure Power
GIG Real Estate FIG
Consumer & Retail
EnergyTMT
Healthcare Infrastructure Power
GIG Real Estate FIG
Consumer & Retail
EnergyTMT

[Jacqueline M. Dinella] [printed: October 30, 2008 9:22 PM] [saved: October 27, 2008 2:59 PM] S:\Global Sourcing\Fall2008-Spring2009\MBA\IBD\Recruiting Guide\UBS MBA Recruiting GuideFINAL 10_27_08.doc
20
Product/Sector Interaction
Product Strengths Sector Strengths
♦ Product Expertise
♦ Global Product Liaison
♦ Execution Experience
♦ Specialized Resources
♦ Sector Knowledge
♦ Client Management Skills
♦ Global Coverage
♦ Specialized Resources
♦ While there is an emphasis on execution of transactions in the product groups and an emphasis on marketing and client management in the sector groups, there is a high degree of overlap
– At the end of the day, all investment bankers work for the client
– Specialization maximizes efficiency and service for clients

[Jacqueline M. Dinella] [printed: October 30, 2008 9:22 PM] [saved: October 27, 2008 2:59 PM] S:\Global Sourcing\Fall2008-Spring2009\MBA\IBD\Recruiting Guide\UBS MBA Recruiting GuideFINAL 10_27_08.doc
21
The Associate/Associate Director Role
Responsibilities Qualities
♦ Technical Analysis
♦ Team Management
♦ Logistics/Processing
♦ Whatever it takes
♦ Leadership
♦ Teamwork
♦ Communication
♦ Dedication
♦ Professionalism
♦ Little things can mean a lot and poor execution can mask good skills
– attention to detail
– formatting
– professionalism
– timeliness
♦ Communication is the key to good teamwork and efficiency
– ask questions if you don’t know
– understand what expectations are (timing/deliverable)
– let people know your limitations
♦ Treat your Associate/AD years as an investment (more experiences = more personal capital)
– seek out work
– try to vary the people and types of projects you work with or on
– get included in as many client calls or meetings as possible

[Jacqueline M. Dinella] [printed: October 30, 2008 9:22 PM] [saved: October 27, 2008 2:59 PM] S:\Global Sourcing\Fall2008-Spring2009\MBA\IBD\Recruiting Guide\UBS MBA Recruiting GuideFINAL 10_27_08.doc
22
The Associate/Associate Director in a Team The Associate is an integral part of the deal team
♦ You are an integral member of the team
– team is organized by skills, responsibilities and experience
– you need to work closely with the Analyst and the person above you
– you will be in a position where you represent the bank
– you have support, use it wisely to maximize your own leverage
♦ You will have to develop a management style
– support staff can help you a lot or a little, so treat them with respect
– you will need to train Analysts, summer interns and new Associates
– you will need to build relationships and understand motivations
– you need to take advantage of the bigger “Team”
♦ Working with Junior Resources
– learn to do what you ask them to do
– take time to teach them
♦ Understand who the contact people are in different areas of the bank
– use contacts in different groups amongst your class
– you will be the decision maker in certain circumstances
– help each other as a team of Associates/ADs in your group (“Fresh Eyes”)
[Jacqueline M. Dinella] [printed: October 30, 2008 9:22 PM] [saved: October 27, 2008 2:59 PM] S:\Global Sourcing\Fall2008-Spring2009\MBA\IBD\Recruiting Guide\UBS MBA Recruiting GuideFINAL 10_27_08.doc
23
Being an Associate—A Few Tips
♦ What makes a good Associate?
– professionalism (interaction with clients and co-workers)
– timeliness (know deadlines and meet them, time management, parallel processing)
– technical skills (accounting, finance and spreadsheet skills)
– accuracy (every possible research source examined, no typos, careful numbers work)
– learning to eyeball the output every time you print it out, and to spot unreasonable numbers at a glance
– judgment (what makes sense for the client and for the firm)
– good attitude and a strong work ethic
– think like a project manager (anticipate work that needs to be accomplished and be proactive)
♦ Questions:
– do not be afraid to ask well thought-out questions
– for general questions ask peers; for specific project oriented questions, ask the immediate supervisors and your team
– if no one is around to ask, use your best judgment and footnote your assumption

[Jacqueline M. Dinella] [printed: October 30, 2008 9:22 PM] [saved: October 27, 2008 2:59 PM] S:\Global Sourcing\Fall2008-Spring2009\MBA\IBD\Recruiting Guide\UBS MBA Recruiting GuideFINAL 10_27_08.doc
24
SECTION 4
Interview Preparation

[Jacqueline M. Dinella] [printed: October 30, 2008 9:22 PM] [saved: October 27, 2008 2:59 PM] S:\Global Sourcing\Fall2008-Spring2009\MBA\IBD\Recruiting Guide\UBS MBA Recruiting GuideFINAL 10_27_08.doc
25
Developing Your Story: Key Pieces of Advice
Pick relevant time frames
Have different length versions of your story, but be sure to include the most important points or themes in each version
Your story should flow with your resume, but you should not be re-hashing your resume
Don't read off of your resume or pause to refer to it when interviewing
Keep your story consistent
Your story should always answer "why banking?"
If you mention it or list it on your resume, it’s fair game
Practice, practice, practice!

[Jacqueline M. Dinella] [printed: October 30, 2008 9:22 PM] [saved: October 27, 2008 2:59 PM] S:\Global Sourcing\Fall2008-Spring2009\MBA\IBD\Recruiting Guide\UBS MBA Recruiting GuideFINAL 10_27_08.doc
26
Developing Your Story: Key Pieces of Advice Some key questions that you may encounter, which translate into ……… “tell me your story”:
So, tell me about yourself…
I haven't had time to read your resume, fill me in…
Tell me why banking?
Walk me through your resume…
What did you do before business school?
What do you want me to know about you and your background?
You are a career-switcher. What makes you want to do banking?
You have never done banking before. Why now?
You have done XYZ before, what makes you think you can do banking?

[Jacqueline M. Dinella] [printed: October 30, 2008 9:22 PM] [saved: October 27, 2008 2:59 PM] S:\Global Sourcing\Fall2008-Spring2009\MBA\IBD\Recruiting Guide\UBS MBA Recruiting GuideFINAL 10_27_08.doc
27
Interview Questions—Big Picture Must-Practice Items
Why do you want to do investment banking? – challenge, visibility, opportunity to work with the best
What skills does Investment Banking require? What in your background shows you can do it? – intelligence, initiative, communication skills, attention to detail, teamwork
What do investment banks do? – investment banks act as financial advisors on a range of issues including M&A, restructuring and
capital raising activities. Once a course of action is decided the bank then executes the strategy by underwriting securities, etc
In which industry/product do you wish to focus?

[Jacqueline M. Dinella] [printed: October 30, 2008 9:22 PM] [saved: October 27, 2008 2:59 PM] S:\Global Sourcing\Fall2008-Spring2009\MBA\IBD\Recruiting Guide\UBS MBA Recruiting GuideFINAL 10_27_08.doc
28
Interview Questions—General Theory
What is working capital?
Define Beta; what are the limitations of Beta?
Show how to lever and unlever Beta
What is CAPM; what are the assumptions of CAPM?
Define reward to risk ratio
Write formula for WACC
Define Sharpe ratio
Draw the yield curve
Define duration
Show how convexity impacts a bond’s price to yield relationship
Explain the theory behind Black-Scholes
Discuss different accounting treatments for different securities (e.g. available-for-sale)
What is a carve-out, spin-off and split-off?
What is accretion and dilution? — Give an example
Go over a cash flow statement
What are some liquidity/leverage ratios?
How do you go from NI to cash flow? FCF and FCFE?
How do you value a company?
If you know a company’s P/E, what is its ROE?
Where do deferred tax liabilities come from? — Give an example

[Jacqueline M. Dinella] [printed: October 30, 2008 9:22 PM] [saved: October 27, 2008 2:59 PM] S:\Global Sourcing\Fall2008-Spring2009\MBA\IBD\Recruiting Guide\UBS MBA Recruiting GuideFINAL 10_27_08.doc
29
Sample Interview Questions—Investment Banking Fit What three adjectives would your peers, superiors and subordinates use to describe you?
What is the greatest risk we face in hiring you?
What are your greatest team and personal achievements?
Describe your leadership style
Describe a team situation you were in where things did not work out
Why did you choose your MBA program?
What other business schools did you apply to and why?
Do your grades reflect your abilities?
Why do you want to be an investment banker?
Why do you want to work for UBS?
What differentiates you from all the other highly qualified candidates we are looking at today?
What other types of jobs are you interviewing for and why?
What other investment banks are you interviewing with? If you got offers from all of them, where would you go?
Walk me through your resume explaining why you made the choices you did in the past
Tell us about three of your strengths and three of your weaknesses
What electives have you taken outside of finance and accounting?
What is your favorite class and why?
Are you well-rounded?
How do you know you will be able to handle the hours required of an investment banker?
Describe what you learned in class this morning
Do you consider yourself a risk-taker?
How well do you work under pressure?

[Jacqueline M. Dinella] [printed: October 30, 2008 9:22 PM] [saved: October 27, 2008 2:59 PM] S:\Global Sourcing\Fall2008-Spring2009\MBA\IBD\Recruiting Guide\UBS MBA Recruiting GuideFINAL 10_27_08.doc
30
Sample Interview Questions—Other General Questions
What type of a company would be a good candidate for an LBO?
Name two common ways companies can manage their earnings?
How does Net Income flow into the Balance Sheet, Income Statement and Statement of Cash Flows?
Describe how to value a privately held company
Describe three valuation methods – Discounted Cash Flow – Comparable Company or Multiple Valuation – Comparable Transaction Valuation
What is a stock that you follow?
What is the difference between commercial and investment banking?
Do you think the market is efficient?
How would you describe the cost of capital to a non-finance person?
What is CAPM?
Define Beta for a layman
What kind of financial modeling have you done in the past?
Suppose your client had significant excess cash on the balance sheet. How would you recommend its use?
Have you ever worked with a difficult team?
If I had $1 million today, how should I invest?
What question would you like to ask our CEO?

[Jacqueline M. Dinella] [printed: October 30, 2008 9:22 PM] [saved: October 27, 2008 2:59 PM] S:\Global Sourcing\Fall2008-Spring2009\MBA\IBD\Recruiting Guide\UBS MBA Recruiting GuideFINAL 10_27_08.doc
31
Sample Interview Questions—Other General Questions
Where did the Dow, S&P and NASDAQ close yesterday?
What is the Fed Funds rate?
What is the discount rate?
How often does the Fed meet?
What is the 10-year Treasury bond yield?
What does the yield curve look like?
What is the $/Yen exchange rate?
Where do you see the markets in a year?
What did the markets do last week and why?
What have the markets been doing this week and why?
What are three major news items related to the industry in which you are interested? What is the most interesting article you read in the WSJ of late?
What was in the Journal today?
What business publications do you read? What interesting articles have you recently read in those publications?
What activities have you participated in college and business school?
What multiples are used in the industry in which you are interested?
Tell me about a recent IPO you followed
Describe a recent M&A transaction you read about—what were the reasons they merged?

[Jacqueline M. Dinella] [printed: October 30, 2008 9:22 PM] [saved: October 27, 2008 2:59 PM] S:\Global Sourcing\Fall2008-Spring2009\MBA\IBD\Recruiting Guide\UBS MBA Recruiting GuideFINAL 10_27_08.doc
32
Interview Strategy
Things to mention during the interview:
Mention the names of other bankers with whom you have met and done informationals
Names of all other banks with which you are in final rounds or have gotten offers
Tell your story of why you want to do investment banking
Drop names of prominent deals the bank has done
Show that you have done your homework and know the bank’s strengths
Skills/Qualities to demonstrate you have:
Academic excellence
Relevant business experience
Demonstrated leadership experience
Demonstrated work ethic
Interviewing skills
Computer competency
Analytical skills
Problem solving/modeling
Perceived client relationship skills
Know why you want to be a banker (story)
Know why you want to be at that bank
[Jacqueline M. Dinella] [printed: October 30, 2008 9:22 PM] [saved: October 27, 2008 2:59 PM] S:\Global Sourcing\Fall2008-Spring2009\MBA\IBD\Recruiting Guide\UBS MBA Recruiting GuideFINAL 10_27_08.doc
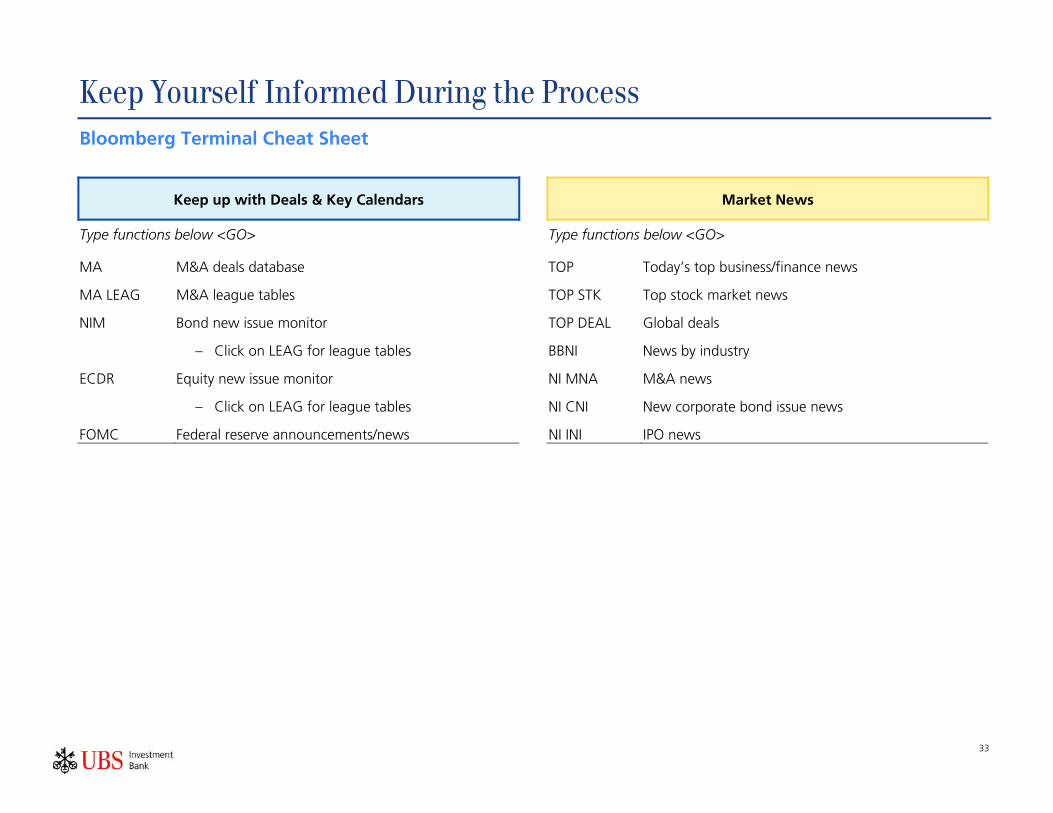
33
Keep Yourself Informed During the Process Bloomberg Terminal Cheat Sheet
Keep up with Deals & Key Calendars Market News
Type functions below <GO> Type functions below <GO>
MA M&A deals database TOP Today’s top business/finance news
MA LEAG M&A league tables TOP STK Top stock market news
NIM Bond new issue monitor TOP DEAL Global deals
– Click on LEAG for league tables BBNI News by industry
ECDR Equity new issue monitor NI MNA M&A news
– Click on LEAG for league tables NI CNI New corporate bond issue news
FOMC Federal reserve announcements/news NI INI IPO news

[Jacqueline M. Dinella] [printed: October 30, 2008 9:22 PM] [saved: October 27, 2008 2:59 PM] S:\Global Sourcing\Fall2008-Spring2009\MBA\IBD\Recruiting Guide\UBS MBA Recruiting GuideFINAL 10_27_08.doc
34
Keep Yourself Informed During the Process
Company Analysis Others (Take a Break!)
Type <Ticker><Equity><Go> and run functions below Type functions below <GO>
DES Company description
DINE Restaurant information
CN Headlines BSP Main sports news
CACS Corporate action calendar POSH Classifieds
HP Daily stock prices BSPE Baseball News
GP Price Graph
MGMT Management and board

[Jacqueline M. Dinella] [printed: October 30, 2008 9:22 PM] [saved: October 27, 2008 2:59 PM] S:\Global Sourcing\Fall2008-Spring2009\MBA\IBD\Recruiting Guide\UBS MBA Recruiting GuideFINAL 10_27_08.doc
35
SECTION 5
UBS Technical Reference Guide

[Jacqueline M. Dinella] [printed: October 30, 2008 9:22 PM] [saved: October 27, 2008 2:59 PM] S:\Global Sourcing\Fall2008-Spring2009\MBA\IBD\Recruiting Guide\UBS MBA Recruiting GuideFINAL 10_27_08.doc
36
Necessary Tools—Information is Everything Most things have been done—ask other bankers before recreating the wheel
Public Filings (US) Additional Company Information and Estimates On-Line Databases Other Databases Others
Annual Report Investext/Multext (research reports) ILX Dun & Bradstreet New Articles—Library (Lexis/Nexis)
10-K (20-F—foreign filers) S&P Tear Sheet FactSet One Source The Wall Street Journal, The New York Times, The Financial Times, Business Week, Forbes, etc.
10-Q (6-K—foreign filers) Value Line Bloomberg OneSource Private Management Files
Proxy I/B/E/S Datastream Spectrum Colleagues
13-D/14D-1 First Call SDC Technimetrics
Registration Statement/Prospectus (S-1, F-1)
Zack’s Spectrum Securities Data
8-K Nelson’s Equidesk
Moody’s Company Reports Bondesk
UBS research Amadata
Bondware
M&A Desk
Reuters
[Jacqueline M. Dinella] [printed: October 30, 2008 9:22 PM] [saved: October 27, 2008 2:59 PM] S:\Global Sourcing\Fall2008-Spring2009\MBA\IBD\Recruiting Guide\UBS MBA Recruiting GuideFINAL 10_27_08.doc
37
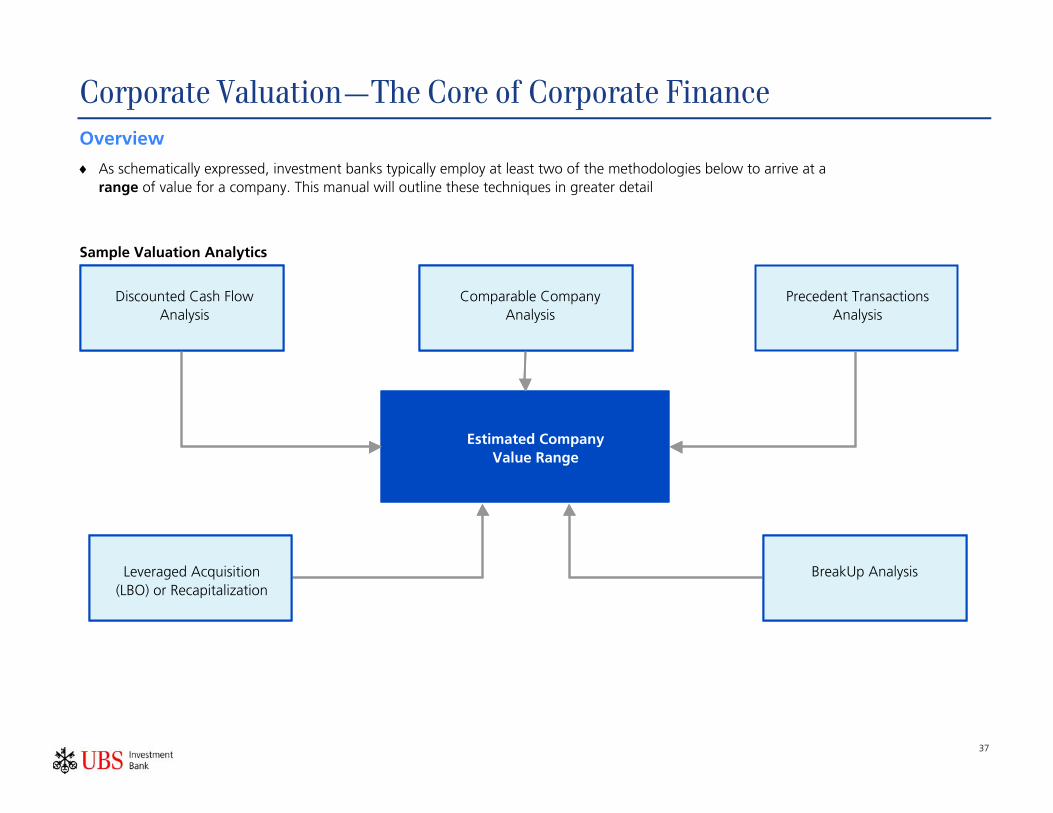
Corporate Valuation—The Core of Corporate Finance Overview
♦ As schematically expressed, investment banks typically employ at least two of the methodologies below to arrive at a range of value for a company. This manual will outline these techniques in greater detail
Sample Valuation Analytics
Discounted Cash Flow Analysis
Comparable Company Analysis
Estimated Company Value Range
- Up Analysis Leveraged Acquisition Analysis
Leveraged Acquisition (LBO) or Recapitalization
Discounted Cash Flow Analysis
Comparable Company Analysis
Precedent Transactions Analysis
Estimated Company Value Range
BreakUp Analysis
[Jacqueline M. Dinella] [printed: October 30, 2008 9:22 PM] [saved: October 27, 2008 2:59 PM] S:\Global Sourcing\Fall2008-Spring2009\MBA\IBD\Recruiting Guide\UBS MBA Recruiting GuideFINAL 10_27_08.doc
38
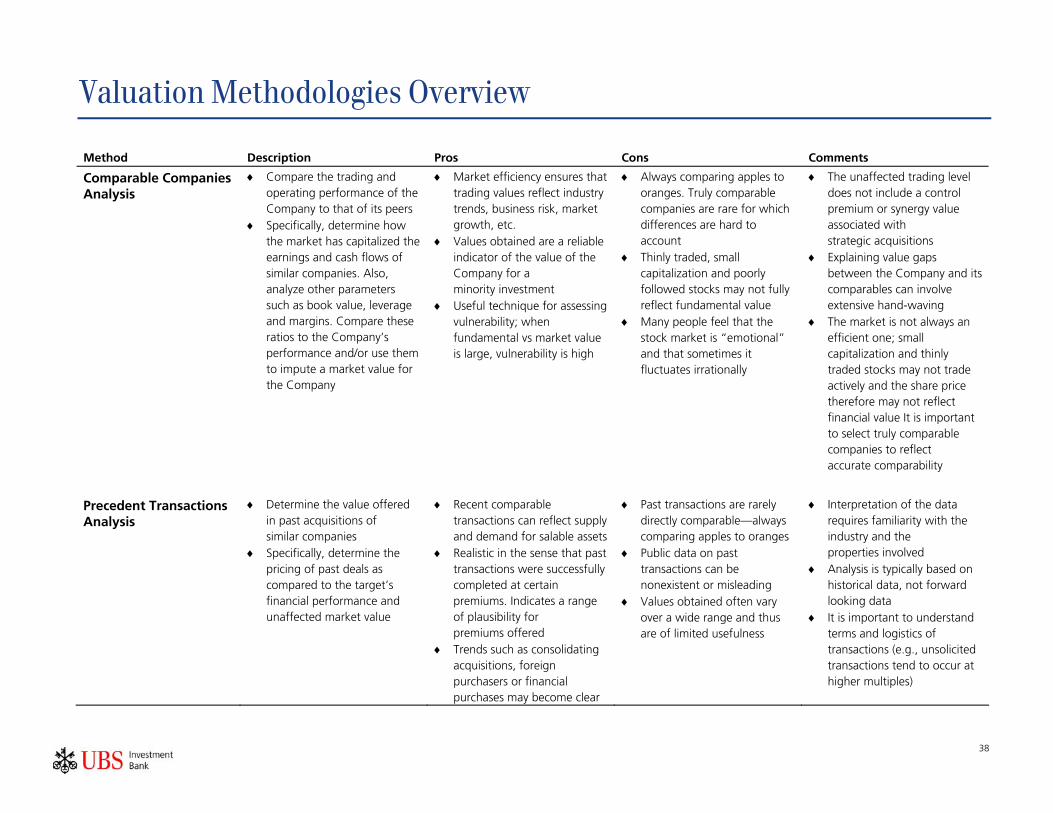
Valuation Methodologies Overview Method Description Pros Cons Comments
Comparable Companies Analysis
♦ Compare the trading and operating performance of the Company to that of its peers
♦ Specifically, determine how the market has capitalized the earnings and cash flows of similar companies. Also, analyze other parameters such as book value, leverage and margins. Compare these ratios to the Company’s performance and/or use them to impute a market value for the Company
♦ Market efficiency ensures that trading values reflect industry trends, business risk, market growth, etc.
♦ Values obtained are a reliable indicator of the value of the Company for a minority investment
♦ Useful technique for assessing vulnerability; when fundamental vs market value is large, vulnerability is high
♦ Always comparing apples to oranges. Truly comparable companies are rare for which differences are hard to account
♦ Thinly traded, small capitalization and poorly followed stocks may not fully reflect fundamental value
♦ Many people feel that the stock market is “emotional” and that sometimes it fluctuates irrationally
♦ The unaffected trading level does not include a control premium or synergy value associated with strategic acquisitions
♦ Explaining value gaps between the Company and its comparables can involve extensive hand-waving
♦ The market is not always an efficient one; small capitalization and thinly traded stocks may not trade actively and the share price therefore may not reflect financial value It is important to select truly comparable companies to reflect accurate comparability
Precedent Transactions Analysis
♦ Determine the value offered in past acquisitions of similar companies
♦ Specifically, determine the pricing of past deals as compared to the target’s financial performance and unaffected market value
♦ Recent comparable transactions can reflect supply and demand for salable assets
♦ Realistic in the sense that past transactions were successfully completed at certain premiums. Indicates a range of plausibility for premiums offered
♦ Trends such as consolidating acquisitions, foreign purchasers or financial purchases may become clear
♦ Past transactions are rarely directly comparable—always comparing apples to oranges
♦ Public data on past transactions can be nonexistent or misleading
♦ Values obtained often vary over a wide range and thus are of limited usefulness
♦ Interpretation of the data requires familiarity with the industry and the properties involved
♦ Analysis is typically based on historical data, not forward looking data
♦ It is important to understand terms and logistics of transactions (e.g., unsolicited transactions tend to occur at higher multiples)

[Jacqueline M. Dinella] [printed: October 30, 2008 9:22 PM] [saved: October 27, 2008 2:59 PM] S:\Global Sourcing\Fall2008-Spring2009\MBA\IBD\Recruiting Guide\UBS MBA Recruiting GuideFINAL 10_27_08.doc
39
Valuation Methodologies Overview Method Description Pros Cons Comments
Discounted Cash Flow Analysis
♦ Discount unleveraged, after-
tax projected free cash flow
at Company’s weighted
average cost of capital to
obtain an economic present
value of assets. Subtract
outstanding debt from the
present value of assets to get
present value of equity
♦ Several discount rates and
operating scenarios are used
to estimate the uncertainty of
the values obtained
♦ Theoretically the most sound
method if one is very
confident in the projections
and assumptions
♦ Not influenced by
temperamental market
conditions or
non-economic factors
♦ Present values obtained are
sensitive to assumptions
and methodology
♦ Values obtained can vary over
a wide range and thus be of
limited usefulness
♦ Involves forecasting future
performance, which is
inherently subjective
♦ DCF value should be adjusted
for non-operating items such
as environmental liabilities
and the value of excess assets
♦ Need realistic five- to ten-year
projected financial statements
♦ Sales growth rate, margins,
terminal multiples and discount
rates are key to value
Leveraged Acquisition (LBO) or Recapitalization Analysis
♦ Model the Company’s
financial performance under
an initially highly leveraged
capital structure
♦ Assume transaction occurs in
today’s borrowing
environment and determine
maximum initial debt the
Company can realistically repay
in a timely manner
♦ Several operating and
business environment
scenarios are used to estimate
the uncertainty in
values obtained
♦ Will help determine realizable
financial bidder value that any
strategic bidder will have
to exceed
♦ LBO value is realistic, in the
sense that it can be achieved
by a well-defined process
♦ Standalone LBO will
underestimate strategic sale
value by ignoring synergies
with acquirer. Financial buyers
tend to pay lower multiples as
they are in for the shorter
term than are strategic buyers.
However, markets change and
financial buyers can be
competitive with strategic
buyers
♦ Value obtained is sensitive to
projections and aggressiveness
of operating assumptions (but
less so than DCF methodology)
♦ LBO value only meaningful for
companies which could
operate under high
financial leverage
♦ Need realistic ten-year
projected financial statements
♦ Equity can be closely held
(private LBO) or publicly
traded (recap/public LBO)
♦ Sales growth rate, margins,
exit multiples and discount
rates are key to value

[Jacqueline M. Dinella] [printed: October 30, 2008 9:22 PM] [saved: October 27, 2008 2:59 PM] S:\Global Sourcing\Fall2008-Spring2009\MBA\IBD\Recruiting Guide\UBS MBA Recruiting GuideFINAL 10_27_08.doc
40
Valuation Methodologies Overview Method Description Pros Cons Comments
Break-Up Analysis ♦ Valuation of the Company is
based on valuation of
individual segments using
multiples from comparable
companies and precedent
transactions analysis and DCF
and LBO analyses
♦ After valuing the individual
segments, one must add and
subtract non-operating values
and liabilities such as cash,
debt, environmental liabilities,
pension surplus/(deficit), etc.
to arrive at an
Enterprise Value
♦ This methodology provides a
perspective on what the
multi-segment Company
could be worth if the market
value of the stock accurately
reflected the break-up value
♦ Useful technique for targeting
undervalued companies that
may receive a “conglomerate
discount”
♦ Slight variations in multiples
can vary the break-up value
making an undervalued
property fully-valued or
overvalued or vice versa
♦ Application of multiples
requires familiarity with
industry and
businesses involved

[Jacqueline M. Dinella] [printed: October 30, 2008 9:22 PM] [saved: October 27, 2008 2:59 PM] S:\Global Sourcing\Fall2008-Spring2009\MBA\IBD\Recruiting Guide\UBS MBA Recruiting GuideFINAL 10_27_08.doc
41
Enterprise Value vs Equity Value
Definitions
Equity Value
♦ On a trading basis, Equity Value or Market Value is defined as:
– Latest Shares Outstanding x Current Market Price
♦ The latest shares outstanding should be taken from the cover page of the latest Form 10-K or Form 10-Q (20-F, 6-K, Annual Report or Interim Statement for non-US companies), whichever is more recent DO NOT USE SHARES OUTSTANDING FROM BLOOMBERG. THESE FIGURES ARE OFTEN WRONG
– be sure to check whether there has been any kind of stock split or other change in the number of shares (e.g., secondary offering, stock dividend, acquisition for stock, etc.) since the latest filing
♦ On a transaction basis, Equity Value is defined as:
– Latest Shares Outstanding x Offer Price
+ Shares for Options1, Warrants1, SARs2, etc. x (Offer Price Average Exercise Price)
+ Shares for Convertible Debt x Offer Price3
+ Shares for Convertible Preferred Stock x Offer Price3
= Equity Value
Enterprise Value4
In addition to Equity Value, Enterprise Value includes all other sources of capital utilized by the company. Enterprise Value is used in ratios that measure the return to all sources of capital (e.g., Enterprise Value/EBITDA, Enterprise Value/EBIT, etc.)
1 Only if offer price exceeds average exercise price 2 SAR = Stock Appreciation Rights 3 Only if offer price exceeds conversion price 4 Also referred to as Firm Value, Adjusted Market Capitalization and Aggregate Value

[Jacqueline M. Dinella] [printed: October 30, 2008 9:22 PM] [saved: October 27, 2008 2:59 PM] S:\Global Sourcing\Fall2008-Spring2009\MBA\IBD\Recruiting Guide\UBS MBA Recruiting GuideFINAL 10_27_08.doc
42
Enterprise Value vs Equity Value Enterprise Value is defined as: Equity Value
+ Short-Term Debt and Long-Term Debt + Capital Lease Obligations + Preferred Stock at Liquidation Value5 + Out-of-the-Money Convertible Debt + Out-of-the-Money Convertible Preferred Stock + Minority Interest (at market value, if publicly traded) – Cash and Cash Equivalents6 = Enterprise Value
Net Income to Common
♦ Net Income to Common represents the earnings available to common shareholders after interest expense, taxes and preferred dividends. Net Income should always be taken before extraordinary items and adjusted for non-recurring items on an after-tax basis (See discussion on page 13)
EBIT
♦ EBIT (“Earnings Before Interest {interest expense less interest income} and Taxes”) represents the earnings stream (operating income) available to all investors, including debt holders and preferred shareholders. In a typical income statement, it is defined as:
Gross profit – SG&A – Depreciation and Amortization7 – Any other recurring operating expenses/(income)8 = EBIT
5 All preferred stock which is not included in Equity Value 6 Used as a proxy for excess cash, which is cash over and above that needed to run the business on a daily basis 7 Often included in part or in whole in the Cost of Goods Sold. When calculating EBIT using this method, use Depreciation and Amortization from the Income
Statement (if available) since a portion of the Depreciation & Amortization may already be included in COGS. Do not use Depreciation & Amortization from the Statement of Cash Flows. However, when calculating EBITDA (see next page), you should use Depreciation & Amortization from the Cash Flow Statement and add it back to EBIT
8 Note that other income/expense below the operating income line should be included assuming that it is both recurring and non-financial. Check the notes to the financial statements!
[Jacqueline M. Dinella] [printed: October 30, 2008 9:22 PM] [saved: October 27, 2008 2:59 PM] S:\Global Sourcing\Fall2008-Spring2009\MBA\IBD\Recruiting Guide\UBS MBA Recruiting GuideFINAL 10_27_08.doc
43
Enterprise Value vs Equity Value
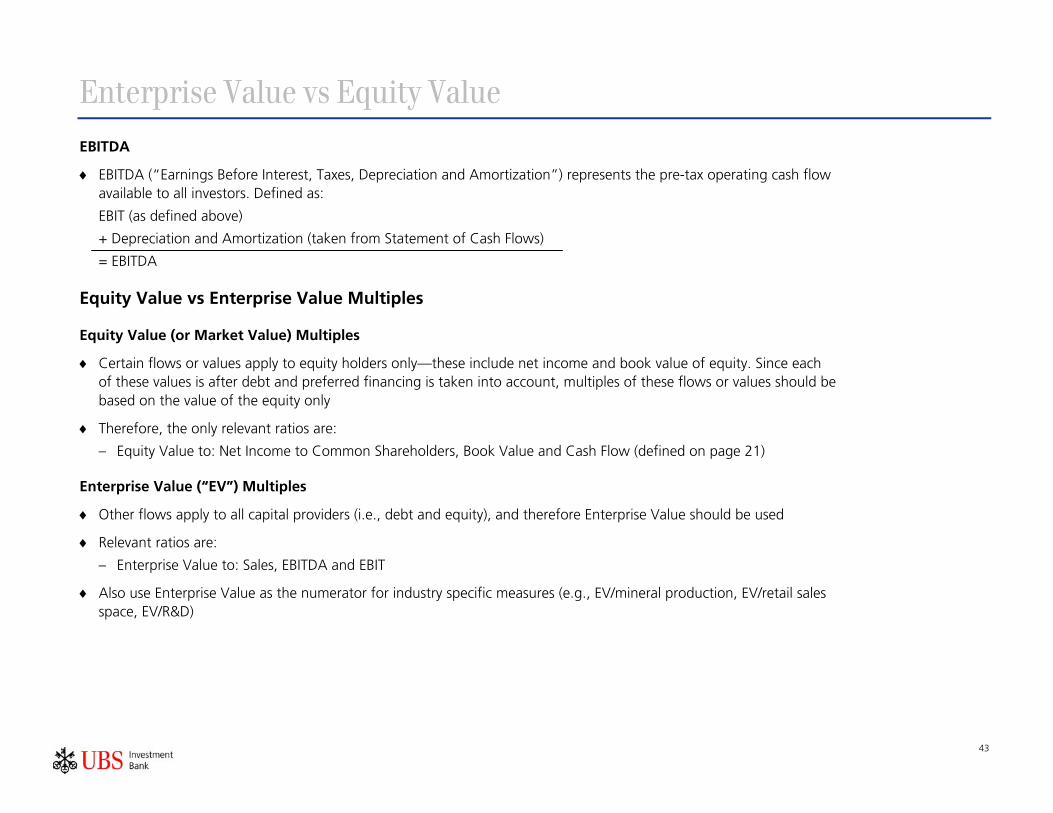
EBITDA
♦ EBITDA (“Earnings Before Interest, Taxes, Depreciation and Amortization”) represents the pre-tax operating cash flow available to all investors. Defined as:
EBIT (as defined above)
+ Depreciation and Amortization (taken from Statement of Cash Flows)
= EBITDA
Equity Value vs Enterprise Value Multiples
Equity Value (or Market Value) Multiples
♦ Certain flows or values apply to equity holders only—these include net income and book value of equity. Since each of these values is after debt and preferred financing is taken into account, multiples of these flows or values should be based on the value of the equity only
♦ Therefore, the only relevant ratios are:
– Equity Value to: Net Income to Common Shareholders, Book Value and Cash Flow (defined on page 21)
Enterprise Value (“EV”) Multiples
♦ Other flows apply to all capital providers (i.e., debt and equity), and therefore Enterprise Value should be used
♦ Relevant ratios are:
– Enterprise Value to: Sales, EBITDA and EBIT
♦ Also use Enterprise Value as the numerator for industry specific measures (e.g., EV/mineral production, EV/retail sales space, EV/R&D)

[Jacqueline M. Dinella] [printed: October 30, 2008 9:22 PM] [saved: October 27, 2008 2:59 PM] S:\Global Sourcing\Fall2008-Spring2009\MBA\IBD\Recruiting Guide\UBS MBA Recruiting GuideFINAL 10_27_08.doc
44
Treatment of Unusual and Non-Recurring Items Top-Down Comparative Example Definition
Bottom-Up Comparative Example
Notes: 1 $600 * (1-tax rate) = $600 *(0.6) = $360
2 Net Income to Common Shareholders (after Preferred Dividends, which, unlike interest expense, are not tax-deductible like interest expense)
(US$mm) Reported Adjusted
Revenues 1,000 1,000 COGS (500) (500) SG&A (300) (300) + Gain on Sale of Equipment 600 0 EBITDA 800 200 % Margin 80 2 – Depreciation & Amortization (100) (100) EBIT 700 100 % Margin 70 10 Interest Expense (50) (50) 650 50 Taxes @ 40% (260) (20) Net Income 390 30 Preferred Dividends (5) (5)
Net Income To Common Shareholders 385 25 Weighted Average Shares Outstanding (mm) 25 25 E.P.S. 15.40 1.00
(US$mm) EBITDA EBIT Net Income
Reported Results 800 700 390 Pre-Tax Gain on Sale (600) (600) – Post-Tax Gain on Sale (@ 40%) – – (360)1 200 100 30 Preferred Dividends (5) Net Income to Common Shareholders 252 Weighted Average Shares Outstanding (mm) 25 E.P.S. 1.00
♦ Unusual and non-recurring items often are included in a company’s EBITDA, EBIT
and net income and must be removed (adjusted for) in order to assess “normal”
operating performance. These items include gains on sale of assets, restructuring
charges, losses on plant closings, writedown of assets, legal settlements, etc.
Methodology ♦ These non-recurring items are sometimes detailed in the financial statements, but
can always be found in notes to the financial statements and in the “Management’s Discussion and Analysis” section. It is important that these sections of the annual report are carefully read in order to find these adjustments
♦ Often, these items are found in the notes to the financial statements, under “other income/expense” and are only shown on a pre-tax basis. If the after-tax basis is not shown, one must calculate the after-tax effect on net income assuming the marginal tax rate, which varies by country
♦ You should first check the tax footnote in the Annual Report or 10-K (20-F) for an effective tax rate, making sure to exclude non-recurring tax effects like very large NOLs. For US companies one can use 40%, which includes the federal tax rate of 35% and a state and local tax rate of about 5%. The marginal federal corporate tax rates at December 31, 2006 as defined in Ernst & Young’s “Worldwide Corporate Tax Guide and Directory” were:
♦ Note that marginal corporate tax rates should ideally include federal, state and local taxes, although multi-state and multi-national companies complicate this issue. Consult local offices for their input on what tax rate to use. Although the tax rates above are as of December 31, 2006, some have changed and you should double-check them
% % %
Brazil 33.0 Japan 37.5 Switzerland 20.0
Colombia 35.0 Mexico 34.0 UK 33.0
France 33.3 Netherlands 35.0 USA 35.0
Germany 45.0 South Africa 35.0
Hong Kong 16.5 Sweden 28.0

[Jacqueline M. Dinella] [printed: October 30, 2008 9:22 PM] [saved: October 27, 2008 2:59 PM] S:\Global Sourcing\Fall2008-Spring2009\MBA\IBD\Recruiting Guide\UBS MBA Recruiting GuideFINAL 10_27_08.doc
45
Stock Splits
Definition
♦ Corporations often declare stock splits in order to reduce the trading price of their stock and enhance liquidity. While most splits are 2-for-1 (i.e., a shareholder receives one additional share for each share he already holds), corporations also split their stock 3-for-1, 3-for-2, etc. In addition, a corporation may effect a reverse stock split in order to consolidate its shareholder base (i.e., a shareholder receives one share for every three shares he already holds). When a stock splits, the stock price will adjust to reflect a proportional decrease or increase in price depending upon the direction of the split (i.e., if a $60 stock splits 3-for-2, the post-split share price will be $40 per share or if a $40 stock reverse splits 1-for-2, the post-split share price will be $80 per share). It should be noted that the market value of all trading shares will remain the same. Furthermore, high growth, cash constrained companies will occasionally declare stock dividends, which also increase the number of shares outstanding. Be sure to note the effective date of these transactions, as the stock price will not be adjusted until that time
♦ It is imperative to watch carefully for stock splits. Since there is a time lag for when public documents are released, the stock price that appears on ILX or Bloomberg may reflect a split that occurred since the public documents were issued. This would result in incorrect calculations of EPS, Equity Value and Enterprise Value and hence improper valuation multiples
Methodology
♦ One should always check the company’s headlines and earnings announcements on ILX and Bloomberg for stock splits that have occurred since the date of the latest public document. You can also check for stock splits on Bloomberg by typing the company’s ticker symbol, pressing the <<Equity>> key, typing “DVD” and then pressing the green <<Go>> key. The row with white colored text will indicate the relevant dates relating to the stock splits

[Jacqueline M. Dinella] [printed: October 30, 2008 9:22 PM] [saved: October 27, 2008 2:59 PM] S:\Global Sourcing\Fall2008-Spring2009\MBA\IBD\Recruiting Guide\UBS MBA Recruiting GuideFINAL 10_27_08.doc
46
Calculating Last Twelve Months (“LTM” or “Trailing”/”TTM”)
Concept
♦ Markets are dynamic and absorb information instantaneously, and therefore income statement data must reflect the last twelve months (“LTM”) for which publicly reported information is available. Note that typically only US companies and foreign issuers with American Depository Receipts (“ADRs”) report quarterly
Calculation
♦ LTM relates to the Income Statement and Statement of Cash Flows which represent a “flow” over a period of time, as opposed to the Balance Sheet which represents a “stock” (or “snapshot”) at a point in time. Thus, LTM figures are calculated as: 12-month period + most recent period–corresponding prior year period. For example, to calculate the trailing twelve months’ sales for XYZ Corporation (with a 12/31/07 year end) for the period ending 6/30/08 take the 2007 annual sales, add the sales for the six months ended 6/30/08 and subtract the sales for the six months ended 6/30/07. Schematically
Last Fiscal Year (“LFY”) Q1 and Q2 2007 Q3 and Q4 2007
(Subtract) ↑
Last Quarters (“LQs”) Q1 and Q2 2008
(Add) ↑
Last Twelve Months Q3 and Q4 2007 Q1 and Q2 2008
♦ When calculating LTM E.P.S., use the above methodology only and do not divide LTM Net Income by a calculation of LTM weighted average shares outstanding

[Jacqueline M. Dinella] [printed: October 30, 2008 9:22 PM] [saved: October 27, 2008 2:59 PM] S:\Global Sourcing\Fall2008-Spring2009\MBA\IBD\Recruiting Guide\UBS MBA Recruiting GuideFINAL 10_27_08.doc
47
Compound Annual Growth Rate (“CAGR”)
Definition
♦ A value that simplifies the observed data into one number that will, it is hoped, describe it to others in an accurate and meaningful way
Methodology
♦ The formula used to estimate the constant annual percentage rate is:
– ((Xn/X1)(1/(n-1))-1) x 100%
– where: X1 ... Xn = observations for n values
♦ For example, if XYZ Corporation has produced earnings per share as follows
Year Period Actual E.P.S. (US$)
2003 1 2.00
2004 2 2.70
2005 3 3.13
2006 4 3.71
2007 5 4.88
♦ We can calculate the Company’s CAGR in % of growth/year as follows:
– (($4.88/$2.00)(1/4)-1) x 100% = 25%
♦ That is, each year we estimate, on average, that XYZ’s E.P.S. grows by 25% from that of the previous year
♦ When growth rates are used in exhibits and memos, they should be clearly identified as “n-year compound annual growth rates”

[Jacqueline M. Dinella] [printed: October 30, 2008 9:22 PM] [saved: October 27, 2008 2:59 PM] S:\Global Sourcing\Fall2008-Spring2009\MBA\IBD\Recruiting Guide\UBS MBA Recruiting GuideFINAL 10_27_08.doc
48
Comparable Companies
Definition
♦ The comparable companies analysis (“Comps”) typically consists of a comparison of several companies’ operating and trading statistics. The exact ratios and range analyzed will vary from project to project
♦ Comps are good for valuing companies in virtually any given industry. Almost all of our valuation presentations include comparables—usually one set for each sizable segment of the valuation target. Comps serve as the primary measure of value when analyzing a public offering
♦ Use of comps will give you a TRADING VALUE. You will need to add a “control premium” to obtain an ACQUISITION VALUE
Concept
♦ A comparable peer group should embody the same business and financial attributes such that their public trading values represent a reasonable proxy for those of the company under consideration
♦ Relevant attributes include:
– industry group
– business mix (products, markets served, distribution channels, etc.) and respective weight of each product
– geographic location
– operations (production processes, critical inputs/components)
– size (revenues, assets, market capitalization)
– financial parameters (leverage, historical and future growth rates, margins, dividend yield)

[Jacqueline M. Dinella] [printed: October 30, 2008 9:22 PM] [saved: October 27, 2008 2:59 PM] S:\Global Sourcing\Fall2008-Spring2009\MBA\IBD\Recruiting Guide\UBS MBA Recruiting GuideFINAL 10_27_08.doc
49
Comparable Companies Analysis
Methodology
♦ The first step in putting together a comparables exhibit is to identify companies that are considered comparable. An SIC code run from the library and on FactSet are the main sources for a search. Research reports, the proxy statement, the 10-K and Bloomberg may also list comparable companies. You want to identify “pure plays” or those companies that closely resemble the company (or segment of a company) that you are evaluating
♦ Once you have the output from the SIC code run and FactSet search, read Value Line, S&P Tear Sheet descriptions and/or Moody’s Company Reports to pinpoint those companies that are most similar. These publications also have industry groupings that may be helpful in identifying comparables. Finally, run your list of comparables by another member of your team or industry analyst for a final check
♦ The median values for the comparables chosen are always included in the exhibit. Mean values must be used carefully because skewed or outlying data can result in misleading values. Thus, outliners are often excluded from the mean calculation
♦ It is critical to be attentive to how particular industries trade. Some trade based on EBITDA multiples (i.e., most manufacturing companies), some trade on Price/Earnings or Price/Book multiples (i.e., financial institutions) and some trade on industry specific statistics (i.e., cellular companies trade on a “per pop” basis and paging companies trade on a “per subscriber” basis)
♦ Using the appropriate multiple for the industry and even the individual company to be valued will more accurately reflect the true value of the enterprise

[Jacqueline M. Dinella] [printed: October 30, 2008 9:22 PM] [saved: October 27, 2008 2:59 PM] S:\Global Sourcing\Fall2008-Spring2009\MBA\IBD\Recruiting Guide\UBS MBA Recruiting GuideFINAL 10_27_08.doc
50
Comparable Companies Analysis Also known as “trading comps” or “equity comps”
Assumptions and Footnotes
♦ Reported information is almost never complete enough to meet all inputs for your analysis
♦ Read the Notes to the Financial Statements; answers are often found there
♦ Check with bankers on your deal team or in your industry group; methodologies may differ
♦ Do not be afraid to make assumptions for which there are reasonable foundations
♦ Footnote all company-specific assumptions accordingly:
– sources of assumptions and estimates
– methodologies used for calculations
– adjustments for non-recurring items and marginal tax rate, if appropriate
♦ Footnote all global definitions where applicable, including:
– inclusion of minority interests in net debt
– treatment of preferred stock
♦ Mark your source material with a highlighter and post its so that inputs are easily located and checked LEAVE AN AUDIT TRAIL AND MAKE NOTES OF ALL SOURCES, ASSUMPTIONS AND CALCULATIONS
UBS has constructed a custom-designed Excel model that downloads trading and operating data from FactSet. This model should NEVER be shown to clients or more senior bankers unless it is hand-checked and/or explicitly requested. Moreover, it should be used to “sanity check” your work or provide “quick and dirty” analysis

[Jacqueline M. Dinella] [printed: October 30, 2008 9:22 PM] [saved: October 27, 2008 2:59 PM] S:\Global Sourcing\Fall2008-Spring2009\MBA\IBD\Recruiting Guide\UBS MBA Recruiting GuideFINAL 10_27_08.doc
51
Basics of Trading Comps Inputs to the Comparables Outputs to the Comparables
Item Source
Latest Indicated Annual Dividend
On Bloomberg under Current News; look for the latest dividend declaration headline. Look at the article to get the most recent dividend and annualize it (e.g., multiply by 4 for quarterly dividends). Alternatively, go to the same screen as the stock split screen; see page 14 under “Methodology”
Common Shares Outstanding
On the front page of the 10-Q or 10-K near the bottom. Make adjustments for subsequent events, if any (e.g., share repurchase, stock split, etc.)
Long-Term (“LT”) Debt LT debt plus redeemable preferred stock plus capital lease obligations (if any). Other types of preferred stock are not considered LT debt
Short-Term (“ST”) Debt Under current liabilities, “short-term borrowings” or “bank notes”, plus “current maturities of LT debt”, “accrued interest” 1, if any
Minority Interest Minority interest at market value if publicly traded Preferred Stock Preferred Stock at liquidation value, not included in LT Debt. Book Value Common Shareholders’ Equity from the latest balance sheet. Net Interest Expense 2 Interest expense less interest income both from income statement D,D&A (D&A) Depreciation, Depletion and Amortization (Depreciation and
Amortization) is found on the Statement of Cash Flows (some 10-Qs may not disclose this)
EBIT Earnings before Net Interest Expense and Taxes EBITDA EBIT plus D,D&A. Net Income Net Income to Common Shareholders E.P.S. Primary before extraordinary items. Watch for stock splits: if Net
Income/Shares Outstanding differs from E.P.S. by more than 5%, try to find out why. Remember that some discrepancy is normal, because total shares outstanding does not usually equal weighted average shares outstanding
Cash Flow from Operations per Share Estimates
Cash Flow per Share is equal to Net Income + D,D&A + Deferred Taxes (from Statement of Cash Flows) + Other Non-Cash Charges divided by Shares Outstanding. Research reports or Value Line (in library
E.P.S. Estimates From First Call, I/B/E/S, FactSet, Bloomberg or research reports
Item Source
Equity Value Stock Price × Common Shares Outstanding
Enterprise Value Equity Value + LT Debt + ST Debt + Minority Interest + Preferred Stock (not included in LT Debt) – (Cash + Cash Equivalents)
Price/Earnings Price/E.P.S.
Price/Cash Flow Stock Price/Cash Flow per Share
Dividend Yield Dividends per Share/Stock Price Price/Book Equity Value/Book Value % Payout Dividends per Share/E.P.S. (last 12 months) Interest Coverage 2 EBIT/Interest Expense Enterprise Value/Sales) 3 Enterprise Value/Sales Enterprise Value/EBITDA 3 Enterprise Value/EBITDA Enterprise Value/EBIT 3 Enterprise Value/EBIT
Notes: 1 Accrued Interest is sometimes detailed on the balance sheet or in the Accrued Liabilities footnote 2 For an Interest Coverage ratio, i.e., EBITDA/Interest or EBIT/Interest, be sure to add Capitalized Interest to your Net Interest Expense and subtract it from EBITDA.
Capitalized Interest, if available, can be found in the Management’s Discussion and Analysis section or in the notes (P,P,&E) to the financial statements 3 The idea here is that since EBIT, EBITDA and Sales are not affected by the company’s choice of capital structure (as are cash flow, net earnings and book value),
the appropriate multiples use total capital (i.e., equity and debt), and not just equity capital
[Jacqueline M. Dinella] [printed: October 30, 2008 9:22 PM] [saved: October 27, 2008 2:59 PM] S:\Global Sourcing\Fall2008-Spring2009\MBA\IBD\Recruiting Guide\UBS MBA Recruiting GuideFINAL 10_27_08.doc
52
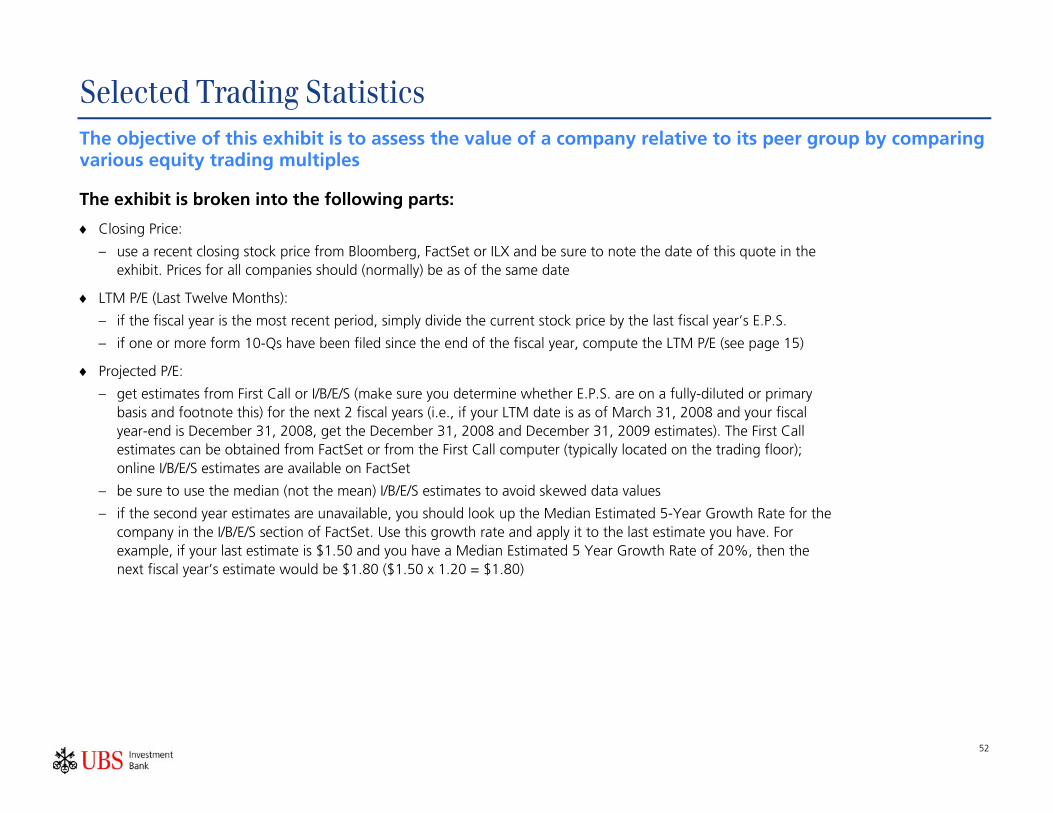
Selected Trading Statistics The objective of this exhibit is to assess the value of a company relative to its peer group by comparing various equity trading multiples
The exhibit is broken into the following parts:
♦ Closing Price:
– use a recent closing stock price from Bloomberg, FactSet or ILX and be sure to note the date of this quote in the exhibit. Prices for all companies should (normally) be as of the same date
♦ LTM P/E (Last Twelve Months):
– if the fiscal year is the most recent period, simply divide the current stock price by the last fiscal year’s E.P.S.
– if one or more form 10-Qs have been filed since the end of the fiscal year, compute the LTM P/E (see page 15)
♦ Projected P/E:
– get estimates from First Call or I/B/E/S (make sure you determine whether E.P.S. are on a fully-diluted or primary basis and footnote this) for the next 2 fiscal years (i.e., if your LTM date is as of March 31, 2008 and your fiscal year-end is December 31, 2008, get the December 31, 2008 and December 31, 2009 estimates). The First Call estimates can be obtained from FactSet or from the First Call computer (typically located on the trading floor); online I/B/E/S estimates are available on FactSet
– be sure to use the median (not the mean) I/B/E/S estimates to avoid skewed data values
– if the second year estimates are unavailable, you should look up the Median Estimated 5-Year Growth Rate for the company in the I/B/E/S section of FactSet. Use this growth rate and apply it to the last estimate you have. For example, if your last estimate is $1.50 and you have a Median Estimated 5 Year Growth Rate of 20%, then the next fiscal year’s estimate would be $1.80 ($1.50 x 1.20 = $1.80)
[Jacqueline M. Dinella] [printed: October 30, 2008 9:22 PM] [saved: October 27, 2008 2:59 PM] S:\Global Sourcing\Fall2008-Spring2009\MBA\IBD\Recruiting Guide\UBS MBA Recruiting GuideFINAL 10_27_08.doc
53
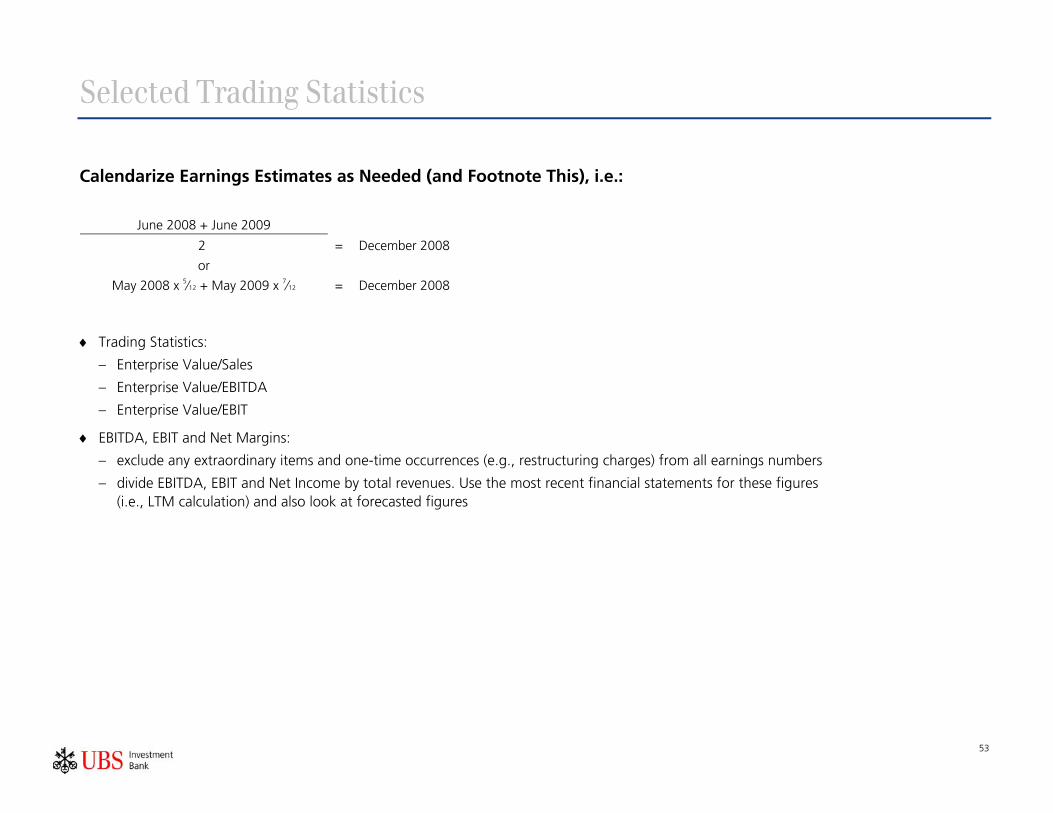
Selected Trading Statistics
Calendarize Earnings Estimates as Needed (and Footnote This), i.e.:
June 2008 + June 2009
2 = December 2008
or
May 2008 x 5⁄12 + May 2009 x 7⁄12 = December 2008
♦ Trading Statistics:
– Enterprise Value/Sales
– Enterprise Value/EBITDA
– Enterprise Value/EBIT
♦ EBITDA, EBIT and Net Margins:
– exclude any extraordinary items and one-time occurrences (e.g., restructuring charges) from all earnings numbers
– divide EBITDA, EBIT and Net Income by total revenues. Use the most recent financial statements for these figures (i.e., LTM calculation) and also look at forecasted figures

[Jacqueline M. Dinella] [printed: October 30, 2008 9:22 PM] [saved: October 27, 2008 2:59 PM] S:\Global Sourcing\Fall2008-Spring2009\MBA\IBD\Recruiting Guide\UBS MBA Recruiting GuideFINAL 10_27_08.doc
54
Selected Trading Statistics
♦ EBIT/Assets:
– use same EBIT value as above
– to calculate average assets, add beginning period assets to ending period assets (both from the periods for which the EBIT applies) and divide by 2 (watch out for equity issues and acquisitions). Use the asset value at the most recent balance sheet available
♦ Return on Equity:
– use net income
– divide by average Stockholders’ Equity. Sum beginning and ending period equity and divide by 2 to get average Stockholders’ Equity (watch out for equity issues and acquisitions). Use the Stockholders’ Equity value at the most recent balance sheet available
♦ Price/Book Value:
– book value of common equity per share (sum of equity accounts on most recent balance sheets) divided into the most recent stock price. Be sure to exclude Book Value of Preferred if it is reported with the Shareholders’ Equity
♦ Price/Cash Flow:
– Cash Flow refers to Operating Cash Flow, OR Net Income plus Depreciation, Depletion and Amortization plus Deferred Taxes and other Non-Cash Charges
– Cash Flow Projections can be taken from research reports whereas latest 12 months cash flow should be calculated from the latest financial statements
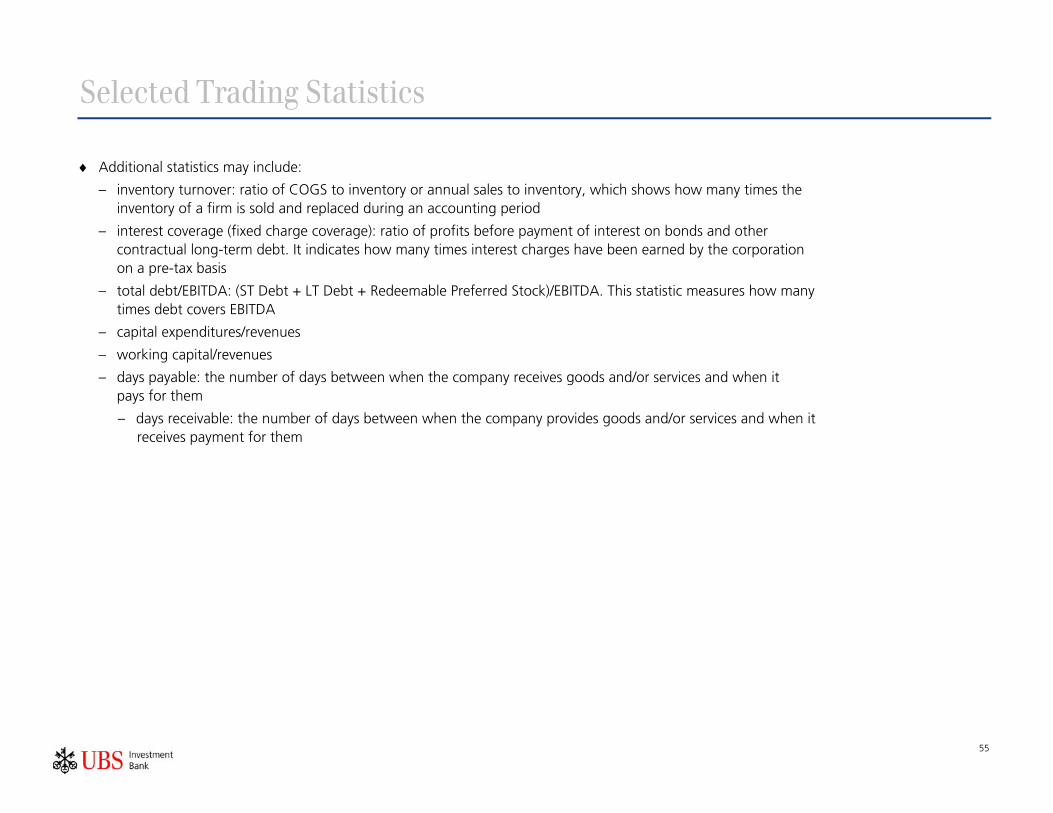
[Jacqueline M. Dinella] [printed: October 30, 2008 9:22 PM] [saved: October 27, 2008 2:59 PM] S:\Global Sourcing\Fall2008-Spring2009\MBA\IBD\Recruiting Guide\UBS MBA Recruiting GuideFINAL 10_27_08.doc
55
Selected Trading Statistics
♦ Additional statistics may include:
– inventory turnover: ratio of COGS to inventory or annual sales to inventory, which shows how many times the inventory of a firm is sold and replaced during an accounting period
– interest coverage (fixed charge coverage): ratio of profits before payment of interest on bonds and other contractual long-term debt. It indicates how many times interest charges have been earned by the corporation on a pre-tax basis
– total debt/EBITDA: (ST Debt + LT Debt + Redeemable Preferred Stock)/EBITDA. This statistic measures how many times debt covers EBITDA
– capital expenditures/revenues
– working capital/revenues
– days payable: the number of days between when the company receives goods and/or services and when it pays for them
– days receivable: the number of days between when the company provides goods and/or services and when it receives payment for them

[Jacqueline M. Dinella] [printed: October 30, 2008 9:22 PM] [saved: October 27, 2008 2:59 PM] S:\Global Sourcing\Fall2008-Spring2009\MBA\IBD\Recruiting Guide\UBS MBA Recruiting GuideFINAL 10_27_08.doc
56
Precedent Transactions Analysis
Definition
Today, XYZ announced the sale of its Danco subsidiary to LBO
Partners for $135 million, including the assumption of
debt and other liabilities.
Today, IBM announced the sale of its printed circuit board
operations for $80 million, plus $100 million of assumed debt.
Today, XYZ announced the sale of its Danco subsidiary to LBO
Partners for $135 million, including the assumption of
debt and other liabilities.
Today, IBM announced the sale of its printed circuit board
operations for $80 million, plus $100 million of assumed debt.
♦ The precedent transactions exhibit contains information about selected M&A transactions in the same industry as the company (or segment of a company) that you are evaluating, thereby allowing a value to be imputed to the company under consideration. The purpose is similar to that of the comparables trading statistics except that by looking at prior acquisitions, you can get a sense of the premium that is paid to gain control of the target company (i.e., control premium). This is another way to assess the value of the company from a potential buyer’s perspective
Methodology
♦ Unlike the DCF analysis, this technique does not focus on the operating assumptions of the current or prospective owner. Rather, such multiples represent an index of recent market prices paid by other acquirers and accepted by other sellers. From a potential seller’s viewpoint, the multiples suggest a target price range at which other buyers have been willing to buy. Conversely, for potential buyers, the multiples suggest price ranges that are acceptable to sellers
♦ However, because each acquisition is unique and buyers and sellers typically do not know all the factors and motives that went into the formulation of another acquisition price, acquisition multiples often suggest a wide range of values and must be used with care. Moreover, because the acquisition market is not continuous in time, the fact that a particular multiple was paid in the past does not necessarily mean that it still applies today. Unlike the stock market, there is no current P/E benchmark other than the most recent industry transaction which may be several months or even years old. Furthermore, many transactions occur at the subsidiary or division level for which no trading valuations exist
♦ Precedent transactions analysis is based on historical, not forward looking, data. In reality, transactions are valued using forward looking data which are not disclosed to the public at the time of the acquisition

[Jacqueline M. Dinella] [printed: October 30, 2008 9:22 PM] [saved: October 27, 2008 2:59 PM] S:\Global Sourcing\Fall2008-Spring2009\MBA\IBD\Recruiting Guide\UBS MBA Recruiting GuideFINAL 10_27_08.doc
57
Precedent Transactions Analysis
♦ Prices paid as a multiple of net earnings and/or operating profit (EBITDA and EBIT) are typically the most useful for a broad range of industrial companies. An important requirement for such multiples to be meaningful is that the accounting principles underlying earnings be comparable across the sample of transactions
♦ The output for precedent transaction analysis is largely similar to that of comparable companies with one difference:
– Equity Value—Equity value should be calculated based on the fully-diluted number of shares outstanding because convertible securities and options will typically come “in-the-money” in an M&A transaction. Note that management options, not to be confused with publicly-traded options, typically vest in change of control transactions
– Enterprise Value—Since a majority of M&A transactions are done at the division and subsidiary level, financial data is sometimes difficult to procure. If no debt is assumed, Equity Value and Enterprise Value will be equal
Warrants and Options
♦ Warrants, options and similar securities are considered common stock equivalents at all times unless conversion of these securities proves antidilutive (i.e., E.P.S. is actually increased after accounting for these securities. This occurs if the market price of the stock is lower than the exercise price of the option). As a result, both primary and fully-diluted E.P.S. should reflect the dilution that would result from exercise or conversion of these securities
♦ The amount of dilution reflected in E.P.S. data should be computed by application of the “treasury stock” method. Under this method, E.P.S. is calculated as if the warrants and options were exercised at the beginning of the reporting period (or, if later, at the time of issuance) and as if the funds obtained by the exercise were used to purchase common stock at a market price

[Jacqueline M. Dinella] [printed: October 30, 2008 9:22 PM] [saved: October 27, 2008 2:59 PM] S:\Global Sourcing\Fall2008-Spring2009\MBA\IBD\Recruiting Guide\UBS MBA Recruiting GuideFINAL 10_27_08.doc
58
Precedent Transactions Analysis Shares for E.P.S. purposes = Shares Outstanding + Incremental Shares
= Number of Options – Number of Options x Exercise Price Incremental Shares
Market Price of Stock
For primary shares outstanding, use the average market price during the period as the denominator.
To calculate fully-diluted shares outstanding, substitute the closing market price of the stock (for the period in question) for the market price if the closing price is higher.
If the closing market price is higher, the number of shares repurchased will be smaller and therefore more shares will be left outstanding. This results in a more diluted E.P.S.
As a practical matter, we typically use the current stock price for both calculations for the sake of simplicity, unless the stock price has changed dramatically over the period in question.
Treasury Stock Method Example
(US$)
Net Income 5,000,000
Shares Outstanding 2,000,000
Shares for Warrants and Options 200,000
Exercise Price per Share 20
Average Market Price per Share 25
Closing Market Price per Share 30
Primary E.P.S.
200,000 – 200,000 x $20 = 40,000 incremental shares
$25
$5,000,000 Primary E.P.S.
= 2,000,000 + 40,000
= $2.45

[Jacqueline M. Dinella] [printed: October 30, 2008 9:22 PM] [saved: October 27, 2008 2:59 PM] S:\Global Sourcing\Fall2008-Spring2009\MBA\IBD\Recruiting Guide\UBS MBA Recruiting GuideFINAL 10_27_08.doc
59
Precedent Transactions Analysis
Fully-Diluted E.P.S.
200,000 x $20 = 66,667 incremental shares 200,000 –
$30
$5,000,000 = $2.42 Fully-Diluted E.P.S. =
2,000,000 + 66,667
Sources: Securities Data Company (“SDC”)—SDC provides a comprehensive M&A and corporate finance database that can be used to screen for and download information related to M&A transactions. This data is frequently inaccurate and must be checked. Nevertheless, an SDC screen should only be used to identify transactions. Analysis should always be done using official documentation and filings
You must order the relevant merger proxies and public filings available at the time of acquisition to accurately reflect the purchase price and other operating data
“Precedent Transactions Book”—a book of completed precedent transaction lists is being compiled and will be kept in the library. You should submit to the library for inclusion to this compilation any Precedent Transactions Analyses you have performed
Note: The number of shares assumed to be repurchased using option proceeds cannot exceed 20% of outstanding stock (400,000 limit in our example, versus 160,000 shares assumed to be repurchased for the Primary calculation). The additional option proceeds should be assumed to retire short-term debt first, then long-term debt, and finally, to be invested in government securities

[Jacqueline M. Dinella] [printed: October 30, 2008 9:22 PM] [saved: October 27, 2008 2:59 PM] S:\Global Sourcing\Fall2008-Spring2009\MBA\IBD\Recruiting Guide\UBS MBA Recruiting GuideFINAL 10_27_08.doc
60
Discounted Cash Flow (DCF)
Definition
♦ Discounted Cash Flow is one method of valuing a company, business segment or project. The DCF value represents the present value of unlevered, after-tax cash flows to all providers of capital using the weighted average cost of capital (WACC) as the discount rate
Methodology
The DCF method entails estimating the free cash flow available to debt and equity investors (i.e., the annual cash flows generated by the business, and the terminal value of the business at the end of the time horizon) and discounting these flows back to the present using the weighted average cost of capital as the discount rate to arrive at a present value of the assets
♦ Pros and pitfalls:
– the DCF is not tied to historical accounting values; it is forward-looking
– it recognizes the time value of money
– it allows an expected operating strategy to be incorporated into the model
– pay particular attention to the generation of cash flows and the assumptions you use. Since there is a great deal of subjectivity in making assumptions, a poorly constructed set of assumptions may yield inaccurate or unmeaningful results. Make sure that the cash flow assumptions and calculations are reasonable
– check to see how much of the total value comes from the terminal value. If the terminal value represents significantly more than 50–60% of the total value, then the DCF value is less reliable since much of the value is driven by your assumptions about how much the business is worth in the future
– be careful about inflation forecasts. Discount current dollar cash flows at nominal discount rates and constant dollar cash flows at real discount rates
– DCF valuations are based on assumptions. Use several scenarios about the future to create bounds on the target’s value

[Jacqueline M. Dinella] [printed: October 30, 2008 9:22 PM] [saved: October 27, 2008 2:59 PM] S:\Global Sourcing\Fall2008-Spring2009\MBA\IBD\Recruiting Guide\UBS MBA Recruiting GuideFINAL 10_27_08.doc
61
Free Cash Flow (FCF)
Definition
♦ Cash flow generated by all assets
♦ Unlevered; “free from financing considerations”
♦ Accrual to all providers of capital
Calculation
EBITDA
– Depreciation
= EBITA
– Notional Taxes 1
= After-tax EBITA
+ Depreciation
– Investment in Working Capital ((Current Assets-Cash)-(Current Liabilities-STD))
– Capital Expenditures
= Free Cash Flow
Alternatively
Net Income 2
+ Deferred Taxes and other Non-Cash Charges (e.g., depreciation, amortization and deferred taxes) 3
+ After-tax Interest Expense
– Investment in Working Capital
– Capital Expenditures 4
= Free Cash Flow
Notes: 1 At the company’s effective tax rate, typically 35% 2 Net Income before preferred dividends, equity income and minority interest 3 Note that goodwill amortization is only deductible for tax purposes under limited circumstances in the US 4 Capital expenditures will fluctuate from year to year. It is assumed that in the terminal year, capital expenditures equals the depreciation, depletion and
amortization charge. On average, capital expenditure is likely to be higher than in the terminal year

[Jacqueline M. Dinella] [printed: October 30, 2008 9:22 PM] [saved: October 27, 2008 2:59 PM] S:\Global Sourcing\Fall2008-Spring2009\MBA\IBD\Recruiting Guide\UBS MBA Recruiting GuideFINAL 10_27_08.doc
62
Free Cash Flow (FCF)
♦ Contrasted with Cash Flow from Operations (which consists of Net Income plus Depreciation and Amortization plus Deferred Taxes and Non-Cash charges)
Methodology
Income Statement
♦ Project growth in Net Sales:
– base assumptions on:
– research reports
– client forecasts (if available)
– industry trends
– percent growth is usually an input; aggregate sales is derived from this input
♦ Estimate the following by percent of sales:
– cost of Goods Sold (COGS)
– selling, General and Administrative (SG&A) Expenses
♦ Determine Interest Expense based on the notes to the most recent form 10-K. Refer to the debt schedule and calculate the weighted average interest rate. If no debt schedule is available, then compute Interest Expense as a percent of average Long-Term Debt:
– average LTD outstanding = (Beginning LTD + Ending LTD)/2
– note that his interest expense calculation will cause a CIRC in Excel; therefore, you need to iterate the model several times. Remember that the amount of interest will have no impact on a DCF’s value since the analysis is done on an unlevered basis
♦ Assess tax rate based on the marginal tax rate (federal, state and local) and current tax regulation

[Jacqueline M. Dinella] [printed: October 30, 2008 9:22 PM] [saved: October 27, 2008 2:59 PM] S:\Global Sourcing\Fall2008-Spring2009\MBA\IBD\Recruiting Guide\UBS MBA Recruiting GuideFINAL 10_27_08.doc
63
Free Cash Flow (FCF)
♦ Net Income from the income statement 9
♦ Depreciation:
– beginning Property, Plant and Equipment (PP&E) plus ½ Capital Expenditures divided by average asset life
– also express as % of PP&E
– note: This depreciation calculation will cause a CIRC in Excel. Therefore, you need to iterate the model several times
– excludes owned property because it is not depreciable (leased property is)
– average asset life = PP&E divided by depreciation expense
♦ Deferred Taxes:
– some percentage of depreciation based on historical relationship
♦ After-tax interest expense:
– interest expense x (l–t) where t = marginal tax rate
– note: Interest Expense should be net of interest income (i.e., gross interest expense minus interest income) because interest income is not a function of operations (excluding financial institutions)
♦ Capital Expenditures (CapEx):
– the expenditures necessary to maintain the required capital intensity (see PP&E analysis under selected balance sheet items)
9 Before preferred dividends, equity income and minority interest

[Jacqueline M. Dinella] [printed: October 30, 2008 9:22 PM] [saved: October 27, 2008 2:59 PM] S:\Global Sourcing\Fall2008-Spring2009\MBA\IBD\Recruiting Guide\UBS MBA Recruiting GuideFINAL 10_27_08.doc
64
Free Cash Flow (FCF) ♦ Investment in Working Capital (WC):
– difference between beginning and ending WC (see WC analysis under Selected Balance Sheet Items below) – exclude Cash and Cash Equivalents – exclude Short-Term Debt (STD)
Selected Balance Sheet Items
♦ Working Capital excluding cash and cash equivalents and STD: – estimate WC as a percent of sales: WC = (Current Assets–Cash and Cash Equivalents)–(Current Liabilities–STD) – possible to squeeze cash from WC by operating more efficiently – the three major components of working capital are: inventories, receivables and payables – inventories are calculated based on “turns”. The equation is:
Inventories
Cost of Goods Sold x 365
– receivables are based on days outstanding. The equation is:
Receivables
Sales x 365
– payables are also based on days. The equation is:
Payables
Cost of Goods Sold x 365
– “other current assets” should be calculated as a percentage of sales and “other current liabilities” as a percentage of COGS
♦ Property, Plant and Equipment (PP&E): – project by capital intensity/efficiency: sales divided by (PP&E)
Beginning PP&E known
– Depreciation known
+ CapEx solved for
= Ending PP&E known
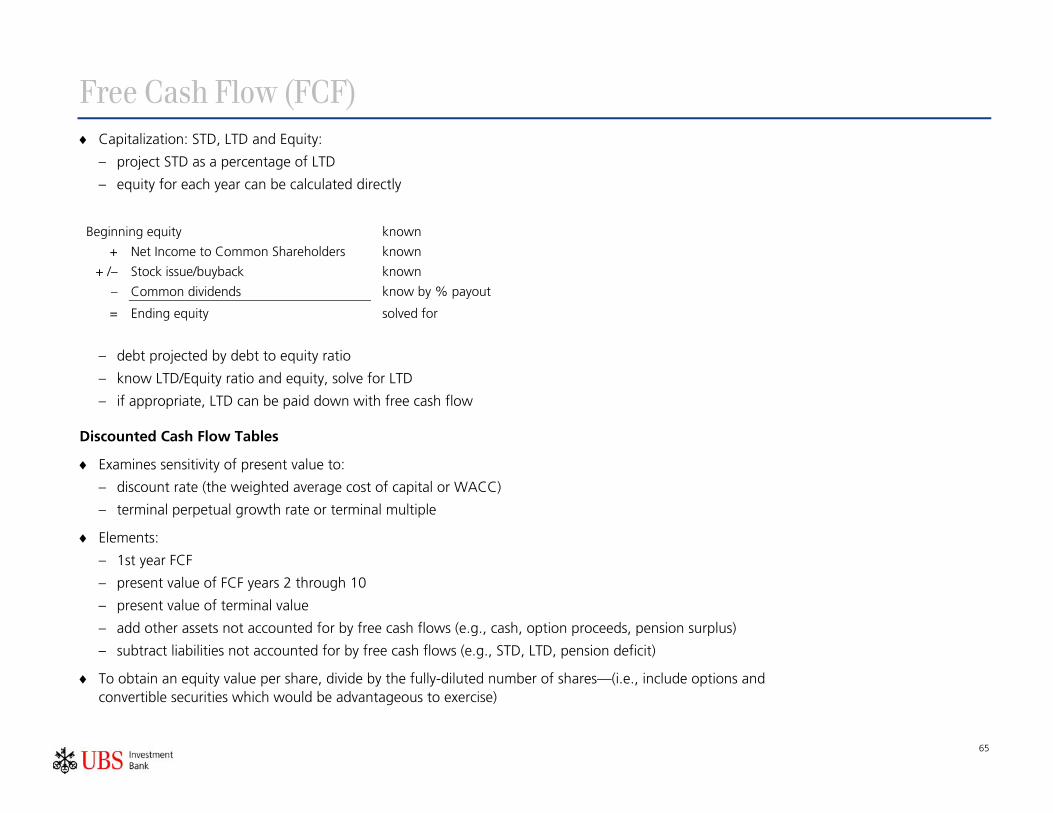
[Jacqueline M. Dinella] [printed: October 30, 2008 9:22 PM] [saved: October 27, 2008 2:59 PM] S:\Global Sourcing\Fall2008-Spring2009\MBA\IBD\Recruiting Guide\UBS MBA Recruiting GuideFINAL 10_27_08.doc
65
Free Cash Flow (FCF) ♦ Capitalization: STD, LTD and Equity:
– project STD as a percentage of LTD
– equity for each year can be calculated directly
Beginning equity known
+ Net Income to Common Shareholders known
+ /– Stock issue/buyback known
– Common dividends know by % payout
= Ending equity solved for
– debt projected by debt to equity ratio
– know LTD/Equity ratio and equity, solve for LTD
– if appropriate, LTD can be paid down with free cash flow
Discounted Cash Flow Tables
♦ Examines sensitivity of present value to:
– discount rate (the weighted average cost of capital or WACC)
– terminal perpetual growth rate or terminal multiple
♦ Elements:
– 1st year FCF
– present value of FCF years 2 through 10
– present value of terminal value
– add other assets not accounted for by free cash flows (e.g., cash, option proceeds, pension surplus)
– subtract liabilities not accounted for by free cash flows (e.g., STD, LTD, pension deficit)
♦ To obtain an equity value per share, divide by the fully-diluted number of shares—(i.e., include options and convertible securities which would be advantageous to exercise)

[Jacqueline M. Dinella] [printed: October 30, 2008 9:22 PM] [saved: October 27, 2008 2:59 PM] S:\Global Sourcing\Fall2008-Spring2009\MBA\IBD\Recruiting Guide\UBS MBA Recruiting GuideFINAL 10_27_08.doc
66
Forecasting Terminal Value: Two Methods
Perpetual Growth
♦ Implicit assumption: the firm will be owned forever
♦ Digression—dividend discount model
– states that you can value a stock by taking the present value of the dividend in perpetuity Expected Stock Value = Div
r
– where Div = a dividend to be received one period from now
– r = discount rate
– If the dividend is expected to grow forever at the same rate, the formula is modified to read: Expected Stock Value = Div
r-g
– where g = perpetual growth of the dividend
Perpetual Growth Formula:
Terminal Value = FCFn * (1 + g)
(r-g)
– where FCFn = free cash flow in period “n”
– g = perpetual growth rate
– r = weighted average cost of capital

[Jacqueline M. Dinella] [printed: October 30, 2008 9:22 PM] [saved: October 27, 2008 2:59 PM] S:\Global Sourcing\Fall2008-Spring2009\MBA\IBD\Recruiting Guide\UBS MBA Recruiting GuideFINAL 10_27_08.doc
67
Forecasting Terminal Value: Two Methods
♦ Implications of the perpetual growth formula:
– FCFn * (1 + g) means you have converted the period “n” FCF into the period “n + 1” FCF (i.e., FCFn + 1)
– /(r–g)—means you have taken the present value of a perpetuity of FCF starting at period “n + 1” and growing at “g”
– the formula assumes that you receive the first FCF one year from now. (“now” being the middle of period “n” since all FCFs are assumed to occur at mid-period), so the “present value” of this perpetuity is at time “n–0.5”
– you can make a variety of assumptions about when the cash flows are received
Terminal Multiple
♦ Implicit assumption: the firm will be sold at the end of period “n”
♦ Use a multiple of any relevant figure: Book Value, Net Income, Cash Flow from Operations, EBIT, EBITDA, Sales, etc.
– note: Terminal Value should be an Enterprise Value; NOT ALL multiples produce an Enterprise Value (e.g., P/Es)
– LITMUS TEST: Has interest been subtracted before you arrive at this figure?
– if yes: the multiple gives an EQUITY Value
– if no: the multiple gives an ENTERPRISE Value
Multiple of Value Produced
Book Value Equity
Net Income Equity
Cash Flow from Operations (as defined on page 21 and page 24) Equity
Net Sales Enterprise
EBITDA Enterprise
EBIT Enterprise
♦ Since the firm is sold at the end of the period of projected FCFs, the terminal multiple value is at time “n”

[Jacqueline M. Dinella] [printed: October 30, 2008 9:22 PM] [saved: October 27, 2008 2:59 PM] S:\Global Sourcing\Fall2008-Spring2009\MBA\IBD\Recruiting Guide\UBS MBA Recruiting GuideFINAL 10_27_08.doc
68
Forecasting Terminal Value: Two Methods
Reality Check: Imputing a Perpetual Growth Rate or a Terminal Multiple
♦ To equate the terminal values produced by the perpetual growth method and by the terminal multiple method, grow the terminal value generated by the perpetual growth method by half a period (i.e., multiply the terminal value by
5.0)^1( r+ )
Equity Multiple Example:
TV = FCFn * (1 + g) * (1 + r)^0.5 = P/En * Nin + TDn
(r-g)
Where
TV = unlevered terminal value
FCFn = free cash flow of period “n”
g = perpetual growth rate of free cash flow
r = weighted average cost of capital
P/En = terminal P/E multiple
NIn = net income of period “n”
TDn = total debt of period “n”, including preferred stock
Solve for the Implied Terminal P/E Ratio:
P/En = FCFn * (1 + g) * (1 + r)^0.5–TDn * (r–g)
NIn * (r–g)
Solve for the Implied Perpetual Growth Rate:
g = (P/En * NIn + TDn) * r–FCFn * (1 + r)^0.5
(P/En * NIn + TDn) + FCFn * (1 + r)^0.5

[Jacqueline M. Dinella] [printed: October 30, 2008 9:22 PM] [saved: October 27, 2008 2:59 PM] S:\Global Sourcing\Fall2008-Spring2009\MBA\IBD\Recruiting Guide\UBS MBA Recruiting GuideFINAL 10_27_08.doc
69
Forecasting Terminal Value: Two Methods ♦ Asset multiple example—with an asset multiple, the formula is the same as with an equity multiple, but total debt =
zero (TDn = 0): TV = FCFn * (1 + g) * (1 + r)^0.5 = A/EBITn * EBITn
EBITn + (r–g)
– where A/EBITn = asset value to EBIT multiple
Solve for the Implied A/EBIT Ratio:
A/EBITn = FCFn * (1 + g) * (1 + r)^0.5
EBITn + (r–g)
Solve for the Implied Perpetual Growth Rate:
g = (A/EBITn * EBITn) * r–FCFn * (1 + r)^0.5
(A/EBITn * EBITn) + FCFn * (1+ r)^0.5
♦ One fallacy of the DCF analysis is that the two methods (i.e., the terminal method and the perpetual method) do not always concur. Determining the growth rate is somewhat subjective and the analysis is highly sensitive to it. The terminal multiple is also somewhat subjective as it requires an estimate of future trading multiples, which may very well be different from current multiples. The analysis is highly sensitive to this as well and oftentimes results in a total present value heavily weighted toward the terminal value, rather than the stream of cash flows
♦ Notwithstanding the above mentioned text, it is often useful to determine the enterprise value via both methods so that you can compare the two results and their implied multiples of current operating results. For example, if the terminal method results in a total present value of 8x Year 1 EBITDA and the perpetual method results in 5x Year 1 EBITDA, both analyses and their respective assumptions deserve further review
♦ In addition, you should also compare the terminal multiple implied by the perpetual growth rate and vice versa. If, for example, you are using the perpetual method and the implied terminal multiple is 3x EBITDA (and your industry trades at 9x EBITDA), chances are your perpetual growth rate is too low. Similarly, if you are using the terminal method and the implied perpetual growth rate is 11%, chances are your terminal multiple is too high. It should be noted that this is not necessarily always the case and sometimes one particular method might be irrelevant to that particular company. They should be checked nevertheless, and you should consult someone else on your team to determine appropriate measures

[Jacqueline M. Dinella] [printed: October 30, 2008 9:22 PM] [saved: October 27, 2008 2:59 PM] S:\Global Sourcing\Fall2008-Spring2009\MBA\IBD\Recruiting Guide\UBS MBA Recruiting GuideFINAL 10_27_08.doc
70
Calculating WACC
Weighted Average Cost of Capital (WACC)
♦ To determine the WACC of a company, one must ascertain the costs of the various sources of capital for the company, with a given capital structure. The after-tax costs of the various sources are then averaged to arrive at an appropriate discount rate to value unlevered cash flows
♦ We incorporate three basic sources of capital into our methodology
– debt
– preferred Equity
– common Equity
♦ Since the cost of each financing source is partly a function of the mix between the various sources of capital, you may need to calculate the WACC and its individual cost components at various capitalization structures
♦ As a practical matter, you should determine the credit rating of the company at the targeted capital structure(s), and seek rate views based on those credit ratings
♦ Where to find cost of debt:
– check the footnote referring to debt to see what the Company is currently paying
– consult a banker in debt capital markets for a 10-year maturity all-in new issue rate at the credit rating corresponding to the targeted capital structure. As part of this process, you should look at the yield on new issues of comparable companies since the cost of debt is a function of the risks associated with a given business/industry
– if the company has public debt outstanding and you do not intend to change its capital structure, find the debt rating in Moody’s, the S&P handbook or on Bloomberg

[Jacqueline M. Dinella] [printed: October 30, 2008 9:22 PM] [saved: October 27, 2008 2:59 PM] S:\Global Sourcing\Fall2008-Spring2009\MBA\IBD\Recruiting Guide\UBS MBA Recruiting GuideFINAL 10_27_08.doc
71
Calculating WACC
♦ Where to find cost of preferred equity:
– check to see if there is any outstanding in the market
– consult a banker in equity capital markets to determine the rate at which the company could raise similar preferred stock today
♦ Calculating the cost of common equity:
– use the Capital Asset Pricing Model (CAPM)
– cost of Equity = Risk-free Rate + (Predicted Beta * Equity Risk Premium)
♦ The risk-free rate can be taken as the interest rate on a generic 10-year government note. You can obtain this generic ten-year rate on Bloomberg by typing “GT20”, pressing the <<Govt>> key, and then pressing the green <<Go>> key
– justification comes from the observation that the cash flow pattern of a 10-year bond roughly approximates the cash flow pattern of a typical ten-year DCF analysis
Equity Risk Premium: The “equity risk premium” refers to the premium demanded by equity investors on shares which have an “average” degree of market-related risk and an “average” level of leverage (i.e., debt/equity ratio). UBS makes the assumption that the historical risk premium is a good proxy for the expected risk premium. Our methodology calculates the relevant risk premium as the mean of excess returns of common stocks versus long-term government bonds. Data for this calculation is taken typically from the Ibbotson and Sinquefield study, Stock, Bonds, Bills and Inflation. You should consult with senior members of your team over what market risk premium to use and why.

[Jacqueline M. Dinella] [printed: October 30, 2008 9:22 PM] [saved: October 27, 2008 2:59 PM] S:\Global Sourcing\Fall2008-Spring2009\MBA\IBD\Recruiting Guide\UBS MBA Recruiting GuideFINAL 10_27_08.doc
72
Calculating WACC
♦ Obtain the predicted (not historical) Beta (b) from FactSet. If you are working with a public company and do not intend to change its capital structure, simply obtain the predicted Beta from Barra and use it in the CAPM formula above. If you do intend to alter the capital structure or when valuing private companies or a segment of companies, you will need to calculate an average or median Beta of comparable companies to get a more accurate measure of the risk associated with a given business
♦ Betas and equity risk premium data are normally available only for major stock markets. It may still be possible to use this data when the target business is in a different country, although the equity risk premium might be higher for a developing economy or an emerging stock market than for, say, the NYSE or London Stock Exchange
♦ Beta reflects the assumed level of gearing. Betas obtained from FactSet, Datastream, Value Line and most other sources are “geared betas” which reflect the actual level of gearing for the company concerned. Within normal gearing ranges, Beta can be adjusted to reflect assumed gearing levels different from the actual gearing level
♦ The problem with taking an average of the published Betas is that a stock or Beta is a function of a company’s capital structure. Betas will be higher for more highly leveraged companies. Thus, we use a formula to unlever all Betas to get an unlevered Beta for each comparable company
♦ “Levered Beta”—calculated assuming firm’s current leverage: total debt/adjusted market capitalization. Obtain predicted levered Betas for your company and/or comparable companies from FactSet
♦ Unlever the predicted Beta(s) to arrive at an unlevered Beta for your company or each comparable company:

[Jacqueline M. Dinella] [printed: October 30, 2008 9:22 PM] [saved: October 27, 2008 2:59 PM] S:\Global Sourcing\Fall2008-Spring2009\MBA\IBD\Recruiting Guide\UBS MBA Recruiting GuideFINAL 10_27_08.doc
73
Calculating WACC
Unlevered Beta = Levered Beta
1 + ((1–t) x (Debt/Common)) + Pfd/Common
Where
Beta = predicted Beta (from FactSet or Barra Rosenburg)
t = marginal tax rate
Debt = market value of total debt
Common = market value of common equity
Pfd = market value of preferred equity
♦ Note: It is more technically correct to use the average market values of debt, preferred equity and common equity from the period over which the predicted beta was calculated. However, we typically use the most recent values since they are usually not significantly different and since it is much easier to do so
♦ Calculate the mean or median unlevered Beta from your sample and relever the mean or median unlevered Beta with different capitalization structures to examine various scenarios
– relevered Beta = Unlevered Beta * [l + ((l-t) * (Debt/Common)) + Pfd/Common]
– use the relevered Beta as the “predicted Beta” in the CAPM formula
– the Debt, Equity and Capitalization values used should represent the “target” capital structure (the capital structure that includes planned debt and equity financings)

[Jacqueline M. Dinella] [printed: October 30, 2008 9:22 PM] [saved: October 27, 2008 2:59 PM] S:\Global Sourcing\Fall2008-Spring2009\MBA\IBD\Recruiting Guide\UBS MBA Recruiting GuideFINAL 10_27_08.doc
74
Calculating WACC
Weighted Average Cost of Capital
♦ Note: Always use MARKET VALUE of common equity and preferred stock
WACC = Ke x E + Kd (1–t) x TD + Kpx Pfd
TD + E + Pfd TD + E + Pfd TD + E + Pfd
Where Ke = Risk Free Rate + (Levered Beta x Market Risk Premium)
Kd = 10-year all-in cost of borrowing for a new issue (actuals or comparables)
Kp = Estimated cost of preferred stock (same type as existing)
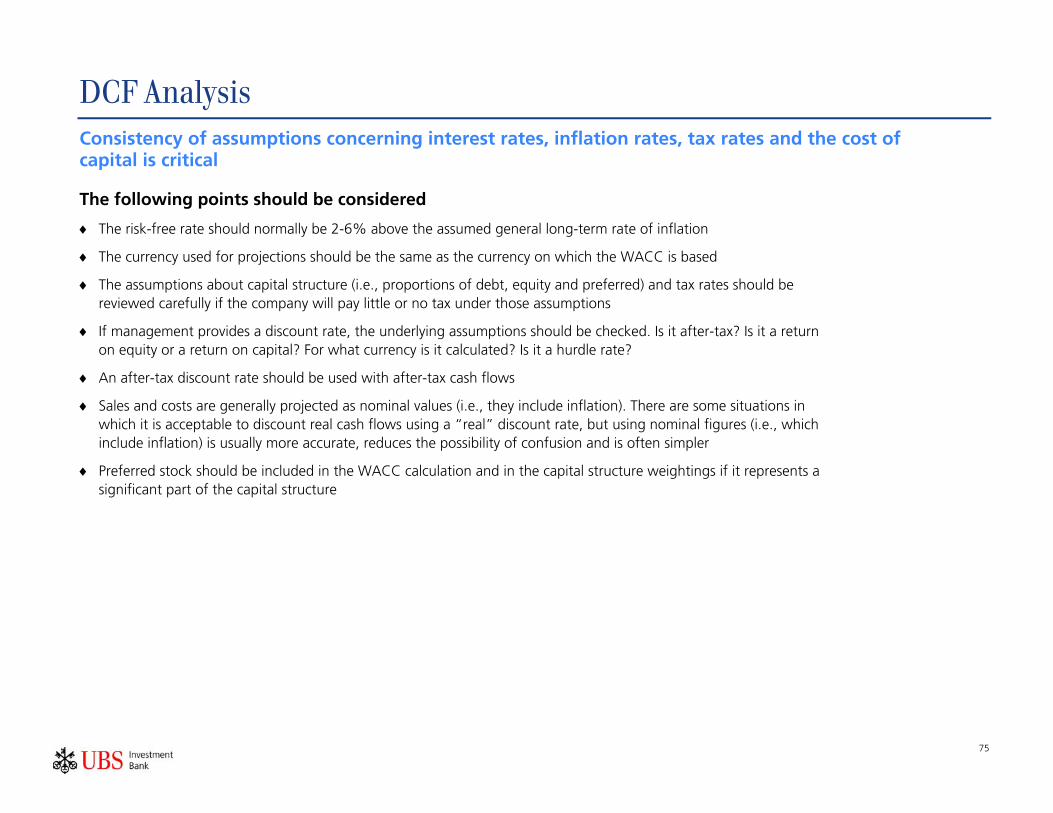
[Jacqueline M. Dinella] [printed: October 30, 2008 9:22 PM] [saved: October 27, 2008 2:59 PM] S:\Global Sourcing\Fall2008-Spring2009\MBA\IBD\Recruiting Guide\UBS MBA Recruiting GuideFINAL 10_27_08.doc
75
DCF Analysis Consistency of assumptions concerning interest rates, inflation rates, tax rates and the cost of capital is critical
The following points should be considered
♦ The risk-free rate should normally be 2-6% above the assumed general long-term rate of inflation
♦ The currency used for projections should be the same as the currency on which the WACC is based
♦ The assumptions about capital structure (i.e., proportions of debt, equity and preferred) and tax rates should be reviewed carefully if the company will pay little or no tax under those assumptions
♦ If management provides a discount rate, the underlying assumptions should be checked. Is it after-tax? Is it a return on equity or a return on capital? For what currency is it calculated? Is it a hurdle rate?
♦ An after-tax discount rate should be used with after-tax cash flows
♦ Sales and costs are generally projected as nominal values (i.e., they include inflation). There are some situations in which it is acceptable to discount real cash flows using a “real” discount rate, but using nominal figures (i.e., which include inflation) is usually more accurate, reduces the possibility of confusion and is often simpler
♦ Preferred stock should be included in the WACC calculation and in the capital structure weightings if it represents a significant part of the capital structure

[Jacqueline M. Dinella] [printed: October 30, 2008 9:22 PM] [saved: October 27, 2008 2:59 PM] S:\Global Sourcing\Fall2008-Spring2009\MBA\IBD\Recruiting Guide\UBS MBA Recruiting GuideFINAL 10_27_08.doc
76
LBO
Definition
♦ A leveraged buyout (LBO) is the acquisition of a target company by an investor group, which typically includes the target’s own management. The investor group acquires control of the target, financing its acquisition with a minimal amount of equity capital. The primary financing is in the form of debt collateralized with the assets of the target itself or with the target’s cash flow
♦ The goal of an LBO is to use the target to finance the purchase. The greater the borrowing power of the target, the less equity the investor group requires to make the acquisition. The actual cash outlay of the buying group is minimized—and the potential return on investment increased
♦ In a typical LBO, assuming stable credit markets, equity comprises between 20% and 30% of the purchase price. Under current market conditions, the equity contribution has trended towards 40-50%. The total amount of equity required depends upon the target’s sale price, the borrowing power of the target’s assets, the terms of such borrowing, and the lenders’ equity requirements. The target’s available cash may also be used to finance the purchase price
The Typical LBO Candidate
♦ It is difficult to define the characteristics of an ideal LBO candidate. However, it may be said that the following general guidelines apply
– management. Good management is the single most important factor in any LBO. A motivated and competent management group is needed to run the company after the buyout. In most cases, the best choice is for existing management to take an equity interest in the company. However, new management is sometimes brought in by new investors. As long as the management, new or old, is qualified and has appropriate incentive, the company should have a good chance for success

[Jacqueline M. Dinella] [printed: October 30, 2008 9:22 PM] [saved: October 27, 2008 2:59 PM] S:\Global Sourcing\Fall2008-Spring2009\MBA\IBD\Recruiting Guide\UBS MBA Recruiting GuideFINAL 10_27_08.doc
77
LBO
– cash flow is crucial. Cash flows should be healthy, steady and relatively predictable to permit collateralized, secured or unsecured borrowings. Excessive requirements for capital expenditures and research and development must not be critical to the ongoing success of the enterprise: cash flow must be used primarily to service and retire acquisition debt. “CASH IS KING, THE REST IS JUST JOURNAL ENTRIES” is a key concept
– exit strategy. The financial sponsor should have a strategy for exiting the business within an appropriate timeframe, either by selling the business to another financial or strategic buyer or by selling stock to the public through an initial public offering. The exit multiple should be at least the acquisition multiple assuming the financial sponsor has improved profitability
– market niche. Most LBO entities have found a good niche in the market for their product lines. These companies have a steady stream of revenues and a client base that is not overly dependent on a few large customers. Obviously, it helps to have a steady growth pattern, since growth in profitability will accelerate the repayment of the debt. Growth will also greatly enhance the valuation of the company in the event that it decides to make an initial public offering
– work force. Since assets are often redeployed and business plans change after an LBO, the company’s work force must be flexible and willing to participate. The company will often have to focus more on debt repayment than on expansion. Good employee morale is therefore very important. Management should make a concerted effort to minimize turnover by communicating effectively with all its employee groups
– skeletons in the boardroom. Any litigation problems or unresolved environmental concerns can be “deal-breakers” since these problems can make financing difficult to attain
– safety valves. Unrelated or potentially expendable divisions can greatly enhance the attractiveness of a target company, since they may be sold to raise funds for repayment of debt. Recently, banks have decided not to lend to transactions dependent upon asset sales
– technology. State-of-the-art technology helps ensure maximum efficiency and profitability. Also, if the technology is already in place there is less need for significant capital expenditure in the future
– buried treasure. Deal-makers always look for hidden or untapped assets, such as real estate, exclusive licenses, rights, patents, contracts, or franchises from which maximum value may be derived
– costs. The new company should have the capacity and the willingness to cut costs

[Jacqueline M. Dinella] [printed: October 30, 2008 9:22 PM] [saved: October 27, 2008 2:59 PM] S:\Global Sourcing\Fall2008-Spring2009\MBA\IBD\Recruiting Guide\UBS MBA Recruiting GuideFINAL 10_27_08.doc
78
LBO
♦ A LBO valuation assumes a certain capital structure, the returns demanded and the constraints imposed by the various providers of finance (equity, mezzanine, debt) and an assumption as to an exit route after a number of years (by flotation or trade sale). By a process of iteration, it establishes the maximum value that can be placed on the business in order for the returns to be achieved and the arithmetic to work
♦ We should bear in mind that LBOs are, by their very nature, structured with relatively high levels of debt. High debt adds to risk, and this is reflected in the returns demanded by investors in LBOs, which is in turn reflected in valuations
♦ The capital structure of LBOs reflects market circumstances. Whenever an LBO valuation is being considered, it is critical to insure our assumptions about viable capital structure are realistic
Financing
♦ Revolving Credit Facility
– Asset Based Lending Facility (“ABL”): maximum financing estimated at 75-90% of receivables and 35-60% of inventory. Need to understand seasonality of working capital needs
♦ Term Loans—”Senior Secured Debt”—typically has a 5–6 year maturity. Sum of Term Loan and Revolving Credit Facility kept at approximately 30% of pro forma capitalization (total debt + total book equity)
♦ Senior or Subordinated Notes—Bonds, typically unsecured with 7–8 year maturity
♦ Subordinated Debentures—typically 12–15 year debt
♦ Zero Coupon Debentures—typically 15–20 year maturity
♦ Common Equity—Goal of Financial Sponsors is to keep equity contribution low to maximize returns. Usually minimum of 30% of capitalization but in current market, more like 40-50%. Often diluted to an extent by options and warrants. Fully-diluted returns should be 20-25%
♦ Preferred Equity—standard or paid-in-kind (“PIK”)
Coverage
♦ EBITDA/Cash Interest—should be 2.0x–2.5x in year 1 and rise to 3.0x–4.0x in five years

[Jacqueline M. Dinella] [printed: October 30, 2008 9:22 PM] [saved: October 27, 2008 2:59 PM] S:\Global Sourcing\Fall2008-Spring2009\MBA\IBD\Recruiting Guide\UBS MBA Recruiting GuideFINAL 10_27_08.doc
79
LBO
♦ EBIT/Cash Interest—should be greater than 2.0x and should rise to over 2.5x within 1–2 years
♦ (EBITDA-CapEx-Change in WC-Cash Taxes)/Cash Interest—should be 1.0x at a minimum. 1.5x-2.0x is more comfortable
♦ Debt paydown—should be less than 5–6 years
♦ Exit horizon—typically 4–6 years
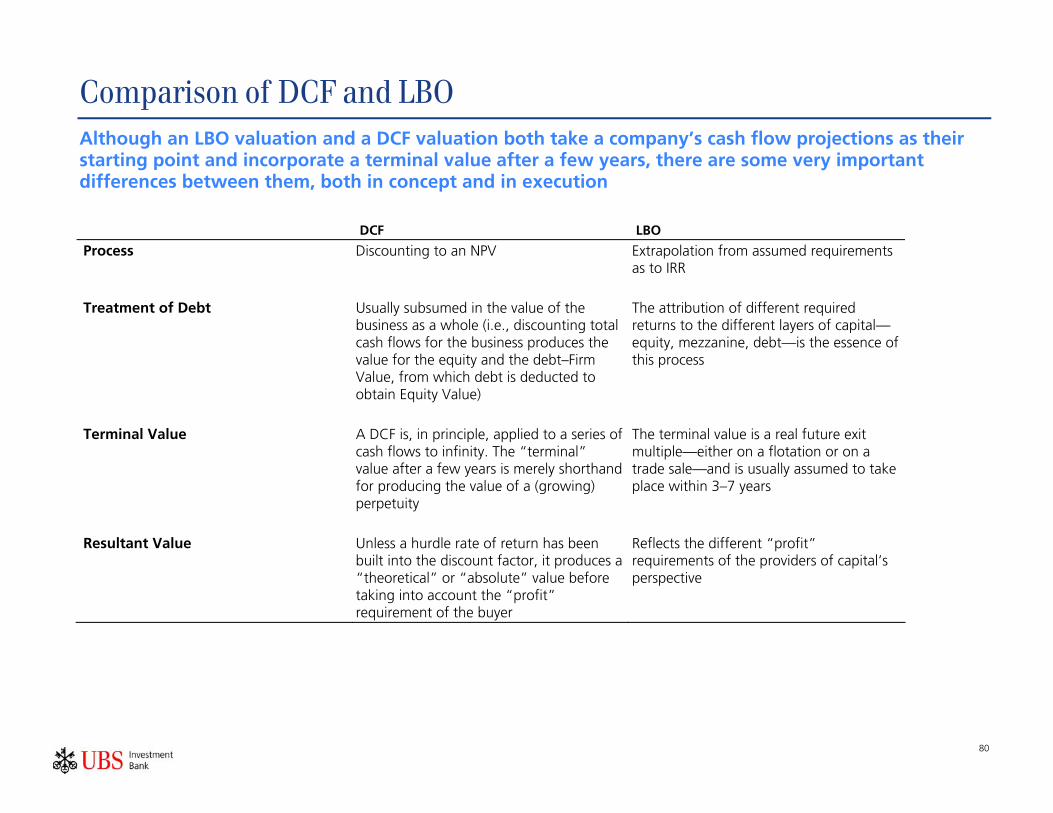
[Jacqueline M. Dinella] [printed: October 30, 2008 9:22 PM] [saved: October 27, 2008 2:59 PM] S:\Global Sourcing\Fall2008-Spring2009\MBA\IBD\Recruiting Guide\UBS MBA Recruiting GuideFINAL 10_27_08.doc
80
Comparison of DCF and LBO Although an LBO valuation and a DCF valuation both take a company’s cash flow projections as their starting point and incorporate a terminal value after a few years, there are some very important differences between them, both in concept and in execution
DCF LBO
Process Discounting to an NPV Extrapolation from assumed requirements as to IRR
Treatment of Debt Usually subsumed in the value of the business as a whole (i.e., discounting total cash flows for the business produces the value for the equity and the debt–Firm Value, from which debt is deducted to obtain Equity Value)
The attribution of different required returns to the different layers of capital—equity, mezzanine, debt—is the essence of this process
Terminal Value A DCF is, in principle, applied to a series of cash flows to infinity. The “terminal” value after a few years is merely shorthand for producing the value of a (growing) perpetuity
The terminal value is a real future exit multiple—either on a flotation or on a trade sale—and is usually assumed to take place within 3–7 years
Resultant Value Unless a hurdle rate of return has been built into the discount factor, it produces a “theoretical” or “absolute” value before taking into account the “profit” requirement of the buyer
Reflects the different “profit” requirements of the providers of capital’s perspective

[Jacqueline M. Dinella] [printed: October 30, 2008 9:22 PM] [saved: October 27, 2008 2:59 PM] S:\Global Sourcing\Fall2008-Spring2009\MBA\IBD\Recruiting Guide\UBS MBA Recruiting GuideFINAL 10_27_08.doc
81
Break-Up Analysis
Definition
♦ The break-up valuation reflects the value of a company’s equity by summing the value of its individual segments on a standalone basis to arrive at the aggregate value, and then making corporate adjustments to determine the enterprise and equity values. In essence, the break-up analysis looks at the company from the perspective of a raider who would finance an acquisition by “breaking up” the company (i.e., selling off each operating segment)
– the theory here is that the parts are worth more than the sum
♦ Methodology
♦ The break-up value exhibit can be structured as a one-page exhibit with both values and comments on a single page or a summary sheet of values and a back-up sheet of footnotes and computations
♦ In valuing a diversified company, the break-up value is composed of individual values for the separate operating segments (generally, based on multiples of EBIT, EBITA or EBITDA) and the other non-operating items, such as cash, debt, environmental liabilities, pension surpluses/deficits, tax credits, etc. The operating segments are valued based on an analysis of what similar companies have received in a precedent transaction or by using trading comps, DCFs or a LBO analysis
1. Segments:
A. Each segment of the company is valued independently in this section. The valuation method used depends largely on the type of company and the available information. Discounted cash flow valuation and analysis of multiples (e.g., premiums paid in precedent transactions, or trading multiples of comparable companies plus an M&A premium) are two commonly used approaches. Confer with a team member to choose the most appropriate valuation technique. Be sure to footnote the chosen method
2. Cash and Equivalents:
A. Include any cash deemed unnecessary to operate the business (i.e., excess cash), plus marketable securities

[Jacqueline M. Dinella] [printed: October 30, 2008 9:22 PM] [saved: October 27, 2008 2:59 PM] S:\Global Sourcing\Fall2008-Spring2009\MBA\IBD\Recruiting Guide\UBS MBA Recruiting GuideFINAL 10_27_08.doc
82
Break-Up Analysis
3. Option Proceeds:
A. Use the most recent financial statements to determine the number of options outstanding. Footnote the date of the balance sheet used
B. If in-the-money, multiply the number of options by the average exercise price (also found in the footnotes)
C. Make sure that the number of shares used to calculate the option proceeds is added to the number of shares outstanding used to calculate the per share data
D. In the “Comments” column, list the number of options outstanding at a given date and the average exercise price of the options
4. Pension Surplus (see footnotes to Annual Report or 10-K):
A. In the event that the calculation yields a negative number, the exhibit entry would be called “Pension Deficit” and the value would be subtracted from the total assets
B. Pension Surplus/(Deficit) is calculated as such:
($) ($)
Plan Assets at Fair Value 522.9 361.2
– Projected Benefit Obligation 361.2 or 522.9
Pension Surplus/(Deficit) 161.7 (161.7)
C. List the date of the financial statements used in calculating the pension surplus

[Jacqueline M. Dinella] [printed: October 30, 2008 9:22 PM] [saved: October 27, 2008 2:59 PM] S:\Global Sourcing\Fall2008-Spring2009\MBA\IBD\Recruiting Guide\UBS MBA Recruiting GuideFINAL 10_27_08.doc
83
Break-Up Analysis 5. Other Assets:
A. Other Assets are usually taken straight from the balance sheet. This typically includes such items as corporate real estate (as opposed to PP&E used by operating division), advances to affiliates and equity investment in unconsolidated subsidiaries. If the market value of Other Assets is known, then use that number rather than the book value
B. Note the date of the balance sheet from which the value of these assets was estimated
6. Other Items include: After-tax Environmental Liabilities, Tax Credits and the net present value of Net Operating Loss Carryforwards
7. Short-Term Debt: from most recent balance sheet
8. Long-Term Debt: from most recent balance sheet
9. Liquidation Value of Preferred Stock: from most recent balance sheet or the notes to the financial statements
10. Minority Interest: from most recent balance sheet or Market Value (if known)
11. Equity Value (or Net Asset Value):
A. Total items 1 through 10, adding and subtracting when appropriate. The result is the pre-tax breakup value of the company’s equity
B. If possible, it is usually desirable to analyze the breakup value on an after-tax basis since in reality, raiders would have to pay taxes if they sold off the individual segments of the company. You will need to determine the tax basis of each segment to figure out the taxes paid by segment and, therefore, the overall after-tax breakup value. The only truly accurate way to determine the tax basis for each business is to obtain this number from the company. However, most of the time you will not have access to this information so you must make an estimate. The process for estimating tax basis will vary by industry and company. The concept is to start with the book value of net assets, subtract out deferred taxes and make further adjustments based on the capital intensity of the business and the length of time the business has been owned by the company. Consult with team members as to what tax basis to use and footnote your assumption for each segment

[Jacqueline M. Dinella] [printed: October 30, 2008 9:22 PM] [saved: October 27, 2008 2:59 PM] S:\Global Sourcing\Fall2008-Spring2009\MBA\IBD\Recruiting Guide\UBS MBA Recruiting GuideFINAL 10_27_08.doc
84
Break-Up Analysis
12. Market Value:
A. Add the number of shares outstanding from the most recent financial statements and the number of options (from #3 above) to determine the total shares outstanding. Footnote the date of this value
B. Multiply this by the recent closing stock price. Note this date also
13. Footnotes:
A. List the number of shares used to calculate the per share numbers. Make sure this number includes the options which are assumed to have been exercised in #3 above (i.e., the number of shares used to calculate option proceeds should be added to the number of shares outstanding to maintain consistency)
B. Other footnotes as needed

[Jacqueline M. Dinella] [printed: October 30, 2008 9:22 PM] [saved: October 27, 2008 2:59 PM] S:\Global Sourcing\Fall2008-Spring2009\MBA\IBD\Recruiting Guide\UBS MBA Recruiting GuideFINAL 10_27_08.doc
85
Break-Up Analysis ♦ An example of a break-up value for XYZ Company is illustrated below
XYZ Company Segment Valuation EBITDA Multiple Value
Segment 1 $110.0 8.0x $880.0 Segment 2 90.0 10.0 900.0 Segment 3 45.0 7.0 315.0 Corporate 1 (12.0) 8.6 (103.2)
TOTAL $233.0 8.6x $1,991.8
XYZ Company Non-Operating Items Cash $30.0 Short-Term Debt (20.0) Long-Term Debt (190.0) Liquidation Value of Preferreds (70.0) Environmental Liabilities (After-tax) (36.0) Net Proceeds from Exercise of Options 100.0 Pension Surplus/(Deficit) 2 40.0 Tax Credits 3 50.0 NPV of NOLs (After-tax) 4 45.0 Total Non-Operating Items (51.0) Aggregate Valuation $1,940.8 Fully-Diluted Shares Outstanding (mm) 125.0 Pre-tax Aggregate Value per Share $15.53 Market Price on June 30, 2008 14.00 Pre-tax Aggregate Premium to Market 10.9% Pre-tax Pre-Corporate Value $2,044.0 Pre-tax Pre-Corporate Value per Share $16.35 Pre-tax Pre-Corporate Premium to Market 16.8%
Notes: 1 Corporate expense valued at weighted average multiple of all three segments 2 Equal to Plan Assets at Fair Value less Projected Benefit Obligation 3 Tax credits are an after-tax figure, dollar for dollar 4 NPV of NOLs is the after-tax discounted NOL cash flows

[Jacqueline M. Dinella] [printed: October 30, 2008 9:22 PM] [saved: October 27, 2008 2:59 PM] S:\Global Sourcing\Fall2008-Spring2009\MBA\IBD\Recruiting Guide\UBS MBA Recruiting GuideFINAL 10_27_08.doc
86
Acquisition Structures
♦ After preparing a set of valuations and deciding on a price for the target, an acquiring company must decide how much of the target to acquire and how to account for it
♦ If an acquirer acquires up to 20% of a target, it is recorded on the acquirer’s books using the Cost Method. For an acquisition of an interest between 20% and 50%, the Equity Method is employed. When an acquisition of over 50% is made, the financial statements of the target are fully consolidated with the acquirer’s financial statements. All of these methods can be accounted for using the purchase method
Suggested Procedure for Determining Appropriate Method
Equity Methodand
One-Line Consolidation
Consolidation Statement
Cost Method
PercentageAcquired
0%
20%
50%
100%
PurchaseMethod
Equity Methodand
One-Line Consolidation
Consolidation Statement
Cost Method
PercentageAcquired
0%
20%
50%
100%
PurchaseMethod
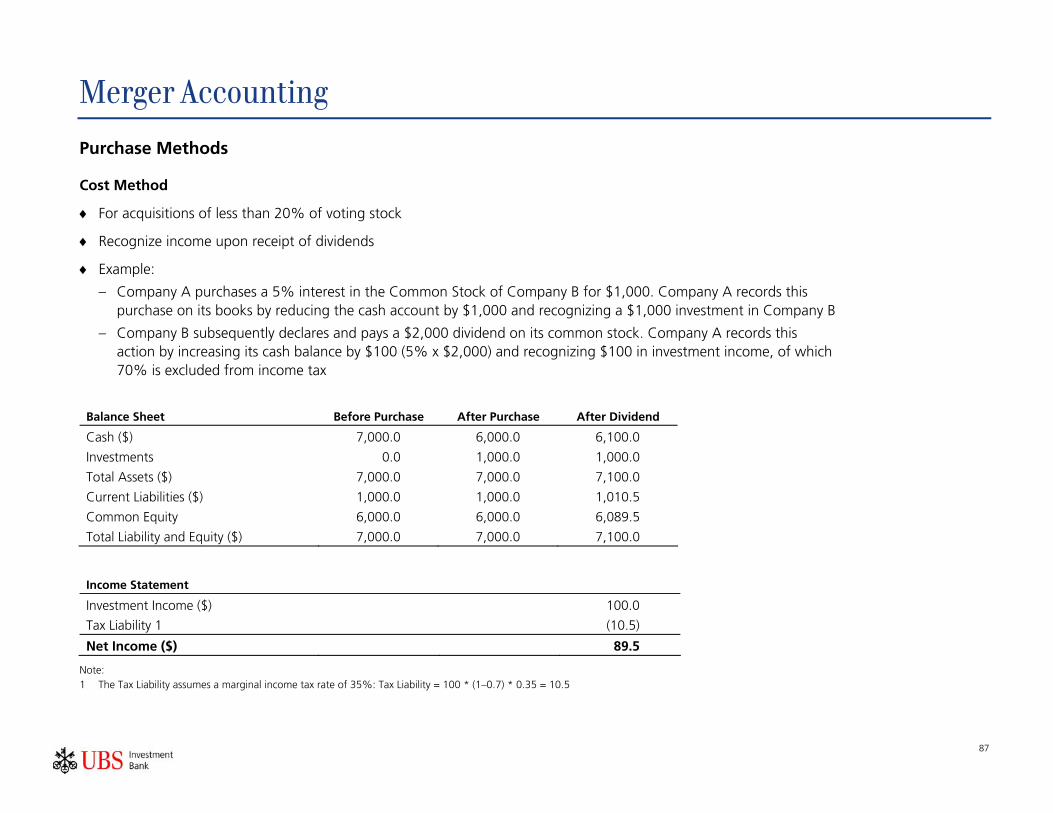
[Jacqueline M. Dinella] [printed: October 30, 2008 9:22 PM] [saved: October 27, 2008 2:59 PM] S:\Global Sourcing\Fall2008-Spring2009\MBA\IBD\Recruiting Guide\UBS MBA Recruiting GuideFINAL 10_27_08.doc
87
Merger Accounting
Purchase Methods
Cost Method
♦ For acquisitions of less than 20% of voting stock
♦ Recognize income upon receipt of dividends
♦ Example:
– Company A purchases a 5% interest in the Common Stock of Company B for $1,000. Company A records this purchase on its books by reducing the cash account by $1,000 and recognizing a $1,000 investment in Company B
– Company B subsequently declares and pays a $2,000 dividend on its common stock. Company A records this action by increasing its cash balance by $100 (5% x $2,000) and recognizing $100 in investment income, of which 70% is excluded from income tax
Balance Sheet Before Purchase After Purchase After Dividend
Cash ($) 7,000.0 6,000.0 6,100.0
Investments 0.0 1,000.0 1,000.0
Total Assets ($) 7,000.0 7,000.0 7,100.0
Current Liabilities ($) 1,000.0 1,000.0 1,010.5
Common Equity 6,000.0 6,000.0 6,089.5
Total Liability and Equity ($) 7,000.0 7,000.0 7,100.0
Income Statement
Investment Income ($) 100.0
Tax Liability 1 (10.5)
Net Income ($) 89.5
Note: 1 The Tax Liability assumes a marginal income tax rate of 35%: Tax Liability = 100 * (1–0.7) * 0.35 = 10.5

[Jacqueline M. Dinella] [printed: October 30, 2008 9:22 PM] [saved: October 27, 2008 2:59 PM] S:\Global Sourcing\Fall2008-Spring2009\MBA\IBD\Recruiting Guide\UBS MBA Recruiting GuideFINAL 10_27_08.doc
88
Merger Accounting
Equity Method
♦ For acquisitions of more than 20% of voting stock (or evidence of influence on target)
♦ Recognize income as proportional interest in the (adjusted) income of the target company
♦ Acquirer may consolidate results into its book financials if it attains more than a 50% voting interest
♦ Acquirer must consolidate results for tax purposes if it attains more than an 80% voting interest
♦ When recognizing income of the target, the acquirer must apply purchase accounting adjustments
♦ Increase value of investment by acquirer’s proportional interest in target income
♦ Reduce the value of the investment in the target to the extent of dividends received
♦ Step-Up vs No Step-Up:
– “step-Up”: increasing the tax basis of the assets acquired to fair market value
– contrasted with “Write-Up”: increasing the book basis of the assets acquired
– why step-up transactions are nearly an extinct species:
– general Utilities doctrine repealed in Tax Reform Act of 1986
– scenarios under which a step-up is still considered:
– large net operating loss carryforwards on target’s books
– target is an S corporation
– acquirer/target can benefit from certain grandfather provisions

[Jacqueline M. Dinella] [printed: October 30, 2008 9:22 PM] [saved: October 27, 2008 2:59 PM] S:\Global Sourcing\Fall2008-Spring2009\MBA\IBD\Recruiting Guide\UBS MBA Recruiting GuideFINAL 10_27_08.doc
89
Merger Accounting ♦ Purchase accounting adjustments:
– revaluing target balance sheet: – goal is to realize the Fair Market Value (FMV) of the assets and liabilities – eliminate existing amortizing goodwill on target’s books (no amortizations since 2001—see below) – eliminate deferred taxes on target’s books – if acquirer steps up its tax basis, then the revalued balance sheet equals FMV – in a no step-up transaction, assets and liabilities are revalued at their fair market values. A deferred tax account
is set up to equal the tax shield foregone (i.e., the deferred tax account for the acquired company is not eliminated)
Net Asset Value = Revalued Assets–Revalued Liabilities Goodwill = Purchase Price–Net Asset Value
– income statement adjustments: – if part of the consideration is cash: – lose opportunity cost of cash – extra interest charges from debt issued
– change in depreciation for revalued NP&E—the after-tax change will be the same under both step-up and no step-up scenarios
– goodwill is no longer amortized – instead, it is periodically (i.e. annually) tested for impairment
– if impairment is found, the impairment is recorded and goodwill is permanently reduced – previously, goodwill was amortized over up to 40 years – the SEC used to recommend 25-year life, but this also depended on the industry
– add back any amortization of old goodwill – amortize debt discount/premium from revalued LTD over the average debt life
– amortization of discount decreases income; amortization of premium increases income – intuition: amortization of debt discount premium effectively adjusts interest expense to current market rates
– if part of the consideration is preferred stock, preferred dividends arise

[Jacqueline M. Dinella] [printed: October 30, 2008 9:22 PM] [saved: October 27, 2008 2:59 PM] S:\Global Sourcing\Fall2008-Spring2009\MBA\IBD\Recruiting Guide\UBS MBA Recruiting GuideFINAL 10_27_08.doc
90
Complex Purchase Accounting Example No. One
Step-up in Tax Basis
Transaction Assumptions:
♦ A acquires B
♦ Each share of B is exchanged for $65 cash
♦ Total transaction size is $4,876, which A raises by issuing $4,841 in long-term debt and using $6 in excess cash plus options proceeds of $29
♦ Step-up tax basis, no recapture liability
♦ Marginal tax rate of 35.2%
Balance Sheets Prior to Merger Adjust B Purchase Price and Combined ($) A B to FMV Comment B as Adjusted Goodwill Adjustment A + B
Assets:
Other Assets 831 1,884 471,29 Land Reval.; Options Proceeds 2,384 (35) 3,180
Net PP&E 1,453 1,499 749 Fair Market Value 2,248 3,701
Goodwill 54 754 (754) Eliminate Old Goodwill – 2,472 2,526
TOTAL ASSETS 2,338 4,137 4,632 9,407
Liabilities and Shareholders’ Equity:
Current Liabilities 756 1,296 1,296 2,052
Long-Term Debt and Minority Interest 298 1,036 (104) Current Rate Revaluation 932 4,841 6,071
Deferred Taxes 232 288 (288) Eliminate Deferred Taxes – 232
Total Liabilities 1,286 2,620 2,228 8,355
Shareholders’ Equity 1,052 1,517 887 Revaluation Adjustment 2,404 (2,404) 1,052
TOTAL LIABILITIES AND SHAREHOLDERS’ EQUITY 2,338 4,137 4,632 9,407

[Jacqueline M. Dinella] [printed: October 30, 2008 9:22 PM] [saved: October 27, 2008 2:59 PM] S:\Global Sourcing\Fall2008-Spring2009\MBA\IBD\Recruiting Guide\UBS MBA Recruiting GuideFINAL 10_27_08.doc
91
Complex Purchase Accounting Example No. One
Transaction Assumptions:
♦ A acquires B
♦ Each share of B is exchanged for $65 cash
♦ Total transaction size is $4,876, which A raises by issuing $4,841 in long-term debt and using $6 in excess cash plus options proceeds of $29
♦ Step-up tax basis, no recapture liability
♦ Marginal tax rate of 35.2%
Income Statements
Prior to Merger Purchase
Accounting Combined A B Adjustments Comment A+B Revenues and Interest Income $3,485 $5,659 (.432) Interest on $6 Cash (7.2%) $9,144 Cost of Sales 1,799 4,221 50 Depreciation Increase (15 year life) 6,070 Selling, General and Administrative Expense 998 918 (19) Eliminate Prior Goodwill Amortization (40 years);
No New Goodwill Amortization 1,897
Interest Expense 40 93 4,508 Debt Revaluation (25 years); Interest on $4,841 Debt (10.5%) 645
Income Before Taxes 648 427 532
Income Taxes 281 177 (198) Income Taxes` 187
NET INCOME $367 $250 $345
E.P.S. $2.97 $3.37 Pro Forma E.P.S. $2.78 Dividends per Share 1.13 1.16 Pro Forma Dividends per Share 1.13 Shares Outstanding 124 74 Pro Forma Shares Outstanding 124 Market Assumptions Stock Price per Share $62.00 $58.00 Pro Forma Stock Price per Share $62.00 P/E Ratio 21.0x 17.0x Pro Forma P/E ratio 22.3x Total Market Value $4,588 $4,300 Pro Forma Total Market Value $4,588 Dividend Yield 1.8% 2.0% Pro Forma Dividend Yield 1.8%

[Jacqueline M. Dinella] [printed: October 30, 2008 9:22 PM] [saved: October 27, 2008 2:59 PM] S:\Global Sourcing\Fall2008-Spring2009\MBA\IBD\Recruiting Guide\UBS MBA Recruiting GuideFINAL 10_27_08.doc
92
Complex Purchase Accounting Example No. Two
No Step-up in Tax Basis–Pre-FASB 96
Transaction Assumptions:
♦ A acquires B
♦ Each share of B is exchanged for $65 cash
♦ Total transaction size is $4,876, which A raises by issuing $4,841 in long-term debt and using $6 in excess cash plus options proceeds of $29
♦ No step-up tax basis
♦ Marginal tax rate of 35.2%
♦ Original tax basis of Net PP&E for B is $873
Balance Sheets Prior to Merger Adjust B Purchase Price and Combined ($) A B to AFMV Comment B as Adjusted Goodwill Adjustment A + B
Assets:
Other Assets 831 1,884 471,29 Land Reval.; Options Proceeds 2,384 (35) 3,180
Net PP&E 1,453 1,499 265 AFMV 1,764 3,217
Goodwill 54 754 (754) Eliminate Old Goodwill – 2,993 3,047
TOTAL ASSETS 2,338 4,137 4,148 9,444
Liabilities and shareholders’ equity:
Current Liabilities 756 1,296 1,296 2,052
Long-Term Debt and Minority Interest 298 1,036 (67) Current Rate Revaluation 969 4,841 6,108
Deferred Taxes 232 288 (288) Eliminate Deferred Taxes – 232
Total Liabilities 1,286 2,620 2,265 8,392
Shareholders’ Equity 1,052 1,517 366 Revaluation Adjustment 1,883 (1,883) 1,052
TOTAL LIABILITIES AND SHAREHOLDERS’ EQUITY 2,338 4,137 4,148 9,444
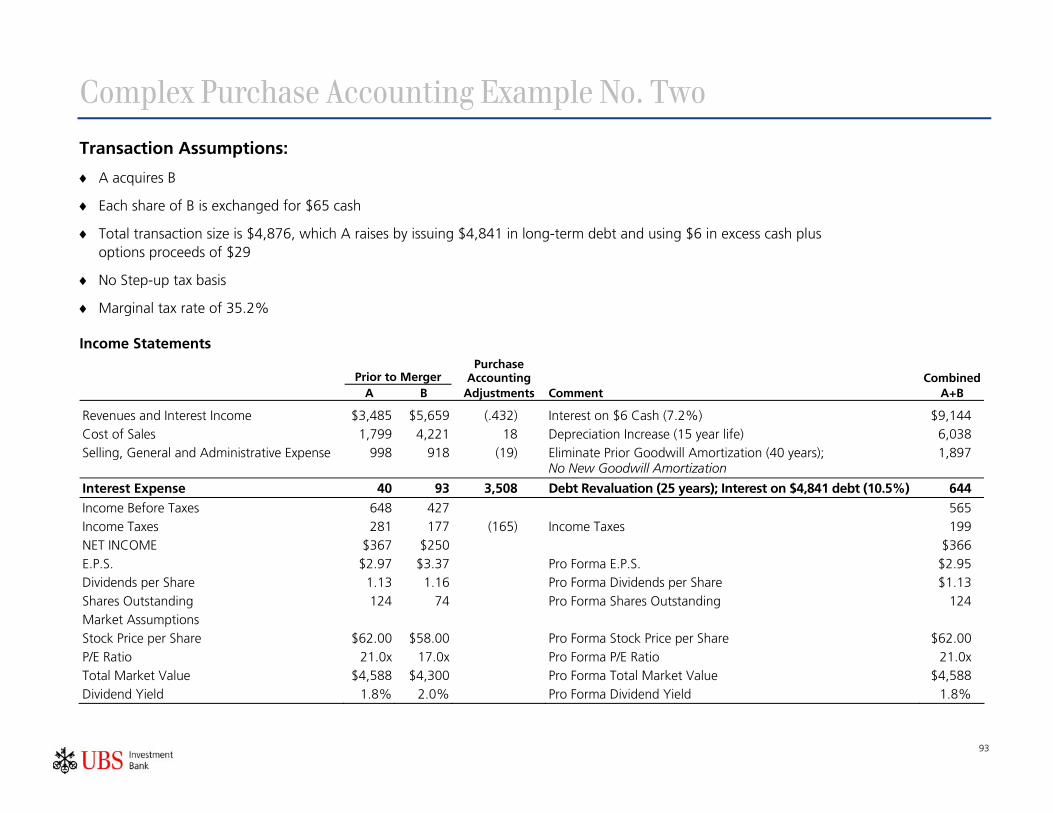
[Jacqueline M. Dinella] [printed: October 30, 2008 9:22 PM] [saved: October 27, 2008 2:59 PM] S:\Global Sourcing\Fall2008-Spring2009\MBA\IBD\Recruiting Guide\UBS MBA Recruiting GuideFINAL 10_27_08.doc
93
Complex Purchase Accounting Example No. Two
Transaction Assumptions:
♦ A acquires B
♦ Each share of B is exchanged for $65 cash
♦ Total transaction size is $4,876, which A raises by issuing $4,841 in long-term debt and using $6 in excess cash plus options proceeds of $29
♦ No Step-up tax basis
♦ Marginal tax rate of 35.2%
Income Statements
Prior to Merger Purchase
Accounting Combined A B Adjustments Comment A+B Revenues and Interest Income $3,485 $5,659 (.432) Interest on $6 Cash (7.2%) $9,144 Cost of Sales 1,799 4,221 18 Depreciation Increase (15 year life) 6,038 Selling, General and Administrative Expense 998 918 (19) Eliminate Prior Goodwill Amortization (40 years);
No New Goodwill Amortization 1,897
Interest Expense 40 93 3,508 Debt Revaluation (25 years); Interest on $4,841 debt (10.5%) 644
Income Before Taxes 648 427 565 Income Taxes 281 177 (165) Income Taxes 199 NET INCOME $367 $250 $366 E.P.S. $2.97 $3.37 Pro Forma E.P.S. $2.95 Dividends per Share 1.13 1.16 Pro Forma Dividends per Share $1.13 Shares Outstanding 124 74 Pro Forma Shares Outstanding 124 Market Assumptions Stock Price per Share $62.00 $58.00 Pro Forma Stock Price per Share $62.00 P/E Ratio 21.0x 17.0x Pro Forma P/E Ratio 21.0x Total Market Value $4,588 $4,300 Pro Forma Total Market Value $4,588 Dividend Yield 1.8% 2.0% Pro Forma Dividend Yield 1.8%

[Jacqueline M. Dinella] [printed: October 30, 2008 9:22 PM] [saved: October 27, 2008 2:59 PM] S:\Global Sourcing\Fall2008-Spring2009\MBA\IBD\Recruiting Guide\UBS MBA Recruiting GuideFINAL 10_27_08.doc
94
Complex Purchase Accounting Example No. Three
No Step-up in Tax Basis—(FASB 96)
Transaction Assumptions:
♦ A acquires B
♦ Each share of B is exchanged for $65 cash
♦ Total transaction size is $4,876, which A raises by issuing $4,841 in long-term debt and using $6 in excess cash plus options proceeds of $29
♦ No step-up tax basis
♦ Marginal tax rate of 35.2%
♦ Original tax basis of Net PP&E for B is $873
Balance Sheets Prior to Merger Adjust B B as Purchase Price and Combined ($) A B to FMV Comment Adjusted Goodwill Adjustment A + B
Assets:
Other Assets 831 1,884 471,29 Land Reval.; Options Proceeds 2,384 (35) 3,180
Net PP&E 1,453 1,499 749 AFMV 2,248 3,701
Goodwill 54 754 (754) Eliminate Old Goodwill – 3,158 3,212
TOTAL ASSETS 2,338 4,137 4,632 10,093
Liabilities and shareholders’ equity:
Current Liabilities 756 1,296 1,296 2,052
Long-Term Debt and Minority Interest 298 1,036 (104) Current Rate Revaluation 932 4,841 6,071
Deferred Taxes 232 288 (288), 686 Eliminate Deferred Taxes; Current 686 918
Total Liabilities 1,286 2,620 2,914 9,041
Shareholders’ Equity 1,052 1,517 201 Revaluation Adjustment 1,718 (1,718) 1,052
TOTAL LIABILITIES AND SHAREHOLDERS’ EQUITY 2,338 4,137 4,632 10,093

[Jacqueline M. Dinella] [printed: October 30, 2008 9:22 PM] [saved: October 27, 2008 2:59 PM] S:\Global Sourcing\Fall2008-Spring2009\MBA\IBD\Recruiting Guide\UBS MBA Recruiting GuideFINAL 10_27_08.doc
95
Complex Purchase Accounting Example No. Three
Transaction Assumptions:
♦ A acquires B
♦ Each share of B is exchanged for $65 cash
♦ Total transaction size is $4,876, which A raises by issuing $4,841 in long-term debt and using $6 in excess cash plus options proceeds of $29
♦ No step-up tax basis
♦ Marginal tax rate of 35.2%
Prior to Merger Purchase
Accounting Combined A B Adjustments Comment A+B
Revenues and Interest Income 3,485 5,659 (.432) Interest on $6 Cash (7.2%) 9,144
Cost of Sales 1,799 4,221 50 Depreciation Increase (15 year life) 6,070
Selling, General and Administrative Expense 998 918 (19) Eliminate Prior Goodwill Amortization (40 years); No New Goodwill Amortization
1,897
Interest Expense 40 93 4,508 Debt Revaluation (25 years); Interest on $4,841 debt (10.5%) 645
Income Before Taxes 648 427 532
Income Taxes 281 177 (198) Income Taxes 187
NET INCOME 367 250 345
E.P.S. 2.97 3.37 Pro Forma E.P.S. 2.78
Dividends per Share 1.13 1.16 Pro Forma Dividends per Share 1.13
Shares Outstanding 124 74 Pro Forma Shares Outstanding 124
Market Assumptions
Stock Price per Share 62.00 58.00 Pro Forma Stock Price per Share 62.00
P/E Ratio (x) 21.0 17.0 Pro Forma P/E Ratio (x) 22.3x
Total Market Value 4,588 4,300 Pro Forma Total Market Value 4,588
Dividend Yield (%) 1.8 2.0 Pro Forma Dividend Yield (%) 1.8
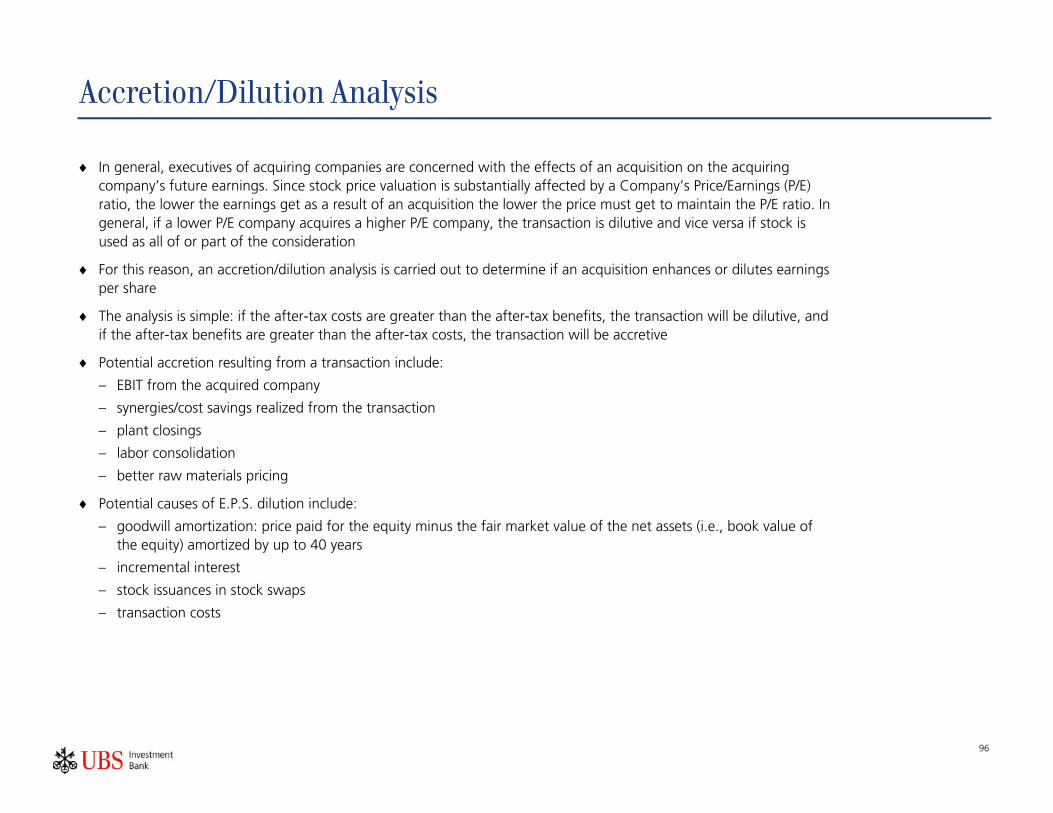
[Jacqueline M. Dinella] [printed: October 30, 2008 9:22 PM] [saved: October 27, 2008 2:59 PM] S:\Global Sourcing\Fall2008-Spring2009\MBA\IBD\Recruiting Guide\UBS MBA Recruiting GuideFINAL 10_27_08.doc
96
Accretion/Dilution Analysis
♦ In general, executives of acquiring companies are concerned with the effects of an acquisition on the acquiring company’s future earnings. Since stock price valuation is substantially affected by a Company’s Price/Earnings (P/E) ratio, the lower the earnings get as a result of an acquisition the lower the price must get to maintain the P/E ratio. In general, if a lower P/E company acquires a higher P/E company, the transaction is dilutive and vice versa if stock is used as all of or part of the consideration
♦ For this reason, an accretion/dilution analysis is carried out to determine if an acquisition enhances or dilutes earnings per share
♦ The analysis is simple: if the after-tax costs are greater than the after-tax benefits, the transaction will be dilutive, and if the after-tax benefits are greater than the after-tax costs, the transaction will be accretive
♦ Potential accretion resulting from a transaction include:
– EBIT from the acquired company
– synergies/cost savings realized from the transaction
– plant closings
– labor consolidation
– better raw materials pricing
♦ Potential causes of E.P.S. dilution include:
– goodwill amortization: price paid for the equity minus the fair market value of the net assets (i.e., book value of the equity) amortized by up to 40 years
– incremental interest
– stock issuances in stock swaps
– transaction costs

[Jacqueline M. Dinella] [printed: October 30, 2008 9:22 PM] [saved: October 27, 2008 2:59 PM] S:\Global Sourcing\Fall2008-Spring2009\MBA\IBD\Recruiting Guide\UBS MBA Recruiting GuideFINAL 10_27_08.doc
97
Accretion/Dilution Analysis
Accretion/Dilution Example
♦ Assumptions:
– Company A acquires Company B for $100 cash
– book basis is $60
– goodwill created is $40, no amortization
– 100% financed with debt at 10% interest rate
Income Statements
Prior to Merger Merged
A B A+B
Sales ($) 300 120 420
Cost of Goods Sold 100 50 150
Selling, General and Administrative Expense
100 40 140
Interest Expense 20 14 44 1
Goodwill Amortization 0 0 0
Income Before Taxes 80 16 86
Income Taxes 40 8 43
NET INCOME ($) 40 8 43
E.P.S. ($) 1.00 1.00 1.075
Accretion/(Dilution) (%) (7.5)
Note: 1 Equals $20 + $14 + incremental interest expense of $10 (100 * 10%)
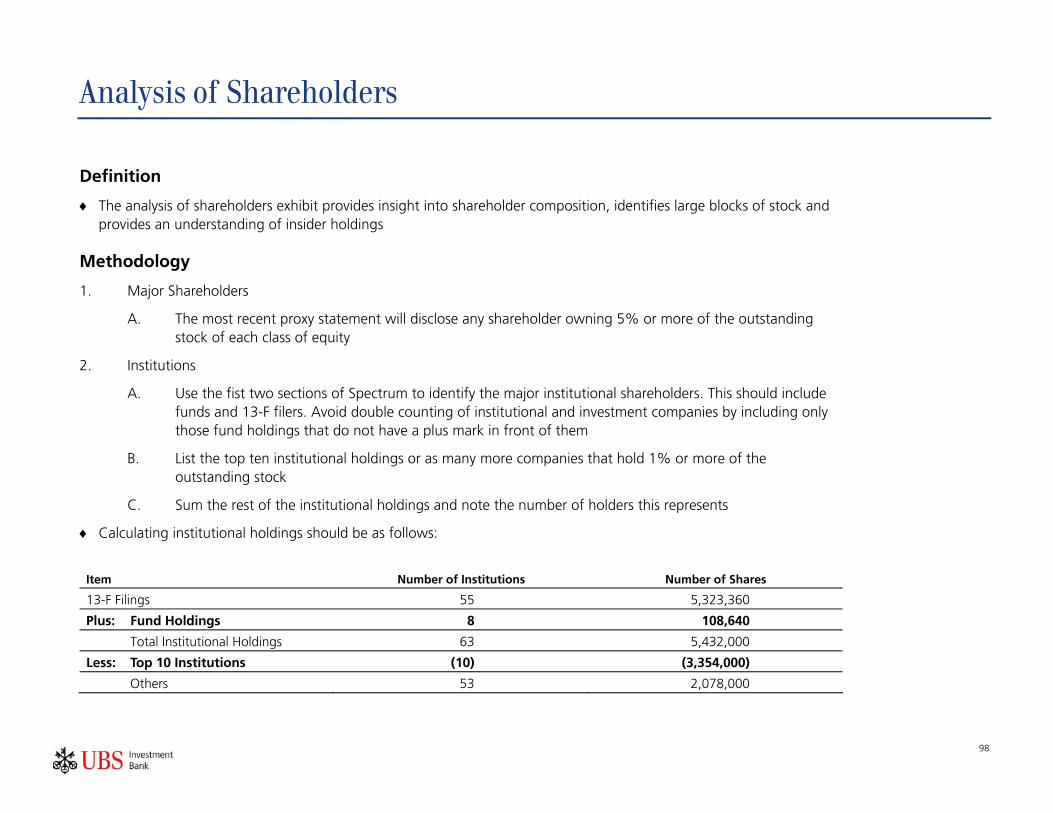
[Jacqueline M. Dinella] [printed: October 30, 2008 9:22 PM] [saved: October 27, 2008 2:59 PM] S:\Global Sourcing\Fall2008-Spring2009\MBA\IBD\Recruiting Guide\UBS MBA Recruiting GuideFINAL 10_27_08.doc
98
Analysis of Shareholders
Definition
♦ The analysis of shareholders exhibit provides insight into shareholder composition, identifies large blocks of stock and provides an understanding of insider holdings
Methodology
1. Major Shareholders
A. The most recent proxy statement will disclose any shareholder owning 5% or more of the outstanding stock of each class of equity
2. Institutions
A. Use the fist two sections of Spectrum to identify the major institutional shareholders. This should include funds and 13-F filers. Avoid double counting of institutional and investment companies by including only those fund holdings that do not have a plus mark in front of them
B. List the top ten institutional holdings or as many more companies that hold 1% or more of the outstanding stock
C. Sum the rest of the institutional holdings and note the number of holders this represents
♦ Calculating institutional holdings should be as follows:
Item Number of Institutions Number of Shares
13-F Filings 55 5,323,360
Plus: Fund Holdings 8 108,640
Total Institutional Holdings 63 5,432,000
Less: Top 10 Institutions (10) (3,354,000)
Others 53 2,078,000

[Jacqueline M. Dinella] [printed: October 30, 2008 9:22 PM] [saved: October 27, 2008 2:59 PM] S:\Global Sourcing\Fall2008-Spring2009\MBA\IBD\Recruiting Guide\UBS MBA Recruiting GuideFINAL 10_27_08.doc
99
Analysis of Shareholders
3 Insiders (Directors, Officers, Management)
A. Use the proxy statement to identify the insider and beneficial shareholdings
4 Total Nonpublic Holdings
A. Sum institution and insider holdings
5 Total Public Holdings
A. Plug for the difference between “Total Nonpublic Holdings” and “Total Shares Outstanding”
6 Footnotes
A. (1) and (2) are standard
B. The holdings of each director or officer should be footnoted as per the proxy
Analysis of Shareholdings
Amount %
Institutions 1 5,323,360 35.8
Other Institutions (total of) 108,640 0.7
Total Institutional Holdings 5,432,000 36.5
Insiders 2 1,102,052 7.4
Other Insiders (total of) 826,125 5.6
Total Insider Holdings 1,928,177 13.0
Total Nonpublic Holdings 7,360,177 49.5
Total Public Holdings 7,503,216 50.5
TOTAL SHARES OUTSTANDING 3 14,863,393 100.0
Notes: 1 Based on the latest 13-F filings of investment companies and institutions 2 Based on proxy statement dated _______ 3 Outstanding as of Form 10-Q dated _______