ubs emerging companies conference april 2013 for personal use only sai global … · 2013-04-10 ·...
TRANSCRIPT

1
SAI Global Limited ABN: 67 050 611 642
SAI Global Limited ASX Code: SAI
UBS Emerging Companies Conference April 2013
For
per
sona
l use
onl
y

2
Disclaimer This document has been prepared by SAI Global Limited (SAI) and comprises written materials/slides for a presentation concerning SAI. This presentation is for information purposes only and does not constitute or form part of any offer to acquire, sell or otherwise dispose of, or issue, or any solicitation of any offer to sell or otherwise dispose of, purchase or subscribe for, any securities, nor does it constitute investment advice, nor shall it or any part of it nor the fact of its distribution form the basis of, or be relied on in connection with, any contract or investment decision. Certain statements in this presentation are forward looking statements which can be identified by the use of words such as “anticipate”, “estimate”, “expect”, “project”, “intend”, “plan”, “believe”, “target”, “may”, “assume”, and words of a similar nature. These forward looking statements are based on expectations and beliefs current as of the date of this presentation, being 11 April 2013, and, by their nature, are subject to a number of known and unknown risks and uncertainties that could cause the actual results, performance and achievement to differ materially from any expected future results, performance or achievement expressed or implied by such forward looking statements. No representation, warranty or assurance (expressed or implied) is given or made by SAI that the forward looking statements contained in this presentation are accurate, complete, reliable or adequate or that they will be achieved or prove to be correct. Except for any statutory liability which cannot be excluded, SAI and its representative officers, employees and advisors expressly disclaim any responsibility for the accuracy or completeness of the forward looking statements and exclude all liability whatsoever (including negligence) for any direct or indirect loss or damage which may be suffered by any person as a consequence of any information in this presentation or any error or omission therefrom. Subject to any continuing obligation under applicable law or any relevant listing rules of the ASX, SAI disclaims any obligation or undertaking to disseminate any updates or revisions to any forward looking statements in these materials to reflect any change in expectations in relation to any forward looking statements or any change in events, conditions or circumstances on which any statement is based. Nothing in these materials shall under any circumstances create an implication that there has been no change in the affairs of SAI since the date of this presentation.
For
per
sona
l use
onl
y

3
FY12 1H13 • Revenue: A$452M A$238M • EBITDA: A$99M A$47M • NPAT A$45M A18M • EPS 22 cents 9 cents
Company & History SAI Today:
• Formerly a subsidiary of Standards Australia
• Listed in Dec 2003 with two businesses that had strong domestic market positions:
Business Publishing – exclusive 15+5 year publishing licence agreement (PLA) to sell Australian standards but: Low historical growth profile Need to reduce reliance on PLA
Assurance Services – strong domestic brand and franchise, but: Modest growth profile Changing industry dynamics
FY04 • Revenue: A$97M • EBITDA: A$16M • NPAT A$8.7M • EPS 8.3 cents
On Listing (Dec 2003):
• S&P ASX 200 company • Presence in 29 countries • Three global businesses: Information Services Compliance Services Assurance Services
• Market cap of circa A$700M, EV A$950M • Shareholder base: o 70% Australian institutions o 20% foreign institutions (mainly US) o 10% retail
For
per
sona
l use
onl
y

4
SAI on listing:
Business Publishing
Assurance Services
Information Services
Compliance Services
• Revenue A$29M , EBITDA A$8M • Strong domestic franchise but
reliant on single contract (PLA) • Mature market with low growth
outlook
• Revenue A$68M , EBITDA A$8M • Strong domestic franchise
underpinned by “5 ticks” StandardsMark
• Vulnerable to global competitors
• Rev A$200M, EBITDA A$50M • Two verticals: Standards,
Property
Assurance Services • Rev A$169M, EBITDA A$32M • Presence in 29 countries • Recognised global player • Established position in fast
growing food sector
• Rev A$84M, EBITDA A$28M • Leadership positions in
ethics training and awareness, and governance, risk and compliance (GRC) solutions
SAI today (FY12)
• ILI acquisition in 2006: broadened access to content, moved into workflow (database) solutions, reduced reliance on PLA
• Anstat acquisition in 2006: added a legal publishing and property information business
• Name changed to “Information Services” in 2009: reflect transition from publisher to provider of information workflow solutions
• Espreon acquired in 2010: gave property information business a national footprint, added property settlement workflow solution
• Acquired EFSIS in UK in 2006: established presence in Europe, significantly enhanced presence in food assurance
• Acquired QMI in North America in 2008: added scale and a leading brand in fragmented North American market
• Numerous small “bolt-on” acquisitions: enhanced geographic footprint, and improved capability
• Investment in technology: establish competitive advantage, drive productivity improvements
Strategic development
• Compliance Services division established to accelerate organic growth profile: “regulatory compliance services“ was a natural extension of the existing businesses
• Acquired Easy i (2005), Midi (2007) and Integrity Interactive (2011) : delivered a leadership position in on-line ethics training and awareness
• Acquired Anstat (2005), Cintellate (2009) and Compliance 360 (2012): delivering a leadership position in GRC workflow solutions
Strategic Development
For
per
sona
l use
onl
y

5
16.2 19.430.1
43.2 50.264.3
76.1
100.7 99.0
47.3
0
30
60
90
120
FY04A FY05A FY06A FY07A FY08A FY09A FY10A FY11A FY12A 1H13A
Und
erly
ing
EBIT
DA
(A$m
)
96.6 105.2159.7
212.8 243.1323.8
392.2 427.1 451.7
237.8
0
120
240
360
480
FY04A FY05A FY06A FY07A FY08A FY09A FY10A FY11A FY12A 1H13A
Rev
enue
(A
$m)
8.311.5 12.5 13.1 13.7
17.721.5 24.2 22.0
9.0
0
5
10
15
20
25
FY04A FY05A FY06A FY07A FY08A FY09A FY10A FY11A FY12A 1H13A
Und
erly
ing
EPS
(cen
ts)
Financial History
FY04A-FY12A CAGR: 21.3%
FY04A-FY12A CAGR: 25.4%
FY04A-FY12A CAGR: 13.0% For
per
sona
l use
onl
y

6
56%3%
15%
26%
55%
31%
13%
1%
Australia North America EMEA Asia
Global presence Earnings contribution – FY12 Revenue
EBITDA
Presence in 29 countries across Asia-Pacific, EMEA and North America
1,800 employees, circa 50% outside Australia
Geographic Footprint
For
per
sona
l use
onl
y

7
Information Services Compliance Services Assurance Services
Revenue contribution – FY12
EBITDA contribution – FY12
EBITDA margin - FY12
24.7%
33.1%
19.1%
EBITDA CAGR FY07 – FY12 9.6% 42.1% 20.8%
44%
19%
37%
43%
28%
29%
Financial Profile
For
per
sona
l use
onl
y

8
Information Services Content led information
management and workflow solutions including distribution of standards and legislation as well as mortgage processing services
Exclusive distribution agreement with Standards Australia and Australia’s largest mortgage settlement services business
Compliance Services
Technology led products and services for best-in-class governance, compliance and ethics training and awareness
A comprehensive suite of products and services across training and awareness, governance, risk, and compliance, hotline and incident management
Assurance Services
Product, system and
supply chain auditing, certification and registration across industries including food, health, and manufacturing
Fragmented industry with strong organic and inorganic growth opportunities
Business snapshot – three global businesses
For
per
sona
l use
onl
y

9
Information Services
Distribution of regulatory standards and legislation
Supply of information databases and workflow solutions
Property information brokerage: Land Titles Property certificates ASIC, ITSA, PPSR
Mortgage processing services: Pre-settlement Settlement Post-settlement
Compliance Services Governance, risk
management, and ethics training and awareness solutions: Advisory services
relating to compliance needs and solutions
Regulatory newsfeeds and alerts
Online compliance training and awareness
Governance, risk and compliance (GRC) platform
Whistleblower hot-line Implementation
consulting services
Assurance Services
Auditing and certification of products, processes and systems; Management systems
auditing Product certification Local and
international standards compliance certification
Supply chain management
Training and improvement services
Business snapshot – overview of operations
For
per
sona
l use
onl
y

10
Information Services Standards: One of the largest global
distributors of standards Dominant market position in
Australia High margin business with
no customer concentration
Property: Australia only business Largest provider of
information brokerage and mortgage processing services
Revenue dependent on transaction volumes, not values
Contracts with ANZ and CBA
Compliance Services Recognised global
leader in the provision of award-winning online compliance and ethics training and awareness titles
Industry leading SaaS-based GRC platform (Compliance 360)
Blue chip clients across many industries including healthcare, pharma, financial services, mining and energy
Assurance Services
Market leading position in Australia underpinned by “5 Tick” StandardsMark
Growing presence in retail agri-food (circa 25% of revenue)
High levels of recurring revenue (>90%) in the auditing business
Blue chip clients in food, auto, health, manufacturing, mining and aerospace
Business snapshot – key features
For
per
sona
l use
onl
y
11
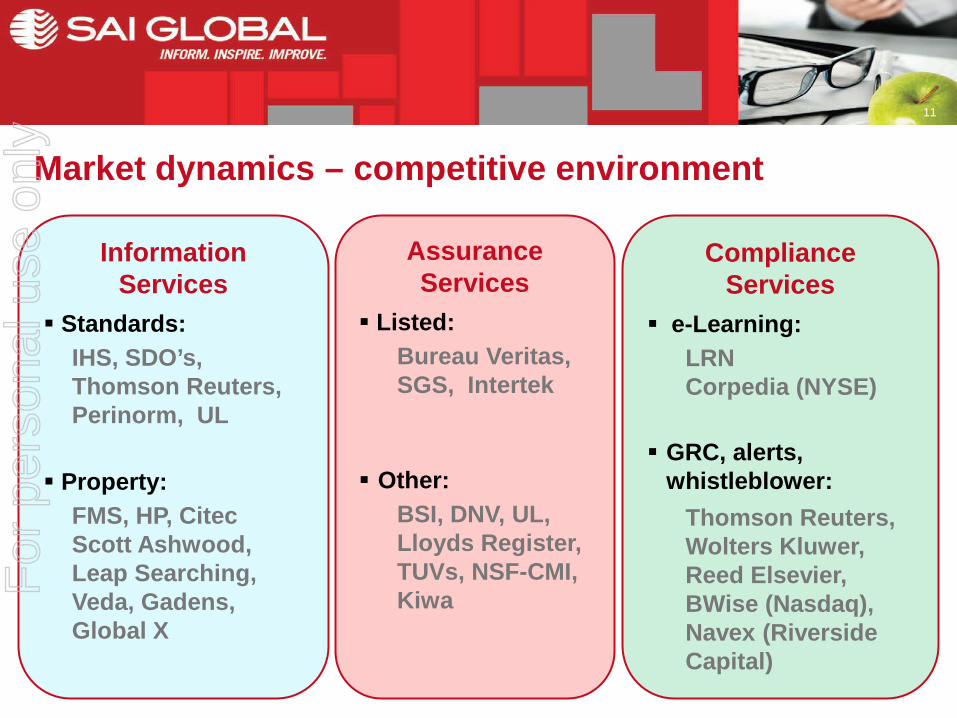
Information Services
Standards: IHS, SDO’s, Thomson Reuters, Perinorm, UL
Property: FMS, HP, Citec Scott Ashwood, Leap Searching, Veda, Gadens, Global X
Compliance Services
e-Learning: LRN Corpedia (NYSE)
GRC, alerts, whistleblower:
Thomson Reuters, Wolters Kluwer, Reed Elsevier, BWise (Nasdaq), Navex (Riverside Capital)
Assurance Services
Listed: Bureau Veritas, SGS, Intertek
Other:
BSI, DNV, UL, Lloyds Register, TUVs, NSF-CMI, Kiwa
Market dynamics – competitive environment
For
per
sona
l use
onl
y

12
Information Services
Transactional Subscription
Compliance Services
Multi-year subscription Entreprise license Fee for service (implementation and advisory services)
Assurance Services
Daily rates Annual fees Fee for service (training)
Sources of revenue
Nature of revenue streams
Annuity style
Discretionary Non-discretionary
Annuity style
Annuity style
Non-discretionary
Non-discretionary
Discretionary Discretionary
15%
83%
2%
78%
2%
20%
68%
25%
7%
Market dynamics – revenue
For
per
sona
l use
onl
y
13
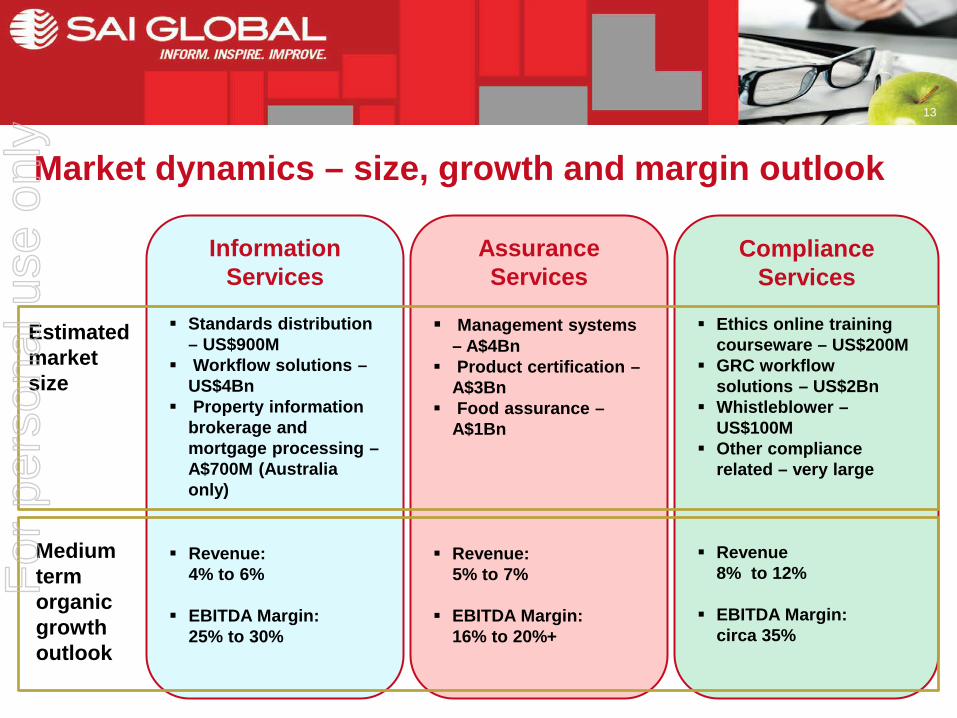
Information Services
Standards distribution
– US$900M Workflow solutions –
US$4Bn Property information
brokerage and mortgage processing – A$700M (Australia only)
Revenue: 4% to 6%
EBITDA Margin: 25% to 30%
Compliance Services
Ethics online training
courseware – US$200M GRC workflow
solutions – US$2Bn Whistleblower –
US$100M Other compliance
related – very large
Revenue 8% to 12% EBITDA Margin: circa 35%
Assurance Services
Management systems
– A$4Bn Product certification –
A$3Bn Food assurance –
A$1Bn
Revenue: 5% to 7% EBITDA Margin: 16% to 20%+
Medium term organic growth outlook
Estimated market size
Market dynamics – size, growth and margin outlook
For
per
sona
l use
onl
y

14
Experienced management team Extensive experience realising value from acquisitions Management team recently strengthened
Amongst industry leaders in chosen markets Dominant position in standards distribution in Australia The leading global provider of ethics training and awareness courseware A recognised global service provider with strong brand recognition of proprietary
certification mark in Australia, “5 Tick” StandardsMark
Defensive, recurring style revenue streams c.50% of group revenue is recurring (subscriptions and renewable contracts) c.40% of group revenue is non-discretionary products and services
Attractive EBITDA margins EBITDA margins have averaged 21.6% from FY10 to FY12
Investment highlights
For
per
sona
l use
onl
y

15
Significant growth opportunities in key sectors Strong organic growth expected from Compliance Services, particularly
governance, risk and compliance (GRC) Strong organic growth expected from food related services in the Assurance
Services business Further consolidation likely in the fragmented Compliance and Assurance
businesses Opportunities to add new verticals to the Information Services business
Attractive long-term demand drivers Increasing focus on corporate governance, regulation and compliance by all
stakeholders Continual regulation changes driving the pipeline of opportunities Industry globalisation and outsourcing complexity Demand for embeddable, lower cost, workflow solutions
Investment highlights
For
per
sona
l use
onl
y
16
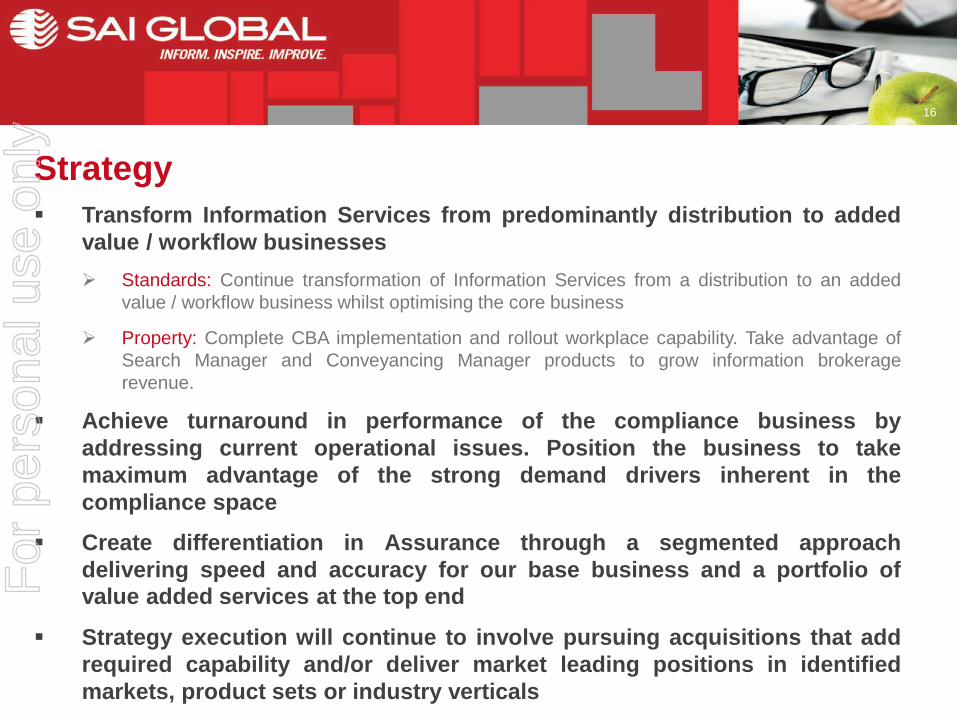
Transform Information Services from predominantly distribution to added value / workflow businesses Standards: Continue transformation of Information Services from a distribution to an added
value / workflow business whilst optimising the core business
Property: Complete CBA implementation and rollout workplace capability. Take advantage of Search Manager and Conveyancing Manager products to grow information brokerage revenue.
Achieve turnaround in performance of the compliance business by addressing current operational issues. Position the business to take maximum advantage of the strong demand drivers inherent in the compliance space
Create differentiation in Assurance through a segmented approach delivering speed and accuracy for our base business and a portfolio of value added services at the top end
Strategy execution will continue to involve pursuing acquisitions that add required capability and/or deliver market leading positions in identified markets, product sets or industry verticals
Strategy
For
per
sona
l use
onl
y

17
Global Aggregation of Technical/Reference
Content
Information Management
Services
Commercialising Content
Content Value
Simple Resell
E-Commerce Affiliates
Broadcast Platform Niche markets
Portals SaaS
Content Inside
Fit for Purpose Multiple formats
Enhance/Integrate company information
Horizon Scan Resource Intelligence Gap Analysis Compliance
Powered by
+
Content Led Information and
Workflow Solutions
Standards - Solutions to Build Value from Content
For
per
sona
l use
onl
y
18
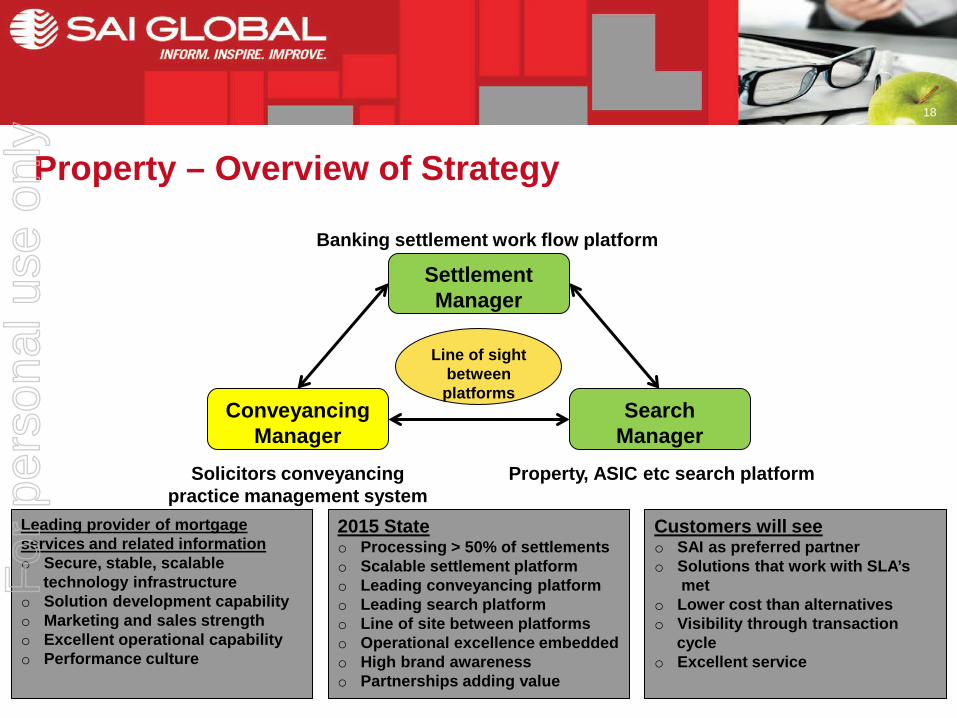
Leading provider of mortgage services and related information o Secure, stable, scalable technology infrastructure o Solution development capability o Marketing and sales strength o Excellent operational capability o Performance culture
2015 State o Processing > 50% of settlements o Scalable settlement platform o Leading conveyancing platform o Leading search platform o Line of site between platforms o Operational excellence embedded o High brand awareness o Partnerships adding value
Customers will see o SAI as preferred partner o Solutions that work with SLA’s met o Lower cost than alternatives o Visibility through transaction cycle o Excellent service
Settlement Manager
Conveyancing Manager
Search Manager
Banking settlement work flow platform
Property, ASIC etc search platform Solicitors conveyancing practice management system
Line of sight between platforms
Property – Overview of Strategy
For
per
sona
l use
onl
y
19
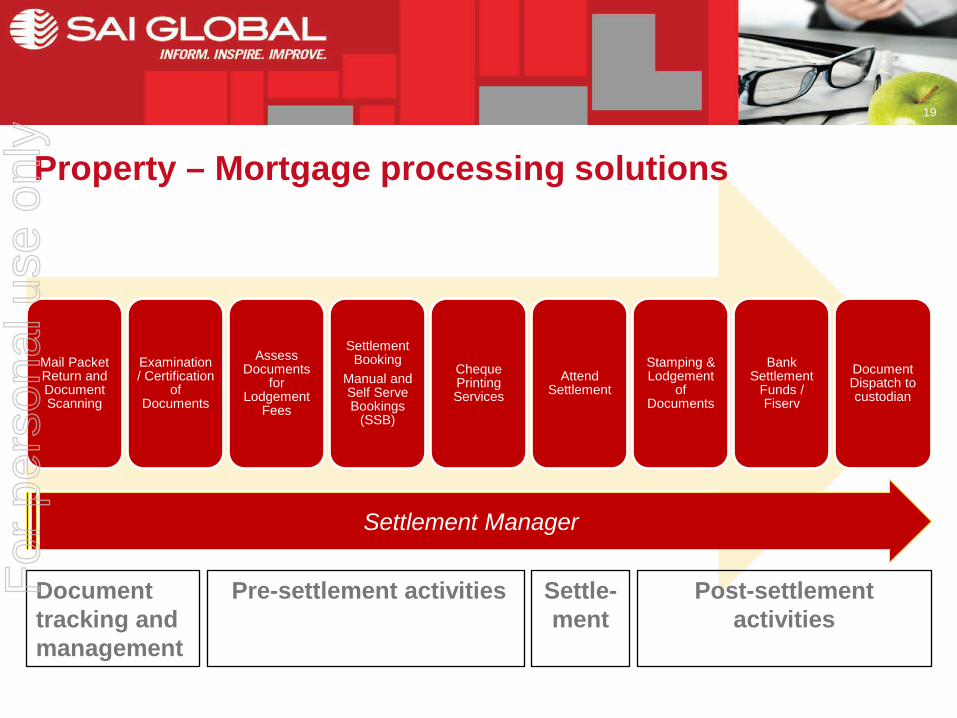
Mail Packet Return and Document Scanning
Examination / Certification
of Documents
Assess Documents
for Lodgement
Fees
Settlement Booking
Manual and Self Serve Bookings
(SSB)
Cheque Printing Services
Attend Settlement
Stamping & Lodgement
of Documents
Bank Settlement
Funds / Fiserv
Document Dispatch to custodian
Pre-settlement activities
Document tracking and management
Post-settlement activities
Settle-ment
Settlement Manager
Property – Mortgage processing solutions
For
per
sona
l use
onl
y

20
SUBJECT MATTER: Ethics and code of conduct, fraud and corruption control, EHS etc
INDUSTRY VERTICALS: Healthcare, pharmaceutical, financial services, mining and energy etc
A Global Leader o “Own” products, topics, sectors o Suite of integrated solutions o World class technologies o Product management / innovation o Excellent service delivery o Organisation strength o Financial strength
2015 State o Leader in GRC and e-learning o Leader in ethics, code and B&C o Integrated solutions through GRC o Consolidated platforms and courseware engine o Multiple delivery mechanisms o Global consistency o Excellent service capability
Customers will see o Visibility through one portal o Flexibility – online, offline, mobile o Ability to deliver key solutions o Everything just runs o Expert (sales, service, product) engagement with SAI o Service excellence
Assessments and Surveys
Case / Incident
Management
Risk Management
E-Learning - Courseware and Platform
Policy & Procedure
Management
Professional Services
Hotline / Whistleblower
Reporting & Audit
3rd Party risk - Databases & Investigations
Content Management Regs /stds
Compliance Outcomes
GRC Workflow Platform
Compliance – Overview of strategy
For
per
sona
l use
onl
y

21
SUBJECT MATTER: Quality, food, environmental, health & safety etc
INDUSTRY VERTICALS: Food, automotive, aerospace, manufacturing, mining and energy etc
Establish sustainable competitive advantage o Global capability o Services tailored by customer type o Outstanding customer service o Performance culture o Focus on growth sectors o Low cost core delivery engine
2015 State o Global service delivery platform o Latin America presence o Stronger European presence o Information delivery at top end o Fast, efficient at “small” end o SCM and analytics well developed o Everything measured / managed o Food sector developed globally
Customers will see o Larger customers – valuable information on their business & supply chain o Globally consistent approach o Small customers – fast / efficient service o Excellent service
Certification Audits
Supply chain audits
Related training
Specifier audits
Design review / factory
inspection
Testing
Supply chain management
Analytics and information
Management system certification Product certification
Audit Information Generic service Differentiated Service Technology light Technology enabled
Assurance – Overview of strategy
For
per
sona
l use
onl
y

22
June YE: A$m 1H13 FY12
Cash 42.3 43.9
Intangibles 551.4 557.5
Other assets 184.6 184.4
Total assets 778.3 785.9
Debt 251.6 254.0
Deferred revenue 65.7 70.7
Other liabilities 87.4 93.9
Total liabilities 404.6 418.6
Net assets 373.7 367.2
Net gearing1 35.9% 36.4%
Interest cover2 6.8x 6.8x
Net asset backing (c) 180.5 179.8
1 net debt / net debt + equity 2 underlying EBITDA / interest expense
Borrowing facilities: A$350M (A$98M undrawn) committed multi-currency syndicated facility with three Australian majors
17.0
15.6
48.046.3
44.6
28.044.5
0.0
10.0
20.0
30.0
40.0
50.0
60.0
70.0
80.0
90.0
100.0
Dec 14 Dec 15 Dec 16
Milli
ons
(labe
lled
curr
ency
)
AUD GBP USD
~A$74.3M ~A$86.0M ~A$91.2M
Balance Sheet
For
per
sona
l use
onl
y

23
June YE: A$m 1H13 FY12 FY11
EBITDA 47.3 95.6 95.8
Less: net interest (6.8) (13.6) (11.7)
Less: tax paid (6.0) (16.4) (15.4)
Less: capital expenditure (14.5) (31.4) (16.7)
Free cash flow 20.0 34.2 52.0
Operating cash flow 29.5 58.4 54.6
Add back tax paid 6.0 16.4 15.4
Add back net interest paid 6.8 13.6 11.7
Ungeared pre-tax operating cash flows 42.3 88.4 81.7
EBITDA 47.3 95.6 95.8
Cash conversion1 89% 92% 85%
1 ungeared pre-tax operating cash flows / EBITDA
Cash Flow
For
per
sona
l use
onl
y

24
• A stronger than normal bias to the second-half result is expected as revenues increase and costs remain relatively stable
• The second-half is expected to benefit from: An uplift in the property services business driven by the
ANZ contract and the continuing ramp up of services provided to CBA
An improved performance from the Standards business A stronger second-half from the Assurance business
• As noted in February, we will outline the go-forward plan for the development of the “next generation” Compliance platforms in May
Outlook
For
per
sona
l use
onl
y

25
• Based on trading through to the end of February, expected FY13 outcomes1 are unchanged as follows:
1. Based on assumed average second-half exchange rates of AUD: USD 1.0400; AUD:GBP 0.6500
Statutory & Underlying
EBITDA: Between A$100M and A$105M
NPAT: Between A$40.5M and A$44.0M
Outlook (continued)
For
per
sona
l use
onl
y