ubrarvcopv la-ur-03-2661 may2, 2003 final natural
TRANSCRIPT

-
-
-
UBRARVCOPV LA-UR-03-2661 May2, 2003
Final
NATURAL BACKGROUND GEOCHEMISTRY AND STATISTICAL ANALYSIS OF SEDIMENTS,
LOS ALAMOS NATIONAL LABORATORY
Eric V. McDonald1, Randall T. Ryti2
, Steven L. Reneau3, and Deb Carlson2
'4
1 Desert Research Institute, 2215 Raggio Parkway, Reno, NV 89512
2 Neptune and Company, Inc., 1505 15th St., Los Alamos, NM 87544
3 Environmental Geology and Risk Analysis Group, MS D462, Los Alamos National Laboratory, Los Alamos, NM 87545
4 Statistical and Quantitative Sciences, Pacific Northwest National Laboratory, P.O. Box 999 MSIN K5-12, Richland, W A 99352
1111111 IIIII 11111111111111111111111 13784
Canyons Sediment Background Report
NATURAL BACKGROUND GEOCHEMISTRY AND STATISTICAL ANALYSIS OF SEDIMENTS, LOS ALAMOS NATIONAL LABORATORY
Eric V. McDonald, Randall T. Ryti, Steven L. Reneau, and Deb Carlson
ABSTRACT
Natural background concentrations were determined for inorganic and radionuclide constituents of sediments as part of Environmental Restoration Project Canyons investigations at Los Alamos National Laboratory (LANL). Twenty-four sediment samples were collected from uncontaminated locations within Los Alamos, Pueblo, and Guaje Canyons. Results from these samples are compared with results of inorganic chemical concentrations from sixteen samples collected from Indio and Ancho Canyons that were analyzed as part of an earlier study of background sediment concentrations.
Sediments were sampled from two geomorphic units (channel and floodplain), each subdivided into two age units (historic and prehistoric) resulting in four different types of sampling units: (1) active stream channels, (2) active floodplains, (3) prehistoric channels, and (4) prehistoric floodplains. Active channels and floodplains are considered to be geomorphic units that have received at least some sedimentation since 1943 when LANL operations began. Prehistoric units have not received any sediment since 1943. Laboratory analysis for samples from Pueblo, Los Alamos, and Guaje Canyons consisted of (1) particle-size distribution, (2) leachable elemental concentrations from partial digestion of the sample using nitric acid (Environmental Protection Agency Method 3050A), (3) radionuclide concentrations, and (4) total organic carbon concentration. Natural background alpha, beta, and gamma radiation were measured in situ using hand-held field instruments for sediments sampled from Pueblo, Los Alamos, and Guaje Canyons. Laboratory analysis for samples from Ancho and Indio Canyons consisted of (1) leachable elemental concentrations from partial digestion of the sample using nitric acid at pH 1 and (2) total elemental concentrations obtained after complete digestion of the sample using hydrofluoric acid. Statistical analysis of inorganic and radionuclide constituents, including detection limits, number of samples above and below detection limits, and the minimum, maximum, mean, and upper tolerance limits (UTLs), are reported for background sediment samples. The spatial coverage and population size of background chemistry samples are considered adequate for defining background values for canyon sediments in most areas on the Pajarito Plateau.
LA-UR-03-2661 111 May2003

Canyons Sediment Background Report
Analytical results are compared to LANL-wide soil background concentrations and are
compared among canyons, between geomorphic units, and as a function of sediment particle
size. Statistical analysis indicates that the background sediment leachable results generally have
less variability and lower concentrations than the LANL-wide acid leachable soil background
samples. Statistical analysis indicates that differences in constituent concentrations between
canyons for nearly all measured analytes are small, which supports combining the background
samples from Ancho and Indio Canyons with the samples collected from Los Alamos, Pueblo,
and Guaje Canyons into one LANL-wide background data set. Results do imply, however, that
sediment particle size may have a potentially large influence on concentrations of inorganic
chemicals and radionuclides. Concentrations of nearly all inorganic chemicals and radionuclides
are greater in the floodplain deposits relative to the channel deposits, although the difference in
concentrations is not statistically significant for most constituents.
Particle-size distribution results indicate that floodplain deposits are mostly finer textured than
channel deposits with a higher abundance of clay and silt and a lower abundance of gravel
relative to channel deposits. Higher abundances of clay and silt are significant because these
particles generally have chemically reactive surfaces that enhance adsorption of contaminants.
These results indicate that selection and sampling of sediments should be carefully considered
and documented to ensure that major types of geomorphic units and variations in sediment
texture are clearly identified when sampling for contaminants.
LA-UR-03-2661 iv May 2003

Canyons Sediment Background Report
TABLE OF CONTENTS
INTRODUCTION ....................................................•................................................••••........•.•....• 1
SAMPLING SITES ..........................•...................................•.......................................•....•........... 3
GEOLOGIC SETTING .....•........................................................................................•..•............. 3
Bedrock Sources ......................................................................................................................... 3
Geomorphic Units ....................................................................................................................... 9
METHODS ................................................................................•..............•........................•.•....... 11
Sample Collection ..................................................................................................................... 11
Fixed-Point Alpha, Beta, and Gamma Survey .......................................................................... 12
Geochemistry Analysis - Sample Preparation and Laboratory Analytical Methods ................ 12
Geochemistry Analysis - Statistical Methods ........................................................................... 14
RESULTS AND DISCUSSION ..............................................•................•.....•........•.........•.......• 17
Particle-Size Distribution of Sediments .................................................................................... 17
Fixed-Point Alpha, Beta, and Gamma Survey .......................................................................... 24
Geochemistry Results ............................................................................................................... 26
IMPLICATIONS FOR SEDIMENT SAMPLING AND STATISTICS •.....•.....•....•.......•.....• 79
MORE RECENT BACKGROUND STUDIES ...........................•........................••...•.......•..•... 80
ACKNOWLEDGMENTS .........•.......••.....•.........•...•..................••..•......•.••............••.•..•....•.•...••••• 81
REFERENCES ........................................................................................................•..........•......•• 81
APPENDIXES
Appendix A Sediment Sample Pretreatment And Particle-Size Distribution Analysis For Canyons Background Sediments
Appendix B Summary of Analytes and Methods
Appendix C All Analytical Results
Appendix D All PSDA Results
Appendix E Probability Plots
Appendix F S-Plus Code Used to Calculate Lognormal UTLs
IA-UR-03-2661 v May2003

Canyons Sediment Background Report
FIGURES
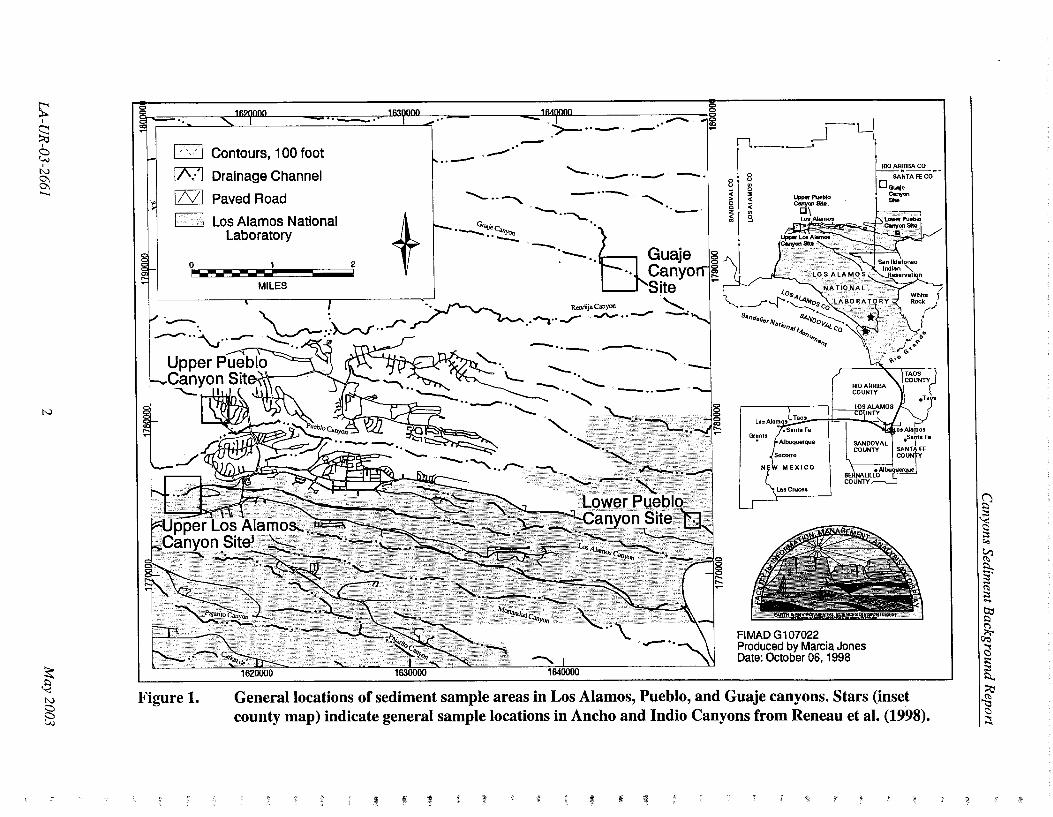
Figure 1 General locations of sediment sample areas in Los Alamos, Pueblo, and Guaje
canyons ....................................................................................................................... 2
Figure 2 Locations of the seven sample sites in upper Los Alamos Canyon ............................ 4
Figure 3 Locations of the seven sample sites in upper Pueblo Canyon .................................... 5
Figure 4 Locations of the three sample sites in lower Pueblo Canyon ..................................... 6
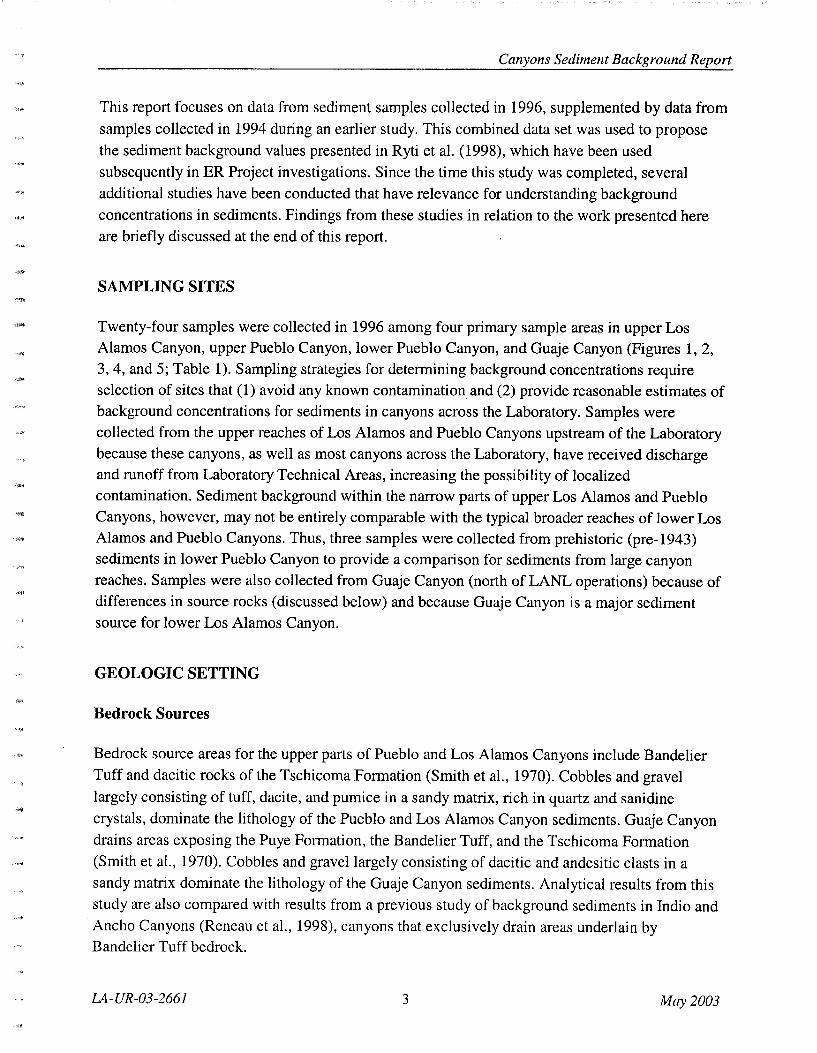
Figure 5 Locations of the seven sample sites in upper Guaje Canyon ...................................... 7
Figure 6 Schematic diagram showing the different geomorphic settings and sediment
facies sampled in this study. Note that both channel and floodplain facies may
occur below floodplains ............................................................................................ 10
Figure 7 Cumulative frequency plots for particle-size distribution for channel and
floodplain deposits .................................................................................................... 20
Figure 8 Cumulative frequency plots for particle-size distribution for the seven sediment
samples from upper Los Alamos Canyon ................................................................. 20
Figure 9 Cumulative frequency plots for particle-size distribution for the seven sediment
samples from upper Guaje Canyon ........................................................................... 21
Figure 10 Cumulative frequency plots for particle-size distribution for the seven sediment
samples from upper Pueblo Canyon ......................................................................... 21
Figure 11 Cumulative frequency plots for particle-size distribution for the three sediment
samples from lower Pueblo Canyon ......................................................................... 22
Figure 12 Cumulative frequency plots for particle-size distribution for the 10 sediment
samples from lower and upper Pueblo Canyon ........................................................ 22
Figure 13 Cross-correlation between radionuclides in the thorium decay series ...................... 35
Figure 14 Cross-correlation between radionuclides in the uranium decay series ..................... 36
Figure 15 AI, Sb, As, Ba, Be, and B by canyon source and geomorphic unit (no fines)
compared to Laboratory all-soil background ............................................................ 38
Figure 16 Cd, Ca, Cl, Cr, Co, and Cu by canyon source and geomorphic unit (no fines)
compared to Laboratory all-soil background ............................................................ 39
Figure 17 CN, Fe, Pb, Mg, Mn, and Hg by canyon source and geomorphic unit (no fines)
compared to Laboratory all-soil background ............................................................ 40
Figure 18 Ni, K, Se, Ag, Na, and S04 by canyon source and geomorphic unit (no fines)
compared to Laboratory all-soil background ............................................................ 41
LA-UR-03-2661 VI May2003
Canyons Sediment Background Report
Figure 19 Ta, Tl, Th, Th (total), Ti, and U by canyon source and geomorphic unit (no fines) compared to Laboratory all-soil background ............................................................ 42
Figure 20 U (total), V, and Zn by canyon source and geomorphic unit (no fines) compared to Laboratory all-soil background ............................................................................. 43
Figure 21 Alpha, Beta, Am-241, Cs-137, H-3, and K-40 by canyon source and geomorphic unit (no fines) compared to Laboratory all-soil background .................................... 44
Figure 22 Pu-238, Pu-239,240, Th-228, Th-230, Th-232, and U-234 by canyon source and geomorphic unit (no fines) compared to Laboratory all-soil background ................ 45
Figure 23 U-235 and U-238 by canyon source and geomorphic unit (no fines) compared to Laboratory all-soil background ................................................................................. 46
Figure 24 AI, Sb, As, Ba, Be, and B by channel, floodplain, and floodplain-fine groupings compared to Laboratory all-soil background ............................................................ 52
Figure 25 Cd, Ca, Cl, Cr, Co, and Cu by channel, floodplain, and floodplain-fine groupings compared to Laboratory all-soil background ............................................................ 53
Figure 26 CN, Fe, Pb, Mg, Mn, and Hg by channel, floodplain, and floodplain-fine groupings compared to Laboratory all-soil background ........................................... 54
- Figure 27 Ni, K, Se, Ag, Na, and S04 by channel, floodplain, and floodplain-fine groupings compared to Laboratory all-soil background ........................................... 55
Figure 28 Ta, Tl, Th, Th (total), Ti, and U by channel, floodplain, and floodplain-fine groupings compared to Laboratory all-soil background ........................................... 56
Figure 29 U (total), V, and Zn by channel, floodplain, and floodplain-fine groupings compared to Laboratory all-soil background ............................................................ 57
Figure 30 Alpha, Beta, Am-241, Cs-137, H-3, and K-40 by channel, floodplain, and floodplain-fine groupings compared to Laboratory all-soil background .................. 58
Figure 31 Pu-238, Pu-239,240, Th-228, Th-230, Th-232, and U-234 by channel, floodplain, and floodplain-fine groupings compared to Laboratory all-soil background ........... 59
Figure 32 U-235 and U-238 by channel, floodplain, and floodplain-fine groupings compared to Laboratory all-soil background ............................................................ 60
LA-UR-03-2661 Vll May 2003
TABLES
Table 1
Table 2
Table 3
Table 4
Table 5
Table 6
Table 7
Table 8
Canyons Sediment Background Report
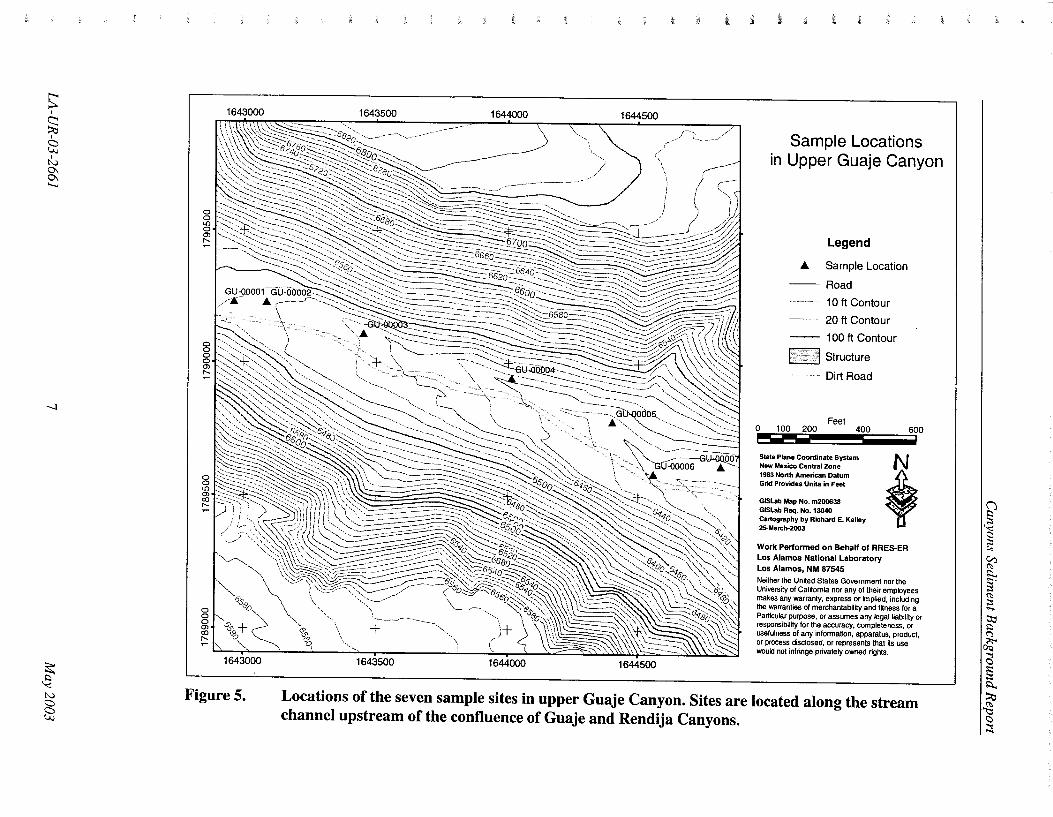
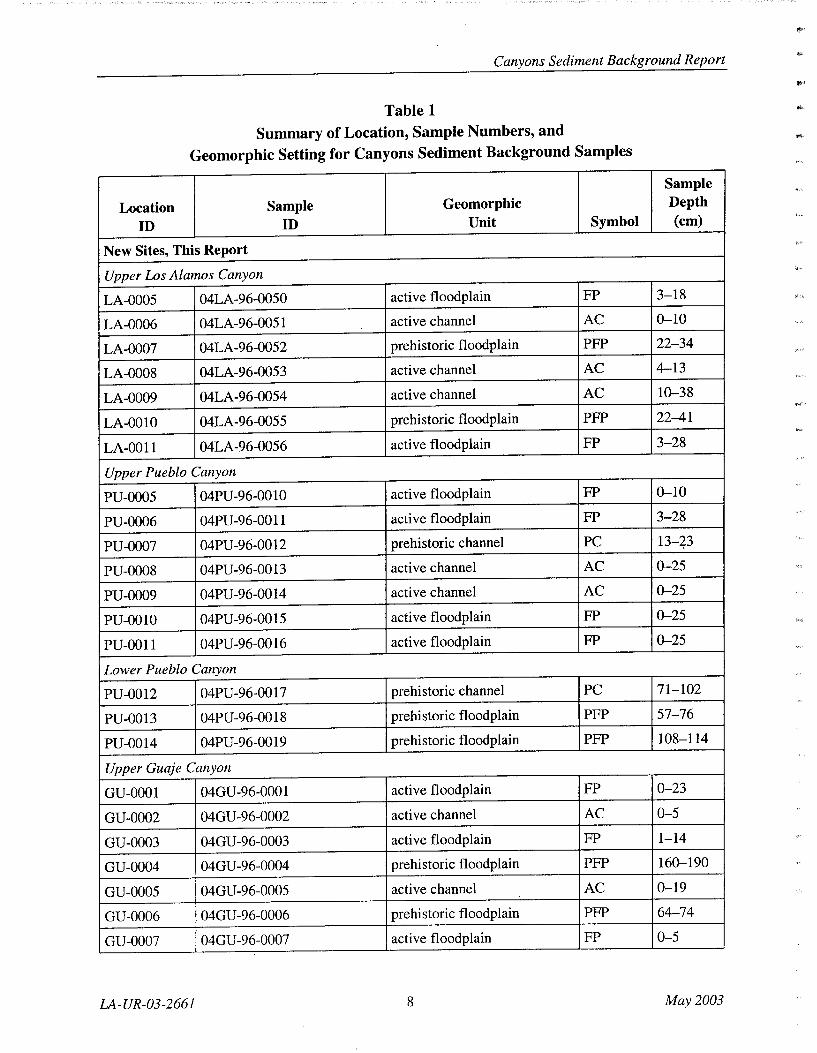
Summary of Location, Sample Numbers, and Geomorphic Setting for Canyons
Sediment Background Samples .................................................................................. 8
Summary of Particle-Size Distribution Analysis for Background Sediments .......... 18
Comparison of Particle-Size Distributions for Channel and Floodplain Sediments. 23
Summary of Results from Fixed-Point Alpha, Beta, and Gamma Survey by
Canyon and Geomorphic Unit .................................................................................. 25
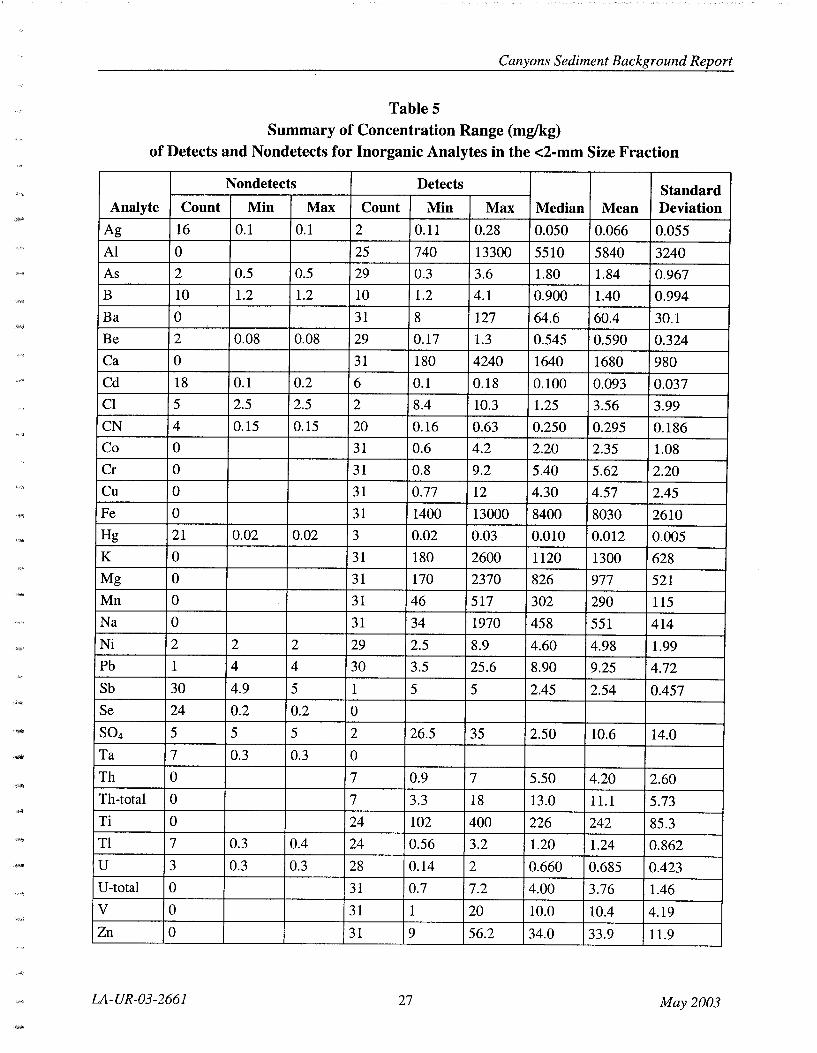
Summary of Concentration Range (mg/kg) of Detects and Nondetects for
Inorganic Analytes in the <2-mm Size Fraction ....................................................... 27
Summary of the Concentration Range (mg/kg) of Detects and Non detects for
Inorganic Analytes in the Fine Size Fraction (<0.0625 or <0.075 mm) ................... 28
Summary of Concentration Range (pCi/g) of Detects and Nondetects for
Radionuclides in the <2-mm Size Fraction ............................................................... 30
Summary of Concentration Range (pCi/g) of Detects and Nondetects for
Radionuclides in the Fine Size Fraction ( <0.0625 or <0.075 mm) ........................... 32
Table 9 Summary of Naturally Occurring Uranium and Thorium Isotopes and Daughters
Detected in Sediment Samples .................................................................................. 34
Table 10 Mean and Standard Deviations by Canyon for Inorganic and Organic Analytes ..... 47
Table 11 Mean and Standard Deviations by Canyon for Radionuclides (Excluding
Nondetects) ............................................................................................................... 48
Table 12 Summary of Statistical Distribution Shift Tests for Inorganic Analytes .................. 49
Table 13 Summary of Statistical Distribution Shift Tests for Radionuclides .......................... 50
Table 14 Comparison of Channel and Floodplain (Historic and Prehistoric) Inorganic,
Organic, and Radionuclide Analytes ........................................................................ 61
Table 15 Comparison of <2 mm and Fine Fraction (Historic and Prehistoric) Inorganic,
Organic, and Radionuclide Analytes ........................................................................ 63
Table 16 Summary of Background Values for Inorganic Anal ytes (mg/kg) ........................... 66
Table 17 Summary of Background Values for Radionuclides (pCi/ g) .................................... 67
LA-UR-03-2661 viii May 2003
...
-
Canyons Sediment Background Report
INTRODUCTION
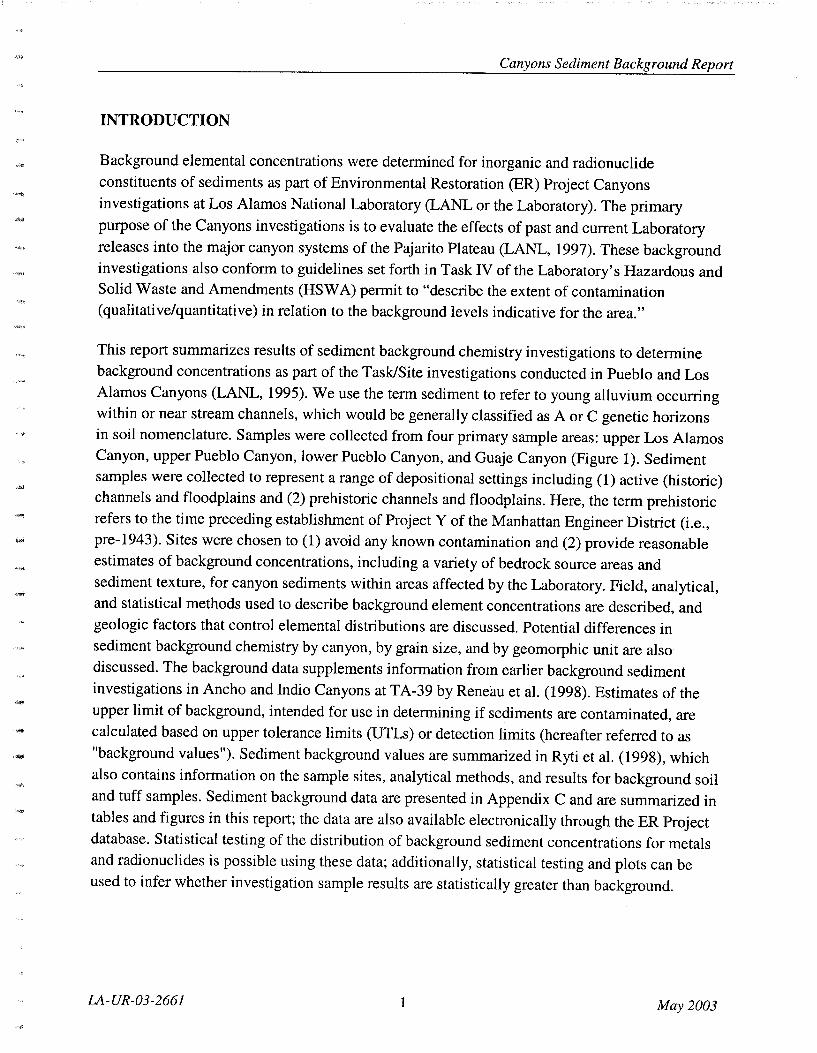
Background elemental concentrations were determined for inorganic and radionuclide constituents of sediments as part of Environmental Restoration (ER) Project Canyons investigations at Los Alamos National Laboratory (LANL or the Laboratory). The primary purpose of the Canyons investigations is to evaluate the effects of past and current Laboratory releases into the major canyon systems of the Pajarito Plateau (LANL, 1997). These background investigations also conform to guidelines set forth in Task IV of the Laboratory's Hazardous and Solid Waste and Amendments (HSWA) permit to "describe the extent of contamination (qualitative/quantitative) in relation to the background levels indicative for the area."
This report summarizes results of sediment background chemistry investigations to determine background concentrations as part of the Task/Site investigations conducted in Pueblo and Los Alamos Canyons (LANL, 1995). We use the term sediment to refer to young alluvium occurring within or near stream channels, which would be generally classified as A or C genetic horizons in soil nomenclature. Samples were collected from four primary sample areas: upper Los Alamos Canyon, upper Pueblo Canyon, lower Pueblo Canyon, and Guaje Canyon (Figure 1). Sediment samples were collected to represent a range of depositional settings including (1) active (historic) channels and floodplains and (2) prehistoric channels and floodplains. Here, the term prehistoric refers to the time preceding establishment of Project Y of the Manhattan Engineer District (i.e., pre-1943). Sites were chosen to (1) avoid any known contamination and (2) provide reasonable estimates of background concentrations, including a variety of bedrock source areas and sediment texture, for canyon sediments within areas affected by the Laboratory. Field, analytical, and statistical methods used to describe background element concentrations are described, and geologic factors that control elemental distributions are discussed. Potential differences in sediment background chemistry by canyon, by grain size, and by geomorphic unit are also discussed. The background data supplements information from earlier background sediment investigations in Ancho and Indio Canyons at TA-39 by Reneau et al. (1998). Estimates of the upper limit of background, intended for use in determining if sediments are contaminated, are calculated based on upper tolerance limits (UTLs) or detection limits (hereafter referred to as "background values"). Sediment background values are summarized in Ryti et al. (1998), which also contains information on the sample sites, analytical methods, and results for background soil and tuff samples. Sediment background data are presented in Appendix C and are summarized in tables and figures in this report; the data are also available electronically through the ER Project database. Statistical testing of the distribution of background sediment concentrations for metals and radionuclides is possible using these data; additionally, statistical testing and plots can be used to infer whether investigation sample results are statistically greater than background.
IA-UR-03-2661 1 May 2003
s: I
~ 8
I
N
& .......
N
~ N
§
8 16!f00o 163 000 ._.... • -- ~
o 162'FOO -- .. _.. ? 1".. >--··-· -· 1-~~-.. s: '
D Contours, 1 00 foot
l2S::l Drainage Channel
~ INI Paved Road
D Los Alamos National Laboratory
0 1 2
~-------- I +
MILES
---· -....... .. --.._
G~c"".Yoo ·--··-'-···-··- -· -··-~
......_··~.
----.:bGuaje · .. Canyo
Site ~ ·-- ~- ~-• • Rendija Canyoo
----··~ .. -r- -......::.: ::'>....r..f··../' .. ......., .. _,.. _.._ .. -- ·-~~ .....,.... • __.._-r- ' ---- .. ---.. ...-----.-
·"-·. .., '-- ----- ......._ .. ""' ·-.. -
"-..
[~___.J \ ~ R10 AR,!IIBA CO
I ~ D SANTAFECO--
< ~Pueblo Guoje
I :g ---·- 1 ~ ~
I
Albuquerque
MEXICO
Las Cruces ;---
FIMAD G107022 Produced by Marcia Jones Date: October 06, 1998
Figure 1. General locations of sediment sample areas in Los Alamos, Pueblo, and Guaje canyons. Stars (inset county map) indicate general sample locations in Ancho and Indio Canyons from Reneau et al. (1998).
~ f ~ ' ~ '
~ ~ ;::: .., ~ ~ §" ~ ;::: .... ~ c& ~
~ ~ .g a ::4.
"""
Canyons Sediment Background Report
This report focuses on data from sediment samples collected in 1996, supplemented by data from samples collected in 1994 during an earlier study. This combined data set was used to propose the sediment background values presented in Ryti et al. (1998), which have been used subsequently in ER Project investigations. Since the time this study was completed, several additional studies have been conducted that have relevance for understanding background concentrations in sediments. Findings from these studies in relation to the work presented here are briefly discussed at the end of this report.
SAMPLING SITES
Twenty-four samples were collected in 1996 among four primary sample areas in upper Los Alamos Canyon, upper Pueblo Canyon, lower Pueblo Canyon, and Guaje Canyon (Figures 1, 2, 3, 4, and 5; Table 1). Sampling strategies for determining background concentrations require selection of sites that (1) avoid any known contamination and (2) provide reasonable estimates of background concentrations for sediments in canyons across the Laboratory. Samples were collected from the upper reaches of Los Alamos and Pueblo Canyons upstream of the Laboratory because these canyons, as well as most canyons across the Laboratory, have received discharge and runoff from Laboratory Technical Areas, increasing the possibility of localized contamination. Sediment background within the narrow parts of upper Los Alamos and Pueblo Canyons, however, may not be entirely comparable with the typical broader reaches of lower Los Alamos and Pueblo Canyons. Thus, three samples were collected from prehistoric (pre-1943) sediments in lower Pueblo Canyon to provide a comparison for sediments from large canyon reaches. Samples were also collected from Guaje Canyon (north of LANL operations) because of differences in source rocks (discussed below) and because Guaje Canyon is a major sediment source for lower Los Alamos Canyon.
GEOLOGIC SETTING
Bedrock Sources
Bedrock source areas for the upper parts of Pueblo and Los Alamos Canyons include Bandelier Tuff and dacitic rocks of the Tschicoma Formation (Smith et al., 1970). Cobbles and gravel largely consisting of tuff, dacite, and pumice in a sandy matrix, rich in quartz and sanidine crystals, dominate the lithology of the Pueblo and Los Alamos Canyon sediments. Guaje Canyon drains areas exposing the Puye Formation, the Bandelier Tuff, and the Tschicoma Formation (Smith et al., 1970). Cobbles and gravel largely consisting of dacitic and andesitic clasts in a sandy matrix dominate the lithology of the Guaje Canyon sediments. Analytical results from this study are also compared with results from a previous study of background sediments in Indio and Ancho Canyons (Reneau et al., 1998), canyons that exclusively drain areas underlain by Bandelier Tuff bedrock.
LA-UR-03-2661 3 May 2003

~ I
§3 8
I
N
~ .......
.j::.
~ N
§ Figure 2.
Upper Los Alamos Canyon Sample Locations D Contours, 1 0 toot
INI Contours, 20 foot
1/,,/1 Roads, Dirt
INI Roads, Paved
I/ '/I Road/Trail
D Structure
m Sample Location
0 100 200 300 p-.......... I
FEET
FIMAD G107021 Produced by Marcia Jones Date: October 05, 1998
Locations of the seven sample sites in upper Los Alamos Canyon. Sites are located along the stream channel downstream of the Los Alamos Reservoir.
~ ~
+
'; ~
~ ~ 0 ;::
"" ~ >:l... §" ~ ;:: .... ~ <")
~ ~ ::::: ;:: ~:)...
~
~ 0 ::t
~

t
s: I
~ ~
I N
~ .......
Vl
$ N
§
0 0 Lll a; r--
0 0 1-..-.L----"' 0
<0 r--
Figure 3.
1617500 1618000
1617000 1617500 1618000
Sample Locations in Upper Pueblo Canyon
0
Legend
.A. Sample Location
Road
10 ft Contour
-- 20 ft Contour
-- 100ft Contour
CJ Structure
100 200 Feet
400 600 ---- ---State Plana Coordinate System New Mexico Central Zone 1983 North American Datum Grid Provides Units in Feet
GISLab Map No. m200637 GISLab Req. No. 13040
Cartography by Richard E. Kelley 25·March-2003
N
+ Work Performed on Behalf of RRE5-ER Los Alamos National Laboratory Los Alamos, NM 87545 Ne~her the Un~ed States Gowrnment nor the University of California nor any of their employees makes any warranty, express or implied, including the warranties of merchantability and fitness for a Particular purpose, or assumes any legal liability or responsibility for the accuracy, completeness, or usefulness of any information, apparatus, product, or process disclosed, or represents that its use would not infringe privately owned rights.
Locations of the seven sample sites in upper Pueblo Canyon. Sites are located along a stream channel upstream of North Road in Los Alamos.
~ ~ ;:::
"" ~ >:l... §' (1> ;::: ..... t:l;j ~ (")
~ ~ !::: ;::: >:l... ~ ~ ~ ::t

s: '
§;a @ ' N
~ .......
0\
~ '< N
§
'
Figure 4.
]!j4!!~!!(} / ' - . Jti4q!)l_ll! l~I(X! \ ' \ ;, 0::0::::::: 1~0
<>. PU_;9Q__ 1 3 sa;;:"ri'L!-0014
'~;~\-·· \, "''
Lower Pueblo Canyon Sample Locations INI Contours, 10 foot
D Contours, 2 foot
[/,v/1 Roads, Dirt
INI Roads, Paved
~ Roadffrail
W Sample Location
0 100 200 300 ,.._._. ____ _ FEET
FIMAD G107020 Produced by Marcia Jones Date: October 05, 1998
Locations of the three sample sites in lower Pueblo Canyon. Sites are located upstream of the highway maintenance station on state road 502.
~
+ ~ ~ ;:: "' ~ ~ §" ~ ;:: ......
~ ~ ~ :;:::
~ ~
~ 0 :::t
'\1
s;: I
~ ~
I N
& .......
-....J
: N
§
0 0 on 0 Ol ,....
0 0 0 Ol <Xl ,....
1643000
Figure 5.
i j
1643500 1644000 1644500 r--,
/ '-·-
1643500 1644000 1644500
Sample Locations in Upper Guaje Canyon
Legend
.... Sample Location
Road
10 ft Contour
20 ft Contour
-- 1 00 ft Contour
r=J Structure
Dirt Road
Feet 0 100 200 400 -----
State Plane Coordinate System New Mexico Central Zone 1983 North American Datum Grkl Provkfes Units in Feet
GISLab Map No. m200638 GISLab Req. No. 13040 Cartography by Richard E. Kelley 25-March-2003
600
+ Work Performed on Behalf of RRES.ER Los Alamos National Laboratory Los Alamos, NM 87545 Ne~her the Un~ed States Government nor the Universtty of Ca!Womia nor any of their employees makes any warranty, express or implied, including the warranties of merchantability and fttness for a Particular purpose, or assumes any legal liability or responsibility for the accuracy, completeness, or usefulness of any information, apparatus, product, or process disclosed, or represents that tts use would not infringe privately owned rights.
Locations of the seven sample sites in upper Guaje Canyon. Sites are located along the stream channel upstream of the confluence of Guaje and Rendija Canyons.
Q ~ ~
"' ~ ~ §' ~ ~ ...... b;j >::l
~ ~ :;:: ~ ~ :::tl ~ \:)
::t
Canyons Sediment Background Report
Table 1
Summary of Location, Sample Numbers, and
Geomorphic Setting for Canyons Sediment Background Samples
Location Sample Geomorphic
ID ID Unit Symbol
New Sites, This Report
Upper Los Alamos Canyon
LA-0005 04LA-96-0050 active floodplain FP
LA-0006 04LA-96-0051 active channel AC
LA-0007 04LA-96-0052 prehistoric floodplain PFP
LA-0008 04LA-96-0053 active channel AC
LA-0009 04LA-96-0054 active channel AC
LA-0010 04LA-96-0055 prehistoric floodplain PFP
LA-0011 04 LA -96-0056 active floodplain FP
Upper Pueblo Canyon
PU-0005 04PU-96-0010 active floodplain FP
PU-0006 04PU-96-0011 active floodplain FP
PU-0007 04PU-96-00 12 prehistoric channel PC
PU-0008 04PU-96-0013 active channel AC
PU-0009 04PU-96-0014 active channel AC
PU-0010 04PU-96-0015 active floodplain FP
PU-0011 04PU-96-0016 active floodplain FP
Lower Pueblo Canyon
PU-0012 04PU-96-0017 prehistoric channel PC
PU-0013 04PU-96-0018 prehistoric floodplain PFP
PU-0014 04PU-96-0019 prehistoric floodplain PFP
Upper Guaje Canyon
GU-0001 04GU-96-0001 active floodplain FP
GU-0002 04GU-96-0002 active channel AC
GU-0003 04GU-96-0003 active floodplain FP
GU-0004 04GU-96-0004 prehistoric floodplain PFP
GU-0005 04GU-96-0005 active channel AC
GU-0006 04GU-96-0006 prehistoric floodplain PFP
GU-0007 04GU-96-0007 active floodplain FP
LA-UR-03-2661 8
Sample Depth (em)
3-18
0-10
22-34
4-13
10-38
22-41
3-28
0-10
3-28
13-~3
0-25
0-25
0-25
0-25
71-102
57-76
108-114
0-23
0-5
1-14
160-190
0-19
64-74
0-5
May2003

-
Canyons Sediment Background Report
Table 1 (continued)
Sample Location Sample Geomorphic Depth
ID ID Unit Symbol (em)
Summary of Sites from Reneau et al. (1998)
Indio Canyon
FS2220-FS2223,FS2234• active floodplain FP 0--46 FS2224 active channel AC 0-15 FS2225b active channel AC 0-3 FS2226c active channel AC 0-3
Ancho
FS2227 prehistoric floodplain PFP 125-140 FS2228 prehistoric channel PC 79-94 FS2229-FS2232,FS2235a active floodplain FP 20--41
FS2233 active channel AC 0-15 • Multiple samples from same site analyzed as either sand and silt+clay size subsets or as sample duplicates. b Black (magnetite) sand sample, excluded from calculations of background values. c Clay and silt rich sediment ("mud") sampled from active channel.
Geomorphic Units
Alluvial sediments on the Pajarito Plateau vary greatly in thickness, texture, lithology, and age, resulting from the varied bedrock source areas and the complex physical processes of sediment transport and deposition. Generally, coarser textured sediments (sediments with abundant gravel and coarse sand) require greater stream power for transport and are deposited along axial channels as bedload. By comparison, fine textured sediments (sediments with abundant fine sand, silt, and clay) are commonly transported as suspended load, both within axial channels and over adjacent floodplains during floods. Because of spatial and temporal variations in stream flow frequency, flow volumes, and the migration, incision, and/or aggradation of stream channels, sediment properties can vary greatly both laterally and vertically (stratigraphically). Variations in the particle-size distribution and mineralogy of alluvium are important for understanding the geochemical concentrations of sediments, because it is likely that the transport of many contaminants is related to the transport of fine-grained particles such as silt, clay, and organic matter, which are characterized by larger surface areas and adsorption-site charge densities. To capture the major degrees of sediment variation, we sampled sediments from two main geomorphic units that can be partitioned into two general age groups (Figure 6; Table 1) and that can also have significant particle-size variations within them.
LA-UR-03-2661 9 May2003

Canyons Sediment Background Report
~ floodplain facies: poorly to well ~sorted mixture of sand, silt, and clay
prehistoric floodplain ~ channel facies:
Figure 6.
~ coarse sand and gravel
active floodplain _-:-:-:-:-:-:-:-_-:-:-:-:-:-:-::-:-_-:-_-:-:-:-:-:-:-:-:-:-:-:-:-:-:-_-_-:-:
Schematic diagram showing the different geomorphic settings and sediment
facies sampled in this study. Note that both channel and floodplain facies
may occur below floodplains.
Geomorphic Units
(1) Channel. Channels include sediments transported as either bedload or suspended load
and deposited along the main channels of ephemeral or perennial streams. Channel
sediments generally have a coarse texture, often consisting of abundant sand and gravel,
indicating deposition by high stream power associated with axial stream channels
(channel facies). Channel sediments can also be fine-textured, similar to deposits
typically found on floodplains (overbank facies).
(2) Floodplain. Floodplains include sediments deposited along vegetated benches or surfaces
adjacent to stream channels. Floodplains episodically receive sediment during periods of
high channel flow. Flood activity is infrequent enough to allow vegetation (shrubs and
grasses) to become firmly established on these surfaces. Floodplain sediments generally
have a fine texture, often consisting of abundant fine sand and silt, indicating deposition
by low stream P?Wer associated with flood water overtopping and spreading out away
from the stream channels (overbank facies). Floodplains can also locally include coarse
sediment (channel facies) deposited during large floods.
Age Units
(1) Historic Sediments. Historic sediments are sediments that have been deposited along
channels or floodplains since 1943. The 1943 time is defined here as the beginning of
LA-UR-03-2661 10 May 2003

Canyons Sediment Background Report
historic sedimentation because anthropogenic activities since 1943 have resulted in the greatest potential impact to the geochemistry of canyon sediments. Active channels (as used in this report) include both channels currently transporting sediment and channels that have been abandoned since 1943. Active floodplains are generally within about 1 m of the lowest point of the active channels, consisting of either recently flooded surfaces or surfaces abandoned since 1943. Floodplains and channels may have become inactive since 1943 resulting from channel incision and/or channel migration.
(2) Prehistoric Sediments. Prehistoric sediments were deposited before 1943. Prehistoric floodplain deposits consist of either surface deposits or deposits buried within prehistoric floodplains (Figure 6) or surfaces adjacent to floodplains and active channels that are generally >1m above the base of the active channel. These surfaces have young to mature stands of trees and in some cases have weakly developed soils at the surface. Prehistoric channel sediments are buried within prehistoric floodplains and terraces. Ideally, prehistoric sediments should have no detected results for fallout radionuclides, although it is possible that there has been some subsurface migration of these constituents. It is also possible that false detects could result from problems with instrument calibration at low concentrations.
Using the geomorphic and age criteria listed above, four main units are discussed in the following text: active channel, active floodplain, prehistoric channel, and prehistoric floodplain. For statistical comparisons, historic and prehistoric age units are combined and all channel sediments (i.e., active and prehistoric; Figure 6, Table 1) are compared with all floodplain sediments. For the purpose of determining natural background levels of inorganic chemicals and radionuclides, we consider the geomorphic context to be of particular concern. Further comparisons between only floodplains and channel deposits were evaluated to simplify statistical analysis. The relative age of the deposits may be important when examining particle-size relations because some prehistoric deposits may represent stream conditions (i.e., large flood events) that have not occurred during historic time.
METHODS
Sample Collection
Representative bulk samples were collected at each sample site and packed into 1-gallon high density polyethylene (HDPE) plastic bottles or three 1-liter HDPE plastic bottles. Vegetation and debris were removed from each surface before sampling. Sample depth, thickness, and height relative to base of adjacent active channels were recorded.
LA-UR-03-2661 11 May 2003
Canyons Sediment Background Report
Fixed-Point Alpha, Beta, and Gamma Survey
In situ measurements of alpha, beta, and gamma radiation were taken at each sample location
using:
(1) Alpha radiation. A Ludlum Model43-1 detector (zinc sulfide scintillation probe) with a
Ludlum Model2221 scaler/ratemeter.
(2) Beta radiation. A Ludlum Model 44-116 detector (plastic scintillation probe) with a
Ludlum Model2221 scaler/ratemeter.
(3) Gamma radiation. A Ludlum Model44-10 detector (sodium iodide scintillation probe)
encased in a lead- and copper-lined polyethylene shield, with a Ludlum Model2221
scaler/ratemeter.
The survey was conducted by placing the probe face on the soil surface (horizontal for surface
measurements, vertical for depth measurements) and collecting 5-min timed measurements
(counts per 5 min). Before and after each day's use, each instrument's response was checked by
collecting a 1-minute measurement of a 232Th source (for alpha radiation response) and a 137Cs
source (for beta and gamma radiation response) of known activity and compared to the
acceptable range (average± 20% ). At the same time, each instrument was used to collect five
1-minute measurements of local background radiation, the average of which was compared to an
acceptable range (average± 3 sigma). These measurements were taken each day at the same
place in an area that was not likely to have been radioactively contaminated by Laboratory
activities. During these measurements, source-to-detector geometry was kept as consistent as
possible. Scaler/ratemeter battery voltage, operating high voltage, threshold setting, and window
configuration were also checked twice daily.
Geochemistry Analysis - Sample Preparation and Laboratory Analytical Methods
Standard Environmental Protection Agency (EPA) analytical methods were used to measure
concentrations of inorganic chemicals. Radionuclide concentrations were determined by methods
required by the Laboratory's analytical services contract. Modified ASTM (American Society for
Testing and Materials) methods were used to determine the particle-size distribution of sediment
background samples. Use of these methods ensures comparability of these background sample
data to data from samples collected in Laboratory Resource Conservation and Recovery Act
(RCRA) investigations.
Sample pretreatment. Laboratory pretreatment procedures were designed to ensure that each
sample analyzed by the laboratory was representative of the sediment stratum that was collected
in the field, and that the pretreatment was consistent for the inorganic chemical and radionuclide
LA-UR-03-2661 12 May2003

-
-
Canyons Sediment Background Report
analytical suites. All samples were air-dried then sieved through a No. 10 mesh sieve to remove the >2-mm size fraction (gravel). A 50-g subsample was split from the sample for tritium analysis before drying and sieving of the sample. Percent weight of gravel was determined for each sample. All samples were split into representative aliquots for additional geochemical and particle-size analysis. The pretreatment procedure is described in detail in Appendix A.
Laboratory analytical methods. Two sets of samples underwent analysis for inorganic chemicals, radionuclides, and total organic carbon (TOC): (1) the <2-mm size fraction for all 24 sediment samples and (2) the <0.0625-mm size fraction (silt and clay) for a subset of samples. The complete analyte lists, sample preparation and analytical methods are provided in Appendix B. To ensure comparability with other ER Project sample results, all inorganic chemical analyses were performed according to EPA SW-846 methods (EPA, 1986). General procedures for the three geochemical suites are as follows:
(1) Inorganic chemicals were extracted with nitric acid (at pH 1) according to EPA method SW -3050 or equivalent. Metal concentrations in these extracts were analyzed by inductively coupled plasma emission spectroscopy {ICPES) according to EPA method SW-6010. Antimony, aluminum, barium, beryllium, calcium, cadmium, chromium, cobalt, iron, magnesium, manganese, nickel, potassium, sodium, silver, titanium, and vanadium were analyzed by ICPES with radial viewing; arsenic, lead, selenium, and thallium were analyzed by ICPES with axial viewing. Mercury was measured by cold vapor atomic absorption spectroscopy according to EPA method SW-7471. Cyanide was measured colorimetrically according to EPA method SW-7471. All results were reported on a dry weight basis.
(2) Radionuclides were analyzed using methods approved by LANL. Gamma-emitting radionuclides (see analyte list in Appendix B) were measured by gamma spectroscopy on dried and milled samples, with no further sample extraction. Americium-241, the plutonium isotopes 238Pu and 239
'240Pu (unresolved isotopes), and the thorium isotopes
228Th, 230Th, and 232Th were measured by alpha spectrometry following complete fusion of the sediment sample. The uranium isotopes 234U, 235U, and 238U were measured by inductively coupled plasma mass spectrometry (ICPMS) following complete digestion of the sample. For analysis of 234U, the sample extract was preconcentrated on a flow injection analyzer. Tritium in the water fraction distilled from each sediment sample was measured by liquid scintillation counting. The gravimetric moisture content of each sample was also determined, and all tritium results were converted to units of pCi/g of dry sediment. Strontium-90 was measured in complete sample digests by counting the beta particle emission of the 90Y decay product in a gas proportional counter. Gross-alpha and gross-beta radiation were measured by gas proportional counting.
LA-UR-03-2661 13 May2003
(3)
Canyons Sediment Background Report
Total Organic Carbon (TOC). The concentration of TOC was determined by the loss on
ignition method.
Particle-size distribution analysis (PSDA). The texture of the <2-mm size fraction all sediment
samples was determined using LANL-specified modifications to general procedures in ASTM D
422 (1990). Specific requirements for PSDA employing dry-sieve and hydrometer methods are
described in Appendix A; complete results of PSDA are reported in Appendix D.
Geochemistry Analysis - Statistical Methods
Statistical analysis of the background data consists of the following three steps:
(1) Prepare data for analysis.
(2) Evaluate data heterogeneity:
(a) Determine if previously collected sediment data (from Indio and Ancho Canyons;
Reneau et al., 1998) can be combined with the new data (from Los Alamos,
Pueblo and Guaje Canyons) to establish one set of new LANL sediment
background data applicable to all canyons.
(b) Compare data from channel and floodplain geomorphic units to determine if there
are significant differences and whether sediment background data should be
divided into subsets by geomorphic unit.
(c) Compare data from fine fractions and total grain size analyses to determine if
there are significant differences and whether sediment background data should be
divided into subsets by grain size.
(3) Calculate sediment background values.
Prepare data for analysis. Chemical and radionuclide analytical methods used on sediment
background samples were compared to those typically used and/or required to be used in the ER
Project. The detection frequency of each reported chemical and radionuclide was summarized.
The list of detected chemicals and radionuclides was reviewed to ensure that background data
would be useful (or help establish a contaminant release from Laboratory operations).
Some of the geochemical results data are reported as less than the inorganic chemical detection
level ( <DL) or less than the radionuclide minimum detectable activity ( <MDA). To facilitate
statistical analysis of these data, all values reported as <DL or <MDA were replaced by one-half
of the detection limit. This replacement approach is recommended in the EPA risk assessment
LA-UR-03-2661 14 May 2003

-
Canyons Sediment Background Report
guidance (EPA, 1992). In addition, most infrequently detected analytes are excluded from further statistical analyses.
Evaluate data heterogeneity. Both graphical and quantitative lines of evidence were used to help determine if these background data represent a single population or should be viewed as distinct subpopulations. Box plots were used as the main graphical data display to evaluate potential differences between canyons, geomorphic units, and sample grain size. Statistical tests and summary statistics were used as quantitative lines of evidence to support the visual impression provided by the box plots.
Box plots of all inorganic chemicals and detected radionuclides are used to compare (1) background data among canyon source, geomorphic unit, and grain size and (2) background elemental concentrations for Los Alamos, Pueblo, Guaje, Indio, and Ancho Canyons sediment data to LANL soil background data (using the combined data set from all soil horizons; Longmire et al., 1995). In the box plots, actual detected values (as filled circles) are shown for each data source. Values reported as less than the detection limits are shown as open circles. The ends of the box represent the "inter-quartile" range of the data distribution. The inter-quartile range is specified by the 25th percentile and 75th percentile of the data distribution. The line within the box plot is the median (50th percentile) of the data distribution. Thus, the box indicates concentration values for the central half of the data, and concentration shifts can be assessed by comparing the boxes. If the majority of the data is represented by a single concentration value (usually the DL), the box is reduced to a single line.
Background sediment data for Los Alamos, Pueblo, Guaje, Indio, and Ancho canyons were statistically compared by the Wilcoxon rank sum (WRS) test or the Kruskal-Wallis (K-W) test. The K-W test is applied where we are testing to see if there are differences between three or more data groups. The basic methods of both the K-W and the WRS tests involve computing differences between ranked groups of data. The WRS test is one of the "distribution shift" methods discussed in the LANL ER Project Policy Paper on background comparisons (Ryti et al., 1996). The WRS test was also used to determine if there are significant chemical differences between geomorphic units (floodplain versus channel) and grain sizes ( <2-mm size fraction versus fine size fraction background data. (Note: the fine size fraction was <0.075 mm for the Indio Canyon and Ancho Canyon samples.)
Calculation of sediment background values. In preparation for calculating UTL values, data were first inspected for suspect values that are exceptionally high or low relative to the rest of the data. Next, the background data were evaluated to determine if they are derived from a single statistical population, which involves fitting the data to a standard statistical distribution (e.g., normal or lognormal).
LA-UR-03-2661 15 May2003

Canyons Sediment Background Report
The UTL values were calculated for all inorganic chemicals and radionuclides with detection
frequencies of at least 50%. The background value for less frequently detected analytes was
based on the expected analytical laboratory detection limit. The UTL values were calculated in
three ways, depending on whether the analyte fit a normal, square-root normal, or lognormal
statistical distribution. Additional information on data transformations used for statistical
distribution analysis are contained in Box and Cox (1964) and Wolter (1985). The appropriate
statistical distribution for each analyte was selected based on reviewing probability plots
(Appendix E).
The probability plots show each background analytical result ordered from lowest to highest.
Detected values are shown as solid circles, and nondetects, plotted as one-half of the detection
limit, are shown as open circles. The x-axis is the standard normal quantile scale. The units of the
standard normal quantile are in standard deviations, where 1 represents one sigma or standard
deviation. The y-axis of the probability plot is the concentration of the inorganic chemicals (in
mg/kg). The purpose of these plots is twofold. First, they provide a succinct way to present all of
the data for each analyte. Second, they provide a way to assess the statistical distribution of each
analyte. Specifically, if the data for an analyte follow a straight line when plotted on a standard
normal scale, these data are considered to originate from a normal statistical distribution. One
can assess the fit to other statistical distributions by transforming the y-axis to another scale. For
example, chemical data are frequently derived from a lognormal distribution, and transforming
the y-axis into a logarithmic scale assesses the fit to a lognormal distribution.
For analytes that are normally distributed without any data transformation (1), we calculated
parametric tolerance limits by using the following equation:
UTL = mean + (standard deviation * ko.95,o.95 ) (1)
The k-factor depends on the number of background samples; complete tables of k-factors are
published in the RCRA groundwater statistical analysis document (EPA, 1989) and Gilbert
(1987). Example k-factors are presented in Ryti et al. (1996). For analytes that are normally
distributed after a square root transformation, the mean and standard deviation of the square root
transformed data are used in the following equation:
UTLo.9s,o.95 = (mean + [standard deviation * ko.95, o.9s]i (2)
The UTL values for lognormally distributed analytes are estimated by a first-order Monte Carlo
simulation process, which uses the lognormal distribution function in the S-plus statistical
programming language (see Appendix F for the S-plus program code). These simulations were
run for 10,000 trials, which were sufficient to estimate the lognormal UTLs to two to three
significant digits. Inputs to this function are the lognormal mean (E) and the lognormal standard
LA-UR-03-2661 16 May 2003
...

;'*'i
Canyons Sediment Background Report
deviation (V). Definitions of E and V, as well as methods for calculating these statistics are presented in Gilbert (1987, p. 164).
RESULTS AND DISCUSSION
Particle-Size Distribution of Sediments
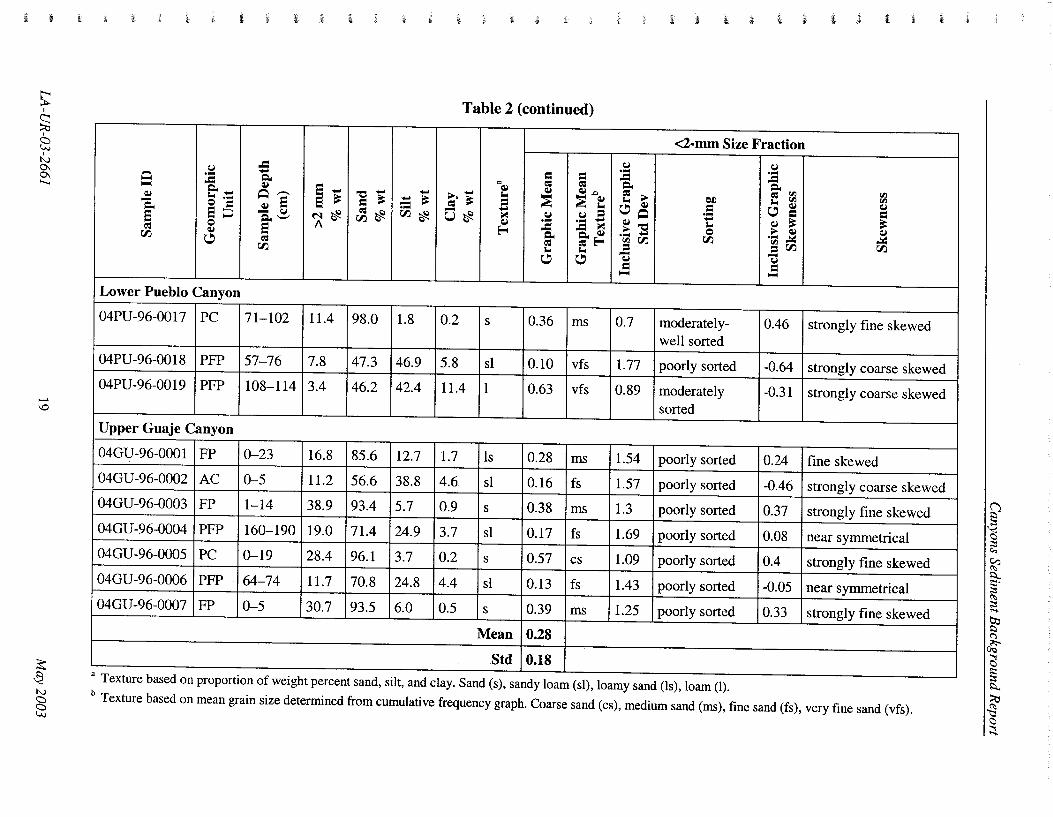
A summary of particle-size analyses is presented in Table 2, and complete results are presented in Appendix D. Particle-size distribution data are not available for the samples from Indio and Ancho Canyons. Sediments from Pueblo, Los Alamos, and Guaje Canyons are largely dominated by the sand size fraction (2 to 0.0625 mm) with sand contents ranging from 46.2% to 98.0% by weight. Graphic mean particle size (of the <2-mm fraction) is 0.22 mm, and the graphic mean texture ranges from coarse sand to very fine sand. Clay contents ( <0.002 mm) are low in all samples and range from 0.2% to 11.4% by weight. Sediment textures, based on the proportion of weight percent sand, silt, and clay, range from sand to loam. Gravel content (>2 mm) varies greatly, ranging from 3.4% to 66.3% by weight. Most of the samples are poorly sorted, indicating variable mixture of sand, silt, and clay-sized particles.
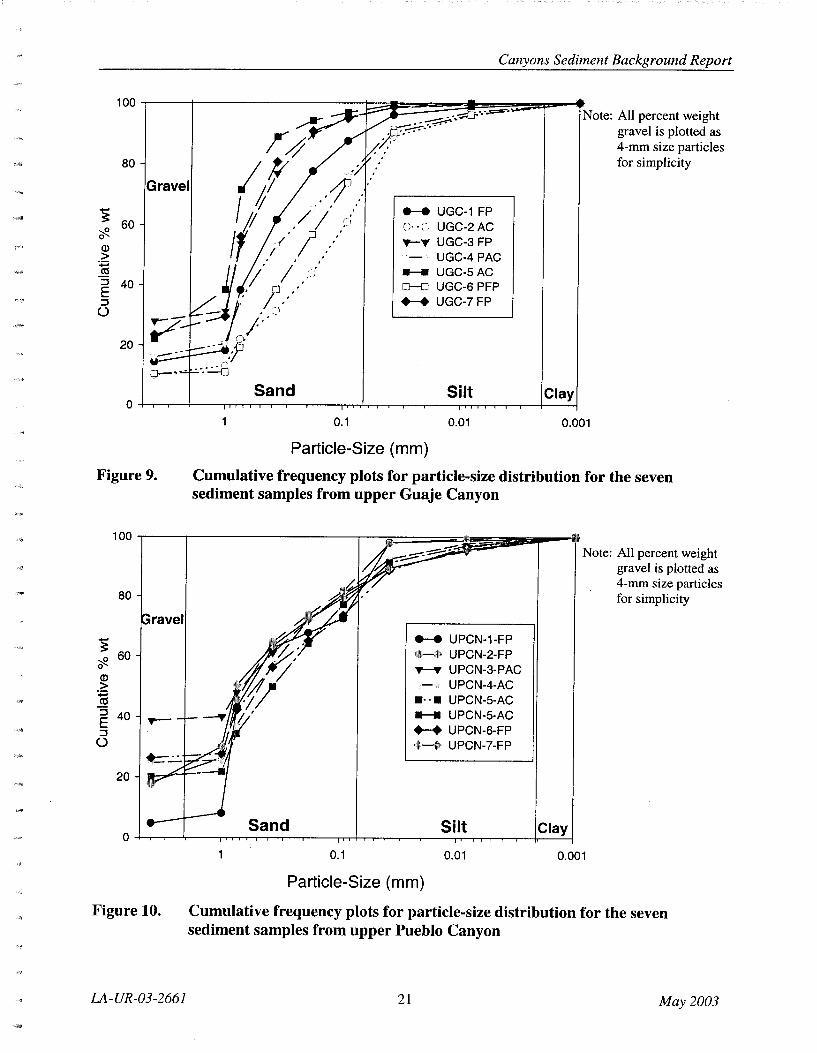
Cumulative frequency plots of the particle-size data indicate that the texture of the background sediments falls between two types of generalized deposits (Figures 7 to 12). Channel deposits (active and prehistoric) largely consist of gravel and sand, whereas floodplain deposits (active and prehistoric) have relatively higher silt and clay contents and lower gravel content (Figure 7). Mean weight values for gravel, sand, silt, and clay and graphic mean indicate that the channel sediments are primarily coarser in texture than floodplain sediments (Table 3). Graphic skewness (Table 2) also reflects this relative mixture of coarse and fine particles. Channel deposits are largely fine skewed (low percentages of silt- and clay-sized particles) whereas floodplain deposits are largely coarse skewed (high percentages of silt- and clay-sized particles).
The variations in texture primarily reflect variations in water velocity and turbulence with higher velocities and turbulence enhancing the transport and deposition of coarser sediment. As a result, sediment with high gravel and sand contents reflect high flow conditions that are characteristic of flow along active channels or along low-lying floodplains during flood events. By comparison, high silt and clay and low gravel contents reflect low flow conditions that are characteristic of low water conditions (low water levels along active channels) and slow water during floods when water overtops stream banks and flows onto adjacent floodplains. It should be noted, however, that because large temporal and spatial variations occur in stream flow, there may be many exceptions to the above relation between geomorphic setting and particle size.
LA-UR-03-2661 17 May 2003

s: '
§;;;
8 ' N 0\ 0\ .......
...... 00
~ N
§
Table 2 Summary of Particle-Size Distribution Analysis for Background Sediments
Q ..... ~ -c. e = r;.r.:,
tJ :a c._ '"' ... 0 = S;;;J 0 ~
~
t ~
Q-~ e
- tJ c. '-" e = r;.r.:,
Upper Los Alamos Canyon
04LA-96-0050 I FP 3-18
04LA-96-0051 I AC I 0-10
04LA-96-0052 I PFP I 22-34
04LA-96-0053 I AC 14-13
04LA-96-0054 I AC I 10-38
04LA-96-0055 I PFP I 22-41
04LA-96-0056 I FP I 3-28
Upper Pueblo Canyon
04PU-96-0010 I FP I 0-10
04PU-96-0011 I FP I 3-28
04PU-96-0012 I PC 113-23
04PU-96-0013 I AC I 0-25
04PU-96-0014 I AC I 0-25
04PU-96-0015 I FP I 0-25
04PU-96-0016 I FP I 0-25
" - ~ ee ~ ~~
"CC-; ~ r;.r.:,~
:::: ~ Ci)~
~-= ~ a~
.a ~
E-o
14.6 153.9 141.2 14.9 sl
66.3 I 92.8 I 5.8 I 1.4 s
6.1 167.4 127.5 15.1 sl
47.8 I 89.2 I 8.0 12.8 s
56.6 185.1 111.6 13.3 ls
9.7 180.2 117.4 12.4 lls
54.1 179.8 117.0 13.3 lls
5.0 171.1 127.5 11.4 I sl
22.3 177.7 121.6 I 0.7 lls
63.2 168.4 123.9 17.7 I sl
32.9 I 74.6 I 22.5 I 2.9 lls
25.1 171.5 124.8 13.7 lsl
35.9 164.1 131.3 14.6 lsl
21.2 175.3 119.7 15.1 lls
r
= = ~
~ tJ ... .:::: c. e ~
= = ~.0
~ ~ tJ = ... -
.:::: ~ c.~
eE--~
0.84 I vfs
0.38 1 ms
0.12 I vfs
0.28 1 ms
0.26 1 ms
0.17 I fs
0.18 I fs
0.24 I fs
0.23 I fs
0.14 I fs
0.17 I fs
0.15 I fs
0.14 I fs
0.24 I fs
<2-mm Size Fraction
tJ :a e ... ~~ ~"0 ... --~ r;.r.:, = ] .....
1.3
~ ... t: 0
r;.r.:,
poorly sorted
1.28 I poorly sorted
1.56 I poorly sorted
1.37 I poorly sorted
1.54 I poorly sorted
1.45 I poorly sorted
1.67 I poorly sorted
1. 79 I poorly sorted
1.8 I poorly sorted
1.58 I poorly sorted
1.57 I poorly sorted
1.62 I poorly sorted
1.55 I poorly sorted
1.93 I poorly sorted
tJ :a c. = (ll
'"' (ll ~ ~ ~ ~
-~ ~ =r;.r.:,
] .....
(ll (ll
~ ~ ~ r;.r.:,
-0.37 I strongly coarse skewed
0.39 I strongly fine skewed
-0.19 I coarse skewed
0.32 I strongly fine skewed
0.3 I strongly fine to fine skewed
0.18 I fine skewed
-0.03 I near symmetrical
0.46 I strongly fine skewed
0.28 I fine skewed
0.02 I near symmetrical
0.22 I fine skewed
-0.02 I near symmetrical
0.14 I fine skewed
0.28 I fine skewed
~ f
~ ~ C) ~
"' ~ §" (I) ~ .... ~ (")
~ ~ ;:::
~ :::tl .g C)
~
l
i; il
s: I
~ ~
I
N
& .......
,_. \0
~ ~ N
§
1 i 1 ; t i i: l !i
Table 2 (continued)
<2-mm Size Fraction
-= ~ ~ ~ ..... . .... - = = -= -= ~ .....
Cl.. -= "' = = Cl.. ~ Cll
.... 1:';::: ~ e - ~ ~ ~.0 = .... Cll ~- 't:l- - ..... - "" ~ e ~ = ~ .:::: ~ = ~ .a ~ ~ ~ "" ~ e.c
"" Cll Cll - 0 = ~ e = C!l ~ ~ Cl..
~~ .....
o~ ~ = ~~ = 5;;;;J - ~ ('l~ 'JJ~ ~ ~ ..... e - ~ ~ ~ Cl..._,
~ ..... ..... - ~'t:l "" = 0 e A E-o -= -= ~ 0 .... ~ ~
~ Cl.. Cl..~ ..... -'J1 ~ = e~~E-o ~'JJ 'J1 ..... ~ ~ = ~'JJ 'J1 CZl "" "" - -~ ~ ~ ~
= = .... .... Lower Pueblo Canyon
04PU-96-0017 PC 71-102 11.4 98.0 1.8 0.2 s 0.36 ms 0.7 moderately- 0.46 strongly fine skewed well sorted
04PU-96-0018 PFP 57-76 7.8 47.3 46.9 5.8 sl 0.10 vfs 1.77 poorly sorted -0.64 strongly coarse skewed 04PU-96-0019 PFP 108-114 3.4 46.2 42.4 11.4 1 0.63 vfs 0.89 moderately -0.31 strongly coarse skewed
sorted Upper Guaje Canyon
04GU-96-0001 FP 0-23 16.8 85.6 12.7 1.7 Is 0.28 ms 1.54 poorly sorted 0.24 fine skewed 04GU-96-0002 AC 0-5 11.2 56.6 38.8 4.6 sl 0.16 fs 1.57 poorly sorted -0.46 strongly coarse skewed 04GU-96-0003 FP 1-14 38.9 93.4 5.7 0.9 s 0.38 ms 1.3 poorly sorted 0.37 strongly fine skewed 04GU-96-0004 PFP 160-190 19.0 71.4 24.9 3.7 sl 0.17 fs 1.69 poorly sorted 0.08 near symmetrical 04GU-96-0005 PC 0-19 28.4 96.1 3.7 0.2 s 0.57 cs 1.09 poorly sorted 0.4 strongly fine skewed 04GU-96-0006 PFP 64-74 11.7 70.8 24.8 4.4 sl 0.13 fs 1.43 poorly sorted -0.05 near symmetrical 04GU-96-0007 FP 0-5 30.7 93.5 6.0 0.5 s 0.39 ms 1.25 poorly sorted 0.33 strongly fine skewed
Mean 0.28
Std 0.18 - -- - - - - -- -
a Texture based on proportion of weight percent sand, silt, and clay. Sand (s), sandy loam (sl), loamy sand (Is), loam (1). b Texture based on mean grain size determined from cumulative frequency graph. Coarse sand (cs), medium sand (ms), fine sand (fs), very fine sand (vfs).
~ ~ 0 ;::::
"' ~ l:l.. §" (':> ;:::: .... 2' ("")
~ ~ :0:::
~ ::0 ~ 0 ::t

Canyons Sediment Background Report
0.1 0.01 0.001
100 Notes: >#%'*~\# 1. Bar graph shows weight <,t'f<'(~~.fti"'
([;t'""' ' percent for each particle ,,,*"'
,,..;~'~'Floodplain size class. 80 2. Channel sediments
Deposit typically have a greater
1E abundance of gravel and
~ sand relative to floodplain
0 60 Gravel Sand Silt Clay Q)
deposits that have greater > :.;::; CCI :::l
E 40 :::l ()
20
0
Figure 7.
amounts of silt and clay. 3. Samples shown are
04PU-96-0017 (channel) and 04PU-96-0019 (floodplain).
4. All percent weight gravel
I is plotted as 4-mm size particles for simplicity.
0.1 0.01 0.001
Particle-Size (mm)
Cumulative frequency plots for particle-size distribution for channel and
floodplain deposits
100 r--,-------~~I=~~~~;t=:::=:;;::~r-i Note: All percent weight gravel is plotted as 4-mm size particles for simplicity
80
Gravel 1E ~ 0 60 Q) > :.;::; CCI :::l
E 40 \"""' .... :::l ()
20
Figure 8.
LA-UR-03-2661
._. ULA-1 FP 'i!c•• ULA-2 AC
-· ULA-3 PFP ULA-4 AC
~ ULA-5PC
•-• ULA-6 PFP ._. ULA-7 FP
Sand Silt
0.1 0.01 0.001
Particle-Size (mm)
Cumulative frequency plots for particle-size distribution for the seven
sediment samples from upper Los Alamos Canyon
20 May2003
~¥
"''
lfl,lj\·~
II"·
Canyons Sediment Background Report
100~--~~------------~~~~==~~~~~~-1 Note: All percent weight
80
3: 60 (ft. Q)
> ~ ::J 40 E ::J
(.)
20
Gravel
Figure9.
Sand
0.1
....... UGC-1 FP C>· UGC-2AC ..,._.,. UGC-3 FP
- UGC-4 PAC - UGC-SAC D-O UGC-6 PFP +--+ UGC-7FP
Silt
0.01
Particle-Size (mm)
Clay
0.001
gravel is plotted as 4-mrn size particles for simplicity
Cumulative frequency plots for particle-size distribution for the seven sediment samples from upper Guaje Canyon
1 oo ~---r--------------~~i======~ ~~--ar-""f Note: All percent weight
80
ravel
3: 60
~ 0
Q)
> ·--= CCI ::J 40 E ::J
(.)
20
Figure 10.
LA-UR-03-2661
Sand
0.1
....... UPCN-1-FP
.-~~ UPCN-2-FP ..,._..,. UPCN-3-PAC
- UPCN-4-AC •··• UPCN-5-AC - UPCN-5-AC +--+ UPCN-6-FP "11;·--f' UPCN-7-FP
Silt
0.01
Particle-Size (mm)
0.001
gravel is plotted as 4-mrn size particles for simplicity
Cumulative frequency plots for particle-size distribution for the seven sediment samples from upper Pueblo Canyon
21 May 2003

Canyons Sediment Background Report
100~---r----------~~~~~~----~.---~~~~r. . . ... · ·:;. _ Notes:
80
~ '(/?. 60 Q)
> -~ :::J E 40 :::J
(.)
20
ravel
Figure 11.
.. ~ :'I
,.·I .. fi 1
.. w I
•• f!!i /J -~A Sand
0.1
.... · ·/· ~ - 1. All samples are from prehistoric sediments.
/ 2. All percent weight gravel
/ is plotted as 4-mm size
. / particles for simplicity. : Jf . / __._ LPC-1 PC
.... LPC-2 PFP
--T- LPC-3 PFP
0.01 0.001
Particle-Size (mm)
Cumulative frequency plots for particle-size distribution for the three
sediment samples from lower Pueblo Canyon
100~---r--------~~==~p-~~~~~~~~~'1 Notes:
Figure 12.
IA-UR-03-2661
Clay
1. Plot shows variation between sediment texture from the narrow canyon reaches within upper Pueblo Canyon as compared to sediment texture from the broad reaches in lower Pueblo Canyon.
2. The variation in particlesize distribution in lower Pueblo Canyon sediments may be more indicative of sediments within and downstream of the Laboratory.
3. All percent weight gravel is plotted as 4-mm size particles for simplicity.
0.001
Cumulative frequency plots for particle-size distribution for the 10 sediment
samples from lower and upper Pueblo Canyon
22 May 2003

Canyons Sediment Background Report
Table 3 Comparison of Particle-Size Distributions for Channel and Floodplain Sediments
Sample >2mm Silt+ Clay Sand Silt Clay Graphic ID %wt %wt %wt %wt % wt Mean(mm)
Channel
04LA-96-0051 66.3 7.2 92.8 5.8 1.4 0.38
04LA-96-0053 47.8 10.8 89.2 8.0 2.8 0.28
04LA-96-0054 56.6 14.9 85.1 11.6 3.3 0.26
04GU-96-0002 11.2 43.4 56.6 38.8 4.6 0.16
04GU-96-0005 28.4 3.9 96.1 3.7 0.2 0.57
04PU-96-0012 63.2 31.6 68.4 23.9 7.7 0.14
04PU-96-0013 32.9 25.4 74.6 22.5 2.9 0.17
04PU-96-0014 25.1 28.5 71.5 24.8 3.7 0.15
04PU-96-0017 11.4 2.0 98.0 1.8 0.2 0.36
Mean 38.1 18.6 81.4 15.6 3.0 0.26
Std Dev 21.2 14.2 14.2 12.4 2.3 0.14
Floodplain
04LA-96-0050 14.6 46.1 53.9 41.2 4.9 0.08
04LA-96-0052 6.1 32.6 67.4 27.5 5.1 0.12
04LA -96-0055 9.7 19.8 80.2 17.4 2.4 0.17
04LA-96-0056 54.1 20.3 79.8 17.0 3.3 0.18
04GU-96-0001 16.8 14.4 85.6 12.7 1.7 0.28
04GU-96-0003 38.9 6.6 93.4 5.7 0.9 0.38
04GU-96-0004 19.0 28.6 71.4 24.9 3.7 0.17
04GU-96-0006 11.7 29.2 70.8 24.8 4.4 0.13
04GU-96-0007 30.7 6.5 93.5 6.0 0.5 0.39
04 PU -96-0010 5.0 28.9 71.1 27.5 1.4 0.24
04PU-96-0011 22.3 22.3 77.7 21.6 0.7 0.23
04PU-96-0015 35.9 35.9 64.1 31.3 4.6 0.14
04PU-96-0016 21.2 24.8 75.3 19.7 5.1 0.24
04PU-96-0018 7.8 52.7 47.3 46.9 5.8 0.10
04PU-96-0019 3.4 53.8 46.2 42.4 11.4 0.06
Mean 19.8 28.2 71.8 24.4 3.7 0.20
Std Dev 14.5 14.6 14.5 12.4 2.8 0.10
LA-UR-03-2661 23 May 2003

Canyons Sediment Background Report
Textural analysis indicates that most of the floodplain deposits and all of the channels deposits
have sand content that is higher than the total silt and clay content. The generally s'andy character
of these samples primarily reflects two conditions. First, clay and silt content is generally low in
the bedrock sources (discussed above) that these sediments are originally derived from. Second,
most of these samples are from narrow, low-lying floodplains (usually less than a meter above
the lowest point of the active channel) that characterize the narrow reaches along the upper
watershed of each canyon. Sand and gravel can be readily deposited on low-lying floodplains
during large floods when flow depths exceed floodplain heights and flood water is confined to
narrow areas by canyon walls.
Cumulative frequency plots indicate that textural variations are similar between upper Los
Alamos Canyon and Guaje Canyon sediments, showing a range of particle size distribution
between floodplain and channel deposits (Figures 8 and 9). By comparison, sediments in upper
Pueblo Canyon display little variation in particle distribution between floodplain and channel
(Figure 10). The reach sampled in upper Pueblo Canyon is a narrow reach incised into bedrock.
Floodplains are low and are probably flooded during frequent ephemeral stream events. By
comparison, sediments in lower Pueblo Canyon display considerable variation in particle
distribution between floodplain and channel (Figures 11 and 12). This variation reflects in part
the larger size of the fluvial system, with wider, more extensive channels and floodplains in
lower Pueblo Canyon relative to upper Pueblo Canyon.
Sediment in lower Pueblo Canyon is probably more indicative of the particle-size distribution
found throughout most of the larger reaches that run through the Laboratory. These results
indicate that silt and clay content will likely be higher in floodplain deposits in canyon reaches
that are within or downstream of the Laboratory relative to sediments upstream of the Laboratory
that were sampled as part of this background study. This last point is important because
statistical comparisons between floodplain and channel deposits (discussed below) indicate the
background chemistry is similar between channels and floodplains. If floodplain deposits are
largely finer grained in downstream reaches relative to the upstream reaches characterized in this
study, statistical differences between background geochemistry of floodplain and channel
deposits are possible.
Fixed-Point Alpha, Beta, and Gamma Survey
Results of in situ measurements of alpha, beta, and gamma radiation also indicate that only
minimal differences in background radiation occur among the three canyons measured (Table 4 ).
Alpha background radiation has the highest variation among canyons and may partially reflect
variations in sediment source rock type, or this variation could also reflect the high measurement
error associated with alpha particle counting.
LA-UR-03-2661 24 May 2003

Canyons Sediment Background Report
Table 4 Summary of Results from Fixed-Point Alpha, Beta,
and Gamma Survey by Canyon and Geomorphic Unit
Sample Depth Alpha Beta Gamma ID Unit (em) (cpm) (cpm) (cpm)
Counts per Minute ( cpm) by Canyon
Los Alamos
04LA-96-0050 FP 3-18 11.8 372 6305
04LA-96-0051 AC 0-10 10.6 344 6220
04 LA -96-0052 PFP 22-34 16.2 410 6945
04LA-96-0052 22.0
04LA-96-0053 AC 4-13 13.2 424 7180
04LA-96-0054 AC 10-38 6.4 414 7055
04LA-96-0055 PFP 22-41 13.4 419 6560
04LA-96-0056 FP 3-28 11.4 424 6392
Meari 13.1 401 6665
Std Dev 4.5 31 389
Pueblo
04PU-96-0010 FP 0-10 8.2 323 5440 04PU-96-0011 FP 3-28 6.0 361 5772 04PU-96-0012 PC 13-23 7.6 382 6213
04PU-96-0013 AC 0-25 9.0 355 6356
04PU-96-0014 AC 0-25 5.0 362 7389
04PU-96-0015 FP 0-25 11.0 383 6362
04PU-96-0016 FP 0-25 14.8 339 5603
04PU-96-0016 12.6
Mean 9.3 358 6162
Std Dev 3.3 22 655
Guaje
04GU-96-0001 FP 0-23 12.0 409 5730
04GU-96-0002 AC 0-5 3.6 403 5601 04GU-96-0003 FP 1-14 8.8 389 5785
04GU-96-0004 PFP 160-190 7.2 456 6852
04GU-96-0005 AC 0-19 4.2 385 5073
LA-UR-03-2661 25 May 2003

Canyons Sediment Background Report
Table 4 (continued)
Sample Depth Alpha Beta Gamma
ID Unit (em) (cpm) (cpm) (cpm)
04GU-96-0006 PFP 64-74 3.4 436 6513
04GU-96-0007 FP 0-5 8.6 457 6101
Mean 6.8 419 5951
Std Dev 3.2 30 594
Counts per Minute by Geomorphic Unit
Channel
Mean 7.5 384 6386
Std Dev 3.3 29 800
Floodplain
Mean 10.2 398 6182
Std Dev 3.6 42 483
Geochemistry Results
(1) Prepare data for analysis
One background sample was dominated by black magnetite sands, which is an unusual, naturally
occurring sediment deposit. This sample was collected from Indio Canyon (sample FS2225,
Reneau et al., 1998), and because of its unique mineralogy and chemistry, this sample has been
excluded from all statistical summaries and plots presented in this document. However, this
sample may be useful in evaluating other samples containing black sands.
A summary of the detection limits, number of samples above and below detection limits, and the
minimum, maximum, median, mean, and standard deviation of concentrations for inorganic
analytes in the <2-mm and fine size fractions are reported in Tables 5 and 6. A complete listing
of inorganic analytical results is reported in Appendix C. Two inorganic analytes (selenium and
tantalum) were not detected in any background sample, and 31 inorganic analytes were detected
in at least one sample. Concentrations below detection limits commonly occurred for antimony,
cadmium, mercury, selenium, silver, tantalum, and thallium. These analytes are excluded from
further statistical analyses.
LA-UR-03-2661 26 May 2003
Canyons Sediment Background Report
Table 5 Summary of Concentration Range (mglkg)
of Detects and Nondetects for Inorganic Analytes in the <2-mm Size Fraction
Nondetects Detects Standard Analyte Count Min Max Count Min Max Median Mean Deviation
Ag 16 0.1 0.1 2 0.11 0.28 0.050 0.066 0.055
AI 0 25 740 13300 5510 5840 3240 As 2 0.5 0.5 29 0.3 3.6 1.80 1.84 0.967
B 10 1.2 1.2 10 1.2 4.1 0.900 1.40 0.994
Ba 0 31 8 127 64.6 60.4 30.1 Be 2 0.08 0.08 29 0.17 1.3 0.545 0.590 0.324
Ca 0 31 180 4240 1640 1680 980
Cd 18 0.1 0.2 6 0.1 0.18 0.100 0.093 0.037 Cl 5 2.5 2.5 2 8.4 10.3 1.25 3.56 3.99 CN 4 0.15 0.15 20 0.16 0.63 0.250 0.295 0.186 Co 0 31 0.6 4.2 2.20 2.35 1.08 Cr 0 31 0.8 9.2 5.40 5.62 2.20 Cu 0 31 0.77 12 4.30 4.57 2.45 Fe 0 31 1400 13000 8400 8030 2610 Hg 21 0.02 0.02 3 0.02 0.03 0.010 0.012 0.005 K 0 31 180 2600 1120 1300 628 Mg 0 31 170 2370 826 977 521 Mn 0 31 46 517 302 290 115 Na 0 31 34 1970 458 551 414 Ni 2 2 2 29 2.5 8.9 4.60 4.98 1.99 Pb 1 4 4 30 3.5 25.6 8.90 9.25 4.72
Sb 30 4.9 5 1 5 5 2.45 2.54 0.457 Se 24 0.2 0.2 0
so4 5 5 5 2 26.5 35 2.50 10.6 14.0 Ta 7 0.3 0.3 0
Th 0 7 0.9 7 5.50 4.20 2.60 Th-total 0 7 3.3 18 13.0 11.1 5.73 ... Ti 0 24 102 400 226 242 85.3 Tl 7 0.3 0.4 24 0.56 3.2 1.20 1.24 0.862 - u 3 0.3 0.3 28 0.14 2 0.660 0.685 0.423 U-total 0 31 0.7 7.2 4.00 3.76 1.46 v 0 31 1 20 10.0 10.4 4.19 Zn 0 31 9 56.2 34.0 33.9 11.9
LA-UR-03-2661 27 May 2003

Canyons Sediment Background Report
Table 6
Summary of the Concentration Range (mg!kg) of Detects and
Nondetects for Inorganic Analytes in the Fine Size Fraction (<0.0625 or <0.075 mm)
Nondetects Detects Standard
Analyte Count Min Max Count Min Max Median Mean Deviation
Ag 4 0.1 0.1 0
Al 0 6 6800 13200 8870 9560 2630
As 0 7 1.1 4.2 2.5 2.56 0.947
B 1 1.2 1.2 4 1.4 3.9 2.7 2.36 1.34
Ba 0 7 90 123 115 111 12.7
Be 0 7 0.82 1.6 1 1.07 0.255
Ca 0 7 1900 5860 2500 3020 1380
Cd 3 0.1 0.2 2 0.2 0.22 0.1 0.134 0.073
Cl 0 0
CN 5 0.15 0.15 0
Co 0 7 2.6 4.8 3.4 3.59 0.790
Cr 0 7 5.8 12.6 8.8 8.43 2.48
Cu 0 7 5.8 10.1 7.3 7.63 1.39
Fe 0 7 8400 12000 9510 9850 1210
Hg 2 0.02 0.02 3 0.03 0.04 0.03 0.024 0.013
K 0 7 1270 2070 1830 1720 321
Mg 0 7 1230 2070 1500 1600 324
Mn 0 7 230 784 376 430 194
Na 0 7 76 845 307 412 290
Ni 0 7 5 11.9 7.4 7.76 2.14
Pb 0 7 7 20.4 12.6 13.9 5.19
Sb 7 4.9 5 0
Se 5 0.2 0.2 0
so4 0 0
Ta 2 0.3 0.3 0
Th 0 2 6.9 7.7 7.3 7.30 0.566
Th-total 0 2 16 17 16.5 16.5 0.707
Ti 0 5 61.5 329 203 186 115
Tl 3 0.3 0.3 4 1 2.6 1 1.05 0.983
u 0 7 0.6 1.9 1.2 1.21 0.454
U-total 0 7 4.4 7.7 4.9 5.51 1.21
v 0 7 11.3 19.1 12.9 13.5 2.60
Zn 0 7 29.2 74.2 38 43.6 16.4
LA-UR-03-2661 28 May 2003
Canyons Sediment Background Report
It is important to note that the detection limits for antimony and thallium in the sediment background samples are greater than those reported in soil background samples because concentrations of antimony and thallium in sediment samples were measured by a different analytical method (ICPES) than was used for the majority of the soil background data (ICPMS). ICPMS is considered to be a better analytical method to quantify the abundance of these metals because of its lower detection limits and method performance. Reported sediment concentrations of Sb are 2 to 5 times higher than concentrations of Sb in background soils. These higher concentrations are a result of the lower precision of ICPES analysis, relative to the ICPMS analysis, and we do not use these sediment data for calculating background values.
A summary of the detection limits, number of samples above and below detection limits, and the minimum, maximum, median, mean, and standard deviation of concentrations for radionuclides in the <2-mm and fine size fractions are reported in Tables 7 and 8. Some radionuclide results are reported whether or not the value is greater than the MD A. Sample results for the following radionuclides are not censored: 3H, 238Pu, 239'240Pu, and 90Sr. Sample results for all other radionuclides have been censored at the MD A. The following radionuclides were not detected and are excluded from further statistical analyses: 140Ba, 211Bi, 212Bi, 109Cd, 139Ce, 144Ce, 134Cs, 57Co 6oc0 1s2E 1291 14<La 54Mn 2o3Hg 237N 231Pa 233p 234Pa 210Pb 211Pb 223R 224R , , u, , , , , p, , a, , , , a, a, 219Rn, 106Ru, 75Se, 22Na, 85Sr, 234Th, 113Sn, 88Y, and 65Zn. A complete list of radionuclide analytical results is reported in Appendix C.
Two radionuclides were eliminated from statistical analysis because of inadequate analytical methods. The 226Ra data are from gamma spectroscopy, which is not an acceptable method for quantifying this radionuclide. Thus, we will not use the 226Ra data to calculate a UTL value. Uranium-235 can also be detected with gamma spectroscopy, although not at the activities expected for the natural uranium background. Thus, 235U data by gamma spectroscopy are also excluded from the sediment background data. Alpha spectroscopy is the more appropriate method to measure background concentrations for both of these analytes.
The detected radionuclides fall into two broad categories: fallout radionuclides and naturally occurring radionuclides. The fallout radionuclides include 241 Am, 137 Cs, 90Sr, 3H, 238Pu, and 239·240Pu. The naturally occurring radionuclides include uranium and thorium isotopes and their daughters (Table 9). Because of the short half-life associated with many of the naturally occurring isotopes they are not of interest for risk or dose assessment purposes (Table 9). Thus, there is no need for further statistical evaluation of the short-lived uranium and thorium daughters. Thus, 228 Ac, 214Bi, 212Pb, 214Pb, 208Tl, and 234Th are excluded from further statistical analyses.
LA-UR-03-2661 29 May 2003

Canyons Sediment Background Report ~:
Table 7
Summary of Concentration Range (pCi/g) of
Detects and Nondetects for Radionuclides in the <2-mm Size Fraction
Nondetects Detects Standard
Analyte Count Min Max Count Min Max Median Mean Deviation
Gross Alpha 0 24 8.47 49.28 30.7 30.8 12.1
Gross Beta 0 24 22.7 41.12 34.8 34.6 4.98
Ac-228 3 0.31 0.55 21 1.14 3.07 1.72 1.66 0.710
Am-241 0 24 0.009 0.139 0.019 0.026 0.025
Ba-140 24 0.11 0.44 0
Bi-211 24 0.84 1.38 0
Bi-212 24 1.11 4.61 0
Bi-214 8 0.25 0.46 16 0.49 1.4 0.740 0.669 0.408
Cd-109 24 2.6 4.65 0 1.67 1.73 0.244
Ce-139 24 0.03 0.12 0
Ce-144 24 0.47 1.31 0
Co-57 24 0.03 0.1 0
Co-60 24 0.05 0.14 0
Cs-134 24 0.07 0.17 0
Cs-137 17 0.06 0.13 7 0.21 1.28 0.060 0.211 0.307
Eu-152 24 0.09 0.6 0
H-3 0 23 0.003 0.0856 0.018 0.024 0.019
Hg-203 24 0.06 0.15 0
I-129 24 0.13 0.36 0
K-40 0 24 24.21 35.1 30.1 29.8 3.03
La-140 24 0.02 0.08 0
Mn-54 24 0.04 0.12 0
Na-22 24 0.02 0.1 0
Np-237 24 0.78 1.4 0
Pa-231 24 2.34 4.46 0
Pa-233 24 0.08 0.25 0
Pa-234M 24 7.93 21.2 0
Pb-210 24 1.41 2.66 0
Pb-211 24 2.12 4.69 0
IA-UR-03-2661 30 May 2003
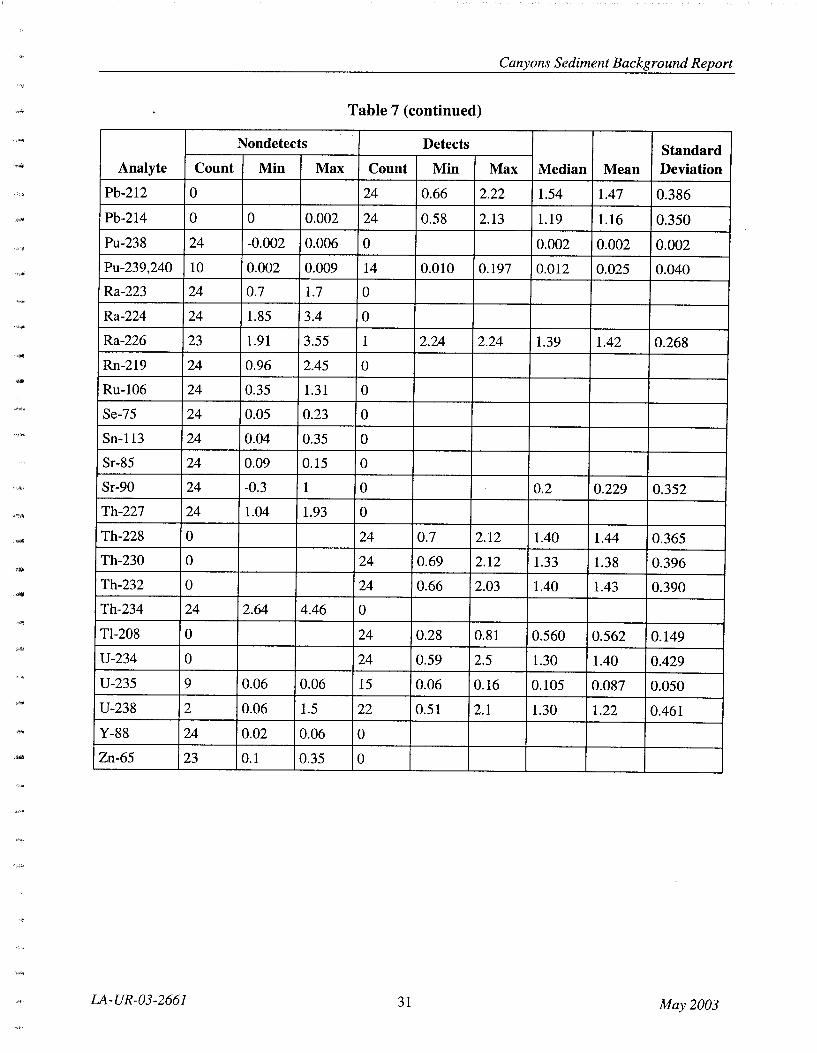
Canyons Sediment Background Report
Table 7 (continued)
Nondetects Detects Standard Analyte Count Min Max Count Min Max Median Mean Deviation
Pb-212 0 24 0.66 2.22 1.54 1.47 0.386
Pb-214 0 0 0.002 24 0.58 2.13 1.19 1.16 0.350
Pu-238 24 -0.002 0.006 0 0.002 0.002 0.002
Pu-239,240 10 0.002 0.009 14 0.010 0.197 0.012 0.025 0.040
Ra-223 24 0.7 1.7 0
Ra-224 24 1.85 3.4 0
Ra-226 23 1.91 3.55 1 2.24 2.24 1.39 1.42 0.268
Rn-219 24 0.96 2.45 0
Ru-106 24 0.35 1.31 0
Se-75 24 0.05 0.23 0
Sn-113 24 0.04 0.35 0
Sr-85 24 0.09 0.15 0
Sr-90 24 -0.3 1 0 0.2 0.229 0.352
Th-227 24 1.04 1.93 0
Th-228 0 24 0.7 2.12 1.40 1.44 0.365
Th-230 0 24 0.69 2.12 1.33 1.38 0.396
Th-232 0 24 0.66 2.03 1.40 1.43 0.390 ... Th-234 24 2.64 4.46 0
Tl-208 0 24 0.28 0.81 0.560 0.562 0.149
U-234 0 24 0.59 2.5 1.30 1.40 0.429
U-235 9 0.06 0.06 15 0.06 0.16 0.105 0.087 0.050
U-238 2 0.06 1.5 22 0.51 2.1 1.30 1.22 0.461
Y-88 24 0.02 0.06 0
Zn-65 23 0.1 0.35 0
LA-UR-03-2661 31 May 2003

Canyons Sediment Background Report
Table 8
Summary of Concentration Range (pCi!g) of Detects and
Nondetects for Radionuclides in the Fine Size Fraction (<0.0625 or <0.075 mm)
Nondetects Detects Standard
Analyte Count Min Max Count Min Max Median Mean Deviation
Gross Alpha 0 4 45.94 60.31 49.7 51.4 6.72
Gross Beta 0 4 27.61 45.32 38.2 37.3 8.82
Ac-228 2 0.7 0.7 3 1.65 3.08 1.65 1.65 1.30
Am-241 0 5 0.014 0.046 0.022 0.029 0.015
Ba-140 5 0.42 0.59 0
Bi-211 1 1.4 1.4 4 2.33 3.68 3.34 2.69 1.23
Bi-212 5 2.8 5.02 0
Bi-214 4 0.57 1.82 1 2.97 2.97 0.810 1.06 1.11
Cd-109 5 4.15 5.48 0
Ce-139 5 0.09 0.2 0
Ce-144 5 0.57 1.43 0
Co-57 5 0.09 0.14 0
Co-60 5 0.2 0.25 0
Cs-134 5 0.12 0.33 0
Cs-137 2 0.19 0.23 3 0.38 1.09 0.380 0.504 0.444
Eu-152 5 0.75 1.27 0
H-3 0 0
Hg-203 5 0.13 0.27 0
I-129 5 0.02 0.04 0
K-40 1 5.49 5.49 4 31.06 38.13 34.0 28.7 14.8
La-140 4 0.06 0.18 1 0.12 0.12 0.045 0.065 0.038
Mn-54 4 0.14 0.26 1 0.15 0.15 0.120 0.110 0.034
Na-22 5 0.05 0.15 0
Np-237 5 1.25 1.66 0
Pa-231 5 4.92 10.6 0
Pa-233 5 0.24 0.38 0
Pa-234M 5 14.1 20.3 0
Pb-210 4 2.82 4.11 1 3.22 3.22 1.95 2.04 0.711
Pb-211 5 4.1 6.89 0
LA-UR-03-2661 32 May2003

Canyons Sediment Background Report
Table 8 (continued)
Nondetects Detects Standard Analyte Count Min Max Count Min Max Median Mean Deviation
Pb-212 0 5 1.18 2.27 1.68 1.74 0.431
- Pb-214 3 0.45 0.62 2 0.4 0.87 0.310 0.413 0.264
Pu-238 4 0.002 0.005 0 0.004 0.004 0.001
Pu-239,240 0 4 0.026 0.277 0.064 0.108 0.116 Ra-223 5 1.83 2.3 0
Ra-224 4 3.9 4.93 1 3.36 3.36 2.39 2.49 0.524 Ra-226 4 3.74 4.91 1 4.75 4.75 2.34 2.70 1.17 Rn-219 5 2.01 3.43 0
Ru-106 5 1.4 2.91 0
Se-75 5 0.15 0.25 0
Sn-113 5 0.09 0.28 0
Sr-85 5 0.18 0.24 0
Sr-90 4 0.1 0.2 0 0.1 0.088 0.025 Th-227 5 1.88 2.44 0
Th-228 0 4 1.59 2.76 2.05 2.11 0.556 Th-230 0 4 1.77 2.53 1.93 2.04 0.347 Th-232 0 4 1.58 2.63 2.00 2.05 0.484 Th-234 5 4.51 5.95 0
Tl-208 0 5 0.82 1.2 0.850 0.934 0.163 U-234 0 4 1.5 2.6 2.20 2.13 0.486 U-235 2 0.06 0.06 2 0.18 0.18 0.180 0.266 0.205 U-238 0 4 1.5 2.5 1.90 1.95 0.480 Y-88 5 0.19 0.24 0
Zn-65 5 0.18 0.45 0
LA-UR-03-2661 33 May2003

Canyons Sediment Background Report
Table 9
Summary of Naturally Occurring Uranium and
Thorium Isotopes and Daughters Detected in Sediment Samples
Group Radionuclide Half-Lifea
Thorium series Thorium-232b 14,000,000,000 years
Thorium-228b 1.9 years
Actinium-228 6.2 hours
Lead-212 11 hours
Thallium-208 3.1 minutes
Actinium series Uranium-235b 700,000,000 years
Uranium series Uranium-238b 4,500,000,000 years
Uranium-234b 250,000 years
Thorium-234 24 days
Thorium-230b 75,000 years
Radium-226b 1600 years
Lead-214 27 minutes
Bismuth-214 20 minutes
a Values are rounded to two significant figures from information presented in Nuclides and
Isotopes, Chart of the Nuclides, 15th Ed. (Parrington et al., 1996).
b Radionuclides of interest for risk or dose assessment purposes (that is, radionuclides with
half-lives that exceed one-half year [Yu et al., 1993, p. 62]).
However, an evaluation of the results for naturally occurring radionuclides can be used to
determine if these radionuclides have achieved "secular equilibrium." Secular equilibrium occurs
when a long-lived parent radionuclide has daughter radionuclides that are relatively short-lived.
Over time, the activity of the radionuclides in the chain reach a steady-state equilibrium. Thus,
secular equilibrium would suggest that the activity of 232Th would be equal to the activity of 228Th. The presence of a strong correlation between radionuclides in the thorium and uranium
decay series demonstrates that a steady-state equilibrium has been established for these
radionuclides in sediment samples (Figures 13 and 14). This high, positive correlation also
confirms the natural origin of these radionuclides. Thus, an assessment of the concentration of
radionuclides for secular equilibrium can be used as evidence that samples were collected from
natural background materials. These correlation analyses should be interpreted carefully as low
correlations between radionuclides could result from analytical error. For example, in the
thorium decay series, 228 Ac exhibits a relatively low correlation with the other radionuclides
because of the high analytical error associated with quantifying 228 Ac activity using gamma
spectroscopy. A similar phenomenon can be observed in the uranium decay chain, where 214Bi, 226Ra, and 234Th are poorly quantified by gamma spectroscopy.
LA-UR-03-2661 34 May 2003

~·ll':l'!
"'"'
....
--
... -
"'
""
Canyons Sediment Background Report
2.5 2.0
1.0 0.5
2 •'I PB-212
2
1.9
1.6
1.3
1.0
0.7
0.8 0.7 0.6
0.5 0.4 0.3
.51.0 2.0 3.0 2 2 .7 1.0 1.4 1.8 .3 .4 .5 .6 .7 .8
The correlation coefficients (r) of progeny radionuclides with thorium-232, the numbers of samples (n), and the statistical significance values (p) for each analyte are as follows:
Actinium-228 (AC-228): r = 0.72, n = 24, p = <0.001
Lead-212 (PB-212): r = 0.95, n = 24, p = <0.001
Thorium-228 (TH-228): r = 0.96, n = 24, p = <0.001
Thallium-208 (TL-208): r = 0.92, n = 24, p = <0.001
Figure 13. Cross-correlation between radionuclides in the thorium decay series
LA-UR-03-2661 35 May 2003
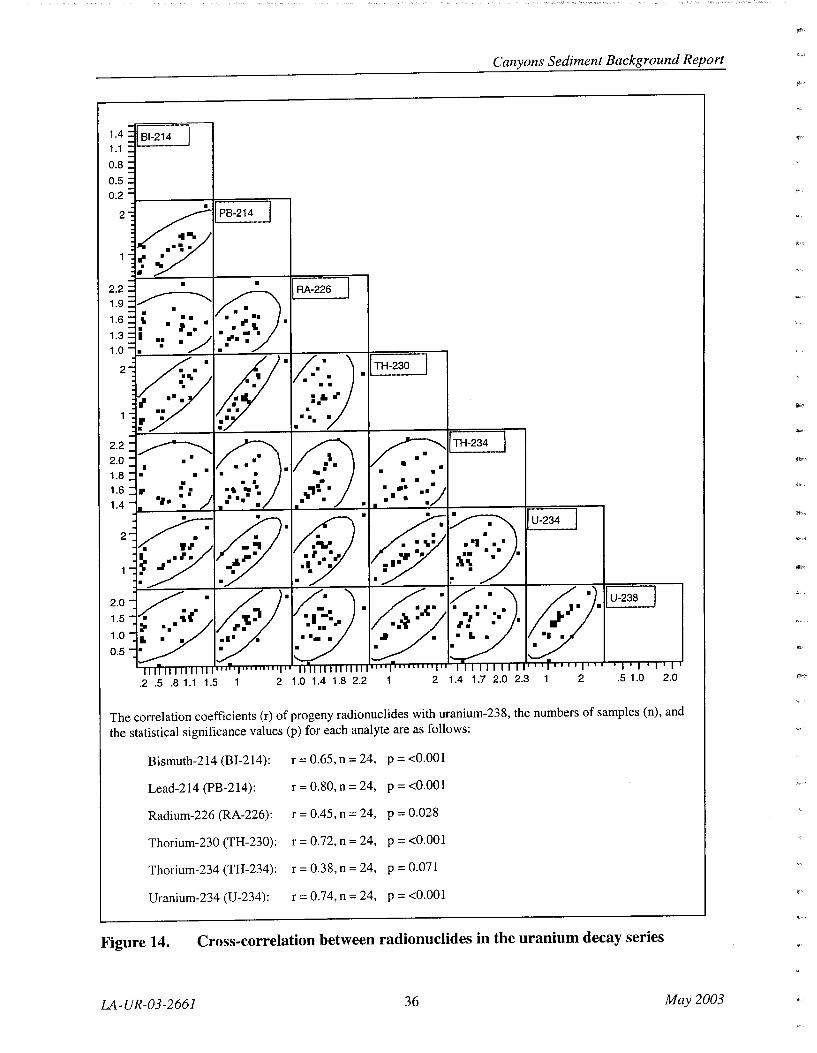
Canyons Sediment Background Report
1.1 4L----'
0.8
0.5 0.2
2.2 1.9
1.6
1.3
• I RA-226
1.0 .r----?--r---"".,--.....-t--;:--~-;r====;---,
2.2
2.0 1.8 1.6
~~TH-234 / ".· . • •
1.4 JL--~_...e_+-__ ..:;..:... _ __... __ ~-"'+1'----..;;;.&...-+-----
2
2.0
1.5
1.0
0.5
.2 .5 .8 1.1 1.5 2 1.0 1.4 1.8 2.2 2 1.4 1.7 2.0 2.3 2 .5 1.0 2.0
The correlation coefficients (r) of progeny radionuclides with uranium-238, the numbers of samples (n), and
the statistical significance values (p) for each analyte are as follows:
Bismuth-214 (BI-214): r = 0.65, n = 24, p = <0.001
Lead-214 (PB-214): r = 0.80, n = 24, p = <0.001
Radium-226 (RA-226): r = 0.45, n = 24, p = 0.028
Thorium-230 (TH-230): r = 0.72, n = 24, p = <0.001
Thorium-234 (TH-234): r = 0.38, n = 24, p = 0.071
Uranium-234 (U-234): r=0.74,n=24, p = <0.001
Figure 14. Cross-correlation between radionuclides in the uranium decay series
LA-UR-03-2661 36 May2003
...
•• h
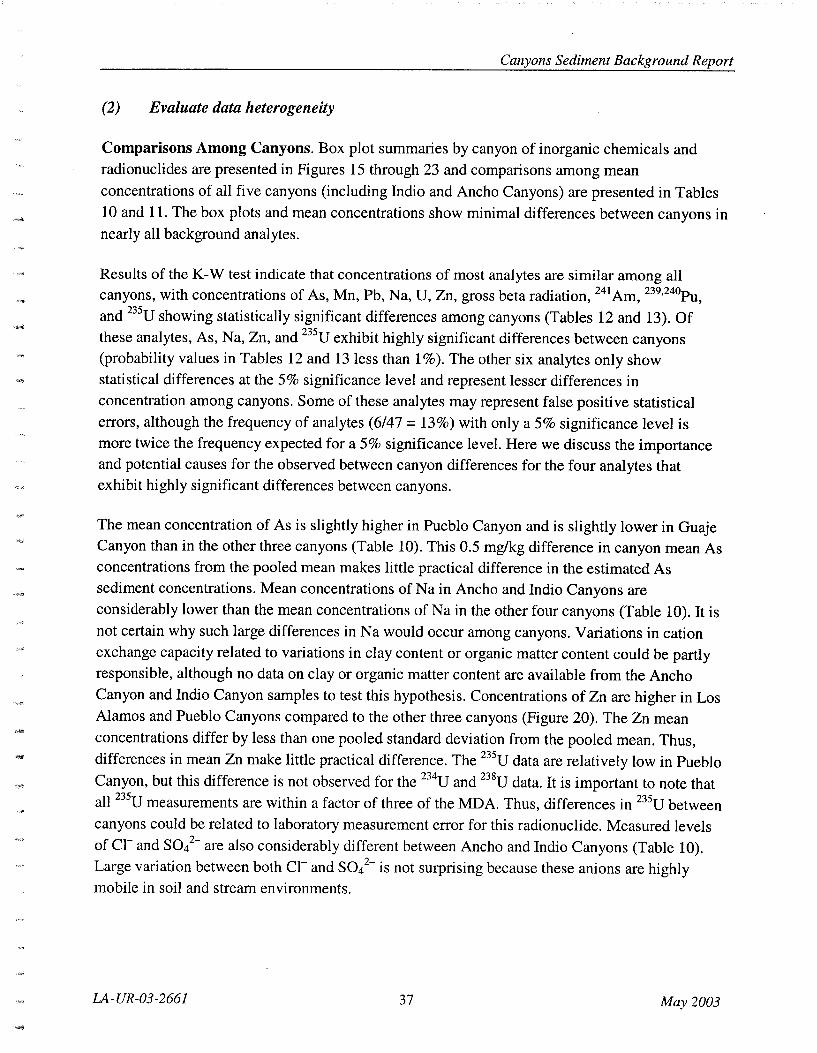
Canyons Sediment Background Report
(2) Evaluate data heterogeneity
Comparisons Among Canyons. Box plot summaries by canyon of inorganic chemicals and radionuclides are presented in Figures 15 through 23 and comparisons among mean concentrations of all five canyons (including Indio and Ancho Canyons) are presented in Tables 10 and 11. The box plots and mean concentrations show minimal differences between canyons in nearly all background analytes.
Results of the K-W test indicate that concentrations of most analytes are similar among all canyons, with concentrations of As, Mn, Pb, Na, U, Zn, gross beta radiation, 241Am, 239
•240Pu,
and 235U showing statistically significant differences among canyons (Tables 12 and 13). Of these analytes, As, Na, Zn, and 235U exhibit highly significant differences between canyons (probability values in Tables 12 and 13 less than 1% ). The other six analytes only show statistical differences at the 5% significance level and represent lesser differences in concentration among canyons. Some of these analytes may represent false positive statistical errors, although the frequency of analytes (6/47 = 13%) with only a 5% significance level is more twice the frequency expected for a 5% significance level. Here we discuss the importance and potential causes for the observed between canyon differences for the four analytes that exhibit highly significant differences between canyons.
The mean concentration of As is slightly higher in Pueblo Canyon and is slightly lower in Guaje Canyon than in the other three canyons (Table 10). This 0.5 mg/kg difference in canyon mean As concentrations from the pooled mean makes little practical difference in the estimated As sediment concentrations. Mean concentrations of Na in Ancho and Indio Canyons are considerably lower than the mean concentrations of Na in the other four canyons (Table 10). It is not certain why such large differences in Na would occur among canyons. Variations in cation exchange capacity related to variations in clay content or organic matter content could be partly responsible, although no data on clay or organic matter content are available from the Ancho Canyon and Indio Canyon samples to test this hypothesis. Concentrations of Zn are higher in Los Alamos and Pueblo Canyons compared to the other three canyons (Figure 20). The Zn mean concentrations differ by less than one pooled standard deviation from the pooled mean. Thus, differences in mean Zn make little practical difference. The 235U data are relatively low in Pueblo Canyon, but this difference is not observed for the 234U and 238U data. It is important to note that all 235U measurements are within a factor of three of the MD A. Thus, differences in 235U between canyons could be related to laboratory measurement error for this radionuclide. Measured levels of cr and sol- are also considerably different between Ancho and Indio Canyons (Table 10). Large variation between both Cl- and S04
2- is not surprising because these anions are highly
mobile in soil and stream environments.
LA-UR-03-2661 37 May 2003

Figure 15.
LA-UR-03-2661
Canyons Sediment Background Report
AI, Sb, As, Ba, Be, and B by canyon source and geomorphic unit (no fines) compared to Laboratory all-soil background ·
38 May2003
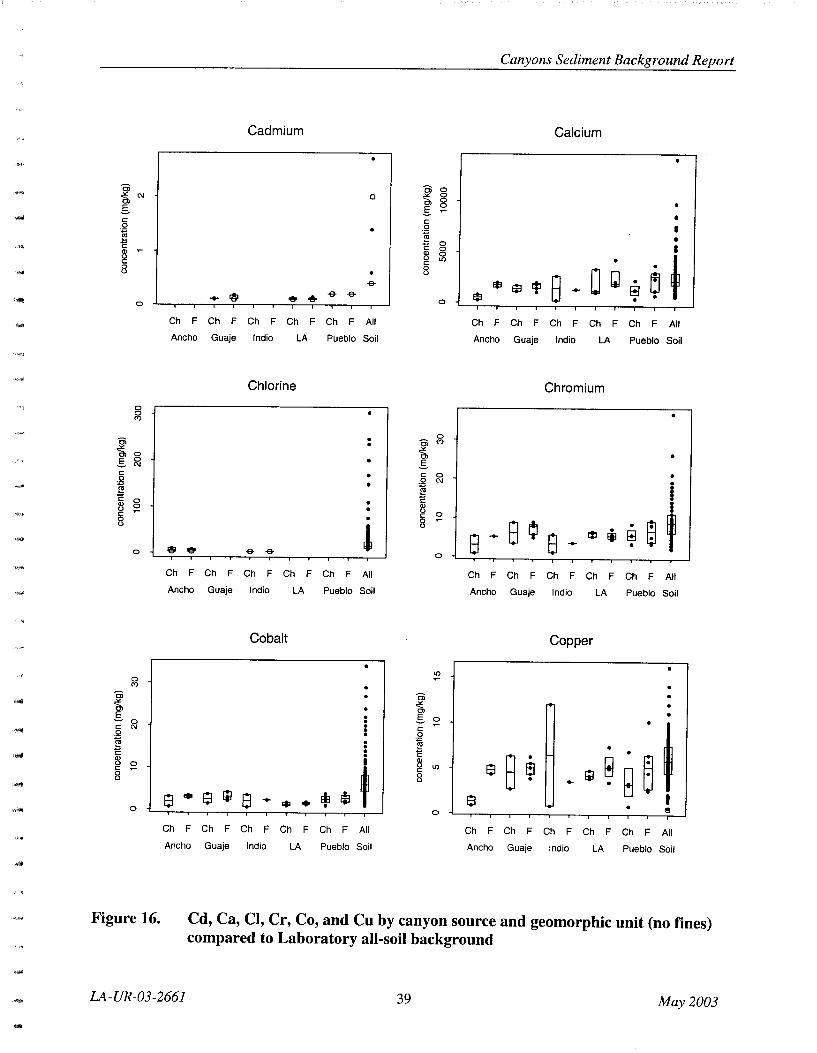
'"' ....
'>'!J4i
., .. -
"""
'"" ,...
"" ,.,.
'""
....
Ci -"' (\1 0, .s c 0
~ c Ill ~ (J c 8
0
0 0 (")
Ci -"' 0, 0 .s 0
(\1
c 0
"" ~ 0 ~ 0 c 0 (J
0
0 (")
Ci ~ 0> .s 0 c (\1 0
"" ~ Ill (J
~ c 0 (J
0
Figure 16.
Canyons Sediment Background Report
Cadmium Calcium
•
~ 0 0 0
0, 0
~ • .s • c 0 I ~ • c 0
I 0 Ill 0
f (J Ll) • c . 0
0 I;J ~ (J
8 -e- Ell fJl .
$ ... E!l ~ -eo ~ -e- -e- $ • • ... 0
Ch F Ch F Ch F Ch F Ch F All Ch F Ch F Ch F Ch F Ch F All Ancho Guaje Indio LA Pueblo Soil Ancho Guaje Indio LA Pueblo Soil
Chlorine Chromium
0
~ (")
0, • .s • c 0
• 0 (\1 . ~ i . I . ~ c ~
' 8 8 ¢ .
@ ' .
8 ... 8 It! (jl f!l • ~ '81 -e- -e-0
Ch F Ch F Ch F Ch F Ch F All Ch F Ch F Ch F Ch F Ch F All Ancho Guaje Indio LA Pueblo Soil Ancho Guaje Indio LA Pueblo Soil
Cobalt Copper
Ll) ~
~ • . .s ~ • .
~ . . c • 0 . ~ . . • E
~ .
~ •
~ I Ill (J Ll) ~ El t c lil g 0 • (J ... •
9 • 9 lil 8 Ell f!3 ~ I ... + • • e 0
Ch F Ch F Ch F Ch F Ch F All Ch F Ch F Ch F Ch F Ch F All Ancho Guaje Indio LA Pueblo Soil Ancho Guaje Indio LA Pueblo Soil
Cd, Ca, CI, Cr, Co, and Cu by canyon source and geomorphic unit (no fines) compared to Laboratory all-soil background
LA-UR-03-2661 39 May2003

<0 0
c; ~
0, .s c .... 0 0 ~ ~ Q) () c 8
C\J 0
c; ~
0, 0 .s "' c 0
~ Q) ()
~ c 0 ()
0 0
~ c; ~ .s c 0
~ 0 0
"' Q) () c 0 ()
Figure 17.
Canyons Sediment Background Report
Cyanide Iron
,. 0
fe 0
c; 0 0
~ "' 0, . .s •
0 . c 0 I
i ~! 0 0 0 .
~ "' I . . Q) 0
~ .
' () 0 f!l ~ 0
t. c 0 0
8 ~ 8 () ~ ... Ell Ell . 9 - I
Ch F Ch F Ch F Ch F Ch F All Ch F Ch F Ch F Ch F Ch F All
Ancho Guaje Indio LA Pueblo Soil Ancho Guaje Indio LA Pueblo Soil
Lead Magnesium 0 0 0
~ • • • c;
~ . 0, .
~ ~ . .s .
~ c 0 •
~ 0 0 . ~
0 •
~ "' • •
~ Q)
t ()
g c
9 ~ 8 .
• ~ . 8 lil 8 I - ~ ~ ~
Ill ... . • • 0
Ch F Ch F Ch F Ch F Ch F All Ch F Ch F Ch F Ch F Ch F All
Ancho Guaje Indio LA Pueblo Soil Ancho Guaje Indio LA Pueblo Soil
Manganese Mercury
0 ~ • 0
. c; co 0 • ~ 0
.s
I c <0 0 0
• ~ 0
~ ~ . .
~ . Q)
Q a () ....
9 [il c 0
8 0 0
8 - () . C\J 0 0 -& -& • -& • 0
Ch F Ch F Ch F Ch F Ch F All Ch F Ch F Ch F Ch F Ch F All
Ancho Guaje Indio LA Pueblo Soil Ancho Guaje Indio LA Pueblo Soil
CN, Fe, Pb, Mg, Mn, and Hg by canyon source and geomorphic unit (no
fines) compared to Laboratory all-soil background
LA-UR-03-2661 40 May 2003
Ill''
F;·
"'
"'.
...
.. II!<'
!llh
''"

.....
-
·-
-"""
""
""iii!
-
0
"' o; -""' 0, 0 .s C\1
c 0
-~ <I>
;? u c 8
~
o; -""' 0, .s c C! 0
"" g c <I> u c 0 .,., u d
§ C\1
~ 0 0
~ .s c 0 0 8 ~ ~ "E <I> u
0 c 0 0 u .,.,
0
Figure 18.
Canyons Sediment Background Report
Nickel Potassium
0 0 0
o; "' -""' 0, .s 0
0 • . c 0 I . 0 '<I" • ~ • . . "E
f .
~ . <I> 0
s f u 0
8 . c 0 s 0 C\1 '*' ~ 0 8 eJ
u fJj . s 8 Ell ~ Q - . !j1 e • Eil
0
Ch F Ch F Ch F Ch F Ch F All Ch F Ch F Ch F Ch F Ch F All Ancho Guaje Indio LA Pueblo Soil Ancho Guaje Indio LA Pueblo Soil
Selenium Silver
.,., C\1
Cl d -""' 0, .s 0 c C\1 0 d "" g c
~ ~ .,., c
d 8
;? . & & & & & & & & & 16' & d
Ch F Ch F Ch F Ch F Ch F All Ch F Ch F Ch F Ch F Ch F All Ancho Guaje Indio LA Pueblo Soil Ancho Guaje Indio LA Pueblo Soil
Sodium Sulfate
• 0 . 0 • o; 0 ~
-"' 0, .s . c
• 0
t:l . "" 0 ~
g 0 • 0
8 •
' c .,., <I>
~ u
~ c . 0 • u
l . • Efl s 'I!JI ~ & & 0
Ch F Ch F Ch F Ch F Ch F All Ch F Ch F Ch F Ch F Ch F All Ancho Guaje Indio LA Pueblo Soil Ancho Guaje Indio LA Pueblo Soil
Ni, K, Se, Ag, Na, and S04 by canyon source and geomorphic unit (no fines) compared to Laboratory all-soil background
LA-UR-03-2661 41 May2003

co a ~ en §. "' c a 0
~ c "<t Ql a u c 0 u
C\1 a
0 C\1
c; "" en ~ §. c 0
~ 0 ~
c Ql u c 0 u "'
0 0 "<t
~ 0
§. 0
"' c 0
~ c 0 Ql 0 u C\1 c 0 u
0 0
Figure 19.
Canyons Sediment Background Report
Tantalum Thallium
a
"' a
~ g en
0 ~ §. C\1
~ c
~ 0
~ 0
~ c 0
~ ~ ' c g -& -& -& -& 8 0 I
-& 0
-& -& -& r§ 0
Ch F Ch F Ch F Ch F Ch F All Ch F Ch F Ch F Ch F Ch F All
Ancho Guaje Indio LA Pueblo Soil Ancho Guaje Indio LA Pueblo Soil
Thorium Thorium (total)
0 0
0
c; I "" 0
0
I en C\1
1 ~ §. c .Q .... ~ c Ql
s ~
u 0 c
~ 8
0
e I
Ch F Ch F Ch F Ch F Ch F All Ch F Ch F Ch F Ch F Ch F All
Ancho Guaje Indio LA Pueblo Soil Ancho Guaje Indio LA Pueblo Soil
Titanium Uranium
m ~
~ "'
~ en §.
~ c C\1 ,g
~
~ 0 0
~ 0
8 ~ I
~ c
~ 6 ~ 0 fil u 0
.... • 8 '
0
-& 0
Ch F Ch F Ch F Ch F Ch F All Ch F Ch F Ch F Ch F Ch F All
Ancho Guaje Indio LA Pueblo Soil Ancho Guaje Indio LA Pueblo Soil
Ta, Tl, Th, Th (total), Ti, and U by canyon source and geomorphic unit (no
fines) compared to Laboratory all-soil background
LA-UR-03-2661 42 May2003
""'' "''"'
""' "''· •• .....
~·

o-oM
--"£.~
-
C) 0
""' <0 <» ,S c: g 0 g .... c: Q) u c: 8 0
C\1
Figure 20.
Canyons Sediment Background Report
Uranium (total) Vanadium
I
9 ~ ~ . :
...
~ ~ ~ t ... •
8
. C) • -a, ~ ,S • c:
et
0
~ 0 ~ C\1
~ • c:
• 8 Efl . 0 u
8 ... !;! • 13 • •
0
Ch F Ch F Ch F Ch F Ch F All Ch F Ch F Ch F Ch F Ch F All Ancho Guaje Indio LA Pueblo Soil Ancho Guaje Indio LA Pueblo Soil
Zinc
. . . • . 0 ~ ~
• r<' .
~ ~ s • ... . ~ 0 .
t.. t.
Ch F Ch F Ch F Ch F Ch F All
Ancho Guaje Indio LA Pueblo Soil
U (total), V, and Zn by canyon source and geomorphic unit (no fines) compared to Laboratory all-soil background
lA-UR-03-2661 43 May 2003

0
"'
Cl 0
"" '<t
() ,e, c:
0 .Q
~ (")
Q) () 0 c: C\1 0 ()
~
Cl "" 0 () ~
,e, 0 c: 0
i "' 2l 0
c: 0 8
CXl 0 0
Cl "" <0 () 0 ,e, 0 c: 0
~ C!i c 0 Q) () c: 0 C\1 () 0
0
0 0
Figure 21.
Canyons Sediment Background Report
Alpha Beta
• •
~~ ~ ~ .. •
re
~ •
Cl
~~ "" () "' .. • re ,e, (")
c:
~ ~ 0
~ 0 • (")
2l • le c:
0
• () • "' • C\1
!:
Ch F Ch F Ch F Ch F Ch F All Ch F Ch F Ch F Ch F Ch F All
Ancho Guaje Indio LA Pueblo Soil Ancho Guaje Indio LA Pueblo Soil
Americium-241 Cesium-137
• ,. Cl ~
"" ~
() ,e, c:
~ 0
~ • c "'
0~~ Q) 0 () c:
~ • 0 ()
• ~ • • 1!1 • e -& 0
Ch F Ch F Ch F Ch F Ch F All Ch F Ch F Ch F Ch F Ch F All
Ancho Guaje Indio LA Pueblo Soil Ancho Guaje Indio LA Pueblo Soil
Tritium Potassium-40
• "' • (")
• Cl
~!! "" ()
• ,e, • • c: 0 8 .Q (") 8 li!
~ ~ ~ c Q)
• ()
• c: 0
9 ~ ()
"' •
• • C\1
• Ch F Ch F Ch F Ch F Ch F All Ch F Ch F Ch F Ch F Ch F All
Ancho Guaje Indio LA Pueblo Soil Ancho Guaje Indio LA Pueblo Soil
Alpha, Beta, Am-241, Cs-137, H-3, and K-40 by canyon source and
geomorphic unit (no fines) compared to Laboratory all-soil background
LA-UR-03-2661 44 May 2003
""
~h

co 0 0 0
,,. :§ i:3 s C(\J oo :;::;:o <1l • !:;0 c (I) 0 c 0 0
'•..til- C\1 0 0
9 ~ ..
Ch F
Ancho
0 C\i
g (.) 0.
-;;~ o~
~ c (I) 0 c oo 0 .
.... Ch F
Ancho
0 C\i
g (.)
s~ c~
0
~ c (I) 0 co 0 . o~
Ch F
Ancho
Figure 22.
I.A-UR-03-2661
Canyons Sediment Background Report
Plutonium-238 Plutonium-239/240 0
• C\1 • 0
~~~ ~10 Ol ~ Go
9 • s §o
~ • :;:::::"-;
~0 c • (I) 0 • CIO
~ • • oo
oo • ~ • • ; 0 • 0
Ch F Ch F Ch F Ch F All Ch F Ch F Ch F Ch F Ch F All
Guaje Indio LA Pueblo Soil Ancho Guaje Indio LA Pueblo Soil
Thorium-228 Thorium-230
• • 0 • C\i
• ~ ~
~ • ~ ~ (.)
~ 0.
• -10 c . • o~
~ ~ ~
~ • c • • (I)
~ • 0 c
Oo • 0~ • • •
Ch F Ch F Ch F Ch F All Ch F Ch F Ch F Ch F Ch F All
Guaje Indio LA Pueblo Soil Ancho Guaje Indio LA Pueblo Soil
Thorium-232 Uranium-234
• 10 •
~ C\i
~ •
Clo
~ GN
~ • • s
~ c
~ ~ • ~LO • • • • <1l .
• ~ ~
1!1 9 c
~ • (I)
0 • c oo 0~ •
• • Ch F Ch F Ch F Ch F All Ch F Ch F Ch F Ch F Ch F All
Guaje Indio LA Pueblo Soil Ancho Guaje Indio LA Pueblo Soil
Pu-238, Pu-239,240, Th-228, Th-230, Th-232, and U-234 by canyon source and geomorphic unit (no fines) compared to Laboratory all-soil background
45 May2003
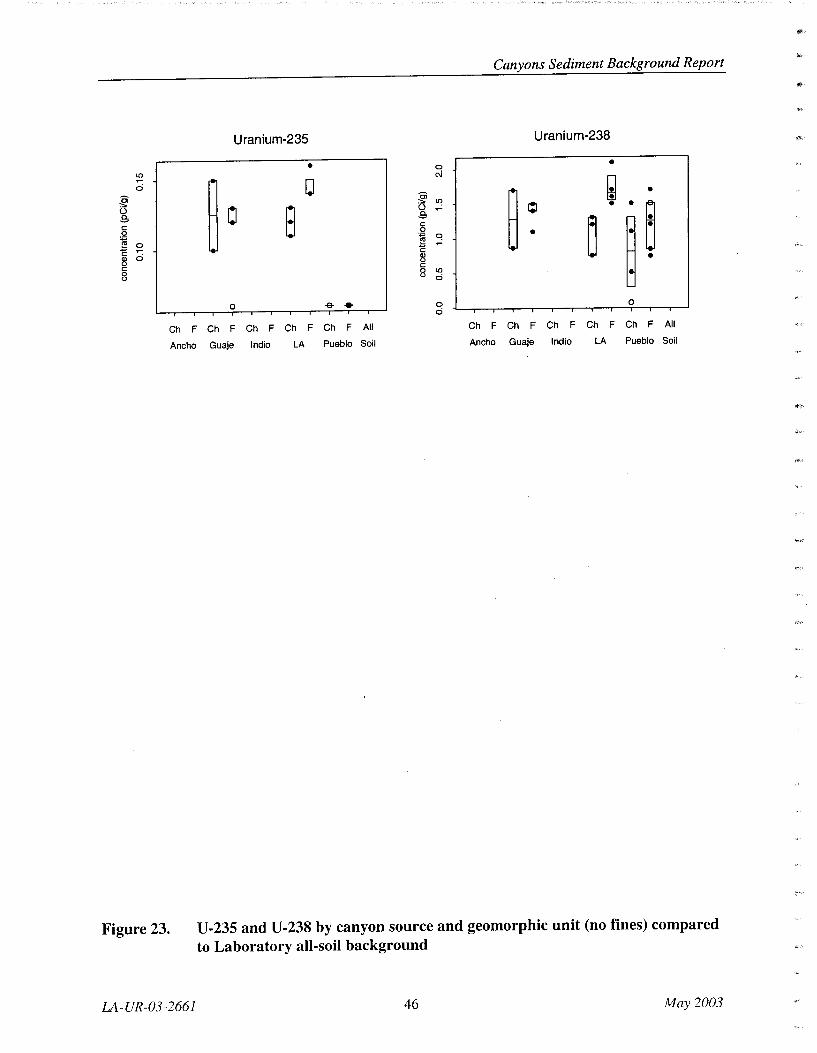
Canyons Sediment Background Report
Uranium-235 Uranium-238
• 0 • lll C\i
c:i
~ Q ~ Ci Ci
~ •
::. ::. "? ~
~~ () 0 8
() ~
,e, ,e,
~ c: c: 0
0 • ~ ~ C!
0 ~
"E ~ c:
2l c:i Q) (J
c: c:
8 0 lll (J c:i
0 -& • 0 0 c:i
Ch F Ch F Ch F Ch F Ch F All Ch F Ch F Ch F Ch F Ch F All
Ancho Guaje Indio LA Pueblo Soil Ancho Guaje Indio LA Pueblo Soil
Figure 23.
IA-UR-03-2661
U-235 and U-238 by canyon source and geomorphic unit (no fines) compared
to Laboratory all-soil background
46 May 2003
"''

Canyons Sediment Background Report
Table 10 Mean and Standard Deviations by Canyon for Inorganic and Organic Analytes
Analyte Ancho Indio Guaje Los Alamos Pueblo All Canyons
(mglkg) Mean I Std Mean Std Mean Std Mean Std Mean Std Mean Std
In organics
Ag 0.05 0.00 0.08 0.07 0.07 0.06
AI 4483 3370 4547 3830 5393 1734 7328 3773 5838 3238
As 1.29 0.86 1.58 1.38 1.19 0.56 1.86 0.88 2.67 0.57 1.84 0.97
B 1.08 0.66 2.27 0.40 1.40 1.19 1.40 0.99
Ba 48.5 34.4 53.8 46.0 64.6 23.1 61.4 17.2 66.4 38.2 60.4 30.1
Be 0.43 0.38 0.56 0.53 0.61 0.29 0.65 0.28 0.64 0.33 0.59 0.32
Ca 1113 763 1343 1213 1612 333 2122 1215 1820 1107 1683 980
Cd 0.09 0.05 0.07 0.04 0.10 0.00 0.09 0.04
Cl 5.30 4.74 1.25 0.00 3.56 3.99
CN 0.27 0.18 0.37 0.22 0.26 0.18 0.29 0.19
Co 2.46 1.21 2.12 1.45 3.07 1.11 1.40 0.32 2.63 0.99 2.35 1.08
Cr 4.2 2.2 3.3 2.3 7.0 2.3 5.6 0.9 6.0 2.4 5.6 2.2
Cu 3.1 2.0 5.4 5.8 5.0 1.4 4.8 1.3 4.6 2.7 4.6 2.4
Fe 7838 4793 5883 4153 7857 2007 7406 989 9480 1928 8034 2607
Hg 0.01 0 0.01 0.01 0.011 0.00 0.01 0.00 - K 1023 769 987 810 1703 665 1215 263 1349 697 1299 628
Mg 893 605 922 765 1157 440 708 138 1142 638 977 521
Mn 203 111 224 164 282 89 381 110 294 94 290 115
Na 86 49 115 72 856 575 774 224 512 296 551 414
Ni 3.8 2.1 3.7 2.5 6.1 1.5 4.8 0.5 5.4 2.6 5.0 2.0
Pb 5.8 3.0 8.8 6.3 7.4 2.4 12.5 6.5 10.0 3.7 9.3 4.7
Sb 2.50 0.00 3.33 1.44 2.45 0.00 2.45 0.00 2.45 0.00 2.54 0.46
Se 0.10 0.00 0.10 0.00 0.10 0.00 0.10 0.00
so4 16.63 16.68 2.50 0.00 10.57 14.00
Ta 0.15 0.00 0.15 0.00 0.15 0.00
Th 4.0 2.9 4.5 2.7 4.2 2.6
Th-total 10.68 5.58 11.63 7.15 11.09 5.73
Tl 198 99 235 64 271 90 242 85
Ti 0.15 0.00 0.17 0.03 1.85 0.73 2.11 0.30 0.91 0.35 1.24 0.86
LA-UR-03-2661 47 May 2003

Canyons Sediment Background Report
Table 10 (continued)
Analyte Ancho Indio Guaje Los Alamos
(mglkg) Mean Std Mean Std Mean Std Mean
u 0.39 0.28 0.85 0.73 4.13 0.82 4.39
U-total 2.80 2.00 4.08 3.05
v 10.0 7.8 6.5 4.8 13.3 3.3 9.3
Zn 31.4 16.1 29.3 19.6 24.7 6.5 41.8
Organics
TOC 3394 1624 11506
Notes: 1. Nondetect (italics) values shown at 1/2 of absolute value.
2. Empty cells indicate no data.
Table 11
Std
1.25
1.5
9.8
3887
Pueblo All Canyons
Mean Std Mean Std
3.41 1.16 3.13 1.73
3.35 2.36
10.7 3.7 10.4 4.2
37.9 7.5 33.9 11.9
8712 8100 7885 6456
Mean and Standard Deviations by Canyon for Radionuclides (Excluding Nondetects)
Analyte Guaje Los Alamos Pueblo All Canyons
(pCi/g) Mean Std Mean Std Mean Std Mean Std
Gross Alpha 26.3 6.7 34.7 14.1 32.1 13.1 30.8 12.1
Gross Beta 32.4 5.4 37.2 5.0 33.8 4.4 34.6 5.0
Am-241 0.02 0.00 0.04 0.05 0.03 0.01 0.03 0.03
Cs-137 0.05 0.01 0.32 0.48 0.24 0.25 0.21 0.31
H-3 0.02 0.01 0.04 0.03 0.02 0.02 0.02 0.02
K-40 29.5 1.0 31.0 3.3 29.7 3.3 29.8 3.0
Pu-238 0.00 0.00 0.00 0.00 0.00 0.00 0.00 0.00
Pu-239,240 0.01 0.00 0.05 0.07 0.02 0.02 0.03 0.04
Th-228 1.54 0.35 1.52 0.40 1.34 0.38 1.44 0.36
Th-230 1.52 0.35 1.47 0.41 1.22 0.42 1.37 0.40
Th-232 1.54 0.31 1.55 0.41 1.31 0.43 1.43 0.39
U-234 1.49 0.55 1.59 0.33 1.23 0.40 1.40 0.43
U-235 0.13 0.02 0.13 0.02 0.06 0.09 0.10 0.07
U-238 1.39 0.28 1.45 0.43 0.97 0.50 1.22 0.46
Note: Radionuclides not measured for Indio and Ancho Canyons.
LA-UR-03-2661 48 May 2003

Canyons Sediment Background Report
Table 12 Summary of Statistical Distribution Shift Tests for Inorganic Analytes
Kruskal-Wallis Wilcoxon Rank Sum Wilcoxon Rank Sum Comparison of 5 Comparison of Channel Comparison of Fine Grain
Chemical Canyons Versus Floodplain Data Versus <2-mm Size Fraction
AI 0.365 0.155 0.014
As 0.004 0.104 0.152
Ba 0.925 0.034 <0.001
Be 0.840 0.031 0.002
- Ca 0.528 0.034 0.008
CN 0.904 0.787 0.003
- Co 0.063 0.193 0.016
Cr 0.075 0.435 0.006
Cu 0.949 0.072 0.001
Fe 0.215 0.617 0.046
K 0.545 0.078 0.048
Mg 0.455 0.045 0.006
Mn 0.026 0.238 0.060
Na <0.001 0.389 0.418
Ni 0.421 0.222 0.005
Pb 0.026 0.167 0.023
Th 0.721 0.157 0.079
Th-total 0.472 0.285 0.142
Ti 0.253 0.027 0.299
u 0.018 0.357 0.009
U-total 0.353 0.032 0.004
v 0.113 0.795 0.062
Zn 0.002 0.496 0.194
Note: Values less than 0.05 (in bold) represent statistically significant results.
LA-UR-03-2661 49 May 2003

Canyons Sediment Background Report
Table 13
Summary of Statistical Distribution Shift Tests for Radionuclides
Wilcoxon Rank Sum
Kruskal-Wallis Wilcoxon Rank Sum Comparison of Fine
Comparison of Comparison of Channel Grain Versus <2-mm
Radionuclide 3 Canyons Versus Floodplain data Size Fraction
Gross Alpha 0.090 0.270 0.007
Gross Alpha 0.027 0.121 0.555
Am-241 0.038 0.135 0.370
Cs-137 0.064 0.952 0.024
H-3 0.238 0.231 <0.001
K-40 0.083 0.788 0.119
Pu-238 0.385 0.301 0.049
Pu-239,240 0.027 0.339 0.015
Th-228 0.373 o:o4o 0.030
Th-230 0.286 0.046 0.011
Th-232 0.258 0.084 0.030
U-234 0.096 0.159 0.018
U-235 <0.001 0.480 0.190
U-238 0.070 0.106 0.016
Note: Values less than 0.05 (in bold) represent statistically significant results.
The concentration of TOC shows considerable variation among canyons (Table 10). Variation
among TOC measurements primarily reflects differences in the accumulation of disseminated
organic matter among Los Alamos, Pueblo, and Guaje Canyons. Vegetative cover and
development of soil organic matter in surface horizons are generally highest at the Los Alamos
Canyon sample sites relative to sample sites in Guaje and Pueblo Canyons.
Similar concentrations of most analytes among all five canyons provide justification for
consolidating all sediment background data. As discussed above, the differences in the means
between canyons is small relative to the within-canyon or pooled-canyon estimates of variability.
An advantage in combining all canyons into one data set is that this larger data set will provide
better statistics and can be used to detect smaller differences when used in statistical distribution
shift tests. The presence of similar concentrations of nearly all analytes among all five canyons is
also notable because there are variations among bedrock sources of sediment.
LA-UR-03-2661 50 May 2003
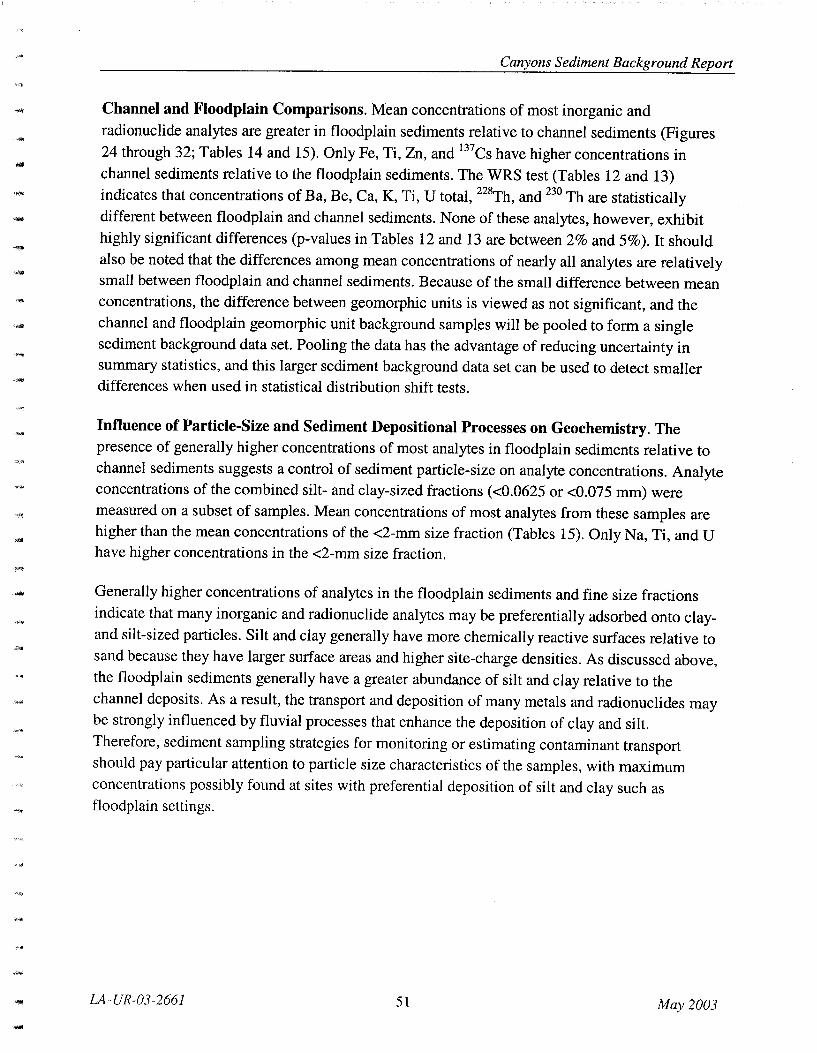
-
-
-
-
Canyons Sediment Background Report
Channel and Floodplain Comparisons. Mean concentrations of most inorganic and radionuclide analytes are greater in floodplain sediments relative to channel sediments (Figures 24 through 32; Tables 14 and 15). Only Fe, Ti, Zn, and 137Cs have higher concentrations in channel sediments relative to the floodplain sediments. The WRS test (Tables 12 and 13) indicates that concentrations of Ba, Be, Ca, K, Ti, U total, 228Th, and 230 Th are statistically different between floodplain and channel sediments. None of these analytes, however, exhibit highly significant differences (p-values in Tables 12 and 13 are between 2% and 5%). It should also be noted that the differences among mean concentrations of nearly all analytes are relatively small between floodplain and channel sediments. Because of the small difference between mean concentrations, the difference between geomorphic units is viewed as not significant, and the channel and floodplain geomorphic unit background samples will be pooled to form a single sediment background data set. Pooling the data has the advantage of reducing uncertainty in summary statistics, and this larger sediment background data set can be used to detect smaller differences when used in statistical distribution shift tests.
Influence of Particle-Size and Sediment Depositional Processes on Geochemistry. The presence of generally higher concentrations of most analytes in floodplain sediments relative to channel sediments suggests a control of sediment particle-size on analyte concentrations. Analyte concentrations of the combined silt- and clay-sized fractions (<0.0625 or <0.075 mm) were measured on a subset of samples. Mean concentrations of most analytes from these samples are higher than the mean concentrations of the <2-mm size fraction (Tables 15). Only Na, Ti, and U have higher concentrations in the <2-mm size fraction.
Generally higher concentrations of analytes in the floodplain sediments and fine size fractions indicate that many inorganic and radionuclide analytes may be preferentially adsorbed onto clayand silt-sized particles. Silt and clay generally have more chemically reactive surfaces relative to sand because they have larger surface areas and higher site-charge densities. As discussed above, the floodplain sediments generally have a greater abundance of silt and clay relative to the channel deposits. As a result, the transport and deposition of many metals and radionuclides may be strongly influenced by fluvial processes that enhance the deposition of clay and silt. Therefore, sediment sampling strategies for monitoring or estimating contaminant transport should pay particular attention to particle size characteristics of the samples, with maximum concentrations possibly found at sites with preferential deposition of silt and clay such as floodplain settings.
LA-UR-03-2661 51 May 2003

Figure 24.
LA-UR-03-2661
AI, Sb, As, Ba, Be, and B by channel, floodplain, and floodplain-fine
groupings compared to Laboratory all-soil background
52 May2003
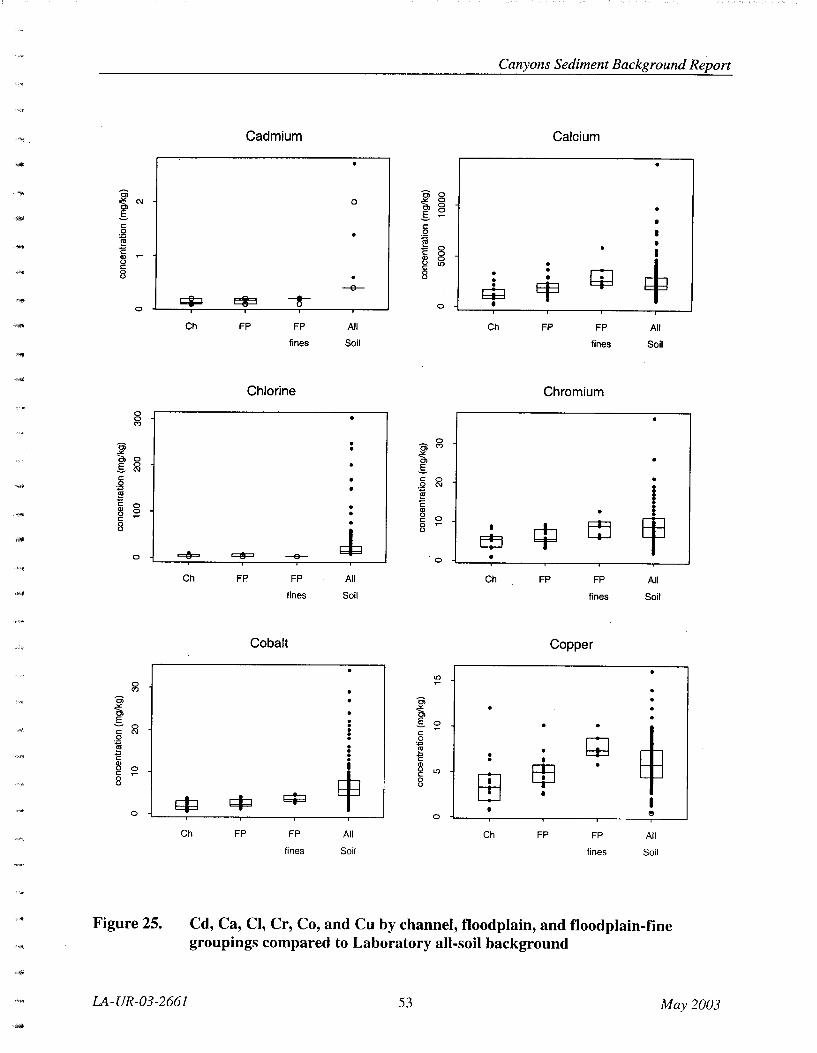
_,~
""'
....
"" ,..,
""' .. -~
··<i~M
'""
o; ~C\1 .§. c: 0
~ Q) u c: 0 t)
0
0 0 C')
~
"' 0 .§. 0
C\1 c: 0 -~
c 0 ~ ~ c: 8
0
0 C')
~ .§.
0 c: C\1 0
~ Q) u 0 c: ~
0 u
0
Figure 25.
Canyons Sediment Background Report
Cadmium Calcium
•
o; 0 0 "" 0
"' 0
.§. ~ c: • • 0
~ • c 0 I ~ 8
+ "' • c: . bid 8 .
• • -e-- . Ef3 ~ ~ T ~
0 • Ch FP FP All Ch FP FP All
fines Soil fines Soil
Chlorine Chromium
0 o; C')
"" "' .§. c: 0 • 0 C\1 • -~ I c
I Q) • u 0
' c:
E!J ~ 8 cp E!J
~ =3= -e-- 0 • Ch FP FP All Ch FP FP All
fines Soil fines Soil
Cobalt Copper
~
o; ~ • . .§. 0 .
$ . . c: . 0 w . ~ . . . c • . • I Q)
EfJ u "' $ c:
EB 0 u
~ ~ $ I • e 0
Ch FP FP All Ch FP FP All fines Soil fines Soil
Cd, Ca, Cl, Cr, Co, and Cu by channel, floodplain, and floodplain-fine groupings compared to Laboratory all-soil background
LA-UR-03-2661 53 May 2003

CD ci
~ .s c '<t 0 ci
~ "' '-' c 0 '-'
N ci
o; .>< 0, 0 .s N
c 0
~ c
"' '-' 0 c 8 ~
0 0 0 ~
o; ~ §. c 0
~ 0 0 c: I()
"' '-' c 0 '-'
Figure 26.
Canyons Sediment Background Report
Cyanide Iron
• 0
~ 8 0 (') • .
§. • 0 •
~ c 8 I 0 0 . ~
N I • •
B "' 8 • EfJ '-' c 0 EE t;;;p 8 0
I 0 -e-
Ch FP FP All Ch FP FP All
fines Soil fines Soil
Lead Magnesium 0 0
8 . . . ~ • . 0, •
~ . §. .
rn c 0 • . . 0 0 . . e 0 • Ill • • c:
$ • 2l
$ c
8 0 • • '-' • . • I bid I c:p • 0
Ch FP FP All Ch FP FP All
fines Soil fines Soil
Manganese Mercury
0 ~ --ci . . . o; co . .>< 0
0, ci §.
$ c CD
g 0 0
~ ci
I "'
~ '-' '<t
E8 c 0 0 ci . '-' . 0 N
0 -e- --ci
Ch FP FP All Ch FP FP All
fines Soil fines Soil
CN, Fe, Pb, Mg, Mn, and Hg by channel, floodplain, and floodplain-fine
groupings compared to Laboratory all-soil background
LA-UR-03-2661 54 May 2003
,e.,
,. ..

'"" ... ...
-·•
""'
""'
'"'
""
-'"" ,..
"""
,; ..
"'"' .,.,
-"'*'
--
0
"'
~ 0 .s (\j
c: 0
~ ~ 0 c: ~
0 (,)
~
~ .s c: ~ 0
~ Q) (,) c: 8 It)
0
8 0 (\j
0> 0 0
~ ~ en .s c: 0 0 0
~ ;? c ~
0 c: 8 0
lO
0
Figure 27.
Canyons Sediment Background Report
Nickel Potassium
• • 0 0 0
~ <0
• .s 0 0 • • c: 0 I . 0 '<t • ~ • •
+ . c • I • Q) 0
' (,) 0 • . c:
EEl 8 0 I EP .
bid (\j
$ w e
0
Ch FP FP All Ch FP FP All fines Soil fines Soil
Selenium Silver
It) (\j
~ 0
"' .s 0 c: (\j 0 0 ~ c
w Q) It) (,)
~ c: 0 8
0 . -e- -e- -e-
0 -e- -e- -e-
Ch FP FP All Ch FP FP All fines Soil fines Soil
Sodium Sulfate
0 0
0> 0
~ .s c: 0
I
~ 0 •
rn . . 0
g ~ It) • g Q) . (,)
c: • 0 • (,)
~ . • • ~ c:p 0 --
Ch FP FP All Ch FP FP All fines Soil fines Soil
Ni, K, Se, Ag, Na, and S04 by channel, floodplain, and floodplain-fine groupings compared to Laboratory all-soil background
LA-UR-03-2661 55 May 2003
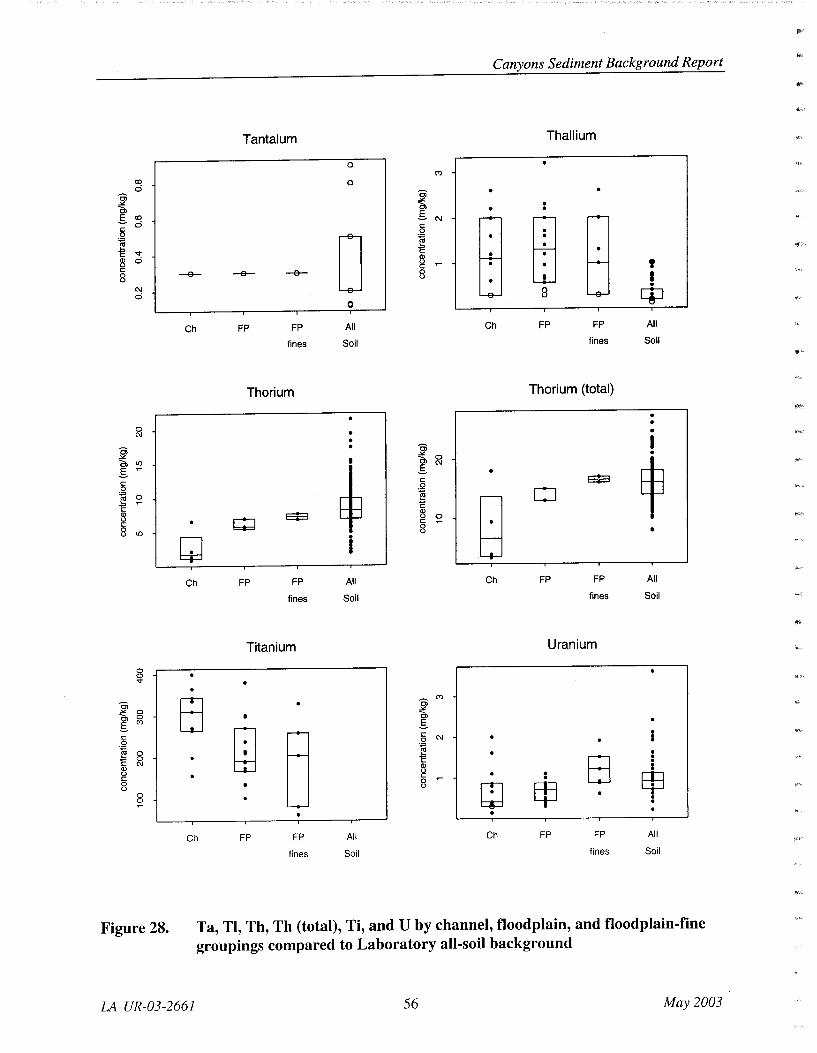
Figure 28.
LA-UR-03-2661
Ta, Tl, Th, Th (total), Ti, and U by channel, floodplain, and floodplain-fine
groupings compared to Laboratory all-soil background
56 May2003

-~
""
''"' .... . ,...
·-
i"'"'\1:
~«> .s c 0 ~ ~ 1: fl c 8 C\1
~~ c. .s c 0
0 ~ '<~"
1: fl c 0 () 0
C\1
Figure 29.
Canyons Sediment Background Report
Uranium (total) Vanadium
• I . •
~ • c; • • ~ 0 • . '<~"
• •
$ .s • ffi c
$ 0
ffi ~ 0 ., C\1 • () • c • ~ I 8 EfJ Ef3
I • 0 •
Ch FP FP All Ch FP FP All
fines Soil fines Soil
Zinc
•
~ . . •
@ .
~ tE •
Ch FP FP All
fines Soil
U (total), V, and Zn by channel, floodplain, and floodplain-fine groupings compared to Laboratory all-soil background
LA-UR-03-2661 57 May 2003
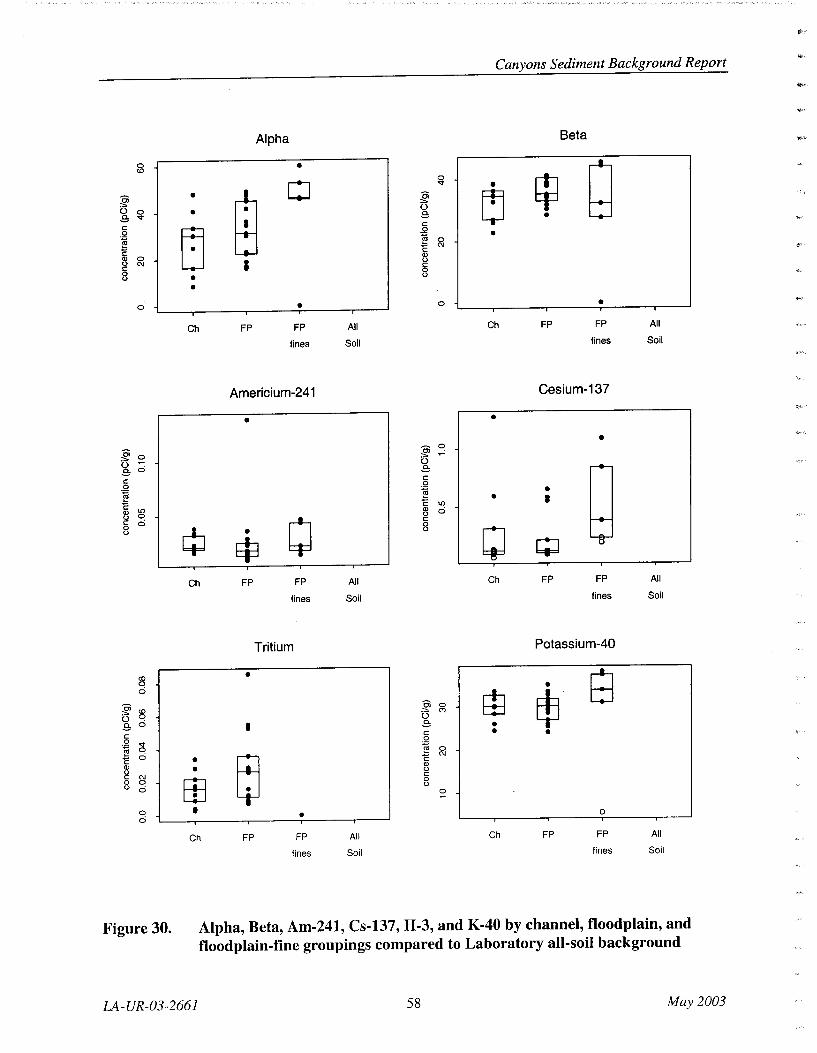
0 <0
~ u 0 B '<t
c: 0
~ 8 0
C\1 c: 8
0
Ol ~ 0 u 0 B c: 0
~ Q) "' <> 0 c: 0 8
co 0 0
g <0 u 0
B 0 c:
.Q ~ ~ c 0
Q)
<> c: C\1 0 0 <.> 0
0 0
Figure 30.
Canyons Sediment Background Report
Alpha Beta
•
Q CJ 0
~ '<t • •
m Ol
L!J ~
• u B •
L:J c: 0 • ~ 0
c: C\1
Q)
I <> c: 0
• <>
• • 0 •
Ch FP FP All Ch FP FP All
fines Soil fines Soil
Americium-241 Cesium-137
• • •
Ol ~
Cl
u B g c: 0
~ • • I c "' 8 0
0 c:
~ 0
• <>
~ $ b;J
Ch FP FP All Ch FP FP All
fines Soil fines Soil
Tritium Potassium-40
• 8 • rn $ g 0 (')
u I B • c: • • 0
~ 0
• 0 c C\1
• Q)
<>
EE c: 0 <>
~
• • 0
Ch FP FP All Ch FP FP All
fines Soil fines Soil
Alpha, Beta, Am-241, Cs-137, H-3, and K-40 by channel, floodplain, and
floodplain-fine groupings compared to Laboratory all-soil background
LA-UR-03-2661 58 May 2003
II'·
"'"'
ill"'
;;ot,,q
!#:·'

"f'W:~
-.!1ili
'"' <$111
'~
.... ,,.,
'"'
"''
""'
w.
"""
""'
co 0 0 0
Oi :::, 0 .e: C:C\1 oo ~q .::;o c: Q) 0 c: 0 0
C\1 0 0
9
LO C\i
Oi :::,
<5.<:! ~C\1
c: 0
~ .:::o.o c: 0
Q)~
0 c: 0 0
C! ~
LO C\i
Oi :::,0 0 0 _e,N c:
OQ '§o.o - 0 c: ~ Q) 0 c: 0 0 C! ~
Figure 31.
Canyons Sediment Background Report
Plutonium-238 Plutonium-239/240
• • • • • EJ ~"! • oo -
0 G .e: c:
• 0
~ • c:~
Q) 0
oO • c: • 0 I -0
• bid ¢ + • 0 • 0
Ch FP FP All Ch FP FP All
fines Soil fines Soil
Thorium-228 Thorium-230
• 0.0 • C\i
~ ~ g>q • • ON I • .e: •
~ c: • ffi
OQ
'f!Li1 • c:~ • • Q)
G CJ 0 c:
8C! • • • I • • • Ch FP FP All Ch FP FP All
fines Soil fines Soil
Thorium-232 Uranium-234
• LO • •
~ C\i
D go • I 0 0
~ ..e:C\1 • c:
• 0 • w • • ~"l • .:::~
ffi l!J c: Q) 0 c:
• Oo • 0 0 • • ~
• • • •
Ch FP FP All Ch FP FP All
fines Soil
Pu-238, Pu-239,240, Th-228, Th-230, Th-232, and U-234 by channel, floodplain, and floodplain-fine groupings compared to Laboratory all-soil background
LA-UR-03-2661 59 May2003

~ll) 0> ~
()o .e c: 0
~ 'Eo Ol~ 0 . c:o 0 0
Figure 32.
Canyons Sediment Background Report
Uranium-235 Uranium-238
• • • 8 ~N
• 0> ::::, () • • .e • EiJ • c: 0
Q ~ • c:~ Ol 0 • c: • 0 0 •
0 • Ch FP FP All Ch FP FP All
fines Soil fines Soil
U-235 and U-238 by channel, floodplain, and floodplain-fine groupings
compared to Laboratory all-soil background
LA-UR-03-2661 60 May 2003
....
., ..
..
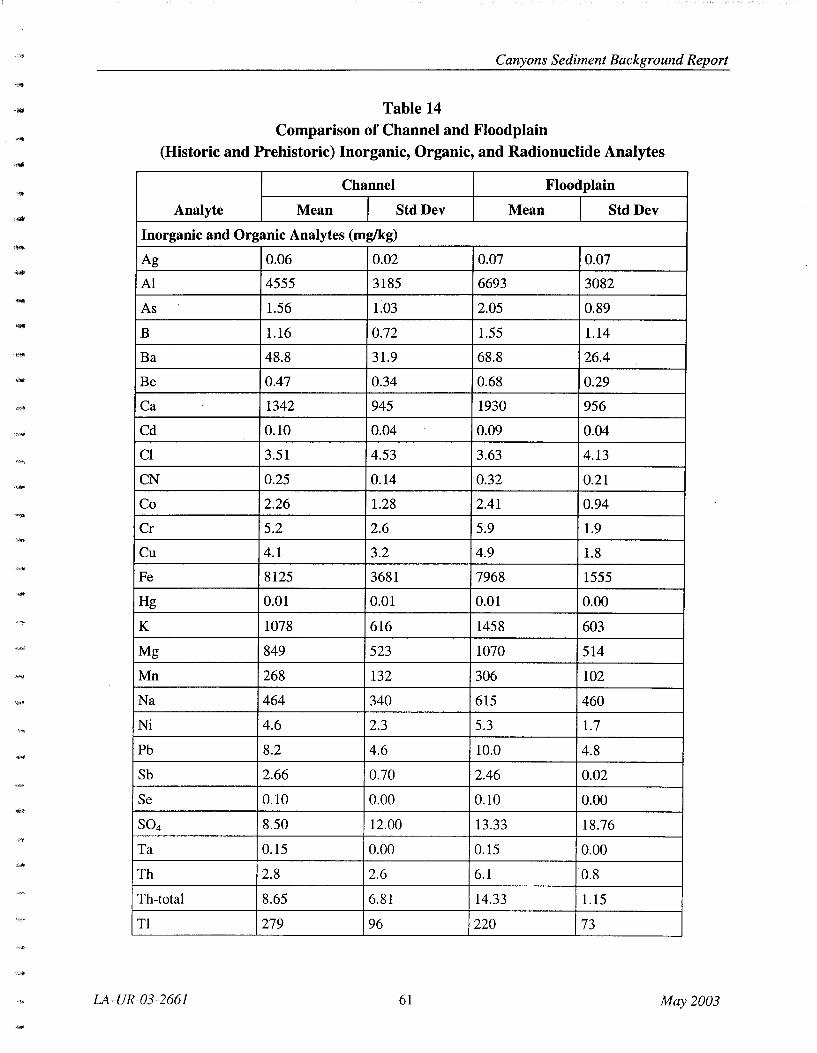
Canyons Sediment Background Report
Table 14 Comparison of Channel and Floodplain
(Historic and Prehistoric) Inorganic, Organic, and Radionuclide Analytes
Channel Floodplain
Analyte Mean Std Dev Mean I Std Dev
Inorganic and Organic Analytes (mglkg) - Ag 0.06 0.02 0.07 0.07
Al 4555 3185 6693 3082
As 1.56 1.03 2.05 0.89
B 1.16 0.72 1.55 1.14
Ba 48.8 31.9 68.8 26.4
Be 0.47 0.34 0.68 0.29
Ca 1342 945 1930 956
Cd 0.10 0.04 0.09 0.04
Cl 3.51 4.53 3.63 4.13
CN 0.25 0.14 0.32 0.21
Co 2.26 1.28 2.41 0.94
Cr 5.2 2.6 5.9 1.9
Cu 4.1 3.2 4.9 1.8 "'" Fe 8125 3681 7968 1555
Hg 0.01 0.01 0.01 0.00
K 1078 616 1458 603
Mg 849 523 1070 514
Mn 268 132 306 102
Na 464 340 615 460
Ni 4.6 2.3 5.3 1.7
Pb 8.2 4.6 10.0 4.8
Sb 2.66 0.70 2.46 0.02
Se 0.10 0.00 0.10 0.00
so4 8.50 12.00 13.33 18.76
Ta 0.15 0.00 0.15 0.00
Th 2.8 2.6 6.1 0.8
Th-total 8.65 6.81 14.33 1.15
Tl 279 96 220 73
LA-UR-03-2661 61 May 2003

'''"
Canyons Sediment Background Report
"""
Table 14 (continued)
Channel Floodplain
Analyte Mean Std Dev Mean StdDev
Ti 1.08 0.78 1.35 0.92
u 2.53 1.74 3.57 1.63
U-total 2.63 3.07 4.32 0.38
v 10.3 5.3 10.6 3.3
Zn 34.0 15.2 33.9 9.4
TOC 6306 5730 8832 6866
Radionuclide Analytes (pCi/g)
Gross Alpha 27.0 13.2 33.0 11.3
Gross Beta 32.7 6.0 35.7 4.0
Am-241 0.02 0.01 0.03 0.03
Cs-137 0.27 0.42 0.17 0.22
H-3 0.02 0.01 0.03 0.02
K-40 29.44 2.85 30.02 3.21
Pu-238 0.00 0.00 0.00 0.00
Pu-239,240 0.02 0.02 0.03 0.05
Th-228 1.28 0.40 1.54 0.32
Th-230 1.22 0.40 1.47 0.37
Th-232 1.29 0.37 1.52 0.38
U-234 1.33 0.55 1.44 0.35
U-235 0.08 0.05 0.11 0.07
U-238 1.03 0.54 1.34 0.38
LA-UR-03-2661 62 May 2003

Canyons Sediment Background Report
Table 15 Comparison of <2 mm and Fine Fraction
(Historic and Prehistoric) Inorganic, Organic, and Radionuclide Analytes
<2mm Fine Fraction
Analyte Mean Std Dev Mean Std Dev
Inorganic and Organic Analytes (mglkg)
Ag 0.07 0.06 0.05 0.00
AI 5838 3238 7914 2976
As 1.84 0.97 2.26 0.94
B 1.40 0.99 2.36 1.20
Ba 60.4 30.1 94.3 28.0
Be 0.59 0.32 0.90 0.33
Ca 1683 980 2485 1291
Cd 0.09 0.04 0.13 0.06
CI 3.51 4.53 1.25 0.00
CN 0.29 0.19 0.08 0.00
Co 2.35 1.08 3.22 0.93
Cr 5.6 2.2 6.8 3.0
Cu 4.6 2.4 6.5 2.1
Fe 8034 2607 8869 2084
Hg 0.01 0.00 0.02 0.01
K 1299 628 1579 453
Mg 977 521 1410 421
Mn 290 115 366 172
Na 551 414 297 263
Ni 5.0 2.0 6.8 2.2
Pb 9.3 4.7 11.6 5.1
Sb 2.54 0.46 2.48 0.02
Se 0.10 0.00 0.10 0.00
so4 8.50 12.00 4.32 2.83
Ta 0.15 0.00 0.15 0.00
Th 4.2 2.6 6.1 1.6
Th-total 11.09 5.73 14.13 3.49
LA-UR-03-2661 63 May 2003

Canyons Sediment Background Report
Table 15 (continued)
<2mm Fine Fraction
Analyte Mean Std Dev Mean Std Dev
Tl 242 85 186 102
Ti 1.24 0.86 0.85 0.85
u 3.13 1.73 2.91 2.61
U-total 3.35 2.36 4.33 1.22
v 10.4 4.2 11.5 3.8
Zn 33.9 11.9 39.5 14.3
TOC 7885 6456
Radionuclide Analytes (pCilg)
Gross Alpha 30.8 12.1 51.4 5.8
Gross Beta 34.6 5.0 37.3 7.6
Am-241 0.03 0.03 0.03 0.01
Cs-137 0.21 0.31 0.50 0.40
H-3 0.02 0.02 ND* ND
K-40 29.80 3.03 28.66 13.20
Pu-238 0.00 0.00 0.00 0.00
Pu-239,240 0.03 0.04 0.11 0.10
Th-228 1.44 0.36 2.11 0.48
Th-230 1.37 0.40 2.04 0.30
Th-232 1.43 0.39 2.05 0.42
U-234 1.40 0.43 2.13 0.42
U-235 0.10 0.07 0.27 0.18
U-238 1.22 0.46 1.95 0.42
*ND =Not detected.
Statistical comparisons between fine fraction ( <0.0625 or <0.075 mm) and the whole sample
( <2-mm size fraction) show many differences for inorganic chemicals and radionuclides. There
are statistically significant differences between concentrations of AI, Ba, Be, Ca, CN, Co, Cr, Cu,
F K N. Pb U l l h d' · t37C 3H 238p 239,24op 22s 23oTh e, , Mg, 1, , , U-tota , gross a p a ra tatton, s, , u, u, Th, ,
232Th, 234U, and 238U (Tables 12 and 13). Twelve of these analytes exhibit highly significant
differences (p-values in Tables 12 and 13 are less than 1% ). These analytes include: Ba, Be, Ca,
CN, Cr, Cu, Mg, Ni, U, U-total, gross alpha radiation, and 3H. The statistical differences
LA-UR-03-2661 64 May 2003
''"

....
""'
Canyons Sediment Background Report
resulting from particle grain size variations suggest that background sediment UTLs should not calculated for the fine fraction samples, although these samples may be useful for comparison with sediment samples that are finer than those sampled in this background study.
(3) Calculate sediment background values
The proposed inorganic chemical background values for sediment are summarized in Table 16, and the proposed radionuclide background values for sediment are summarized in Table 17. Each inorganic chemical and radionuclide is discussed in detail in the following sections, including a compari~W! of sediment background values with soil background values that are ------·--·· - ________ ,.. - - - " ... ~-·--"-·---··-··--·---· ··- - ··-- - "''• .. "'"-------·-----~--~---·- ·····" -·~-- ,_,._. -----presented in Ryti et al. (1998). The soil background values for fallout radionuclides were derived - --"''" ............ - ··-·--· ·- -
by Campbell (1998) using data from LANL's Environmental Surveillance Program. Background values for inorganic chemicals in soils are typically higher than that for sediment, and these differences are associated with chemical and mineralogical changes accompanying soil development. The sediment background values for naturally occurring radionuclides may be used as surrogate values for these radionuclides in soil, because there are no directly measured values for naturally occurring radionuclides in soil. We also compared the concentrations reported for fallout radionuclides from prehistoric sediments to post-1943. Ideally, prehistoric deposits should have no detected results for fallout radionuclides, although this was not always the case (as discussed below).
Inorganic Chemical Analytes
Aluminum
All AI results were detects, and the concentration range is from 740 to 13,300 mglk:g. No suspect values were identified in the AI probability plots. These data appear to originate from a squareroot normal statistical distribution (see probability plots in Appendix E). The UTL value is 15,400 mglk:g, which is roughly 20% greater than the maximum value. The UTL will be used as the AI sediment background value. The AI soil background value is 29,200 mg/kg or about 1.9 times the sediment value.
Antimony
All of the sediment Sb data were produced by ICPES, which has a higher detection limit than the method used for Sb in soils (ICPMS). Because a more appropriate chemical analysis method was used for the soils background data, we will use the soil UTL value for this chemical as the background value for sediments. Thus, the Sb sediment background value will be 0.83 mg/kg.
LA-UR-03-2661 65 May 2003

Canyons Sediment Background Report .. Ill''
Table 16
Summary of Background Values for Inorganic Analytes (mglkg)
Maximum Maximum Background
Analyte UTL:95,95 Value Detection Limit Value
Ag n/aa 0.28 <0.1 NCb (1.0)
AI 15400 13300 n/a 15400
As 3.98 3.6 <0.5 3.98
Ba 127 127 n/a 127
Be 1.31 1.3 <0.08 1.31
Ca 4420 4240 n/a 4420
Cd n/a 0.18 <0.2 NC (0.4)
Cl 17.1 10.3 <2.5 17.1
CN 0.82 0.63 <0.15 0.82
Co 4.73 4.2 n/a 4.73
Cr 10.5 9.2 n/a 10.5
Cu 11.2 12 n/a 11.2
Fe 13800 13000 n/a 13800
Hg n/a 0.03 <0.02 NC (0.1)
K 2690 2600 n/a 2690
Mg 2370 2370 n/a 2370
Mn 543 517 n/a 543
Na 1470 1970 n/a 1470
Ni 9.38 8.9 <2 9.38
Pb 19.7 25.6 <4 19.7
Sbc n/a n/a n/a 0.83
Se n/a n/a <0.2 NC (0.3)
so4 58.2 35 <5 58.2
Ta n/a n/a <0.3 NC (0.3)
Thct n/a n/a n/a 14.6
Th-totalct nla n/a nla 22.4
Ti 439 400 n/a 439
Tla n/a n/a n/a 0.73
u 2.22 2 <0.3 2.22
U-total 6.99 7.2 n/a 6.99
LA-UR-03-2661 66 May 2003

-, ..
Canyons Sediment Background Report
Table 16 (continued)
Maximum Maximum Background Analyte UTL:95,95 Value Detection Limit Value
v 19.7 20 n/a 19.7
Zn 60.2 56.2 n/a 60.2
a n/a = Not applicable.
b NC = Not calculated. The detection limit noted parenthetically is used as a background value. c UTL from LANL soil background was used because a less sensitive analytical method was used for sediment
samples.
d UTL was not calculated for thorium because of the small number of sediment samples. The soil UTL is used as a surrogate value for this analyte.
Table 17 Summary of Background Values for Radionuclides (pCi/g)
Maximum Maximum Background Radio nuclide UTL Value MDA
Gross Alpha 58.8 49.28 n/aa 58.8
Gross Beta 46.1 41.12 n/a 46.1
Am-241 0.04 0.038 n/a 0.04
Cs-137 0.90 1.28 <0.13 0.90
H-3 0.093 0.0856 n/a 0.093
K-40 36.8 35.1 n/a 36.8
Pu-238 0.006 0.006 n/a 0.006
Pu-239,240 0.068 0.065 n/a 0.068
Ra-226b n/a n/a n/a 2.59
Ra-228c n/a n/a n/a 2.33
Sr-90 1.04 1 n/a 1.04
Th-228 2.28 2.12 n/a 2.28
Th-230 2.29 2.12 n/a 2.29
Th-232 2.33 2.03 n/a 2.33
U-234 2.59 2.5 n/a 2.59
U-235 0.20 0.16 <0.006 0.20
U-238 2.29 2.1 <1.5 2.29
• n/a =Not applicable.
b UTL is based on U-234 activity, instead of using gamma spectroscopy results for this radionuclide.
c This radionuclide was not measured in sediment; the UTL was estimated from thorium-232.
LA-UR-03-2661 67
Value
May 2003

Canyons Sediment Background Report
Arsenic
Twenty nine of the 31 As results were detects, and the concentration range of detects was 0.3 to
3.6 mg/kg. No suspect values were identified in the As probability plots. These data appear to
originate from a normal statistical distribution (see probability plots in Appendix E). The UTL
value is 3.98 mg/kg, which is roughly 10% greater than the maximum value. The UTL will be
used as the As sediment background value. The As soil background value is 8.17 mg/kg or about
two times the sediment value.
Barium
All Ba results were detects, and the concentration range is from 8 to 127 mglkg. No suspect
values were identified in the Ba box plots or probability plots. These data appear to originate
from a normal statistical distribution (see probability plots in Appendix E). The UTL value is
127 mg/kg, which is equal to the maximum value. The UTL will be used as the Ba sediment
background value. The Ba soil background value is 295 mg/kg or about 2.3 times the sediment
value.
Beryllium
Twenty nine of the 31 Be results were detects, and the concentration range of detects was 0.17 to
1.3 mglkg. No suspect values were identified in the Be probability plots. These data appear to
originate from a normal statistical distribution (see probability plots in Appendix E). The UTL
value is 1.31 mg/kg, which is roughly equal to the maximum value. The UTL will be used as the
Be sediment background value. The Be soil background value is 1.83 mg/kg or about 1.4 times
the sediment value.
Cadmium
Six of 24 Cd results were detects, which is not a sufficient detection frequency to permit
calculation of a UTL value. The contract required quantitation limit, 0.4 mg/kg, is proposed as a
background value for Cd, which is higher than the maximum reported value of 0.18 mg/kg. The
Cd soil background value is also 0.4 mg/kg, and is also based on the contract required
quantitation limit.
Calcium
All Ca results were detects, and the concentration range is from 180 to 4240 mg/kg. No suspect
values were identified in theCa probability plots. These data appear to originate from a square-
LA-UR-03-2661 68 May 2003

Canyons Sediment Background Report
root normal statistical distribution (see probability plots in Appendix E). The UTL value is 4420 mg/kg, which is roughly 5% greater than the maximum value. The UTL will be used as the
Ca sediment background value. TheCa soil background value is 6120 mg/kg or about 1.4 times the sediment value.
Chloride
Two of the seven Cl- results were detects, and the concentration range of detects was 8.4 to 10.3 mg/kg. This low detection frequency and number of samples should preclude calculating a UTL value for this chemical. However, chloride is not a typical RCRA-contaminant, and a sediment UTL value is calculated for comparison purposes to other media. Because of the limited number of samples, it was assumed that cr data were derived from a normal statistical distribution. The calculated UTL value is 17.1 mg/kg, which is 70% greater than the maximum cr result. The UTL will be used as the cr sediment background value. The cr soil background value is 231 mg/kg or about 10 times the sediment value.
Chromium
All of the 31 Cr results were detects, and the concentration range is from 0.8 to 9.2 mglk:~. No suspect values were identified in the Cr probability plots. These data appear to originate from a normal statistical distribution (see probability plots in Appendix E). The UTL value is
10.5 mg/kg, which is roughly 15% greater than the maximum value. The UTL will be used as the Cr sediment background value. The Cr soil background value is 19.3 mg/kg or about 1.8 times the sediment value.
Cobalt
All Co results were detects, and the concentration range is from 0.6 to 4.2 mg/kg. No suspect values were identified in the Co probability plots. These data appear to originate from a normal
statistical distribution (see probability plots in Appendix E). The UTL value is 4.73 mg/kg, which is roughly 10% greater than the maximum value. The UTL will be used as the Co
sediment background value. The Co soil background value is 8.64 mg/kg or about 1.8 times the sediment value.
Copper
All Cu results were detects, and the concentration range is from 0.77 to 12 mg/kg. No suspect
values were identified in the Cu probability plots. These data appear to originate from a squareroot normal statistical distribution (see probability plots in Appendix E). The UTL value is
LA-UR-03-2661 69 May 2003
I

Canyons Sediment Background Report
11.2 mg/kg, which is within the background copper concentration range. The UTL will be used
as the Cu sediment background value. The Cu soil background value is 14.5 mg/kg or about 1.3
times the sediment value.
Iron
All Fe results were detects, and the concentration range is from 1400 to 13,000 mg/kg. No
suspect values were identified in the Fe probability plots. These data appear to originate from a
normal statistical distribution (see probability plots in Appendix E). The UTL value is
13,800 mglkg, which is 6% greater than the maximum value. The UTL will be used as the Fe
sediment background value. The Fe soil background value is 21 ,500 mg/kg or about 1.5 times
the sediment value.
Lead
Thirty of the 31 Pb results were detects, and the concentration range of detects was 3.5 to
25.6 mg/kg. One high value was noted in the Pb probability plots, but this value did not skew the
estimated mean or standard deviation and was not omitted from the lead background data. These
data appear to originate from a normal statistical distribution (see probability plots in Appendix
E). The UTL value is 19.7 mglkg, which is within the background Pb concentration range. The
UTL will be used as the Pb sediment background value. The Pb soil background value is
22.3 mg/kg or about equal to the sediment value.
Magnesium
All Mg results were detects, and the concentration range is from 170 to 2370 mg/kg. No suspect
values were identified in the Mg probability plots. These data appear to originate from a square
root normal statistical distribution (see probability plots in Appendix E). The UTL value is
2370 mglkg, which is equal to the maximum value. The UTL will be used as the Mg sediment
background value. The Mg soil background value is 4610 mg/kg or about two times the sediment
value.
Manganese
All Mn results were detects, and the concentration range is from 46 to 517 mg/kg. No suspect
values were identified in the Mn box plots or probability plots. These data appear to originate
from a normal statistical distribution (see probability plots in Appendix E). The UTL value is
543 mg/kg, which is roughly 5% greater than the maximum value. The UTL will be used as the
LA-UR-03-2661 70 May2003

I~
...
-"''
....
Canyons Sediment Background Report
Mn sediment background value. The Mn soil background value is 671 mg/kg or about 1.2 times
the sediment value.
Mercury
Three of 24 Hg results were detects, which is not a sufficient detection frequency to permit
calculation of a UTL value. The contract required quantitation limit, 0.1 mg/kg, is proposed as a
background value for Hg. This value is higher than the maximum detected sample result of
0.03 mg/kg. The Hg soil background value is also 0.1 mg/kg, and is also based on the contract
required quantitation limit.
Nickel
Twenty of the 31 Ni results were detects, and the concentration range of detects was 2.5 to
8.9 mg/kg. No suspect values were identified in the Ni probability plots. These data appear to
originate from a normal statistical distribution (see probability plots in Appendix E). The UTL
value is 9.38 mg/kg, which is roughly 5% greater than the maximum value. The UTL will be
used as the Ni sediment background value. The Ni soil background value is 15.4 mg/kg or about
1.6 times the sediment value.
Potassium
All K results were detects, and the concentration range is from 180 to 2600 mg/kg. No suspect
values were identified in the K probability plots. These data appear to originate from a normal
statistical distribution (see probability plots in Appendix E). The UTL value is 2690 mg/kg,
which is roughly 3% greater than the maximum value. The UTL will be used as the K sediment
background value. The K soil background value is 3460 mg/kg or about 1.3 times the sediment
value.
Selenium
None of 24 Se results were detects, which does not allow calculation of a UTL value. The
contract required quantitation limit, 0.3 mg/kg, is proposed as a background value for Se. TheSe
soil background value is 1.52 mg/kg.
Silver
Two of 18 Ag results were detects, which is not a sufficient detection frequency to permit
calculation of a UTL value. The contract required quantitation limit, 1 mg/kg, is proposed as a
LA-UR-03-2661 71 May 2003

Canyons Sediment Background Report
background value for Ag. The Ag soil background value is also 1 mglkg, and is also based on the
contract required quantitation limit.
Sodium
All Na results were detects, and the concentration range of detects was 34 to 1970 mglkg. One
high value was noted in the Na probability plots, but this value did not skew the estimated mean
or standard deviation and was not omitted from the Na background data. These data appear to
originate from a normal statistical distribution (see probability plots in Appendix E). The UTL
value is 1470 mg/kg, which is within the background Na concentration range. The UTL will be
used as the Na sediment background value. The Na soil background value is 915 mglkg or about
two-thirds of the sediment value. Na is one of three metals (uranium and zinc are the others)
where the sediment background value is greater than the soil background value.
Sulfate
Two of the seven sol- results were detects, and the concentration range of detects was 26.5 to
35 mg/kg. This low detection frequency and number of samples should preclude calculation of a
UTL value for this chemical. However, sulfate is not a typical RCRA-contarninant, and a
sediment UTL value is calculated for comparison purposes to other media. Because of the
limited number of samples, it was assumed that sol- data were derived from a normal statistical
distribution. The calculated UTL value is 58.2 mglkg, which is 70% greater than the maximum
sol- result. The UTL will be used as the sol- sediment background value. The sol- soil
background value is 293 mg/kg or about five times the sediment value.
Tantalum
None of seven Ta results were detects, which does not allow calculation of a UTL value. The
soils contract required quantitation limit, 0.3 mg/kg, is proposed as a background value for Ta.
The Ta soil background value is also 0.3 mg/kg, and is also based on the contract required
quantitation limit.
Thallium
Most of the sediment Tl data were produced by ICPES, which has a higher detection limit than
the method used for Tl in soils (ICPMS). Because a more appropriate chemical analysis method
was used for the soils background data, we will use the soil UTL value for this element as the
background value for sediments. Thus, the Tl sediment background value will be 0.73 mg/kg.
LA-UR-03-2661 72 May 2003

-
-
-
Canyons Sediment Background Report
Thorium
Seven of the 24 Th results were detects, which is not a sufficient number of samples to permit calculation of a UTL value. The concentration range forTh of the seven detects was from 0.9 to 7 mg/kg. Because the Th concentrations are expected to be similar between soil and sediment, the soil background will be used as a surrogate for sediment. The soils UTL value, 14.6 mg/kg, is proposed as a background value for Th.
Total Thorium
There are also results for total Th, and the primary use of such data is to establish isotopic abundance of naturally occurring isotopes of thorium and its daughters. Total Th has a unique analyte code in the ER database to avoid confusion with the leachable Th results discussed above. All of the seven total Th results were detects, and the concentration range for total Th was from 3.3 to 18 mg/kg. Because the total Th concentrations are expected to be similar between soil and sediment, the soil background will be used as a surrogate for sediment. The soil UTL value, 22.4 mg/kg, is proposed as a background value for total Th.
Titanium
All of the 24 Ti sample results were detects, and the concentration range for titanium was from 102 to 400 mg/kg. No suspect values were identified in the Ti probability plots. These data appear to originate from a normal statistical distribution (see probability plots in Appendix E). The Ti UTL value is 439 mg/kg, which is roughly 10% greater than the maximum value. The UTL will be used as the Ti sediment background value. There are no soil background data forTi, thus data analysts may want to use the Ti sediment background value as a surrogate background value for Ti in soils.
Uranium
Twenty-eight of the 31 U results were detects, and the concentration range for uranium was from 0.14 to 2 mg/kg. No suspect values were identified in the U probability plots. These data appear to originate from a lognormal statistical distribution (see probability plots in Appendix E). The U UTL value is 2.22 mg/kg, which is roughly 10% greater than the maximum value. The UTL will be used as the U sediment background value. The U soil background value is 1.82 mg/kg or about 80% of the sediment value. U is one of three metals (sodium and zinc are the others) where the sediment background value is greater than the soil background value.
LA-UR-03-2661 73 May 2003

Canyons Sediment Background Report
Total Uranium
There are also results for total U, and the primary use of such data is to establish isotopic
abundance of naturally occurring isotopes of uranium and its daughters. Total U has a unique
analyte code in the ER database to avoid confusion with the leachable U results discussed above.
All of the 31 total uranium results were detects, and the concentration range for total U was from
0.7 to 7.2 mglkg. No suspect values were identified in the total U probability plots. These data
appear to originate from a normal statistical distribution (see probability plots in Appendix E).
The total uranium UTL value is 6.99 mg/kg, which is within the total uranium concentration
range. The UTL will be used as the total U sediment background value. The total U soil
background value is 5.4 mglkg or about 80% of the sediment value. U is one of three metals
(sodium and zinc are the others) where the sediment background value is greater than the soil
background value.
Vanadium
All of the 31 V results were detects, and the concentration range is from 1 to 20 mglkg. No
suspect values were identified in the V probability plots. These data appear to originate from a
normal statistical distribution (see probability plots in Appendix E). The UTL value is
19.7 mglkg, which is within the background V concentration range. The UTL will be used as the
V sediment background value. The V soil background value is 39.6 mg/kg or two times the
sediment value.
Zinc
All of the 31 Zn results were detects, and the concentration range is from 9 to 56.2 mg/kg. No
suspect values were identified in the Zn probability plots. These data appear to originate from a
normal statistical distribution (see probability plots in Appendix E). The UTL value is
60.2 mg/kg, which is roughly 7% greater than the maximum value. The UTL will be used as the
Zn sediment background value. The Zn soil background value is 48.8 mg/kg or about 80% of the
sediment value. Zn is one of three metals (uranium and zinc are the others) where the sediment
background value is greater than the soil background value.
Radionuclides
Americium-241
All of the 24 241 Am results were detects, and the concentration range is from 0.009 to
0.139 pCi/g. The box plots suggest one value for 241Am (sample 04LA-96-0050) was elevated,
and this sample was excluded because of its large influence on summary statistics for this
LA-UR-03-2661 74 May 2003
~'

--
Canyons Sediment Background Report
radionuclide. After excluding this result, the remaining data range from 0.009 to 0.038 pCi/g and appear to originate from a normal statistical distribution (see probability plots in Appendix E).
With this outlier excluded there are no differences between the prehistoric (pre-1943) sample
results and the post-1943 (or fallout affected) sample layers (see Appendix C). Because the ranges of concentrations were similar for the prehistoric and post-1943 sample layers, these data
were included in one data group to improve the statistics for calculating a UTL. The UTL value is 0.040 pCi/g, which is roughly 5% greater than the maximum value. The UTL will be used as the 241 Am sediment background value. The 241 Am soil background value is 0.013 pCi/g, or about 1/3rct of the sediment value. Differences between these background values most likely result from slight differences in the sensitivity and calibration of the 241 Am alpha spectroscopy analyses for
soils compared to sediments, with poorer sensitivity for the sediments. The fact that all results from the sediment samples were detects, including samples from prehistoric deposits and that they appear to represent a normal statistical distribution further suggests an instrument calibration problem with these analyses.
Cesium-137
Seven of the 24 137Cs results were detects, and the concentration range of detects was 0.21 to 1.28 pCi/g. No suspect values were identified in the 137Cs box plots or probability plots. Most of the 137Cs prehistoric (pre-1943) sample results were nondetects, except for a single detected result for sample 04PU-96-0012 from upper Pueblo Canyon. This anomalous detected value was from a coarse-grained deposit at depth and might have resulted from subsurface migration of fallout radionuclides or may instead represent a false detect. Because the ranges of concentrations were similar for the prehistoric and post-1943 sample layers, these data were
included in one data gr~up to improve the statistics for calculating a UTL. These data are best fit by a lognormal statistical distribution (see probability plots in Appendix E). The UTL value is 0.90 pCi/g, which is within the background 137Cs concentration range. The UTL will be used as the 137Cs sediment background value. The 137Cs soil background value is 1.65 pCi/g, or about 1.8
times the sediment background value. This difference is considered to be small compared to
sampling and measurement uncertainties associated with establishing background concentrations of fallout radionuclides.
Plutonium-238
None of the 24 238Pu results were detects, but the 238Pu data were not censored and four values were reported as negative values. Negative values can occur after instrument background values
are subtracted. The 238Pu concentration range was -0.002 to 0.006 pCi/g. No suspect values were identified in the 238Pu box plots or probability plots. These data appear to originate from a normal statistical distribution (see probability plots in Appendix E). The UTL value is 0.006 pCi/g, which is equal to the maximum value. The UTL will be used as the 238Pu sediment
LA-UR-03-2661 75 May 2003
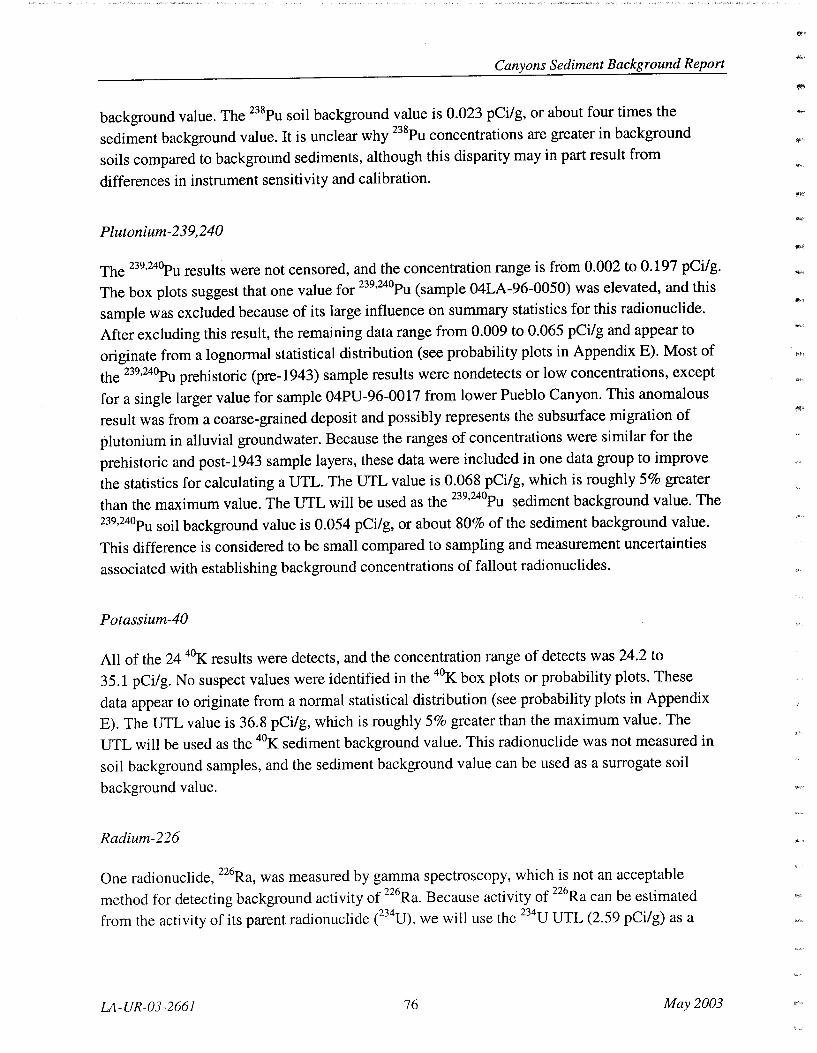
Canyons Sediment Background Report
background value. The 238Pu soil background value is 0.023 pCi/g, or about four times the
sediment background value. It is unclear why 238Pu concentrations are greater in background
soils compared to background sediments, although this disparity may in part result from
differences in instrument sensitivity and calibration.
Plutonium-239,240
The 239•240Pu results were not censored, and the concentration range is from 0.002 to 0.197 pCi/g.
The box plots suggest that one value for 239•240Pu (sample 04LA-96-0050) was elevated, and this
sample was excluded because of its large influence on summary statistics for this radionuclide.
After excluding this result, the remaining data range from 0.009 to 0.065 pCi/g and appear to
originate from a lognormal statistical distribution (see probability plots in Appendix E). Most of
the 239•240Pu prehistoric (pre-1943) sample results were nondetects or low concentrations, except
for a single larger value for sample 04PU-96-0017 from lower Pueblo Canyon. This anomalous
result was from a coarse-grained deposit and possibly represents the subsurface migration of
plutonium in alluvial groundwater. Because the ranges of concentrations were similar for the
prehistoric and post-1943 sample layers, these data were included in one data group to improve
the statistics for calculating a UTL. The UTL value is 0.068 pCi/g, which is roughly 5% greater
than the maximum value. The UTL will be used as the 239'240Pu sediment background value. The
239•240Pu soil background value is 0.054 pCi/g, or about 80% of the sediment background value.
This difference is considered to be small compared to sampling and measurement uncertainties
associated with establishing background concentrations of fallout radionuclides.
Potassium-40
All of the 24 4°K results were detects, and the concentration range of detects was 24.2 to
35.1 pCi/g. No suspect values were identified in the 4°K box plots or probability plots. These
data appear to originate from a normal statistical distribution (see probability plots in Appendix
E). The UTL value is 36.8 pCi/g, which is roughly 5% greater than the maximum value. The
UTL will be used as the 4°K sediment background value. This radionuclide was not measured in
soil background samples, and the sediment background value can be used as a surrogate soil
background value.
Radium-226
One radionuclide, 226Ra, was measured by gamma spectroscopy, which is not an acceptable
method for detecting background activity of 226Ra. Because activity of 226Ra can be estimated
from the activity of its parent radionuclide e34U), we will use the 234U UTL (2.59 pCi/g) as a
LA-UR-03-2661 76 May2003

---
·-
Canyons Sediment Background Report
background value for 226Ra. This radionuclide was not measured in soil background samples, and
the sediment background value can be used as a surrogate soil background value.
Radium-228
Radium-228 was not measured in any sediment background samples, but it is important when
evaluating human health and ecological effects. The activity of 228Ra can be estimated from the activity of its parent radionuclide CZ32Th). Thus, we will use the 232rh UTL (2.33 pCi/g) as a background value for 228Ra. This radionuclide was not measured in soil background samples, and the sediment background value can be used as a surrogate soil background value.
Strontium-90
None of the 24 90Sr results were detects, and the concentration range of nondetects was -0.3 to 1 pCi/g. The 90Sr data were not censored and were used without replacement in the probability plots. These data appear to originate from a normal statistical distribution (see probability plots in Appendix E). The calculated UTL value is 1.04 pCi/g, which is 4% greater than the maximum value. The UTL will be used as the 90Sr sediment background value. The 90Sr soil background value is 1.31 pCi/g or about 1.2 times the sediment background value. This difference is considered to be small compared to sampling and measurement uncertainties associated with establishing background concentrations of fallout radionuclides.
Thorium-228
All of the 24 228Th results were detects, and the concentration range of detects was 0. 7 to 2.12 pCi/g. No suspect values were identified in the 228Th probability plots. These data appear to originate from a normal statistical distribution (see probability plots in Appendix E). The UTL value is 2.28 pCi/g, which is roughly 8% greater than the maximum value. The UTL will be used as the 228Th sediment background value. This radionuclide was not measured in soil background
samples, and the sediment background value can be used as a surrogate soil background value.
Thorium-230
All of the 24 230Th results were detects, and the concentration range of detects was 0.69 to 2.12 pCi/g. No suspect values were identified in the 230Th probability plots. These data appear to originate from a normal statistical distribution (see probability plots in Appendix E). The UTL value is 2.29 pCi/g, which is roughly 8% greater than the maximum value. The UTL will be used
as the 230Th sediment background value. This radionuclide was not measured in soil background samples, and the sediment background value can be used as a surrogate soil background value.
I.A-UR-03-2661 77 May 2003
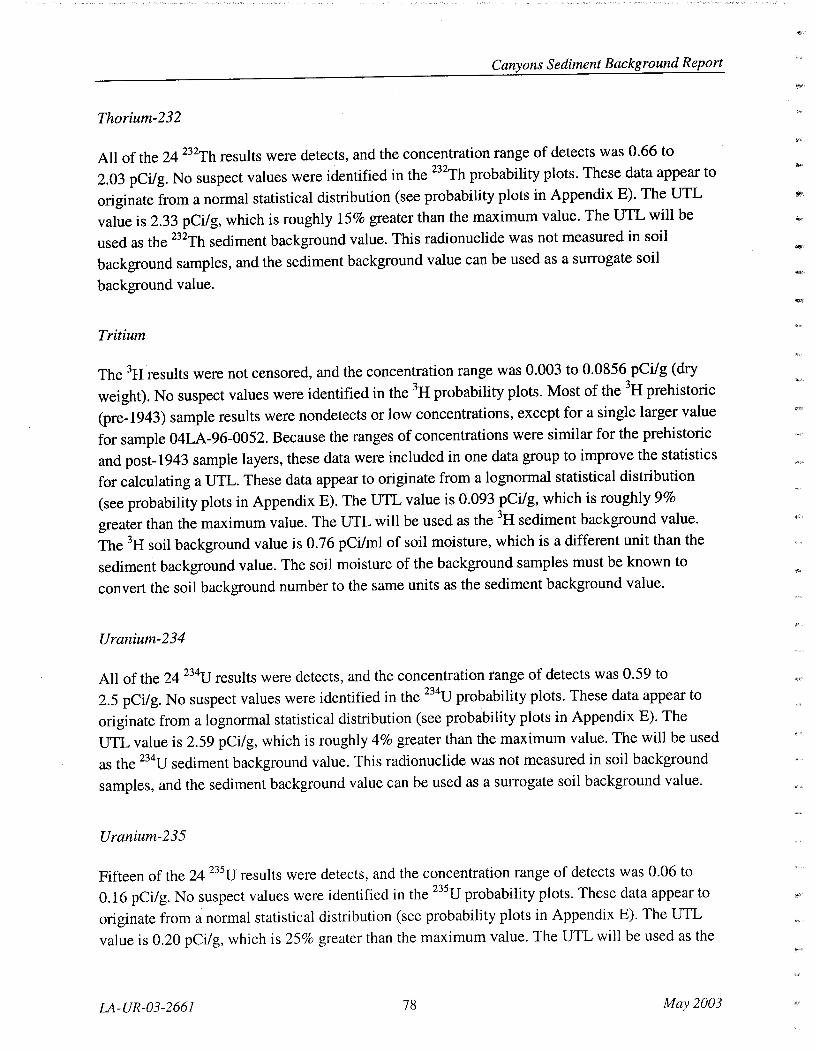
Canyons Sediment Background Report
Thorium-232
All of the 24 23Zrh results were detects, and the concentration range of detects was 0.66 to
2.03 pCi/g. No suspect values were identified in the 232Th probability plots. These data appear to
originate from a normal statistical distribution (see probability plots in Appendix E). The UTL
value is 2.33 pCi/g, which is roughly 15% greater than the maximum value. The UTL will be
used as the 23Zrh sediment background value. This radionuclide was not measured in soil
background samples, and the sediment background value can be used as a surrogate soil
background value.
Tritium
The 3H results were not censored, and the concentration range was 0.003 to 0.0856 pCi/g (dry
weight). No suspect values were identified in the 3H probability plots. Most of the 3H prehistoric
(pre-1943) sample results were nondetects or low concentrations, except for a single larger value
for sample 04LA-96-0052. Because the ranges of concentrations were similar for the prehistoric
and post-1943 sample layers, these data were included in one data group to improve the statistics
for calculating a UTL. These data appear to originate from a lognormal statistical distribution
(see probability plots in Appendix E). The UTL value is 0.093 pCi/g, which is roughly 9%
greater than the maximum value. The UTL will be used as the 3H sediment background value.
The 3H soil background value is 0.76 pCilml of soil moisture, which is a different unit than the
sediment background value. The soil moisture of the background samples must be known to
convert the soil background number to the same units as the sediment background value.
Uranium-234
All of the 24 234U results were detects, and the concentration range of detects was 0.59 to
2.5 pCi/g. No suspect values were identified in the 234U probability plots. These data appear to
originate from a lognormal statistical distribution (see probability plots in Appendix E). The
UTL value is 2.59 pCi/g, which is roughly 4% greater than the maximum value. The will be used
as the 234U sediment background value. This radionuclide was not measured in soil background
samples, and the sediment background value can be used as a surrogate soil background value.
Uranium-235
Fifteen of the 24 235U results were detects, and the concentration range of detects was 0.06 to
0.16 pCilg. No suspect values were identified in the 235U probability plots. These data appear to
originate from a normal statistical distribution (see probability plots in Appendix E). The UTL
value is 0.20 pCi/g, which is 25% greater than the maximum value. The UTL will be used as the
LA-UR-03-2661 78 May2003

-...
Canyons Sediment Background Report
235U sediment background value. This radionuclide was not measured in soil background
samples, and the sediment background value can be used as a surrogate soil background value.
Uranium-238
Twenty-two of the 24 238U results were detects, and the concentration range of detects was 0.51 to 2.1 pCi/g. One suspect nondetect value was noted with a concentration of 0.06 pCi/g, but this value was judged not to interfere with estimating the mean and standard deviation of the 238U sample data. These data appear to originate from a normal statistical distribution (see probability plots in Appendix E). The UTL value is 2.29 pCi/g, which is roughly 9% greater than the maximum value. The UTL will be used as the 238U sediment background value. This radionuclide was not measured in soil background samples, and the sediment background value can be used as a surrogate soil background value.
IMPLICATIONS FOR SEDIMENT SAMPLING AND STATISTICS
The UTLs calculated from these samples will be useful in making initial background comparisons. Statistical analysis indicates that (1) leachable elemental concentrations have lower concentrations and less variability than LANL-wide background soil leachable elemental concentrations and (2) minimal variation occurs among the five canyons sampled. Minimal variation among concentrations of inorganic, organic, and radionuclide constituents indicates that the current background sediment sample set may be adequate for determining LANL-wide UTLs for most additional Canyons investigation activities. Other statistical tests may also be used, as needed, to support the Canyons investigations.
Results also indicate that the particle-size distribution and geomorphic setting may have a potentially strong influence on contaminant concentrations downstream or downwind from release sites. Analytical results indicate that concentrations of most analytes increase as silt and clay contents increase. This increase occurs because silt- and clay-size particles have higher
surface areas that are largely more chemically active than sand- and gravel-size particles. Results of textural analysis indicate that sediments deposited on floodplains generally have more silt and
clay; therefore, it is likely that these geomorphic units may have a greater potential for storing contaminants relative to stream channels. Fine-grained sediment, however, can also be deposited
in channels and within coarse sediments on floodplains.
The overall results from this background investigation strongly indicate that sample sites should
be carefully selected when evaluating contaminant concentrations, location, and inventory. Detailed documentation of the geomorphic setting and recognition of the history of
sedimentation will also be important. Sediments samples should represent both channel and floodplain depositional environments, especially identification of areas away from marginal
LA-UR-03-2661 79 May2003

Canyons Sediment Background Report
floodplains that may have received sediment during large floods. Understanding geomorphic
setting and sediment texture will enhance identification of dispersal of potential contaminants.
MORE RECENT BACKGROUND STUDIES
Since the time this study was completed and the resultant background values were proposed in
Ryti et al. (1998), several additional studies have been conducted that are relevant to
understanding background concentrations in sediments in this area. These studies are briefly
discussed below.
During an investigation of potential contamination in sediments in Cafiada del Buey near White
Rock (Drakos et al., 2000), a series of inorganic chemicals were detected at levels above the
background values proposed in this study. To test the hypothesis that these samples represented a
local background that was naturally different from previously sampled areas, samples were
collected from 12 sites along local drainages that were supplying sediment to Cafiada del Buey
from adjacent eroding slopes. These samples confirmed that locally derived sediments had
elevated concentrations of the following metals: Ba, Co, Cu, Fe, Mn, Se, Tl, and V. It is believed
that these geochemical differences probably reflect erosion of relatively old, eolian-derived soils
on this part of the Pajarito Plateau, although the presence of basalt (absent from previously
sampled areas) may also contribute to these geochemical differences. Importantly, these findings
indicate that local variations in background geochemistry exist that should be considered in
evaluations of potential contamination.
The Cerro Grande fire of May 2000 had a major impact on many watersheds that drain the
eastern Jemez Mountains and the Pajarito Plateau. After the fire, samples of ash, reworked ash
(muck), and sediments containing components of ash were collected in part to understand the
impact of the fire on concentrations of various analytes that were independent of possible effects
of remobilizing contaminants released from LANL sources (e.g., Katzman et al., 2001; Kraig et
al., 2002). This work has shown that the concentrations of fallout radionuclides (e.g., 137Cs, 239
•240p d 90S ) d 1 (AI A B C C C C F Pb M M N. u, an r an many meta s , s, a, a, r, o, u, e, , g, n, 1, K, Se, V,
and Zn) are elevated in ash, muck, and post-fire sediments containing ash as compared to pre-fire
background levels. Evaluations of potential contamination in sediments downstream of burned
areas should, therefore, take into account the possibility that certain analytes may have elevated
values compared to the background values developed in this study.
A statistical evaluation of radionuclide concentrations in sediment samples collected from rivers
and reservoirs in northern New Mexico and southern Colorado from 1974 to 1997 was used to
estimate upper levels of background in these settings (McLin and Lyons, 2002). This work
indicates that estimated background levels vary between river and reservoir sediments and
between these settings and sediments collected from smaller drainages on the Pajarito Plateau.
LA-UR-03-2661 80 May 2003
"'"

Canyons Sediment Background Report
This work also indicates that the estimated upper levels of background can vary with the method of calculation. The largest difference between the study of McLin and Lyons (2002) and this study of sediments from the Pajarito Plateau is the estimated upper background level for 239
•240Pu, which is larger for the Pajarito Plateau sediments. Although it was suggested that this
difference is most likely caused by elevated detection limits in the samples collected from the Pajarito Plateau (cited to be 0.1 pCi/g, McLin and Lyons, 2002, p. 26), the typical detection limit for 239
•240Pu in this Pajarito Plateau data set, -0.01 pCi/g, is significantly below the calculated
background value and is adequate for the purposes of this study. We feel that these differences in estimates of the upper limit of background more likely relate to other factors, including higher local input of fallout radionuclides associated with higher annual precipitation near LANL, or contributions from LANL stack emissions and/or fugitive dust from LANL, as proposed by Fresquez et al. (1998). Additional factors may include variable dilution of fallout radionuclides between large and small drainage basins or statistics related to the random sampling of relatively high values in a non-normally distributed data set.
ACKNOWLEDGMENTS
This work was supported by the Los Alamos National Laboratory Environmental Restoration Project through the Canyons Focus Area. The authors thank Allyn Pratt and Dave Broxton for their support throughout this work; Jenny Kofoed for assistance in sediment sampling; Dave Hunter, Darrio Rocha, and John Taylor for field radiation measurements; Anthony Garcia, Marcia Jones, Rick Kelley, Pam Maestas, and Meena Sachdeva for support with graphics, compositing, and editing; and Pat Longmire, Steve McLin, and Lars Soholt for helpful review comments.
REFERENCES
ASTM (American Society for Testing and Materials), 1990, Standard test method for particlesize analysis of soils: ASTM Method D 422, Annual Book of ASTM Standards, v. 04.08.
Box, G. E. P, and Cox, D. R., 1964, An analysis of transformations: Journal of the Royal Statistical Society, v. B43, p. 177-182.
Campbell, K., 1998, Baseline data for fallout radionuclides at LANL: Los Alamos National Laboratory report LA-UR-98-0958, Los Alamos, New Mexico.
Drakos, P., Ryti, R., Reneau, S., and Greene, K., 2000, Evaluation of possible sediment contamination in the White Rock land transfer parcel: Reach CDB-4: Los Alamos National Laboratory report LA-UR-00-5071, Los Alamos, New Mexico.
LA-UR-03-2661 81 May2003

Canyons Sediment Background Report
EPA (Environmental Protection Agency), 1986, Test methods for evaluating solid waste.
Volume 1A; in Laboratory Manual, Physical/Chemical Methods, SW -846, Third Edition: Office
of Solid Waste, Waste Management Division, U.S. Environmental Protection Agency,
Washington D.C.
EPA (Environmental Protection Agency), 1989, Statistical Analysis of Ground-Water
Monitoring Data at RCRA Facilities. Interim Final Guidance: Office of Solid Waste, Waste
Management Division, U.S. Environmental Protection Agency, Washington D.C.
EPA (Environmental Protection Agency), 1992, Guidance for data usability in risk assessment
(Part A): Office of Emergency Remedial Response, U.S. Environmental Protection Agency,
Washington D.C.
Fresquez, P.R., Armstrong, D. R., and Mullen, M.A., 1998, Radionuclides in soils collected
from within and around Los Alamos National Laboratory: 1974-1996: Journal of Environmental ·
Science and Health, v. A33, no. 2, p. 263-278.
Gilbert, R. 0., 1987, Statistical Methods for Environmental Pollution Monitoring: Von Nostrand
Reinhold Company, Inc., New York, 320 p.
Katzman, D., Ryti, R., and Reneau, S., 2001, Cerro Grande ash as a source of elevated
radionuclides and metals, in Water, Watersheds, and Land Use in New Mexico, Impacts of
Population Growth on Natural Resources: Johnson, P. S. (Ed.), New Mexico Bureau of Mines
and Mineral Resources, Decision-Makers Field Guide 1, p. 45--47.
Kraig, D., Ryti, R., Katzman, D., Buhl, T., Gallaher, B., and Fresquez, P., 2002, Radiological
and nonradiological effects after the Cerro Grande fire: Los Alamos National Laboratory report
LA-13914, Los Alamos, New Mexico.
LANL (Los Alamos National Laboratory), 1995, Task/Site Work Plan for Operable Unit 1049,
Los Alamos Canyon and Pueblo Canyon, Environmental Restoration Project: Los Alamos
National Laboratory report LA-UR-95-2053, Los Alamos, New Mexico.
LANL (Los Alamos National Laboratory), 1997, Core Document for Canyons Investigations:
Los Alamos National Laboratory report LA-UR-96-2083, Los Alamos, New Mexico.
Longmire, P. A., McDonald, E. V., Ryti, R. T., Reneau, S. L., and Watt, P.M., 1995, Natural
background geochemistry and statistical analysis of selected soil profiles, Los Alamos, New
Mexico: Los Alamos National Laboratory report LA-UR-95-3468, Los Alamos, New Mexico.
LA-UR-03-2661 82 May 2003

Canyons Sediment Background Report
McLin, S. G., and Lyons. D. W., 2002, Background radioactivity in river and reservoir sediments
near Los Alamos, New Mexico: Los Alamos National Laboratory report LA-13603-MS, Los
Alamos, New Mexico, 99 p.
Parrington, J. R., Knox, H. D., Breneman, S. L., Baum, E. M., and Feiner, F., 1996. Nuclides and
Isotopes, Chart of the Nuclides, 15th Ed., General Electric Co. and KAPL, Inc., San Jose,
California.
Reneau, S. L., Campbell, K., Longmire, P., and McDonald, E., 1998, Geochemistry of
background sediment samples at Technical Area 39, Los Alamos National Laboratory: Los
Alamos National Laboratory Report LA-13535-MS, Los Alamos, New Mexico, 26 p.
Ryti, R., Longmire, P., and McDonald, E., 1996, Application ofLANL Background Data to ER Project Decision-Making Part I: Inorganics: Los Alamos National Laboratory report LA-UR-96-1534, Los Alamos, New Mexico.
Ryti, R. T.: Longmire, P. A., Broxton, D. E., Reneau, S. L., and McDonald, E. V., 1998,
Inorganic and radionuclide background data for soils, canyon sediments, and Bandelier Tuff at Los Alamos National Laboratory: Los Alamos National Laboratory report LA-UR-98-4847, Los
Alamos, New Mexico, 51 p.
Smith, R. L., Bailey, R. A., and Ross, C. C., 1970, Geologic map of the Jemez Mountains, New Mexico: U.S. Geological Survey, Miscellaneous Geologic Investigations Map I-571.
Wolter, K. M., 1985, Introduction to Variance Estimation: Springer-Verlag, New York, 427 p.
Yu, C., Zielen, A. J., Cheng, J. J., Yuan, Y.C., Jones, L. G., LePoire, D. J., Wang, Y. Y.,
Loueiro, C. 0., Gnanapragasam, E., Faillace, E., Wallo, A., III, Williams, W. A., and Peterson,
H., 1993, A Manual for Implementing Residual Radioactive Material Guidelines Using RESRAD, Version 5.0: ANUEAD/LD-2, Environmental Assessment Division, Argonne
National Laboratory, Argonne, Illinois.
LA-UR-03-2661 83 May 2003

Canyons Sediment Background Report
APPENDIX A SEDIMENT SAMPLE PRETREATMENT AND PARTICLE-SIZE
DISTRIBUTION ANALYSIS FOR CANYONS BACKGROUND
SEDIMENTS
This appendix addresses sample pretreatment and particle-size distribution analysis (PSDA) data
requirements for background Sydiment samples sent to Rust-Geotech from Los Alamos National
Laboratory (LANL). Samples required (1) sample preparation consisting of drying sample,
sieving to remove >2-mm size fraction, sample splitting into smaller portions for additional
physical and chemical analysis, and (2) PSDA.
1.0 OVERVIEW OF SAMPLE PRETREATMENT
Samples had an initial pretreatment consisting of preparation of four sample splits for the
following analyses: (1) tritium, (2) PSDA, (3) X-ray fluorescence (XRF), and (4) radiochemical
plus chemical analyses. The sample split for tritium analysis was removed first before drying and
sieving of sample. The other splits were removed following sample drying and sieving to remove
the >2-mm size fraction. A few of the samples also received additional rad and chemical
analyses on the silt+ clay ( <0.0625 mm) size fraction.
2.0 SAMPLE MIXING
In some cases, sediment samples were shipped in more than one sample container (i.e., two or
three 2-L plastic bottles per sample). For samples shipped in more than one container, samples
were first mixed before any sample splits were removed or before samples were dried and
sieved.
3.0 SAMPLES FOR TRITIUM ANALYSIS
A sample split of about 500 g was removed from samples for tritium analysis. This sample split
was removed after all sample was combined (if shipped in more than one container) and before
sample drying and sieving. The sample was then analyzed for tritium according to procedures
previously specified by LANL. If the sample was very dry, a determination of moisture content
was performed and the amount needed for tritium analysis was calculated. If there was
insufficient sample for all four splits, the split for tritium analysis was eliminated.
3.1 Determining Percent >2-mm Size Fraction
After tritium analysis, samples were sieved to remove and determine the percent weight
abundance of the >2-mm size fraction.
LA-UR-03-2661 A-1 May 2003

Canyons Sediment Background Report
4.0 SAMPLE DRYING
Sediment samples were spread across a clean sheet of plastic or butcher paper, or across a clean plastic or metal tray. Samples were spread to a depth of less than about 2 em and allowed to air dry at about 20°C or higher for about 24 hours. The air-dried sample was weighed to the nearest 1 g after air drying.
5.0 SAMPLE SIEVING TO REMOVE THE >2-MM SIZE FRACTION
Samples were sieved to remove the >2-mm size fraction (gravel and stones) and large pieces of nonmineral debris (roots, inorganic trash, etc.). All samples were sieved using a sieve with a mesh size of 2-mm (US standard sieve mesh No. 10). The <2-mm (fine earth) fraction was weighed to the nearest 1.0 g and the weight recorded. The >2-mm (coarse) size fraction was stored in a labeled plastic bag for return to LANL. Sieves were thoroughly cleaned between each sample (using the best combination of brushing, compressed air, and/or washing with deionized water) to remove trapped particles.
5.1 Homogenize Sample
The <2-mm sample was mixed together using appropriate methods to homogenize sample. The technique used to homogenize sample minimized physical disintegration of samples. Implements used to homogenize samples were thoroughly cleaned between each sample.
6.0 SAMPLE SPLITTING
Samples were split into representative portions using a standard soil/sediment splitter. The splitter was thoroughly cleaned between each sample (using the best combination of brushing, compressed air, and/or washing with deionized water) to remove trapped particles. Samples were split into representative fractions for each set of chemical and rad analyses so that sample splits adequately represented the chemical and physical composition of the original sample. Weights required for each analysis were determined.
6.1 XRF Sample Split for LANL
In addition to sample splits for analyses, a separate sample split of about 25 g was removed and sent back to LANL for XRF analysis.
LA-UR-03-2661 A-2 May 2003

Canyons Sediment Background Report
7.0 SEDIMENT PARTICLE-SIZE DISTRIBUTION ANALYSIS
General procedures for sediment size analysis as specified under general American Society for
Testing and Materials (ASTM) procedures were used for determining PSDA of sediment
samples.
7.1 Sand-Size Analysis
Sand-size analysis was determined using standard ASTM dry-sieving procedures specified.
Sands were sieved using a set of sieves at one-phi intervals consisting of
phi range size range (mm)
0 1.0
1 0.5
2 0.25
3 0.125
4 0.0625
Weight percent and sample weights for each sieved fraction, including the <0.0625 fraction
caught in bottom sieve pan, were reported.
7.2 Silt- and Clay-Size Analysis
Silt- and clay-size analysis was determined using standard hydrometer procedures. Distribution
of the following size fractions were determined:
particle range phi range size range (mm)
Coarse and medium silt 4-6 0.0625-0.015
Fine and very fine silt 6-9 0.015-0.002
Clay <9 <0.002
LA-UR-03-2661 A-3 May 2003

Canyons Sediment Background Report
8.0 DOCUMENTATION
Laboratory data for particle-size distribution included the following:
(1) Percentage of sample passing (or retained on) each sieve, or determined from hydrometer
readings. Data were reported in both tabular and graphical form. Data included
Total Sample
• Total weight of air dry sample
• Weight of air dry sample fine earth fraction ( <2 mm)
• Percent weight gravel (>2-mm fraction)
• Percent weight of all sand-size fractions and remaining silt fraction from dry
sieving
• Percent weight of clay- and silt-sized fractions from hydrometer analysis
Tritium Sample
• Percent weight gravel (>2-mm fraction)
(2) Statistical and graphical interpretation including graphic mean, standard deviation, skewness, and kurtosis following data interpretation.
9.0 SEDIMENT SAMPLE PRETREATMENT FOR SELECTED SAMPLES FOR DETERMINING CHEMISTRY IN <0.0625-MM FRACTION
This section addresses additional sample pretreatment of a selected subset of sediment and soil
samples sent from LANL. This additional pretreatment consisted of additional sample sieving to
remove the >0.0625-mm fraction. These samples were split from the sample that remained
following the sample splitting and sieving discussed above. Additional chemical and rad
analyses were conducted on the <0.0625-mm fraction. The purpose of these analyses was to
compare the concentrations of important constituents associated with the silt- and clay-sized
particles.
9.1 Sieving of Selected Samples to Remove >0.0625-mm Fraction
Samples sieved to remove the >0.0625-mm fraction were split from surplus sample that was
leftover from initial sample pretreatment and splitting (sample that had been previously air-dried
and sieved through a 2-mm sieve). Samples were dry-sieved. Both fractions (>0.0625 mm and
LA-UR-03-2661 A-4 May 2003
Canyons Sediment Background Report
<0.0625 mm) were weighed to the nearest 0.1 g after sieving and sample weights were recorded.
Sieves were thoroughly cleaned between each sample (using the best combination of brushing,
compressed air, and/or washing with deionized water) to remove trapped particles.
9.2 Sample Splitting
Samples sieved to remove the >0.0625-mm fraction were split into representative portions using
a standard soil/sediment splitter. Splitter was thoroughly cleaned between each sample (using the
best combination of brushing, compressed air, and/or washing with deionized water) to remove
trapped particles. Samples were split into representative fractions for each set of chemical and
rad analyses so that sample splits adequately represented the chemical and physical composition
of the original sample. Weights were obtained for each analysis.
10.0 REMAINING SAMPLE
Any remaining sample sieved to remove the >2-mm size fraction, excluding sample splits used
for tritium and hydrometer analyses, were shipped back to LANL.
11.0 QUALITY ASSURANCE
A preparation blank sample consisting of high purity quartz sand (or equivalent) was prepared
with each batch of LANL samples. The blank sample was air-dried, sieved through a 2-mm
sieve, and split for analysis of radionuclides (isotopic plutonium, isotopic uranium, gamma
spectroscopy) and trace metals. The preparation blank sample results were reported with the data
for each analytical suite.
LA-UR-03-2661 A-5 May 2003
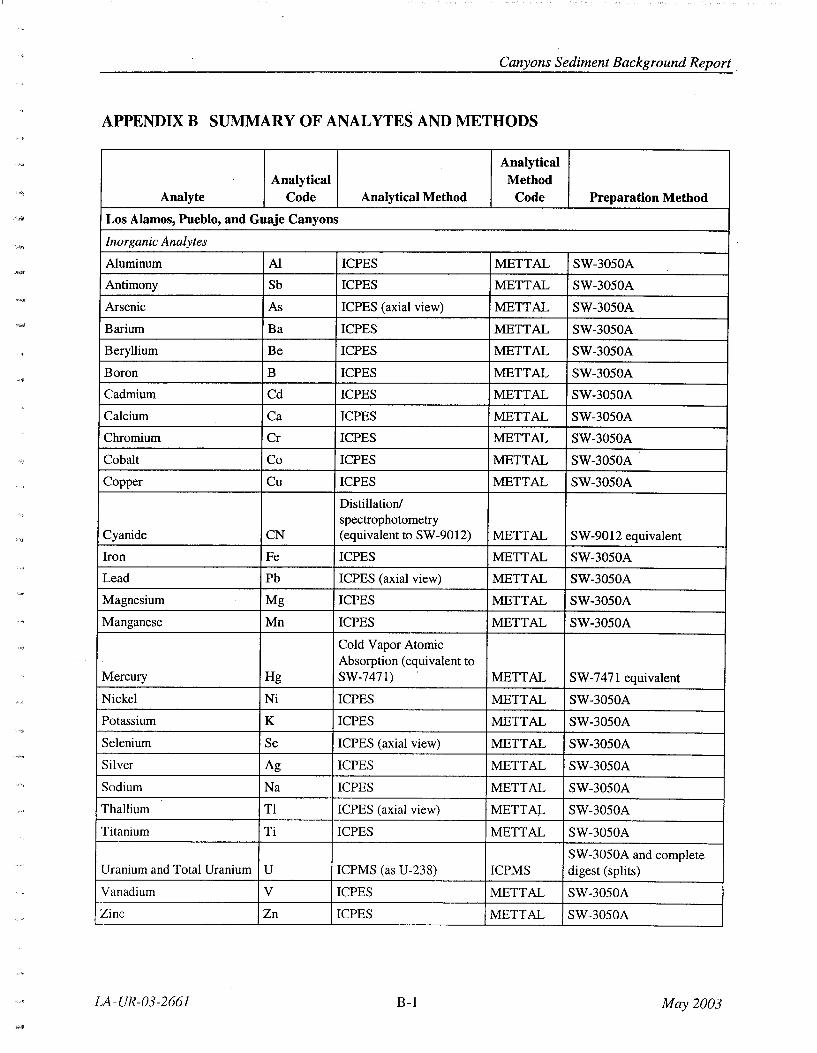
Canyons Sediment Background Report
APPENDIX B SUMMARY OF ANALYTES AND METHODS
Analytical Analytical Method
Analyte Code Analytical Method Code Preparation Method
Los Alamos, Pueblo, and Guaje Canyons
Inorganic Analytes
Aluminum AI ICPES METTAL SW-3050A
Antimony Sb ICPES METTAL SW-3050A
Arsenic As ICPES (axial view) METTAL SW-3050A
Barium Ba ICPES METTAL SW-3050A
Beryllium Be ICPES METTAL SW-3050A
Boron B ICPES METTAL SW-3050A
Cadmium Cd ICPES METTAL SW-3050A
Calcium Ca ICPES METTAL SW-3050A
Chromium Cr ICPES METTAL SW-3050A
Cobalt Co ICPES METTAL SW-3050A
Copper Cu ICPES METTAL SW-3050A
Distillation/ spectrophotometry
Cyanide CN (equivalent to SW-9012) METTAL SW-9012 equivalent
Iron Fe ICPES METTAL SW-3050A
Lead Pb ICPES (axial view) METTAL SW-3050A
Magnesium Mg ICPES METTAL SW-3050A
Manganese Mn ICPES METTAL SW-3050A
Cold Vapor Atomic Absorption (equivalent to
Mercury Hg SW-7471) METTAL SW-7471 equivalent
Nickel Ni ICPES METTAL SW-3050A
Potassium K ICPES METTAL SW-3050A
Selenium Se ICPES (axial view) METTAL SW-3050A
Silver Ag ICPES METTAL SW-3050A
Sodium Na ICPES METTAL SW-3050A
Thallium Tl ICPES (axial view) METTAL SW-3050A
Titanium Ti ICPES METTAL SW-3050A
SW-3050A and complete Uranium and Total Uranium u ICPMS (as U-238) ICPMS digest (splits)
Vanadium v ICPES METTAL SW-3050A
Zinc Zn ICPES METTAL SW-3050A
LA-UR-03-2661 B-1 May 2003

Canyons Sediment Background Report
Analytical
Analytical Method
Analyte Code Analytical Method Code Preparation Method
Radionuclides
Gross Alpha ALPHA Gas Proportional Counting GROSSAB None
Gross Beta BETA Gas Proportional Counting GROSSAB None
Liquid Scintillati9n
Tritium H-3 Counting H3 Distillation
Actinium-228 Ac-228 Gamma spectroscopy GSCAN None
Americium-241 Am-241 Alpha spectrometry AM241 Complete digest
Americium-241 Am-241 Gamma spectroscopy GSCAN None
Barium-140 Ba-140 Gamma spectroscopy GSCAN None
Bismuth-211 Bi-211 Gamma spectroscopy GSCAN None
Bismuth-212 Bi-212 Gamma spectroscopy GSCAN None
Bismuth-214 Bi-214 Gamma spectroscopy GSCAN None
Cadmium-109 Cd-109 Gamma spectroscopy GSCAN None
Cerium-139 Ce-139 Gamma spectroscopy GSCAN None
Cesium-134 Cs-134 Gamma spectroscopy GSCAN None
Cesium-137 Cs-137 Gamma spectroscopy GSCAN None
Cobalt-57 Co-57 Gamma spectroscopy GSCAN None
Cobalt-60 Co-60 Gamma spectroscopy GSCAN None
Europium-152 Eu-152 Gamma spectroscopy GSCAN None
lodine-129 1-129 Gamma spectroscopy GSCAN None
Lanthani um-140 La-140 Gamma spectroscopy GSCAN None
Lead-210 Pb~210 Gamma spectroscopy GSCAN None
Lead-211 Pb-211 Gamma spectroscopy GSCAN None
Lead-212 Pb-212 Gamma spectroscopy GSCAN None
Lead-214 Pb-214 Gamma spectroscopy GSCAN None
Manganese-54 Mn-54 Gamma spectroscopy GSCAN None
Mercury-203 Hg-203 Gamma spectroscopy GSCAN None
Neptunium-237 Np-237 Gamma spectroscopy GSCAN None
Plutonium-238 Pu-238 Alpha spectrometry ISOPU Complete digest
Plutonium-239,240 Pu-239/240 Alpha spectrometry ISOPU Complete digest
Potassium-40 K-40 Gamma spectroscopy GSCAN None
Protactinium-231 Pa-231 Gamma spectroscopy GSCAN None
Protactinium-233 Pa-233 Gamma spectroscopy GSCAN None
Protactini urn-234M Pa-234M Gamma spectroscopy GSCAN None
Radium-223 Ra-223 Gamma spectroscopy GSCAN None
Radium-224 Ra-224 Gamma spectroscopy GSCAN None
LA-UR-03-2661 B-2 May 2003

Canyons Sediment Background Report
Analytical Analytical Method
Analyte Code Analytical Method Code Preparation Method
Radium-226 Ra-226 Gamma spectroscopy GSCAN None
Radon-219 Rn-219 Gamma spectroscopy GSCAN None
Ruthenium-! 06 Ru-106 Gamma spectroscopy GSCAN None
Selenium-75 Se-75 Gamma spectroscopy GSCAN None
Sodium-22 Na-22 Gamma spectroscopy GSCAN None
Strontium-85 Sr-85 Gamma spectroscopy GSCAN None
Strontium-90 Sr-90 Gas Proportional Counting SR90 Cone. HN03 digest
Thallium-208 Tl-208 Gamma spectroscopy GSCAN None
Thorium-227 Th-227 Gamma spectroscopy GSCAN None
Thorium-228 Th-228 Alpha spectrometry ISOTH Complete digest
Thorium-230 Th-230 Alpha spectrometry ISOTH Complete digest
Thorium-232 Th-232 Alpha spectrometry ISOTH Complete digest
Thorium-234 Th-234 Gamma spectroscopy GSCAN None
Tin-113 Sn-113 Gamma spectroscopy GSCAN None
ICPMS (with Flow Uranium-234 U-234 Injection Analysis) ICPMS Complete digest
Uranium-235 U-235 ICPMS ICPMS Complete digest
Uranium-235 U-235 Gamma spectroscopy GSCAN None
Uranium-238 U-238 ICPMS ICPMS Complete digest
Yttrium-88 Y-88 Gamma spectroscopy GSCAN None
Zinc-65 Zn-65 Gamma spectroscopy GSCAN None
Ancho and Indio Canyons
Inorganic Analytes
Aluminum AI ICPES SW-3050A and HF (splits)
Antimony Sb ICPES SW-3050A and HF (splits)
Graphite Furnace Atomic Arsenic As Absorption SW-3050A and HF (splits)
Barium Ba ICPES SW-3050A and HF (splits)
Beryllium Be ICPES SW-3050A and HF (splits)
Calcium Ca ICPES SW-3050A and HF (splits)
Chloride Cl Ion Chromatography Deionized water leach
Chromium Cr ICPES SW-3050A and HF (splits)
Cobalt Co ICPES SW-3050A and HF (splits)
Copper Cu ICPES SW-3050A and HF (splits)
Iron Fe ICPES SW-3050A and HF (splits)
Lead Pb ICPES SW-3050A and HF (splits)
Magnesium Mg ICPES SW-3050A and HF (splits)
LA-UR-03-2661 B-3 May 2003

1!':
Canyons Sediment Background Report
Analytical
Analytical Method
Analyte Code Analytical Method Code Preparation Method
Manganese Mn ICPES SW-3050A and HF (splits)
Nickel Ni ICPES SW-3050A and HF (splits)
Potassium K ICPES SW-3050A and HF (splits)
Sodium Na ICPES SW-3050A and HF (splits)
Sulfate S04 Ion Chromatography Deionized water leach
Tantalum Ta ICPMS SW-3050A and HF (splits)
Thallium Tl ICPMS SW-3050A and HF (splits)
Thorium and Total Thorium Th ICPMS SW-3050A and HF (splits)
Uranium and Total Uranium u ICPMS SW-3050A and HF (splits)
Vanadium v ICPES SW-3050A and HF (splits)
Zinc Zn ICPES SW-3050A and HF (splits)
LA-UR-03-2661 B-4 May 2003

~ '
~ ~ ' N
~ ........
(1 ' ......
~ N
§
l
APPENDIX C ALL ANALYTICAL RESULTS
~ ~ ~ - :a Q,l
'"' - ~~ IS Q,l
Q,l = V3s !5 Q.. 0 0 = t)f) ...
~ a -< -.... so = s = = ~ 0 Q,l '-" = ... 0 0 Q,l rJ') rJ') ~ ~
FS2220 16425 FP <2 NA
FS2221 16425 FP <0.075 NA
FS2222 16425 FP 0.075--0.25 NA
FS2224 16425 AC <2 NA
FS2225 (x) 16400 AC <2 NA
FS2226 16387 FP <2 NA
FS2227 A6228 PFP <2 NA
FS2228 A6228 PC <2 NA
FS2229 A6295 FP <2 NA
FS2230 A6295 FP <0.075 NA
FS2231 A6295 FP 0.075--0.25 NA
FS2233 A6295 AC <2 NA
FS2234 16425 FP 0.25-2 NA
FS2235 A6295 FP 0.25-2 NA
04GU-96-0001 GU-0001 FP <2 NA
04GU-96-0002 GU-0002 AC <2 NA
04GU-96-0003 GU-0003 FP <2 NA
04GU-96-0004 GU-0004 PFP <2 NA
04GU-96-0004 GU-0004 PFP <0.0625 NA
04GU-96-0005 GU-0005 AC <2 NA
04GU-96-0006 GU-0006 PFP <2 NA - -- -
'"' Q,l
!5 - <ll -< -< -; = 0
4500 1.5
7300 3
6900 2
740 0.5 u 1400 1
8400 3
7700 2
2300 0.9
7000 2
6800 2
7600 3
930 0.5 u 3200 1
4100 1
NA 1.2
NA 1.7
NA 0.76
NA 1.5
NA 1.1
NA 0.3
NA 1.7
'"' '"' Q,l Q,l
IC !5 ~ = = Q,l = ~ ~ -; u = = = 0 0
NA 53.5 0.545 1250
NA 99 0.89 1900
NA 77 0.82 1700
NA 8 0.08 u 180
NA 14 0.7 990
NA 100 1.1 2600
NA 71 0.74 1500
NA 32 0.17 770
NA 82.5 0.76 1950
NA 90 0.82 2500
NA 95 0.87 2400
NA 8.3 0.08 u 230
NA 37 0.3 960
NA 49 0.39 1100
1.2 u 59.9 0.49 1740
1.2 81.8 0.84 1670
1.2 u 42.3 0.38 1350
2.3 77 0.86 1910
1.2 u 115 1.1 2200
1.2 34.1 0.22 1080
1.2 u 92.2 0.89 1920
'"' Q,l
!6 "C -u -; u = 0
NA 2.5
NA 2.5
NA 2.5
NA 2.5
NA 2.5
NA 2.5
NA 8.4
NA 10.3
NA 2.5
NA 2.5
NA 2.5
NA 2.5
NA 2.5
NA 2.5
0.1 u NA
0.1 NA
0.1 u NA
0.18 NA
0.22 NA
0.11 NA
0.1 u NA
'"' Q,l
IC ;; = 0
u u u u
u
u u u u u u
I I
i) ~ § "" ~ ~ §" (1:) ;::: .....
E C3 :::: 5. ~
~ ~ ::t

s;: I
~ 8
I N
& .._
(j I
N
$ N
§
Q -~ c. 8 = rJ'1
04GU-96-0007
04LA-96-0050
04LA-96-0051
04LA-96-0052
04LA-96-0052
04LA-96-0053
04LA-96-0054
04LA-96-0055
04LA-96-0056
04LA-96-0056
04PU-96-0010
04PU-96-0011
04PU-96-0012
04PU-96-0013
04PU-96-0014
04PU-96-0015
04PU-96-0016
04PU-96-0016
04PU-96-0017
04PU-96-0018
04PU-96-0018
04PU-96-0019
Q -= .:z .... = c:.l 0
...:l
GU-0007
LA-0005
LA-0006
LA-0007
LA-0007
LA-0008
LA-0009
LA-0010
LA-0011
LA-0011
PU-0005
PU-0006
PU-0007
PU-0008
PU-0009
PU-0010
PU-0011
PU-0011
PU-0012
PU-0013
PU-0013
PU-0014
c:.l
:.a ~
~:.:: N ooe
0 = 8;::1 ~ 8 0 ~ '-' ~ i:i3 0
FP <2
FP <2
AC <2
PFP <2
PFP <0.0625
AC <2
AC <2
PFP <2
FP <2
FP <0.0625
FP <2
FP <2
PC <2
AC <2
AC <2
FP <2
FP <2
FP <0.0625
PC <2
PFP <2
PFP <0.0625
PFP <2
""' ""' ~ ~
5 !8 Of) :;;: Cll
< -; < -; = = 0 0
0.1 u 3350 0.4
0.1 u 5510 3.6
0.1 u 3140 1.1
0.1 u 8810 2.2
0.1 u 12300 2.4
0.1 u 5800 1.8
0.1 u 5060 1.1
0.1 u 4910 1.3
0.1 u 4520 1.9
0.1 u 8990 2.5
0.28 4500 2.8
0.1 u 5620 2.9
0.1 u 9720 2.9
0.11 5560 2.7
0.1 u 6980 2.8
0.1 u 4010 2.6
0.1 u 8710 3.1
0.1 u 13200 4.2
0.1 u 1980 1.1
0.1 u 12900 2.9
0.1 u 8750 2.7
0.1 u 13300 2.9
~
""' ""' ~ ~
!S 5 = = ~ -; = = -; = = 0 0
1.2 u 36.9 0.27
NA 65.8 0.67
NA 33.4 0.26
NA 87.1 1.2
1.4 122 1.6
2.2 65 0.63.
NA 45.9 0.54
2.7 64.6 0.68
1.9 67.7 0.55
3.2 123 1
1.2 u 29.1 0.41
1.2 u 40 0.47
1.2 u 96.3 0.67
1.2 u 37 0.54
1.2 u 44 0.54
2.2 68.4 0.49
1.8 95 0.74
2.7 121 0.99
1.2 u 17.2 0.17
4.1 110 1.1
3.9 109 1.1
2.3 127 1.3 --- L __ -
~ -~
= "d u u
977 0.17
2000 0.14
934 0.1
1640 0.1
2150 0.1
3310 0.1
1080 0.12
1650 0.1
4240 0.1
5860 0.2
641 0.2
1080 0.2
2110 0.2
1150 0.2
1160 0.2
2290 0.2
2920 0.2
3660 0.2
336 0.2
2830 0.2
2900 0.2
3680 0.2
' ;I'
""' ~ = ... u -; = 0
NA
NA
u NA
u NA
u NA
u NA
NA
u NA
u NA
NA
u NA
u NA
u NA
u NA
u NA
u NA
u NA
u NA
u NA
u NA
u NA
u NA
~
""' ~ 5 -a = 0
., ' l
~ ~ Cl ;::::
"' ~ ~-(1:1 ;:::: .... ~ ('")
~ ~
~ ::tl {l Cl :4
"
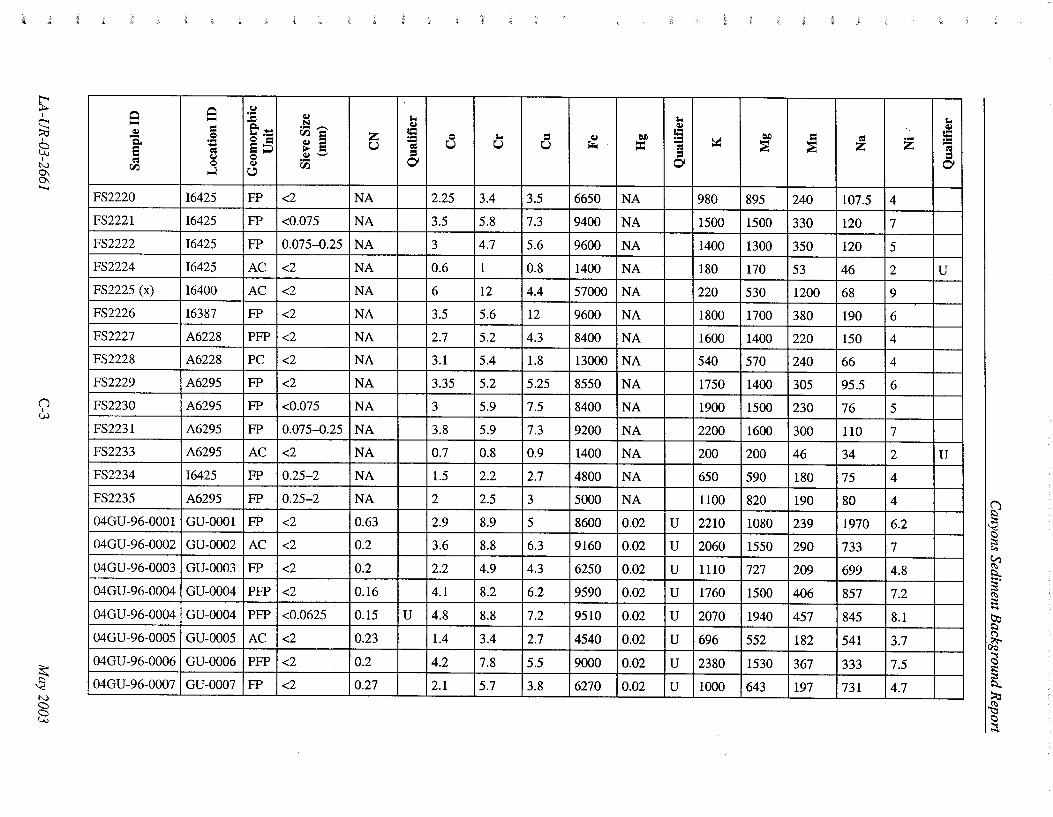
~ I
§3 ~
I
N
~ .......
n I
(j,)
~ '< N
§
~ .... ~ -a e '" 00
FS2220
FS2221
FS2222
FS2224
FS2225 (x)
FS2226
FS2227
FS2228
FS2229
FS2230
FS2231
FS2233
FS2234
FS2235
04GU-96-0001
04GU-96-0002
04GU -96-0003
04GU-96-0004
04GU-96-0004
04GU-96-0005
04GU-96-0006
04GU-96-0007
~ .... = Q ~
'" CJ Q
...:l
16425
16425
16425
16425
16400
16387
A6228
A6228
A6295
A6295
A6295
A6295
16425
A6295
GU-0001
GU-0002
GU-0003
GU-0004
GU-0004
GU-0005
GU-0006
GU-0007
CJ
:.a ~
e;:: N ooe Q = S::J ~ e Q ~ '-' ~ 00 t;!)
FP <2
FP <0.075
FP 0.075-0.25
AC <2
AC <2
FP <2
PFP <2
PC <2
FP <2
FP <0.075
FP 0.075-0.25
AC <2
FP 0.25-2
FP 0.25-2
FP <2
AC <2
FP <2
PFP <2
PFP <0.0625
AC <2
PFP <2
FP <2
l.o ~
z 5 Q l.o = u -; u u u = 0
NA 2.25 3.4 3.5
NA 3.5 5.8 7.3
NA 3 4.7 5.6
NA 0.6 1 0.8
NA 6 12 4.4
NA 3.5 5.6 12
NA 2.7 5.2 4.3
NA 3.1 5.4 1.8
NA 3.35 5.2 5.25
NA 3 5.9 7.5
NA 3.8 5.9 7.3
NA 0.7 0.8 0.9
NA 1.5 2.2 2.7
NA 2 2.5 3
0.63 2.9 8.9 5
0.2 3.6 8.8 6.3
0.2 2.2 4.9 4.3
0.16 4.1 8.2 6.2
0.15 u 4.8 8.8 7.2
0.23 1.4 3.4 2.7
0.2 4.2 7.8 5.5
0.27 2.1 5.7 3.8
l.o ~ = ell ~ ell ...
~ r-. = -; ~ = 0
6650 NA 980 895
9400 NA 1500 1500
9600 NA 1400 1300
1400 NA 180 170
57000 NA 220 530
9600 NA 1800 1700
8400 NA 1600 1400
13000 NA 540 570
8550 NA 1750 1400
8400 NA 1900 1500
9200 NA 2200 1600
1400 NA 200 200
4800 NA 650 590
5000 NA 1100 820
8600 0.02 u 2210 1080
9160 0.02 u 2060 1550
6250 0.02 u 1110 727
9590 0.02 u 1760 1500
9510 0.02 u 2070 1940
4540 0.02 u 696 552
9000 0.02 u 2380 1530
6270 0.02 u 1000 643
= '" ~ z
240 107.5
330 120
350 120
53 46
1200 68
380 190
220 150
240 66
305 95.5
230 76
300 110
46 34
180 75
190 80
239 1970
290 733
209 699
406 857
457 845
182 541
367 333
197 731 -
~
z
4
7
5
2
9
6
4
4
6
5
7
2
4
4
6.2
7
4.8
7.2
8.1
3.7
7.5
4.7 -
l.o ~ = ... -; = 0
u
u
g ~ C)
i:; ~ ~ §" ~ ;:::! .... ~ ~
~ a § ~ :::0 ~ C)
::t

s: I
§3 ~
I N
& ..._
(1 I ~
~ ~ N
§
I
Q .... ~
"S. e = TJ1
04LA-96-0050
04LA-96-0051
04LA-96-0052
04LA-96-0052
04LA-96-0053
04LA-96-0054
04LA-96-0055
04LA-96-0056
04LA-96-0056
04PU-96-0010
04PU-96-0011
04PU-96-0012
04PU-96-0013
04PU-96-0014
04PU-96-0015
04PU-96-0016
04PU-96-0016
04PU-96-0017
04PU-96-0018
04PU-96-0018
04PU-96-0019
Q .... = 0 .... .... = <:J 0 ~
LA-0005
LA-0006
LA-0007
LA-0007
LA-0008
LA-0009
LA-0010
LA-0011
LA-0011
PU-0005
PU-0006
PU-0007
PU-0008
PU-0009
PU-0010
PU-0011
PU-0011
PU-0012
PU-0013
PU-0013
PU-0014
<:J .... ~ ..=
E'.:=: N me
0 = ~ e S;:J 0 ~ '-' ~ r;) ~
FP <2
AC <2
PFP <2
PFP <0.0625
AC <2
AC <2
PFP <2
FP <2
FP <0.0625
FP <2
FP <2
PC <2
AC <2
AC <2
FP <2
FP <2
FP <0.0625
PC <2
PFP <2
PFP <0.0625
PFP <2
r. ~
z 5 0 r. = u -; u u u = 0
0.15 u 1.6 5.6 7.3
0.56 0.89 6.1 4.1
0.2 1.8 7 4.9
0.15 u 2.6 9.2 6.8
0.27 1.7 6.4 4.7
0.63 1.3 5.1 3.8
0.6 1.2 4.3 3.4
0.23 1.3 5 5.2
0.15 u 3.3 10 8.7
0.63 1.7 3.7 2.5
0.27 2.1 4.9 2.7
0.31 3.8 8.3 6.8
0.15 u 2.3 5.4 3.1
0.27 2.7 5.5 3.3
0.15 u 1.9 3.2 4.4
0.34 3.4 8 10.1
0.15 u 4.5 12.6 10.1
0.16 1 3.2 0.77
0.41 3.4 9 5.7
0.15 u 3.4 6.7 5.8
0.15 u 4 9.2 6.4
r. ~
5 ell = ~ ell ~ ~ ~ -; ~ ~ = 0
7450 0.02 1090 870 342
8630 0.02 u 1120 544 229
8210 0.02 u 1350 876 457
10900 0.03 1410 1230 570
7910 0.03 1630 803 501
7180 0.02 u 1190 604 306
5660 0.02 u 1340 624 317
6800 0.02 u 788 635 517
9730 0.04 1270 1250 784
7430 0.02 u 939 612 100
8410 0.02 u 945 793 249
10400 0.02 u 1420 1300 379
12600 0.02 u 838 826 302
10100 0.02 u 1020 990 261
6670 0.02 u 859 749 433
10800 0.02 1560 1490 367
12000 0.03 2040 2070 376
7290 0.02 u 753 328 215
10100 0.02 u 2560 1960 322
9020 0.02 u 1830 1710 263
11000 0.02 u 2600 2370 314
' ' ' ' ,
= z
458
930
826
520
944
847
964
450
307
522
419
386
284
319
250
353
307
699
1240
706
646
z
4.6
4.4
5.5
7.4
5.3
5
4.1
4.4
8.4
2.9
3.8
8.9
4.2
4.2
3.2
8.9
11.9
2.5
7.4
6.5
8
r. ~
5 -; = 01
Q ~ c ;:::
"" ~ §" ~ ;::: ......
~ ~ ~ :0::
E. ~ ~ c ::t
'~' ,, ,,

i
s: I
~ @
I N
8: .._
n I
Vl
~ ~ N
§
Q -~ Q.. e = IZI
FS2220
FS2221
FS2222
FS2224
FS2225 (x)
FS2226
FS2227
FS2228
FS2229
FS2230
FS2231
FS2233
FS2234
FS2235
04GU-96-0001
04GU-96-0002
04GU-96-0003
04GU-96-0004
04GU-96-0004
04GU-96-0005
04GU-96-0006
04GU-96-0007
Q -= .s: -= <:.1 0
....:l
16425
16425
16425
16425
16400
16387
A6228
A6228
A6295
A6295
A6295
A6295
16425
A6295
GU-0001
GU-0002
GU-0003
GU-0004
GU-0004
GU-0005
GU-0006
GU-0007
<:.1 :2 ~
1:-;o::: N
1:i3e 0 = ~ e E;;:J 0 ~ .._, ~ 1:i5 ~
FP <2
FP <0.075
FP 0.075-0.25
AC <2
AC <2
FP <2
PFP <2
PC <2
FP <2
FP <0.075
FP 0.075-0.25
AC <2
FP 0.25-2
FP 0.25-2
FP <2
AC <2
FP <2
PFP <2
PFP <0.0625
AC <2
PFP <2
FP <2
"' "' "' ~ ~ ~
!5 !;: !6 .c .c ... ~ ~ -; IZI -; IZI -; = = = 0 0 0
6.5 5 u NA
10 5 u NA
10 5 u NA
4 5 u NA
11 5 NA
16 5 NA
7 5 u NA
5 5 u NA
9 5 u NA
7 5 u NA
9 5 u NA
4 u 5 u NA
5 5 u NA
6 5 u NA
7 4.9 u 0.2 u 9.2 4.9 u 0.2 u 5.7 4.9 u 0.2 u 9.5 4.9 u 0.2 u 12.6 4.9 u 0.2 u 3.5 4.9 u 0.2 u 9.3 4.9 u 0.2 u 5.9 4.9 u 0.2 u
"' "' ~ ~ .., !;: !;: 0 ... = ... -= -; E-o -; E-o IZI = = 0 0
5 u 0.3 u 5.5
10 0.3 u 7.7
5.9 0.3 u 7.1
5 u 0.3 u 1.4
5 0.3 14
5 u 0.3 u 6.6
35 0.3 u 5.8
26.5 0.3 u 2.2
5 u 0.3 u 7
5 u 0.3 u 6.9
5 u 0.3 u 7.1
5 u 0.3 u 0.9
5 u 0.3 u 3.6
5 u 0.3 u 4.3
NA NA NA
NA NA NA
NA NA NA
NA NA NA
NA NA NA
NA NA NA
NA NA NA
NA NA NA - L__ -
-; -0 E::: -I
-= E-<
13 NA
17 NA
18 NA
3.9 NA
130 NA
18 NA
15 NA
9.4 NA
15 NA
16 NA
15 NA
3.3 NA
8.8 NA
10 NA
NA 380
NA 199
NA 215
NA 133
NA 61.5
NA 156
NA 102
NA 270
E=
0.4
0.3
0.3
0.3
0.3
0.3
0.3
0.3
0.3
0.3
0.3
0.3
0.3
1.5
3.2
2
1.4
1.7
1.3
1.1
1.7
2.3
"' ~ 5 -= = 0
u. u u u
u u u u u u u u
~
i ""' ~ >:l... §" ~ ;:s .... g:; (")
~ ~
~ ~ ~ c ~

s: I
§3 8
I
N
8;
Q 1.1 Q ....
~ - -= 1-o 1-o - e;::: N ~ Q,j
~ = V3s 1:: !5 0 0 = .c .... .c Q,j Q, ~ ~ e =-- '; ~ '; ~ S;::l e = = = 1.1 0 Q,j '-' = 0 Q,j V3 0 0 ~ ..J ~
........ 04LA-96-0050 LA-0005 FP <2 25.6 4.9 u 0.2
04LA-96-0051 LA-0006 AC <2 6.6 4.9 u 0.2
04LA-96-0052 LA-0007 PFP <2 13.4 4.9 u 0.2
04LA-96-0052 LA-0007 PFP <0.0625 17.3 4.9 u 0.2
04LA-96-0053 LA-0008 AC <2 13.6 4.9 u 0.2
04LA-96-0054 LA-0009 AC <2 7.1 4.9 u 0.2
04LA-96-0055 LA-0010 PFP <2 8.9 4.9 u 0.2
04LA-96-0056 LA-0011 FP <2 12.4 4.9 u 0.2
04LA-96-0056 LA-0011 FP <0.0625 20.4 4.9 u 0.2
n I 04PU-96-0010 PU-0005 FP <2 7.4 4.9 u 0.2 0\
04PU-96-0011 PU-0006 FP <2 7.5 4.9 u 0.2
04PU-96-0012 PU-0007 PC <2 15.2 4.9 u 0.2
04PU-96-0013 PU-0008 AC <2 8.9 4.9 u 0.2
04PU-96-0014 PU-0009 AC <2 9.1 4.9 u 0.2
04PU-96-0015 PU-0010 FP <2 9.7 4.9 u 0.2
04PU-96-0016 PU-0011 FP <2 15.6 4.9 u 0.2
04PU-96-0016 PU-0011 FP <0.0625 19.6 4.9 u 0.2
04PU-96-0017 PU-0012 PC <2 3.5 4.9 u 0.2
04PU-96-0018 PU-0013 PFP <2 11 4.9 u 0.2
04PU-96-0018 PU-0013 PFP <0.0625 10.6 4.9 u 0.2
~ 04PU-96-0019 PU-0014 PFP <2 11.8 4.9 u 0.2
'----· - - --- -- --
N
§
1-o 1-o 1-o Q,j Q,j Q,j
1:: """ = 1:: :; 0 = := - E-< = = = ~ = = 0 0 0
u NA NA
u NA NA
u NA NA
u NA NA
u NA NA
u NA NA
u NA NA
u NA NA
u NA NA
u NA NA
u NA NA
u NA NA
u NA NA
u NA NA
u NA NA
u NA NA
u NA NA
u NA NA
u NA NA
u NA NA
u NA NA - L__ - --·- ---
!
'; --= .s E-< I
-= E-<
NA NA
NA NA
NA NA
NA NA
NA NA
NA NA
NA NA
NA NA
NA NA
NA NA
NA NA
NA NA
NA NA
NA NA
NA NA
NA NA
NA NA
NA NA
NA NA
NA NA
NA NA -- '-----
f ~ ~ '
.... E-<
188
344
237
258
270
264
174
167
203
209
298
365
400
310
166
301
329
336
190
80.7
135 -
-E-<
2.2
2.2
2.2
2.6
2
2.6
1.6
2
2
0.57
1.2
1.2
1.6
1
0.71
0.66
1
0.61
0.56
0.3
0.96
1-o Q,j
!5 ';
= 0
u
g ~ C) ~ c.,
~ ~ ~-
~ .....
~ ("")
~ ~
~ ~
~ C)
::t
',, ,, ,,
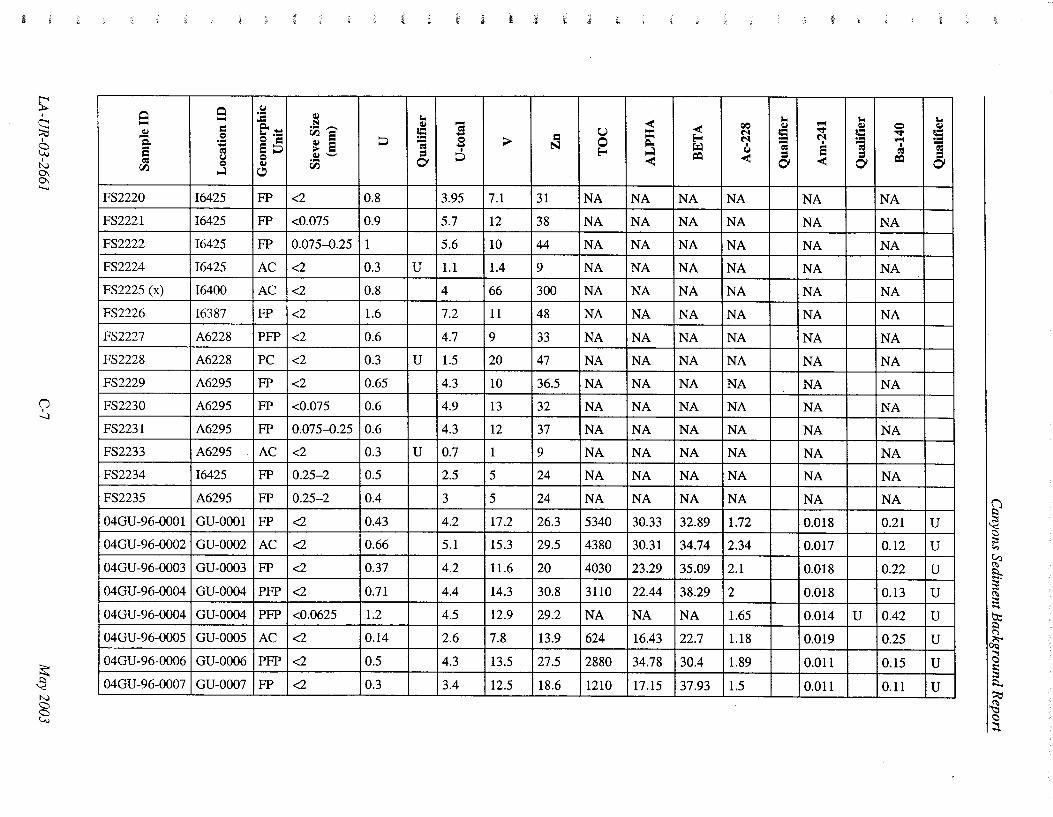
t ~ i j t
s: I
§3 ~
I
N
&
~ Col ~ - :a ~ "' - ~~
N ~ -..9:! = oos c s .:: 0 = ;;;J ... 0 > = S' ~ s "; N ""' S:;J ""' = I
~ '-" = ;;;J = Col 0 00 Ci 0 ~ 00 ~ 0
....... FS2220 16425 FP <2 0.8 3.95 7.1 31
FS2221 16425 FP <0.075 0.9 5.7 12 38
FS2222 16425 FP 0.075-0.25 1 5.6 10 44
FS2224 16425 AC <2 0.3 u 1.1 1.4 9
FS2225 (x) 16400 AC <2 0.8 4 66 300
FS2226 16387 FP <2 1.6 7.2 11 48
FS2227 A6228 PFP <2 0.6 4.7 9 33
FS2228 A6228 PC <2 0.3 u 1.5 20 47
FS2229 A6295 FP <2 0.65 4.3 10 36.5
n I FS2230 A6295 FP <0.075 0.6 4.9 13 32
-..)
FS2231 A6295 FP 0.075-0.25 0.6 4.3 12 37
FS2233 A6295 AC <2 0.3 u 0.7 1 9
FS2234 16425 FP 0.25-2 0.5 2.5 5 24
FS2235 A6295 FP 0.25-2 0.4 3 5 24
04GU-96-0001 GU-0001 FP <2 0.43 4.2 17.2 26.3
04GU-96-0002 GU-0002 AC <2 0.66 5.1 15.3 29.5
04GU-96-0003 GU-0003 FP <2 0.37 4.2 11.6 20
04GU-96-0004 GU-0004 PFP <2 0.71 4.4 14.3 30.8
04GU-96-0004 GU-0004 PFP <0.0625 1.2 4.5 12.9 29.2
04GU-96-0005 GU-0005 AC <2 0.14 2.6 7.8 13.9
~ 04GU-96-0006 GU-0006 PFP <2 0.5 4.3 13.5 27.5
04GU-96-0007 GU-0007 FP <2 0.3 3.4 12.5 18.6 L___
N
§
-< ~
QO u = N 0 N
=-- I ~ Eo; ~ Col ~ -< -<
NA NA NA NA
NA NA NA NA
NA NA NA NA
NA NA NA NA
NA NA NA NA
NA NA NA NA
NA NA NA NA
NA NA NA NA
NA NA NA NA
NA NA NA NA
NA NA NA NA
NA NA NA NA
NA NA NA NA
NA NA NA NA
5340 30.33 32.89 1.72
4380 30.31 34.74 2.34
4030 23.29 35.09 2.1
3110 22.44 38.29 2
NA NA NA 1.65
624 16.43 22.7 1.18
2880 34.78 30.4 1.89
1210 17.15 37.93 1.5
"' "' ~ ..... ~ c ""' c . .. N . .. "; I -s = = = Ci -< Ci
NA
NA
NA
NA
NA
NA
NA
NA
NA
NA
NA
NA
NA
NA
0.018
0.017
0.018
0.018
0.014 u 0.019
0.011
0.011
Q
""' ..... I = ~
NA
NA
NA
NA
NA
NA
NA
NA
NA
NA
NA
NA
NA
NA
0.21
0.12
0.22
- 0.13
0.42
0.25
0.15
0.11
"' ~ c . .. -= = Ci
I i
u u u u u u u u
Q ~ ;::
"" ~ §" (I> ;:: ..... ~ (')
~ ~ § ~ :::0 ~ c ::t

s;: I
~ 8
I N
& .......
n I
00
~ N
§
Q ...... Q,l
'a e co V)
04LA-96-0050
04LA-96-0051
04LA-96-0052
04LA-96-0052
04LA-96-0053
04LA-96-0054
04LA-96-0055
04LA-96-0056
04LA-96-0056
04PU-96-0010
04PU-96-0011
04PU-96-0012
04PU-96-0013
04PU-96-0014
04PU-96-0015
04PU-96-0016
04PU-96-0016
04PU-96-0017
04PU-96-0018
04PU-96-0018
04PU-96-0019
Q ......
= 0 :.:: co l.i 0 ~
LA-0005
LA-0006
LA-0007
LA-0007
LA-0008
LA-0009
LA-0010
LA-0011
LA-0011
PU-0005
PU-0006
PU-0007
PU-0008
PU-0009
PU-0010
PU-0011
PU-0011
PU-0012
PU-0013
PU-0013
PU-0014
l.i :a Q,l
E-.:: N ri.Je
0 = ~ e S;;l 0 Q,l '-" Q,l r;J r;;
FP <2
AC <2
PFP <2
PFP <0.0625
AC <2
AC <2
PFP <2
FP <2
FP <0.0625
FP <2
FP <2
PC <2
AC <2
AC <2
FP <2
FP <2
FP <0.0625
PC <2
PFP <2
PFP <0.0625
PFP <2
"" Q,l -; :e - = ~ .s > -; N I
= ;;l 01
0.75 4.4 9.9 51.4
1.1 2.3 ll.8 36.1
1 6.3 9 56.2
1.5 7.7 12.3 74.2
0.86 4 9.9 47.7
0.8 3.7 9.1 34
0.83 4.9 7.1 31.4
1 5.1 8 35.9
1.5 6.5 13.9 57.8
0.33 2.2 7.4 27.2
0.42 2.5 8.4 33.2
2 4.6 14.2 38
0.41 3.2 10.3 55.5
0.41 3.1 10.3 39.3
0.7 3.5 6.1 30.4
1.1 3.8 14.9 39.9
1.9 4.9 19.1 39.9
0.35 1.5 6.2 37.9
0.86 5.2 14.4 38.2
0.86 4.4 11.3 33.9
1.1 4.5 15 39
C! ~
< ~
00 u = N 0 N
=-- ~ I
E-< ~ l.i
< ~ <
15000 46.04 40.39 0.55
7540 8.47 26.96 1.18
10700 47.8 40.67 3.07
NA 52.93 45.32 3.08
15600 33.76 38.51 0.47
9250 25.04 34.46 1.86
6750 45.23 38.95 2.03
15700 36.41 40.72 2.63
NA 45.94 44.24 2.81
3690 18.96 31.76 1.6
5990 16.3 34.51 1.14
15600 48.16 32.68 1.85
3090 30.44 36.25 1.68
6140 40.87 38.29 1.52
18700 30.9 34.81 1.67
25000 41.94 34.09 1.71
NA 60.31 32.13 0.7
670 12.56 26.06 0.31
4510 49.28 41.12 2.33
NA 46.5 27.61 0.7
3730 31.43 28.44 2.1
"" "" Q,l ..... Q,l = ~ 5 M = I -; co e = < = 01 01
u 0.139
0.019
0.015
0.022
u 0.023
0.021
0.016
0.017
0.018
0.009
0.023
0.034
0.038
0.032
0.013
0.036
u 0.046
u 0.016
0.029
u 0.043
0.025
Q ~ ..... = ~
0.26
0.28
0.32
0.58
0.44
0.24
0.41
0.42
0.56
0.24
0.23
0.32
0.29
0.29
0.21
0.24
0.51
0.19
0.23
0.59
0.26
"" Q,l
5 -; = 01
u u u u u u u u u u u u u u u u u u u u u
Q ~ g "" ~ §' ~ ;::: .....
~ ~ ~
~ ::>::;
~ <::)
::t
, f '!! '!' ¥' fi! '' ~' ft '~

j i j
s: I
§:3
8 I
N
&
~ CJ ~ ..... :a Cll "' "' ..... E-:: N ,.... Cll M Cll ..,. Cll = vse ,....
= ,.... 5 ,.... Q.. .s 0 = M M M -; -; .... E;::J ~ e I I I e = =s =s ...
CJ 0 Cll '-' = = = = 0 Cll V5 01 01 rr; ~
"" ....... FS2220 16425 FP <2 NA NA NA
FS2221 16425 FP <0.075 NA NA NA
FS2222 !6425 FP 0.075-0.25 NA NA NA
FS2224 !6425 AC <2 NA NA NA
FS2225 (x) !6400 AC <2 NA NA NA
FS2226 16387 FP <2 NA NA NA
FS2227 A6228 PFP <2 NA NA NA
FS2228 A6228 PC <2 NA NA NA
FS2229 A6295 FP <2 NA NA NA
n I FS2230 A6295 FP <0.075 NA NA NA \0
FS2231 A6295 FP 0.075-0.25 NA NA NA
FS2233 A6295 AC <2 NA NA NA
FS2234 !6425 FP 0.25-2 NA NA NA
FS2235 A6295 FP 0.25-2 NA NA NA
04GU-96-0001 GU-0001 FP <2 1.28 u 1.56 u 0.96
04GU-96-0002 GU-0002 AC <2 1.01 u 1.61 u 0.97
04GU-96-0003 GU-0003 FP <2 1.01 u 3.02 u 1.09
04GU-96-0004 GU-0004 PFP <2 1.07 u 1.72 u 1.07
04GU-96-0004 GU-0004 PFP <0.0625 2.33 2.8 u 2.97
04GU-96-0005 GU-0005 AC <2 0.96 u 1.84 u 0.33
~ '<:::
04GU-96-0006 GU-0006 PFP <2 1 u 1.77 u 0.92
04GU-96-0007 GU-0007 FP <2 0.91 u 1.74 u 0.69 N
§
"' "' "' Cll ="' Cll ="' Cll ..,. 1:: = = ~ 1:: ..,. ... ,.... ,.... ... ,.... -; I -; -; I I
"C Cll Cll = u = u = u 01 01 01
NA NA NA
NA NA NA
NA NA NA
NA NA NA
NA NA NA
NA NA NA
NA NA NA
NA NA NA
NA NA NA
NA NA NA
NA NA NA
NA NA NA
NA NA NA
NA NA NA
4.08 u 0.08 u 1.31
3.02 u 0.06 u 0.76
3.3 u 0.04 u 0.98
3.23 u 0.03 u 0.63
4.19 u 0.15 u 1.15
u 3.27 u 0.04 u 0.54
3.18 u 0.05 u 0.74
2.97 u 0.06 u 0.7
"' "' Cll r-- Cll
!5 I() 5 -; 6 -; = u = 01 01
NA
NA
NA
NA
NA
NA
NA
NA
NA
NA
NA
NA
NA
NA
u 0.09 u u 0.06 u u 0.07 u u 0.07 u u 0.12 u u 0.07 u u 0.06 u u 0.05 u
-
= ~ I
0 u
NA
NA
NA
NA
NA
NA
NA
NA
NA
NA
NA
NA
NA
NA
0.09
0.05
0.1
0.11
0.2
0.13
0.08
0.08
"' Cll 1:: = = = 01
:
u u u u u u u u
~ ~ Cl ~
"" ~ ~
ff ~ .... ~ ~
~ Cl ;::
5.. ~ ~ Cl :::t

~ I
~ 8
I N
8; ........
n I .......
0
f N a 53
Q .... ~ -a s r:u
1J1
04LA-96-0050
04LA-96-0051
04LA-96-0052
04LA-96-0052
04LA-96-0053
04LA-96-0054
04LA-96-0055
04LA-96-0056
04LA-96-0056
04PU-96-0010
04PU-96-0011
04PU-96-0012
04PU-96-0013
04PU-96-0014
04PU-96-0015
04PU-96-0016
04PU-96-0016
04PU-96-0017
04PU-96-0018
04PU-96-0018
04PU-96-0019
Q ..... = 0 .... .... r:u (j 0 ~
LA-0005
LA-0006
LA-0007
LA-0007
LA-0008
LA-0009
LA-0010
LA-0011
LA-0011
PU-0005
PU-0006
PU-0007
PU-0008
PU-0009
PU-0010
PU-0011
PU-0011
PU-0012
PU-0013
PU-0013
PU-0014
(j
:a ~
E';<:::: N
~ (;55 ~
0 = N ~ s =~
I
=:1 0 ~ '-' ~ r;5 0
FP <2 1.19
AC <2 0.85
PFP <2 1.35
PFP <0.0625 3.68
AC <2 1.38
AC <2 1.19
PFP <2 1.3
FP <2 1.14
FP <0.0625 3.34
FP <2 0.95
FP <2 0.85
PC <2 1.12
AC <2 0.98
AC <2 0.9
FP <2 0.99
FP <2 1
FP <0.0625 1.4
PC <2 0.84
PFP <2 1.2
PFP <0.0625 3.42
PFP <2 1_.24
'"' '"' '"' ~ N ~ ...,. ~ a= ~ a= ~ !5 .... N . ... N -; -; -; I I
= =:1 = =:1 = 0 0 0
u 4.61 u 0.42 u u 3.67 u 0.31 u u 1.42 u 1.4
4.93 u 1.82 u u 2.34 u 0.79
u 2.3 u 0.46 u u 3.09 u 1.12
u 1.31 u 0.97
5.02 u 1.62 u u 1.4 u 0.4 u u 1.84 u 0.54
u 2.32 u 0.94
u 1.7 u 0.33 u u 1.76 u 0.49
u 1.16 u 0.58
u 2.17 u 0.33 u u 4.1 u 0.62 u u 1.11 u 0.25 u u 1.9 u 1.18
2.95 u 0.57 u u 3 u 0.92
C'\ '"' ~ 0 a= ~ . ...
I -; 't:l = u 0
3.98 u 3.36 u 3.97 u 4.86 u 4.65 u 3.88 u 4.26 u 3.62 u 5.48 u 3.19 u 2.98 u 3.59 u 3.37 u 2.9 u 3.08 u 3.16 u 4.59 u 2.6 u 3.68 u 4.15 u 3.59 u
'"' '"' '"' '"' C'\ ~ ...,. ~ r-- ~ 0 ~ ff') =
...,. = lO !5 ~ a=
~ ~ I I ....
I -; I -; -; -; 0 0 ~
= ~
= u = u = u u 0 0 0 0
0.12 u 0.84 u 0.09 u 0.08 u 0.07 u 0.6 u 0.06 u 0.08 u 0.08 u 1.11 u 0.08 u 0.12 u 0.2 u 1.09 u 0.1 u 0.25 u 0.08 u 0.87 u 0.09 u 0.14 u 0.09 u 0.87 u 0.08 u 0.12 u 0.08 u 1.03 u 0.09 u 0.1 u 0.04 u 0.84 u 0.07 u 0.1 u 0.18 u 1.43 u 0.12 u 0.23 u 0.06 u 0.84 u 0.09 u 0.09 u 0.06 u 0.86 u 0.03 u 0.09 u 0.08 u 0.47 u 0.04 u 0.14 u 0.04 u 1.11 u 0.06 u 0.1 u 0.06 u 0.49 u 0.04 u 0.09 u 0.07 u 0.84 u 0.1 u 0.13 u 0.08 u 0.95 u 0.08 u 0.1 u 0.13 u 0.57 u 0.14 u 0.22 u 0.03 u 0.55 u 0.06 u 0.08 u 0.08 u 0.74 u 0.08 u 0.12 u 0.09 u 0.94 u 0.09 u 0.2 u 0.08 u 0.85 u 0.08 u 0.08 u
~ ~ ~, ~ t" ~' '' !' ..
Q ~ Cl ;:::
"" ~ ~-;::: ..... ~ (")
~ ~ !::!
~ :::0 ~ Cl ::t

s: I
~ ~
I
N
~ .......
n I ...... ......
$ N
§
~ ..... ,.S:! c.. e 1!'/S
1:1)
FS2220
FS2221
FS2222
FS2224
FS2225 (x)
FS2226
FS2227
FS2228
FS2229
FS2230
FS2231
FS2233
FS2234
FS2235
04GU-96-0001
04GU-96-0002
04GU-96-0003
04GU-96-0004
04GU-96-0004
04GU-96-0005
04GU-96-0006
04GU-96-0007 -
~ Col ..... :E
e-.:::: = 0 0 = ... - e~ 1!'/S
Col 0 0 Q,l
...:l ~
16425 FP
16425 FP
16425 FP
16425 AC
16400 AC
16387 FP
A6228 PFP
A6228 PC
A6295 FP
A6295 FP
A6295 FP
A6295 AC
16425 FP
A6295 FP
GU-0001 FP
GU-0002 AC
GU-0003 FP
GU-0004 PFP
GU-0004 PFP
GU-0005 AC
GU-0006 PFP
GU-0007 FP --
Q,l
'"' '"' N ...,. Q,l r-- Q,l ri.ie ~ 5 ~ !5 .-4 .-4 ~ e I -; I -;
~ ~ = = Q,l ,_. u u 1Zi Ci Ci
<2 NA NA
<0.075 NA NA
0.075-0.25 NA NA
<2 NA NA
<2 NA NA
<2 NA NA
<2 NA NA
<2 NA NA
<2 NA NA
<0.075 NA NA
0.075-0.25 NA NA
<2 NA NA
0.25-2 NA NA
0.25-2 NA NA
<2 0.08 u 0.12 u <2 0.11 u 0.09 u <2 0.09 u 0.09 u <2 0.07 u 0.1 u <0.0625 0.12 u 0.19 u <2 0.11 u 0.09 u <2 0.1 u 0.1 u <2 0.1 u 0.21 -- - --- - L___
~
'"' '"' M Q,l ~ Q,l Ill IC ~ = !5 .-4 ...
I M I -; = I -; = ~ = = r.:l = Ci Ci
NA NA NA
NA NA NA
NA NA NA
NA NA NA
NA NA NA
NA NA NA
NA NA NA
NA NA NA
NA NA NA
NA NA NA
NA NA NA
NA NA NA
NA NA NA
NA NA NA
0.38 u 0.027 0.11 u 0.16 u O.Q18 0.08 u 0.3 u 0.016 0.07 u 0.4 u NA 0.09 u 0.85 u NA 0.13 u 0.29 u 0.009 0.09 u 0.31 u 0.012 0.09 u 0.35 u 0.007 0.07 u -~ --
'"' Q,l
=-- IC = M ... ...,. .-4 -; I
I ::.d = ..... Ci
NA NA
NA NA
NA NA
NA NA
NA NA
NA NA
NA NA
NA NA
NA NA
NA NA
NA NA
NA NA
NA NA
NA NA
0.36 u 31
0.25 u 28.38
0.2 u 30.11
0.21 u 28.59
0.02 u 31.06
0.2 u 29.91
0.18 u 29.28
0.15 u 24.21
'"' Q,l Q !5 ...,.
.-4 -; I
1!'/S = ...:l Ci
NA
NA
NA
NA
NA
NA
NA
NA
NA
NA
NA
NA
NA
NA
0.04
0.04
0.04
0.02
0.09
0.03
0.05
0.02
'"' Q,l IC . .. -; = Ci
u u u u u u u u
~ ~
<:::> ;::
"" ~ l:l... §" (1> ;:: ..... ~ ("")
~ ~ ;::: ;:: l:l... ~ ~
<:::>
~
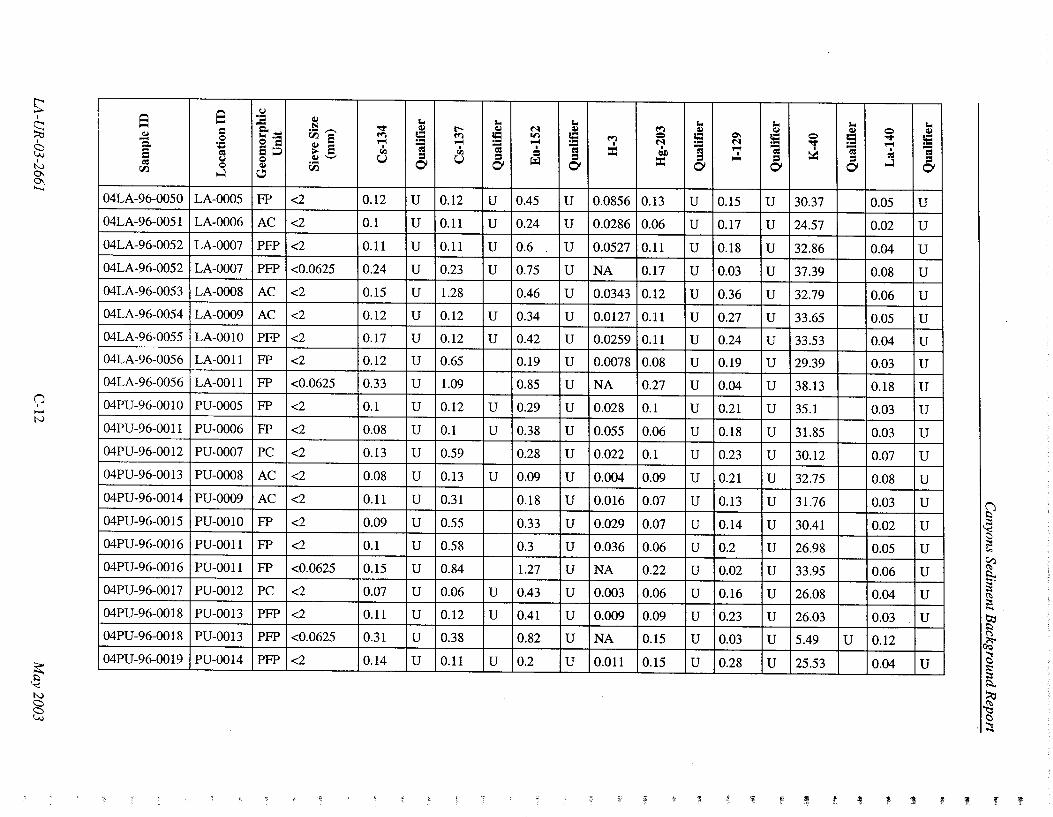
s: I
§;;; &;
I N
~ .......
(') I .......
N
~ N
§
Q .... ~
Q.. 5 eu
r.rJ
04LA-96-0050
04LA-96-0051
04LA-96-0052
04LA-96-0052
04LA-96-0053
04LA-96-0054
04LA-96-0055
04LA-96-0056
04LA-96-0056
04PU-96-0010
04PU-96-0011
04PU-96-0012
04PU-96-0013
04PU-96-0014
04PU-96-0015
04PU-96-0016
04PU-96-0016
04PU-96-0017
04PU-96-0018
04PU-96-0018
04PU-96-0019
Q .... c .s ..... eu IJ 0
...:l
LA-0005
LA-0006
LA-0007
LA-0007
LA-0008
LA-0009
LA-0010
LA-0011
LA-0011
PU-0005
PU-0006
PU-0007
PU-0008
PU-0009
PU-0010
PU-0011
PU-0011
PU-0012
PU-0013
PU-0013
PU-0014
IJ :a ~
~;::: N r;;e
0 c 5;:J ~ 5
~ '-' 0 r;J ~
c;,;
FP <2
AC <2
PFP <2
PFP <0.0625
AC <2
AC <2
PFP <2
FP <2
FP <0.0625
FP <2
FP <2
PC <2
AC <2
AC <2
FP <2
FP <2
FP <0.0625
PC <2
PFP <2
PFP <0.0625
PFP <2
lot lot ..,. ~ r-- ~ M ~ 1:: ~ = 10 .-1 ;; .-1 .-1
I I '; I
"' "' ~ u = u = 0 0
0.12 u 0.12 u 0.45
0.1 u 0.11 u 0.24
0.11 u 0.11 u 0.6
0.24 u 0.23 u 0.75
0.15 u 1.28 0.46
0.12 u 0.12 u 0.34
0.17 u 0.12 u 0.42
0.12 u 0.65 0.19
0.33 u 1.09 0.85
0.1 u 0.12 u 0.29
0.08 u 0.1 u 0.38
0.13 u 0.59 0.28
0.08 u 0.13 u 0.09
0.11 u 0.31 0.18
0.09 u 0.55 0.33
0.1 u 0.58 0.3
0.15 u 0.84 1.27
0.07 u 0.06 u 0.43
0.11 u 0.12 u 0.41
0.31 u 0.38 0.82
0.14 u 0.11 u 0.2
lot lot ~ ~ ~
!5 ~ 0 5 0\ I M M
'; = ~ '; .-1 I
= = = .... 0 0
u 0.0856 0.13 u 0.15
u 0.0286 0.06 u 0.17
u 0.0527 0.11 u 0.18
u NA 0.17 u 0.03
u 0.0343 0.12 u 0.36
u 0.0127 0.11 u 0.27
u 0.0259 0.11 u 0.24
u 0.0078 0.08 u 0.19
u NA 0.27 u 0.04
u 0.028 0.1 u 0.21
u 0.055 0.06 u 0.18
u 0.022 0.1 u 0.23
u 0.004 0.09 u 0.21
u 0.016 0.07 u 0.13
u 0.029 0.07 u 0.14
u 0.036 0.06 u 0.2
u NA 0.22 u 0.02
u 0.003 0.06 u 0.16
u 0.009 0.09 u 0.23
u NA 0.15 u 0.03
u 0.011 0.15 u 0.28
lot lot ~ ~
!5 0 !5 ..,. '; I ';
:::.:: = = 0 0
u 30.37
u 24.57
u 32.86
u 37.39
u 32.79
u 33.65
u 33.53
u 29.39
u 38.13
u 35.1
u 31.85
u 30.12
u 32.75
u 31.76
u 30.41
u 26.98
u 33.95
u 26.08
u 26.03
u 5.49 u u 25.53
" ~. '
0 ..,. .-1
I
eu ...:l
0.05
0.02
0.04
0.08
0.06
0.05
0.04
0.03
0.18
0.03
0.03
0.07
0.08
0.03
0.02
0.05
0.06
0.04
0.03
0.12
0.04
lot ~
= ';
= 0
u u u u u u u u u u u u u u u u u u u
u
g ~ g ""' ~ s-. ~· (I) ;::: .....
~ (")
~ ~
~ :::tl ~ ~
.. :t
~ ~ ~ ~ ' f ~
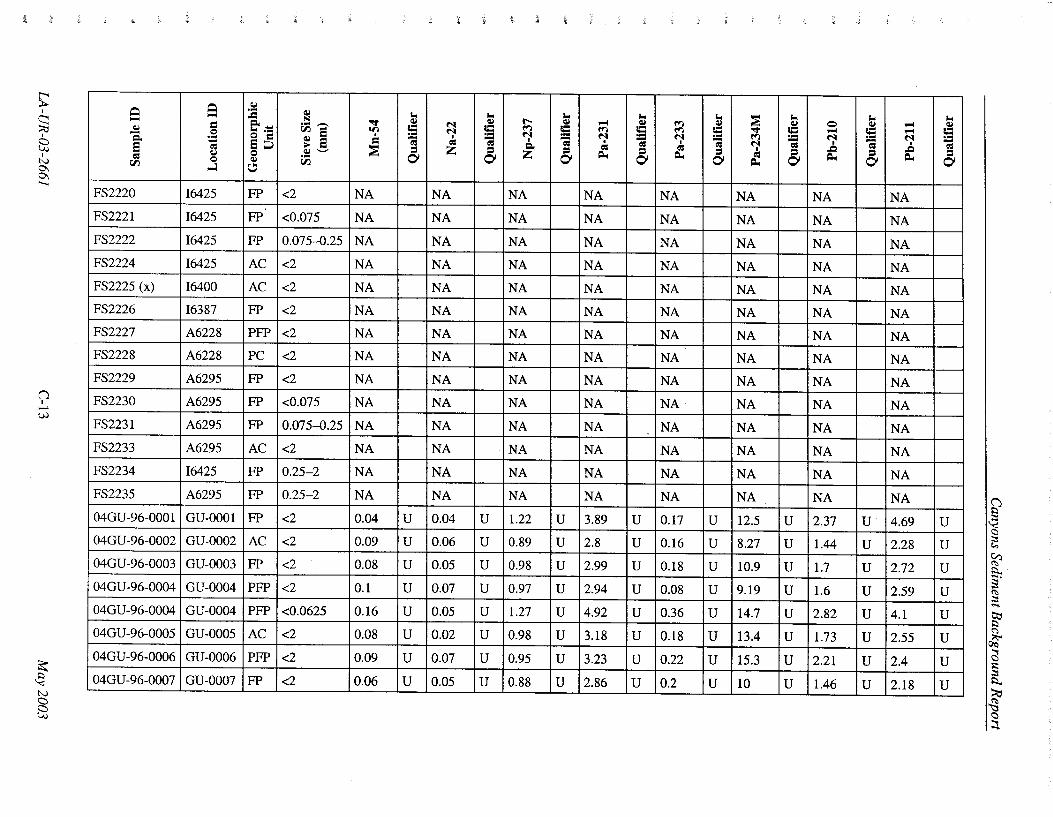
s: I
~ 8
I N
~ .._
n I ......
(.;.)
~ N
§
Cl '""" Cll
Q. e = CFJ
FS2220
FS2221
FS2222
FS2224
FS2225 (x)
FS2226
FS2227
FS2228
FS2229
FS2230
FS2231
FS2233
FS2234
FS2235
04GU-96-0001
04GU-96-0002
04GU-96-0003
04GU-96-0004
04GU-96-0004
04GU-96-0005
04GU-96-0006
04GU-96-0007
Cl '""" = Q
+:: = C.l Q
~
16425
16425
16425
16425
16400
16387
A6228
A6228
A6295
A6295
A6295
A6295
16425
A6295
GU-0001
GU-0002
GU-0003
GU-0004
GU-0004
GU-0005
GU-0006
GU-0007
C.l :a Cll
~~ N 1iie
Q = ~ e 8::::> Q Cll '-' Cll t;i (J
FP <2
FP <0.075
FP 0.075-0.25
AC <2
AC <2
FP <2
PFP <2
PC <2
FP <2
FP <0.075
FP 0.075-0.25
AC <2
FP 0.25-2
FP 0.25-2
FP <2
AC <2
FP <2
PFP <2
PFP <0.0625
AC <2
PFP <2
FP <2
J
""' ""' ""' ~ Cll ~ Cll r-- Cll
10 !5 ~ 5 !"'! !C I ~ :; 'iS I 'iS I = = :E = z = ~ = 0 0 0
NA NA NA
NA NA NA
NA NA NA
NA NA NA
NA NA NA
NA NA NA
NA NA NA
NA NA NA
NA NA NA
NA NA NA
NA NA NA
NA NA NA
NA NA NA
NA NA NA
0.04 u 0.04 u 1.22 u 0.09 u 0.06 u 0.89 u 0.08 u 0.05 u 0.98 u 0.1 u 0.07 u 0.97 u 0.16 u 0.05 u 1.27 u 0.08 u 0.02 u 0.98 u 0.09 u 0.07 u 0.95 u 0.06 u 0.05 u 0.88 u
""' ""' :E ""' ~ Cll !"'! Cll Cll !"'! 5 !"'! 5 ~ !5 ~ ~ !"'! 'iS 'iS 'iS I I ~ = = = = I
= =... =... = 0 0 =... 0
NA NA NA
NA NA NA
NA NA NA
NA NA NA
NA NA NA
NA NA NA
NA NA NA
NA NA NA
NA NA NA
NA NA NA
NA NA NA
NA NA NA
NA NA NA
NA NA NA
3.89 u 0.17 u 12.5 u 2.8 u 0.16 u 8.27 u 2.99 u 0.18 u 10.9 u 2.94 u 0.08 u 9.19 u 4.92 u 0.36 u 14.7 u 3.18 u 0.18 u 13.4 u 3.23 u 0.22 u 15.3 u 2.86 u 0.2 u 10 u
""' Q Cll ~ !C ~ ...
'iS I ,.Q
= =... 0
NA
NA
NA
NA
NA
NA
NA
NA
NA
NA
NA
NA
NA
NA
2.37 u 1.44 u 1.7 u 1.6 u 2.82 u 1.73 u 2.21 u 1.46 u ·-
~ ~ ~
I ,.Q =...
NA
NA
NA
NA
NA
NA
NA
NA
NA
NA
NA
NA
NA
NA
4.69
2.28
2.72
2.59
4.1
2.55
2.4
2.18
""' Cll !C ... 'iS = 0
u u u u u u u u
~ ~ E:;
~ >:l... §" <"':> ;::::: ... ~ ~ ~ :;:::
~ :::0 ~ ~ ~

s: I
§3 ~
I
N
8; ........
() I ......
.j::.
~ N
§
i
Q ..... ~ Cl. e = r-'1
04LA-96-0050
04LA-96-0051
04LA-96-0052
04LA-96-0052
04LA-96-0053
04LA-96-0054
04LA-96-0055
04LA-96-0056
04LA-96-0056
04PU-96-0010
04PU-96-0011
04PU-96-0012
04PU-96-0013
04PU-96-00 14
04PU-96-0015
04PU-96-0016
04PU-96-0016
04PU-96-0017
04PU-96-0018
04PU-96-0018
04PU-96-0019 L____ ---
Q ..... = 0
:::::: = t:.l 0 ~
LA-0005
LA-0006
LA-0007
LA-0007
LA-0008
LA-0009
LA-0010
LA-0011
LA-0011
PU-0005
PU-0006
PU-0007
PU-0008
PU-0009
PU-0010
PU-0011
PU-0011
PU-0012
PU-0013
PU-0013
PU-0014 --
t:.l
:a Q,j
E-.::: IS ...,. V5e on
0 = I
S;:J ~ e = :?J 0 Q,j '-' Q,j (;5 0
FP <2 0.11
AC <2 0.08
PFP <2 0.07
PFP <0.0625 0.24
AC <2 0.12
AC <2 0.08
PFP <2 0.1
FP <2 0.11
FP <0.0625 0.26
FP <2 0.1
FP <2 0.07
PC <2 0.09
AC <2 0.09
AC <2 0.1
FP <2 0.06
FP <2 0.07
FP <0.0625 0.14
PC <2 0.05
PFP <2 0.12
PFP <0.0625 0.15
PFP <2 0.11 L_ -- ----
'"' '"' '"' Q,j N Q,j r-- Q,j
5 N !8 ~ !5 N -; ~ -; I -; = z = Cl.
= z 0 0 0
u 0.07 u 1.19 u u 0.05 u 1 u u 0.07 u 1.19 u u 0.15 u 1.48 u u 0.1 u 1.4 u u 0.04 u 1.17 u u 0.04 u 1.27 u u 0.07 u 1.07 u u 0.05 u 1.66 u u 0.09 u 0.95 u u 0.06 u 0.89 u u 0.06 u 1.07 u u 0.04 u 1.02 u u 0.06 u 0.87 u u 0.1 u 0.92 u u 0.08 u 0.95 u u 0.09 u 1.38 u u 0.02 u 0.78 u u 0.1 u 1.1 u
0.12 u 1.25 u u 0.05 u 1.08 u -- - -- -
'"' '"' .... Q,j ~ Q,j
~ = ~ = N ... N . .. ~ -; ~ -;
= = =-- =--0 0
3.67 u 0.21 u 2.8 u 0.16 u 3.71 u 0.22 u 5.76 u 0.31 u 4.46 u 0.25 u 3.51 u 0.21 u 3.82 u 0.15 u 3.39 u 0.15 u 10.6 u. 0.38 u 2.97 u 0.15 u 2.9 u 0.12 u 3.77 u 0.17 u 3.04 u 0.19 u 2.78 u 0.13 u 2.9 u 0.08 u 3.26 u 0.21 u 5.27 u 0.26 u 2.34 u 0.13 u 3.44 u 0.14 u 5.47 u 0.24 u 3.55 u 0.16 u
I.
-c , '
:?J '"' '"' Q,j Q Q,j .... ...,. = .... !8 .... ~ ... N N N -; I -; ~ I
= ,.Q
= = =-- =--=-- 0 0
12.2 u 2.25 u 3.09
13 u 1.53 u 2.52
12.4 u 1.9 u 3.17
20.3 u 4.11 u 6.89
15 u 2.28 u 3.63
16.7 u 2.66 u 3.27
11.2 u 2.21 u 3.54
14.3 u 2.04 u 2.62
18 u 3.89 u 5.36
12.1 u 1.64 u 2.52
10.4 u 1.52 u 2.44
21.2 u 1.88 u 3.08
12.5 u 1.77 u 2.67
10.8 u 1.57 u 2.51
8.87 u 1.68 u 2.33
9.56 u 1.62 u 3.37
19.4 u 3.14 u 4.45
7.93 u 1.41 u 2.12
15.7 u 1.91 u 2.75
14.1 u 3.22 4.21
15.7 u 1.87 u 2.6
(I ' ~ " f ' ~ ~
'"' Q,j
!6 -; = 0
u u u u u u u u u u u u u u u u u u u u u
I I
~ ~ ~ 0..,
~ >:l.. ~-
~ .... ~ (")
~ ~ ;:: ~ >:l.. :::t:l ~ \::)
~
'1

5: I
~ ~
I
N
~ ~
n I ...... VI
f N 0
8
Q -Q,j
"S. 8 = rJ'l
FS2220
FS2221
FS2222
FS2224
FS2225 (x)
FS2226
FS2227
FS2228
FS2229
FS2230
FS2231
FS2233
FS2234
FS2235
04GU-96-0001
04GU-96-0002
04GU-96-0003
04GU-96-0004
04GU-96-0004
04GU-96-0005
04GU-96-0006
04GU-96-0007
Q (.I - :E ~~ = 0 0 = .... ..... 8;:;> = (.I 0
0 Q,j
..:l ~
16425 FP
16425 FP
16425 FP
16425 AC
16400 AC
16387 FP
A6228 PFP
A6228 PC
A6295 FP
A6295 FP
A6295 FP
A6295 AC
16425 FP
A6295 FP
GU-0001 FP
GU-0002 AC
GU-0003 FP
GU-0004 PFP
GU-0004 PFP
GU-0005 AC
GU-0006 PFP
GU-0007 FP
..
Q,j ;.., ;.., N ("l ~ Q,j QO Q,j
r;je ..... ..... 5 ff'l !5 ("l ("l ("l
~ 8 I I -; I -; ,Q ,Q = Q,j .._, =... =... = =... = r;j 0' 0'
<2 NA NA NA
<0.075 NA NA NA
0.075--0.25 NA NA NA
<2 NA NA NA
<2 NA NA NA
<2 NA NA NA
<2 NA NA NA
<2 NA NA NA
<2 NA NA NA
<0.075 NA NA NA
0.075--0.25 NA NA NA
<2 NA NA NA
0.25-2 NA NA NA
0.25-2 NA NA NA
<2 1.68 1.4 0 u <2 1.77 1.46 0.003 u <2 1.54 1.18 0.002 u <2 1.72 1.49 0.002 u <0.0625 1.68 0.87 NA
<2 1 0.89 0.002 u <2 1.72 1.24 0 u <2 1.28 1.13 0.003 u
= ~ ;.., ;..,
~ Q,j ff'l Q,j ~ = ("l = ("l
Q\ .... ("l . ... ("l ff'l -; I -; I ("l = = I = = = = = 0' 0' =...
NA NA NA
NA NA NA
NA NA NA
NA NA NA
NA NA NA
NA NA NA
NA NA NA
NA NA NA
NA NA NA
NA NA NA
NA NA NA
NA NA NA
NA NA NA
NA NA NA
0.010 u 1.38 u 3.16
0.011 1.05 u 2.28
0.009 u 1.02 u 2.4
0.004 u 1.18 u 2.56
NA 2.08 u 4.6
0.009 u 1.16 u 2.39
0.012 1.13 u 2.35
0.006 u 1.07 u 2.31 --
;.., ;.., Q,j IC Q,j = ("l 5 .... ("l -; I -; = = = = 0' 0'
NA
NA
NA
NA
NA
NA
NA
NA
NA
NA
NA
NA
NA
NA
u 3.24 u u 2.24
u 2.58 u u 2.57 u u 4.75
u 2.42 u u 2.25 u u 2.98 u
Q\ ..... ("l
I
= = NA
NA
NA
NA
NA
NA
NA
NA
NA
NA
NA
NA
NA
NA
2.45
0.97
1.55
1.01
2.03
1.08
1.45
1.2
;.., Q,j
!5 -= = 0'
I I
u u u u u u u u
~ ~ c:. ~
"" ~ §" ~ .....
~ ~
~ ~ :::: ~ :::;, ~ c:. ::t

s: I
§3 ~
I
N
~ ......
n I ...... 0\
$ N
§
Q .... Q.l
c.. e = rJ1
04LA-96-0050
04LA-96-0051
04LA-96-0052
04LA-96-0052
04LA-96-0053
04LA-96-0054
04LA-96-0055
04LA-96-0056
04LA-96-0056
04PU-96-0010
04PU-96-0011
04PU-96-0012
04PU-96-0013
04PU-96-0014
04PU-96-0015
04PU-96-0016
04PU-96-0016
04PU-96-0017
04PU-96-0018
04PU-96-0018
04PU-96-0019
Q .... = 0 -:: = CJ 0 ~
LA-0005
LA-0006
LA-0007
LA-0007
LA-0008
LA-0009
LA-0010
LA-0011
LA-0011
PU-0005
PU-0006
PU-0007
PU-0008
PU-0009
PU-0010
PU-0011
PU-0011
PU-0012
PU-0013
PU-0013
PU-0014
IJ :E Cl.l
~~ N
1:i5e 0 = ~ e e;;;.. 0 Cl.l'-'
1:i5 Cl.l c;;
FP <2
AC <2
PFP <2
PFP <0.0625
AC <2
AC <2
PFP <2
FP <2
FP <0.0625
FP <2
FP <2
PC <2
AC <2
AC <2
FP <2
FP <2
FP <0.0625
PC <2
PFP <2
PFP <0.0625
PFP <2
= "' "' ~ ~ ~ Cl.l QO Cl.l ~ ,...; ,...; !8 !"') 5 ~ ~ ~ Q\
A I = I = !"') .c = ~ =... =... = =... = I
0 0 = =...
1.66 1.2 0.003 u 0.197
0.84 0.62 0.003 u 0.033
2.22 2.13 0 u 0.012
2.27 0.62 u 0.002 u 0.277
1.53 1.21 0.005 u 0.058
1.26 0.97 0.002 u 0.008
1.95 1.5 0.001 u 0.010
1.7 1.38 0.006 u 0.038
2.05 0.52 u 0.005 u 0.040
0.96 0.74 0.001 u 0.007
1.08 0.76 -0.001 u 0.008
1.58 1.12 0.002 u 0.019
1.51 0.92 0.004 u 0.006
1.16 0.81 0 u 0.013
1.35 0.99 0.003 u 0.030
1.25 1.25 0.002 u 0.028
1.18 0.45 u 0.004 u 0.088
0.66 0.58 0.001 u 0.065
1.98 1.42 0.003 u 0.012
1.52 0.4 0.004 u 0.026
1.76 1.45 -0.002 u 0.002
"' "' "' Cl.l !"') Cl.l ~ Cl.l IC 5 ~ !5 ~ !5 ~
~ ~ ~ - I = = - I = = = = = ~ = ~ = ~ 0 0 0
1.38 u 3 u 3.05
1.18 u 2.24 u 2.62
1.38 u 2.91 u 3.01
2.3 u 4.93 u 4.67
1.62 u 3.4 u 3.55
u 1.13 u 3.22 u 3.4
1.7 u 3.07 u 3.18
1.11 u 2.49 u 2.87
1.83 u 4.77 u 4.91
u 1.32 u 2.31 u 3.19
u 0.95 u 2.33 u 2.15
1.13 u 2.58 u 2.91
u 0.91 u 2.39 u 2.79
1.05 u 2.19 u 2.36
0.76 u 2.28 u 2.36
1.17 u 2.38 u 2.57
2.16 u 3.9 u 4.13
0.88 u 1.85 u 1.91
1.22 u 2.91 u 2.76
1.86 u 3.36 3.74
u 0.7 u 2.98 u 2.75 ---
~ f "
"' Cl.l
!5 = = 0
u u u u u u u u u u u u u u u u u u u u u
Q\ "' Cl.l ..... !5 ~ I = = ~ = 0
1.6 u 1.38 u 1.83 u 3.43 u 1.83 u 1.38 u 0.96 u 1.34 u 2.49 u 1.22 u 1.27 u 1.58 u 1.56 u 1.46 u 1.39 u 1.85 u 2.01 u 1.24 u 1.46 u 2.12 u 1.68 u
! f ~
~ ~ § "" ~ ~-(I> ;::: .... ~ £-~ $:::
5.. ~ ~ c :::t
~ £ ~

I .a
s: I
~ ~ I
N
~ ........
n I .......
-.l
$ N
§
I
Q .... .!l =-E = ~
FS2220
FS2221
FS2222
FS2224
FS2225 (x)
FS2226
FS2227
FS2228
FS2229
FS2230
FS2231
FS2233
FS2234
FS2235
04GU -96-0001
04GU-96-0002
04GU-96-0003
04GU-96-0004
04GU-96-0004
04GU-96-0005
04GU-96-0006
04GU-96-0007
Q tJ .... :.a E'::: = 0 0 = ... .... E:::> = tJ 0
0 ~
..:l ~
16425 FP
16425 FP
16425 FP
16425 AC
16400 AC
16387 FP
A6228 PFP
A6228 PC
A6295 FP
A6295 FP
A6295 FP
A6295 AC
16425 FP
A6295 FP
GU-0001 FP
GU-0002 AC
GU-0003 FP
GU-0004 PFP
GU-0004 PFP
GU-0005 AC
GU-0006 PFP
GU-0007 FP
i;
~
""' ""' N I.e ~ ~ !"') ti5e Q e:: II') e:: ..... .... = r-. ... ..... ~ E I I -; I
= = ~ = = ~ = ~ .._, =: ~ ... 01 01 ~
<2 NA NA NA
<0.075 NA NA NA
0.075-0.25 NA NA NA
<2 NA NA NA
<2 NA NA NA
<2 NA NA NA
<2 NA NA NA
<2 NA NA NA
<2 NA NA NA
<0.075 NA NA NA
0.075-0.25 NA NA NA
<2 NA NA NA
0.25-2 NA NA NA
0.25-2 NA NA NA
<2 0.44 u 0.14 u 0.35
<2 0.47 u 0.1 u 0.09
<2 1.09 u 0.05 u 0.1
<2 0.81 u 0.09 u 0.11
<0.0625 1.45 u 0.15 u 0.09
<2 0.99 u 0.12 u 0.05
<2 0.93 u 0.05 u 0.04
<2 0.42 u 0.08 u 0.08
""' ""' ""' ~ ~ ~ e:: II') !5 Q 5 ... 00 Q\ - I - I -= ""' = ""' = = ~ = ~ = 01 01 01
NA NA
NA NA
NA NA
NA NA
NA NA
NA NA
NA NA
NA NA
NA NA
NA NA
NA NA
NA NA
NA NA
NA NA
u 0.14 u 0.1 u u 0.11 u 0.4 u u 0.1 u 0.6 u u 0.09 u -0.1 u u 0.19 u NA
u 0.12 u 0.5 u u 0.12 u 0.2 u u 0.1 u 0.1 u
""' r-. ~ 00 ("l e:: ("l ("l . .. ("l
I -; I .:: -= = Eo; Eo; 01
NA NA
NA NA
NA NA
NA NA
NA NA
NA NA
NA NA
NA NA
NA NA
NA NA
NA NA
NA NA
NA NA
NA NA
1.77 u 1.58
1.38 u 1.81
1.41 u 1.4
1.5 u 1.8
2.03 u NA
1.36 u 0.9
1.43 u 1.72
1.28 u 1.26 -
Q !"') ("l
I
-= Eo;
NA
NA
NA
NA
NA
NA
NA
NA
NA
NA
NA
NA
NA
NA
1.58
1.8
1.34
1.82
NA
0.9
1.68
1.34
E § "" ~ §' ~ ::= ... ~ ~
~ ~ $:::
~ :::.:; ~ c :t

s: I
§3 8
I
N
&
~ IJ ~ - :a Cll - -- e:::: N IC Cll Cll ~ Cll = ~e Q !S II) 5 .... Q. 0
0 = .... t-- .... :0::: ~ E . = . = . E ~ E;:J = Cll = IJ 0 Cll '-' =: = rJj = rJj ~ 0 Cll ~ 0' 0' rJj
~ t;,!)
....... 04LA-96-0050 LA-0005 FP <2 1.31 u 0.12 u 0.15
04LA-96-0051 LA-0006 AC <2 0.62 u 0.1 u 0.04
04LA-96-0052 LA-0007 PFP <2 1.15 u 0.09 u 0.08
04LA-96-0052 LA-0007 PFP <0.0625 1.4 u 0.24 u 0.22
04LA-96-0053 LA-0008 AC <2 1.27 u 0.17 u 0.17
04LA-96-0054 LA-0009 AC <2 0.83 u 0.23 u 0.14
04LA-96-0055 LA-0010 PFP <2 1.24 u 0.14 u 0.17
04LA-96-0056 LA-0011 FP <2 0.81 u 0.12 u 0.05
04LA-96-0056 LA-0011 FP <0.0625 2.91 u 0.23 u 0.28
04PU-96-0010 PU-0005 FP <2 0.86 u 0.1 u 0.11 n I
00 04PU-96-0011 PU-0006 FP <2 0.75 u 0.05 u 0.11
04PU-96-0012 PU-0007 PC <2 0.67 u 0.13 u 0.12
04PU-96-0013 PU-0008 AC <2 0.9 u 0.06 u 0.1
04PU-96-00 14 PU-0009 AC <2 0.64 u 0.12 u 0.09
04PU-96-0015 PU-0010 FP <2 0.37 u 0.12 u 0.12
04PU-96-0016 PU-0011 FP <2 0.35 u 0.09 u 0.08
04PU-96-0016 PU-0011 FP <0.0625 2.55 u 0.25 u 0.09
04PU-96-0017 PU-0012 PC <2 0.45 u 0.09 u 0.07
04PU-96-0018 PU-0013 PFP <2 1.07 u 0.21 u 0.19
04PU-96-0018 PU-0013 PFP <0.0625 1.66 u 0.17 u 0.11
04PU-96-0019 PU-0014 PFP <2 0.82 u 0.07 u 0.09 .....
~ N
§
- - -Cll Cll Cll a= II) !6 Q 5 .... QO =--= . = I = - -= rJj = rJj = 0' 0' 0'
u 0.14 u 1 u u 0.1 u -0.2 u u 0.13 u 0.2 u u 0.21 u 0.2 u u 0.15 u 0 u u 0.14 u 0.7 u u 0.14 u 0.5 u u 0.11 u 1 u u 0.24 u 0.2 u u 0.12 u 0.2 u u 0.09 u -0.3 u u 0.12 u 0.2 u u 0.13 u -0.2 u u 0.11 u -0.1 u u 0.11 u -0.1 u u 0.11 u 0.2 u u 0.21 u 0.1 u u 0.09 u 0.4 u u 0.13 u 0.1 u u 0.18 u 0.2 u u 0.13 u 0.1 u
~ ~ ~
-t-- Cll N a= N .... . = -= Eo- = 0'
1.72 u 1.25 u 1.79 u 2.32 u 1.93 u 1.74 u 1.85 u 1.57 u 2.44 u 1.32 u 1.32 u 1.55 u 1.48 u 1.25 u 1.36 u 1.41 u 1.88 u 1.04 u 1.68 u 1.92 u 1.66 u
1 " ~
QO N N . -= Eo-
1.53
0.86
2.12
2.76
1.31
1.35
1.68
1.78
2.38
0.95
1.16
1.46
1.36
1.29
1.3
1.39
1.59
0.7
1.99
1.71
1.82
Q ~ N . -= Eo-
1.29
0.82
2.12
2.53
1.4
1.31
1.76
1.59
2.03
0.9
0.92
1.29
1.2
1.06
1.05
1.24
1.77
0.69
1.95
1.82
1.93
:
Q
i ""' ~ ~ §" (1:> ;::: .....
~ ~
~ 2! ~ :::t:J ~ \:)
::t
'I'' '-l ~~

i J
s: '
~ ~ ' N
~ ._
n I ......
1.0
~ N 0
~
~ -~ -a e = r.r:.
FS2220
FS2221
FS2222
FS2224
FS2225 (x)
FS2226
FS2227
FS2228
FS2229
FS2230
FS2231
FS2233
FS2234
FS2235
04GU-96-0001
04GU-96-0002
04GU-96-0003
04GU-96-0004
04GU-96-0004
04GU-96-0005
04GU-96-0006
04GU-96-0007 - --~~
~ C.l - :.a ~:::: = 0
::: 0 = e~ = C.l 0
0 ~
~ ~
16425 FP
16425 FP
16425 FP
16425 AC
16400 AC
16387 FP
A6228 PFP
A6228 PC
A6295 FP
A6295 FP
A6295 FP
A6295 AC
16425 FP
A6295 FP
GU-0001 FP
GU-0002 AC
GU-0003 FP
GU-0004 PFP
GU-0004 PFP
GU-0005 AC
GU-0006 PFP
GU-0007 FP
~ .... N ~ ..,. ~ Ci3e ~ ~ 5 ~ ~
~ e I .= -; -= = ~ '-' Eo< Eo< Ci3 0
<2 -NA NA
<0.075 NA NA
0.075-0.25 NA NA
<2 NA NA
<2 NA NA
<2 NA NA
<2 NA NA
<2 NA NA
<2 NA NA
<0.075 NA NA
0.075-0.25 NA NA
<2 NA NA
0.25-2 NA NA
0.25-2 NA NA
<2 1.54 3.92 u <2 1.65 2.7 u <2 1.43 3.15 u <2 1.83 3.03 u <0.0625 NA 4.59 u <2 0.99 3.16 u <2 1.8 3 u <2 1.23 2.84 u
_L___
.... 00 ..,. In ~
= c 00 ~
~ ~ ... ~ ~ ~ -; ~ I I I I
E= ~ ~ = ~ 0
NA NA NA NA
NA NA NA NA
NA NA NA NA
NA NA NA NA
NA NA NA NA
NA NA NA NA
NA NA NA NA
NA NA NA NA
NA NA NA NA
NA NA NA NA
NA NA NA NA
NA NA NA NA
NA NA NA NA
NA NA NA NA
0.69 1.4 0.12 1.4
0.67 2.5 0.15 1.7
0.47 1.3 0.12 1.4
0.66 1.6 0.13 1.5
0.85 NA NA NA
0.44 0.85 0.1 0.86
0.72 1.3 0.13 1.5
0.45 1.2 0.06 u 1.1 -
.... .... ~ ~ c 00 !6 . .. 00 -; I -; = ;;.. = 0 0
NA
NA
NA
NA
NA
NA
NA
NA
NA
NA
NA
NA
NA
NA
0.06 u 0.03 u 0.03 u 0.05 u 0.2 u 0.02 u 0.03 u 0.04 u
In \0
I = N
NA
NA
NA
NA
NA
NA
NA
NA
NA
NA
NA
NA
NA
NA
0.21
0.34
0.11
0.12
0.33
0.12
0.13
0.12
.... ~
5 -; = 0
u u u u u u u u
~ ~ ;::::
'""' ~ §" ~ ;:::: .... ~ ~
~ ~ :;;::
~ ~
~ C)
::t
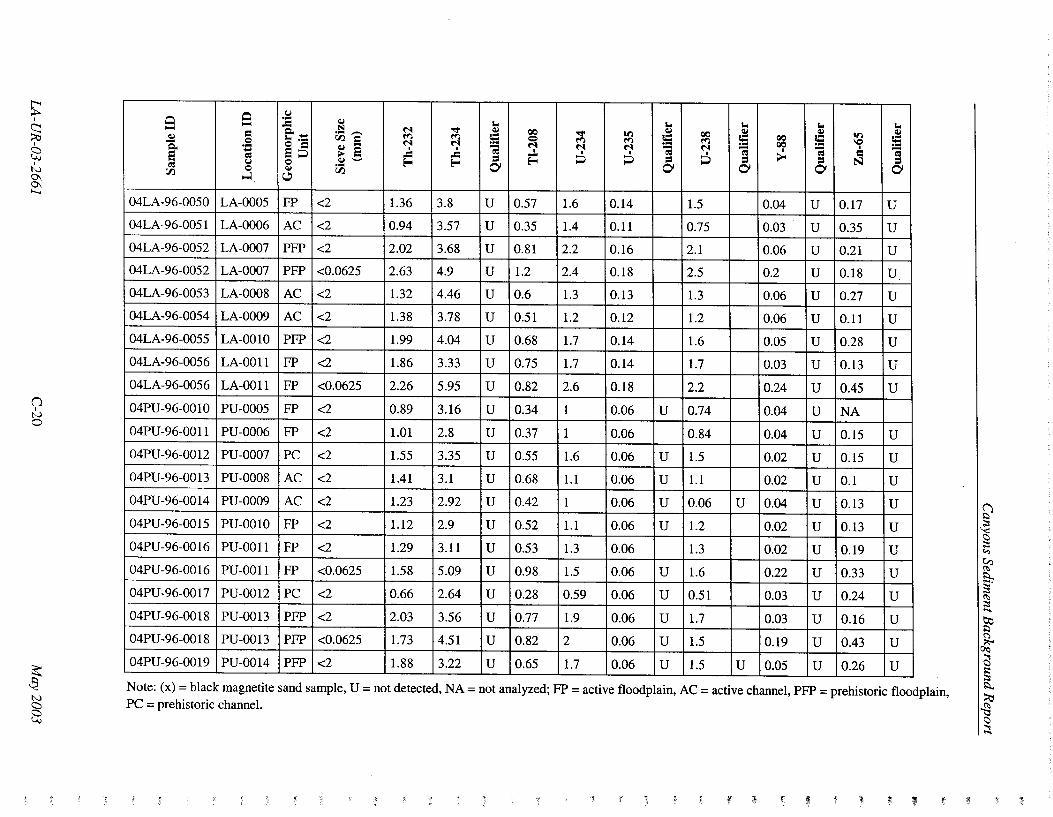
s: I
§3 @
I
N
~ .......
n I
N 0
~ N
§
Q (.J
Q - :a Q.l
"" "" "" "" "" - ~== N N ""' Q.l QO ""'
Q.l Q.l Q.l Q.l ~ = ti5e ~ ~ = Q lrl 5
QO
5 QO 5 lrl = -a 0 N N ~ ~ ~ QO IC ... ... 0 = -; N N N -; N -; -; I -; ... 8~ ~ 8 .= I I I I I
I = 8 = .c: = E= ~ ;;:l = ~ = ;;... = N = (.J 0 Q.l '-' E-< E-< = 0 ~ ti5 0 0 0 0 0 rJ1 ~ ~
04LA-96-0050 LA-0005 FP <2 1.36 3.8 u 0.57 1.6 0.14 1.5 0.04 u 0.17 u 04LA-96-0051 LA-0006 AC <2 0.94 3.57 u 0.35 1.4 0.11 0.75 0.03 u 0.35 u 04LA-96-0052 LA-0007 PFP <2 2.02 3.68 u 0.81 2.2 0.16 2.1 0.06 u 0.21 u 04LA-96-0052 LA-0007 PFP <0.0625 2.63 4.9 u 1.2 2.4 0.18 2.5 0.2 u 0.18 u 04LA-96-0053 LA-0008 AC <2 1.32 4.46 u 0.6 1.3 0.13 1.3 0.06 u 0.27 u 04LA-96-0054 LA-0009 AC <2 1.38 3.78 u 0.51 1.2 0.12 1.2 0.06 u 0.11 u 04LA-96-0055 LA-0010 PFP <2 1.99 4.04 u 0.68 1.7 0.14 1.6 0.05 u 0.28 u 04LA-96-0056 LA-0011 FP <2 1.86 3.33 u 0.75 1.7 0.14 1.7 0.03 u 0.13 u 04LA-96-0056 LA-0011 FP <0.0625 2.26 5.95 u 0.82 2.6 0.18 2.2 0.24 u 0.45 u 04PU-96-0010 PU-0005 FP <2 0.89 3.16 u 0.34 1 0.06 u 0.74 0.04 u NA
04PU-96-0011 PU-0006 FP <2 1.01 2.8 u 0.37 1 0.06 0.84 0.04 u 0.15 u 04PU-96-0012 PU-0007 PC <2 1.55 3.35 u 0.55 1.6 0.06 u 1.5 0.02 u 0.15 u 04PU-96-0013 PU-0008 AC <2 1.41 3.1 u 0.68 1.1 0.06 u 1.1 0.02 u 0.1 u 04PU-96-0014 PU-0009 AC <2 1.23 2.92 u 0.42 1 0.06 u 0.06 u 0.04 u 0.13 u 04PU-96-0015 PU-0010 FP <2 1.12 2.9 u 0.52 1.1 0.06 u 1.2 0.02 u 0.13 u 04PU-96-0016 PU-0011 FP <2 1.29 3.11 u 0.53 1.3 0.06 1.3 0.02 u 0.19 u 04PU-96-0016 PU-0011 FP <0.0625 1.58 5.09 u 0.98 1.5 0.06 u 1.6 0.22 u 0.33 u 04PU-96-0017 PU-0012 PC <2 0.66 2.64 u 0.28 0.59 0.06 u 0.51 0.03 u 0.24 u 04PU-96-0018 PU-0013 PFP <2 2.03 3.56 u 0.77 1.9 0.06 u 1.7 0.03 u 0.16 u 04PU-96-0018 PU-0013 PFP <0.0625 1.73 4.51 u 0.82 2 0.06 u 1.5 0.19 u 0.43 u 04PU-96-0019 PU-0014 PFP <2 1.88 3.22 u 0.65 1.7 0.06 u 1.5 u 0.05 u 0.26 u L~ -
Note: (x) = black magnetite sand sample, U = not detected, NA = not analyzed; FP = active floodplain, AC = active channel, PFP =prehistoric floodplain, PC = prehistoric channel.
~~ :!) ~ • ~
f § "" ~ l:l... §" (II
~ .....
iS' (')
~ 2l ;:::
~ ~
~ \:)
:::t
":

s;: I
~ 8
I N
~ .......
tl I ,_.
~ N
§
APPENDIX D RESULTS OF PARTICLE-SIZE DISTRIBUTION ANALYSIS
- Size Interval (mm) as % wt • ..... ~ .:::::
=1:1: Q -c. ll'l ll'l ~ Q,l ""'" ~ Q,l ll'l ~ .... - ... Q- ll'l = ..... Q,l -= Q II')
~ ~ \0 = = tl.:l - c. Q,l s Q .... Q
~ "0 c. '"' - ~ ~ l '9 ~ ~ ~ s 0 ~.._, -Q,l = s s ll'l ll'l ~ ll'l .....
tl.:l ~ .... ~ 0 = .... ,...; ~ ~ \C = Q,l tl.:l = Q .... = = ~ = = Upper Los Alamos Canyon
ULA-1 04LA-96-0050 FP 3-18 0.03 5.53 9.59 18.81 19.91 27.33 13.9
ULA-2 04LA-96-0051 AC 0-10 4.47 40.75 28.05 13.38 6.11 4.33 1.5
ULA-3 04LA-96-0052 PFP 22-34 3.85 8.33 11.48 21.8 21.94 17.91 9.6
ULA-4 04LA-96-0053 AC 4-13 0.25 30.66 32.34 17.28 8.64 4.43 3.6
ULA-5 04LA-96-0054 PC 10-38 2.07 30.4 26.11 15.63 10.93 7.15 4.4
ULA-6 04LA-96-0055 PFP 22-41 0.85 13.08 26.84 22.23 17.15 13.04 4.4
ULA-7 04LA-96-0056 FP 3-28 6.91 14.57 19.12 21.26 17.9 11.45 5.5
Upper Guaje Canyon
UGC-1 04GU -96-0001 FP 0-23 4.45 23.37 27.39 18.59 11.76 9.83 2.9
UGC-2 04GU-96-0002 AC 0-5 3.36 9.9 10.29 14.16 18.92 31.16 7.6
UGC-3 04GU-96-0003 FP 1-14 4.48 31.37 32.05 17.75 7.76 4.48 1.2
UGC-4 04GU-96-0004 PFP 160-190 5.38 17.05 21.92 14.33 12.73 18.89 6
UGC-5 04GU-96-0005 AC 0-19 20.81 42.65 22.25 7 3.36 3.13 0.6
UGC-6 04GU-96-0006 PFP 64-74 0.7 9.09 21.4 20.69 18.94 18.29 6.5
UGC-7 04GU-96-0007 FP 0-5 7.87 34.81 32.08 13.26 5.46 4.82 1.2 _L ___
L_- --
f'l "0....: _....: - = ~ Q = ~~ = ~ = - tl.:l~ = 0
E-o v
4.9 100 53.87 41.23
1.4 99.99 92.76 5.83
5.1 100.01 67.4 27.51
2.8 100 89.17 8.03
3.3 99.99 85.14 11.55
2.4 99.99 80.15 17.44
3.3 100.01 79.76 16.95
1.7 99.99 85.56 12.73
4.6 99.99 56.63 38.76
0.9 99.99 93.41 5.68
3.7 100 71.41 24.89
0.2 100 96.07 3.73
4.4 100.01 70.82 24.79
0.5 100 93.48 6.02 L_ ___
,.........: = ~ -u~
4.9
1.4
5.1
2.8
3.3
2.4
3.3
1.7
4.6
0.9
3.7
0.2
4.4
0.5
s....: s ~ f'l~ I\
14.6
66.3
6.1
47.8
56.6
9.7
54.1
16.8
11.2
38.9
19
28.4
11.7
30.7
~ ~ ;::
"' ~ ~-;:: .....
~ ~ ~ :::: ;:: !:l... :::tl
{5 C)
:t
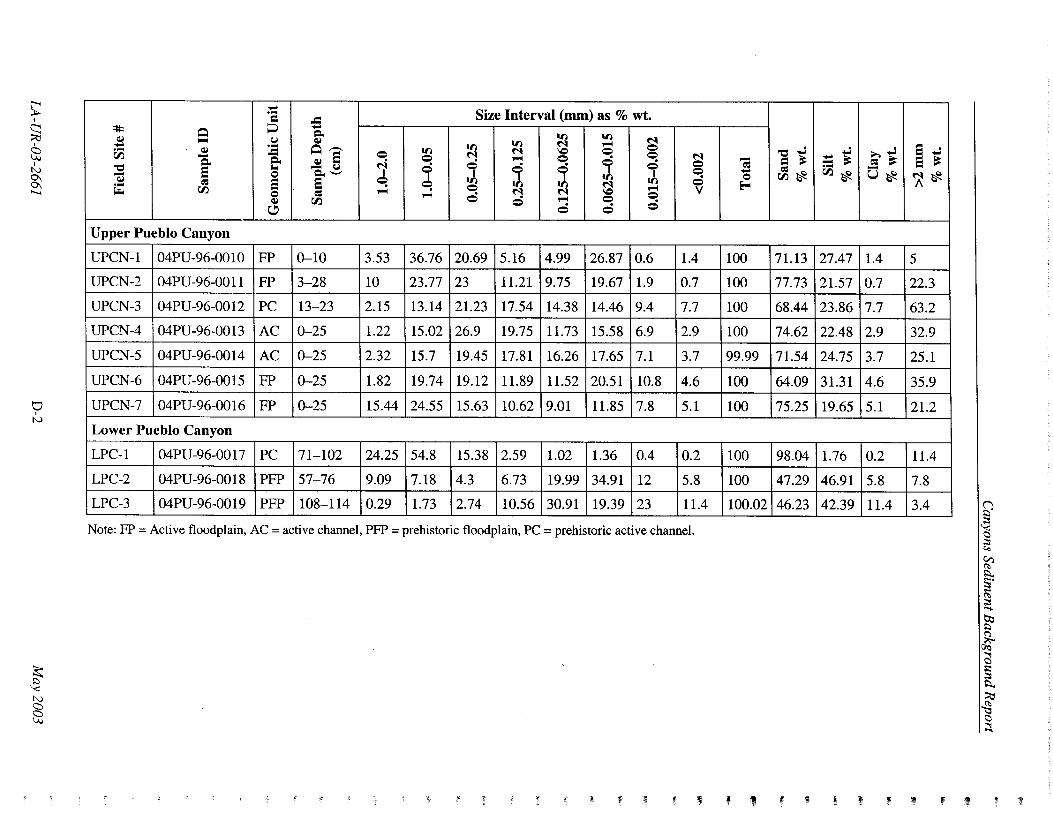
~ I
~ ~
I
N
8; .......
tJ I
N
~ N
§
- Size Interval (mm) as % wt • .... = .=
::ij: Q ~ -~ =.. In In ('-1 ..... CJ ~ In ('-1 ~ - .... o..--. In 0 "C...; .... ~ .= In ('-1 \C 0 00. - =.. ~ 8 0 0 ~ ~ ~ ~
0 ~ - = ~ s- N 0 0 0 ec "C "" - CJ 0 ~ J: 0 - ec - Q =-- d, J I .h Q 00.~ ~ ec 8 8 In ~ 0 ~ .... 0 ~ v ~ 00. Q ec ~ ~ 0 ~ ('-1 '-= 0 ~ 00. 0 ~ c: 0 ~ 0 0
Upper Pueblo Canyon
UPCN-1 04PU-96-0010 FP 0-10 3.53 36.76 20.69 5.16 4.99 26.87 0.6 1.4 100 71.13
UPCN-2 04PU-96-0011 FP 3-28 10 23.77 23 11.21 9.75 19.67 1.9 0.7 100 77.73
UPCN-3 04PU-96-0012 PC 13-23 2.15 13.14 21.23 17.54 14.38 14.46 9.4 7.7 100 68.44
UPCN-4 04 PU -96-0013 AC 0-25 1.22 15.02 26.9 19.75 11.73 15.58 6.9 2.9 100 74.62
UPCN-5 04PU-96-0014 AC 0-25 2.32 15.7 19.45 17.81 16.26 17.65 7.1 3.7 99.99 71.54
UPCN-6 04PU-96-0015 FP 0-25 1.82 19.74 19.12 11.89 11.52 20.51 10.8 4.6 100 64.09
UPCN-7 04PU-96-0016 FP 0-25 15.44 24.55 15.63 10.62 9.01 11.85 7.8 5.1 100 75.25
Lower Pueblo Canyon
LPC-1 04 PU -96-0017 PC 71-102 24.25 54.8 15.38 2.59 1.02 1.36 0.4 0.2 100 98.04
LPC-2 04PU-96-0018 PFP 57-76 9.09 7.18 4.3 6.73 19.99 34.91 12 5.8 100 47.29
LPC-3 04PU-96-00 19 PFP 108-114 0.29 1.73 2.74 10.56 30.91 19.39 23 11.4 100.02 46.23
Note: FP = Active floodplain, AC = active channel, PFP =prehistoric floodplain, PC =prehistoric active channel.
~ ~ ~ ~ , ' ' ~
_...; ;;.......l 8 ...; = ~ ec ~ 8 ~ 00.~ -u~ ('-1~
A
27.47 1.4 5 i
21.57 0.7 22.3
23.86 7.7 63.2
22.48 2.9 32.9
24.75 3.7 25.1
31.31 4.6 35.9
19.65 5.1 21.2
1.76 0.2 11.4
46.91 5.8 7.8
42.39 11.4 3.4
' it ' !' !
f ;:: Coo
~ >:l... §" (1:> ;:: ......
~ (")
~ ~ 0:::
~ ~
~ ~ :4.
t

Canyons Sediment Background Report
APPENDIX E PROBABILITY PLOTS
The probability plots show each background analytical result ordered from lowest to highest. Detected values are shown as solid circles, and nondetects, plotted as one-half of the detection limit, are shown as open circles. The x-axis is the standard normal quantile scale. The units of the standard normal quintile are in standard deviation, where I represents one sigma or standard deviation. The y-axis of the probability plot is the concentration of the inorganic chemicals (in mglkg) or radionuclides (in pCi/g). The purpose of these plots is twofold. First, they are a succinct way to present all data for each analyte. Second, they provide a way to assess the statistical distribution of each analyte. Specifically, if the data for an analyte follow a straight line when plotted on an untransformed or standard normal scale, these data are considered to originate from a normal statistical distribution. One can assess the fit to other statistical distributions by transforming the y-axis to another scale. For example, chemicals frequently follow a lognormal distribution, and transforming the y-axis into a logarithmic scale assesses the fit to a lognormal distribution.
This appendix contains probability plots for each analyte on three scales: (1) untransformed, (2) square root transformation, and (3) natural logarithmic transformation. Probability plots for in organics are provided in Figure E-1, and probability plots for radionuclides are provided in Figure E-2.
LA-UR-03-2661 E-1 May2003

0
"' Ill
• -2
No Transformation
•
-1 0 Quantiles of Standard Normal
No Transformation
C\i o oo 00
-2
0
-2
-1 0 Quantiles of Standard Normal
No Transformation
.. -
•• -1 0
• •
Quantiles of Standard Normal
•
2
•
2
•
2
8
0 -:--N g 0 ()
t CT Ul<X!
<D 0
-2
Aluminum Square Root Transformation
•
• -1 0
Quantiles of Standard Normal
Antimony Square Root Transformation
0 00 00
-2
0
-2
-1 0 Quantiles of Standard Normal
Arsenic Square Root Transformation
• 0
•
-1 0
•• •
Quantiles of Standard Normal
Canyons Sediment Background Report
2
•
2
•
2
0 ai
Ill ~<xi c.;i c: oo Q.cxi c:
....J Ill r..:
0 r..:
Ill <ci
g 0 Q.C\J c: . ....J~
Ill 0
Natural Logarithmic Transformation
• •
• • -2 -1 0 2
Quantiles of Standard Normal
Natural Logarithmic Transformation
•
0 00 00
-2 -1 0 2 Quantiles of Standard Normal
Natural Logarithmic Transformation
-•• -• •
•
'=! •
• 0 0
-2 -1 0 2 Quantiles of Standard Normal
Figure E-1. Probability plots for inorganic sediment data
LA-UR-03-2661 E-2 May2003
..

Canyons Sediment Background Report
Barium No Transformation Square Root Transformation Natural Logarithmic Transformation
• • @ • "' 0 ..t
0 0
0
Oio ..t
~CXl dco 0 c: .s 0 c:.,.,
u 8cn g~ t: c: a 0 en CD -' u 0
0 C'i • '<t
• "' 0 C\i C\1
• 0 • • C\i
-2 -1 0 2 -2 -1 0 2 -2 -1 0 2 Quantiles of Standard Normal Quantiles of Standard Normal Quantiles of Standard Normal
Beryllium No Transformation Square Root Transformation Natural Logarithmic Transfor111ation
• • "! • 0
•• '=!
'=!
g~ CXl -;]'0 ~· e>o c: 0
E 0 c: u 0
ti~ t:"' •• u c:O ao c: • 8'<t en -'<)I
0 '<t 0 •
C\1 '~ 0
C\1 "?
0 0 0 0 0 0 - 0 -2 -1 0 2 -2 -1 0 2 -2 -1 0 2
Ouantiles of Standard Normal Quantiles of Standard Normal Quantiles of Standard Normal
Cadmium No Transformation Square Root Transformation Natural Logarithmic Transformation
CXl
0 • • • ~ • ~ ";"
0
'<t ~
"' oo ~M C\1
~ go • -:--N • ()'
.s • 0 • c: £ 0
• u Oo to c: 5-r-: a"' -' uo end CD
~
"' CD C\1
0 0 0 0
0 0 0000 0 0 00000 <? 0 0 00000
-2 -1 0 2 -2 -1 0 2 -2 -1 0 2 Ouantiles of Standard Normal Quantiles of Standard Normal Quantiles of Standard Normal
Figure E-1 (continued). Probability plots for inorganic sediment data
LA-UR-03-2661 E-3 May 2003

Canyons Sediment Background Report
Calcium II''·'
No Transformation Square Root Transformation Natural Logarithmic Transformation .. 0 • • 0 • 0 0 0 '<!" "' a)
0 ttl ~w.-0 r-.: 0 ttl ~o
Ol(')
'§, e,j --:-o c (J • ,..,.
.So 8~ Cl'-
8 u8 t ~ttl • §C\1 CT c . • "" C/)0
...J<O ()
"' 0 0 «i "" 0 • 0
0 ttl C\1 tri • .... ..
• • • -2 -1 0 2 -2 -1 0 2 -2 -1 0 2 lfik·
Quantiles of Standard Normal Quantiles of Standard Normal Quantiles of Standard Normal
Chloride No Transformation Square Root Transformation Natural Logarithmic Transformation ...
0 • • • 0 • ,.; • 0
• C\i CXl
Ci ttl
--,.C\i ..-,."! '§, (J c u~
.§."' 0 c () 0
e,j t'o ()
c c5fC\i s~ 0 ()'<!"
"! ttl
C\1 0
0 0 0 0 0 0 0 0 0 0 0 0 0 0 0
-1.0 0.0 0.5 1.0 -1.0 0.0 0.5 1.0 -1.0 0.0 0.5 1.0 Quantiles of Standard Normal Quantiles of Standard Normal Quantiles of Standard Normal
Chromium No Transformation Square Root Transformation Natural Logarithmic Transformation
• 0 • • • • ,.; • 0
CXl ... • C\i
ttl C\i "!
~"' e,j • §o
e,j .... .§. ()C\i a~ e,j t u~ c §.r CT ...J C/) ()
"! ttl • 0
C\1 0
C> 0 • • • • • -2 -1 0 2 -2 -1 0 2 -2 -1 0 2
Quantiles of Standard Normal Quantiles of Standard Normal Quantiles of Standard Normal
Figure E-1 (continued). Probability plots for inorganic sediment data
LA-UR-03-2661 E-4 May2003
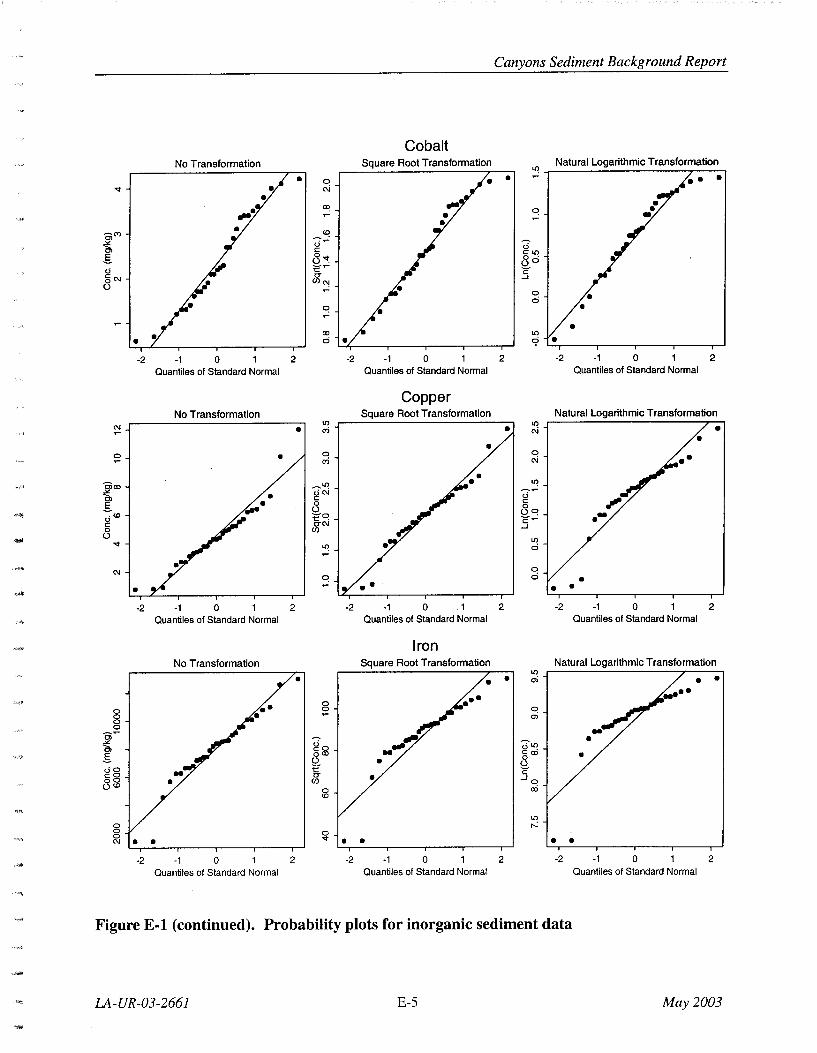
Canyons Sediment Background Report
Cobalt No Transformation Square Root Transformation
lL1 Natural Logarithmic Transformation
• 0 • • • C\i
"! '=!
• <0 Ci<'l
~ ti~ <) c
§. 8"<~: Cl()
8o <.i :e~ c §C\1 CT _J
() U)"!
0 • 0 '=! •
• Cll I()
• 0 9 • -2 -1 0 2 -2 -1 0 2 -2 -1 0 2
Ouantiles of Standard Normal Quantiles of Standard Normal Quantiles of Standard Normal
Copper No Transformation Square Root Transformation Natural Logarithmic Transformation
C\1 I() I() • .,; • C\i • 0 • 0 0
.,; C\i
~tO -;]~ lL1
~~
c <.i E 0 c ... dco () 8'=! ~a .-t::. c:~ c O"C\1 0 U)
_J
.... () ..,. I()
lL1 0
"~~ C\1 0
'=! 0 • • • • -2 -1 0 2 -2 -1 0 2 -2 -1 0 2
Quantiles of Standard Normal Quantiles of Standard Normal Quantiles of Standard Normal
Iron No Transformation Square Root Transformation Natural Logarithmic Transformation
I()
• • • a; • •
0 8 0 0 a; 0 0
Ci~
~ do d~ §. §co §"' • () • ()
gg t c CT • oo U) ...Jo ()<0
0 cri <0
I()
0 r-.: 0 0 0 C\1 • • ..,. • • • •
-2 -1 0 2 -2 -1 0 2 -2 -1 0 2
Quantiles of Standard Normal Quantiles of Standard Normal Quantiles of Standard Normal
Figure E-1 (continued). Probability plots for inorganic sediment data
LA-UR-03-2661 E-5 May 2003

"'' •u
Canyons Sediment Background Report ...,,
...
•• Lead
No Transformation Square Root Transformation Natural Logarithmic Transformation -l!) • l!) • N 0 "" (')
0 N l!)
.r C\i Ol d ~l!) • ti '"'' c: .s~
0 c:o () 8C\i
ti ~"' c \iO,h
c: 0' ~
8~ en ll:) ,.,,,
• N C>
l!) ~··
0 0
""' -2 -1 0 2 -2 -1 0 2 -2 -1 0 2
Quantiles of Standard Normal Quantiles of Standard Normal Quantiles of Standard Normal ~
Magnesium No Transformation Square Root Transformation Natural Logarithmic Transformation
0
• l!) • l!)
0 0
,...: 0 N 0
.r 0
O>g ,...:
~l!) ti ti g~
c: C:l!) 0 Oo
0 ' o<O gg ~"' c
0' ~ oo en 0 o~ cri
• 0 0 N l!) 0 l!) Lt)
• • • • -2 -1 0 2 -2 -1 0 2 -2 -1 0 2
Quantiles of Standard Normal Quantiles of Standard Normal Quantiles of Standard Normal
Manganese No Transformation Square Root Transformation Natural Logarithmic Transformation
0 • • • • • 0 l!) • 0 ••
cri • 0
0 N
0 .r l!)
Ol Lt)
~0 ti ti c: EO 01!)
c: oo
~"' o~ ()· ti ~ ~l!)
c: c: 0' ~
88 en N
l!)
~ 0
0 0 0
• ~ • ,.,,.<
• • -2 -1 0 2 -2 -1 0 2 -2 -1 0 2
Quantiles of Standard Normal Quantiles of Standard Normal Quantiles of Standard Normal
Figure E-1 (conthmed). Probability plots for inorganic sediment data
LA-UR-03-2661 E-6 May 2003

Canyons Sediment Background Report
Mercury No Transformation Square Root Transformation Natural Logarithmic Transformation
0
"' • • • 0 0
<0
"' ~
C\1 0 co 0 <? 0
0> ~0 0-.:t • • 0 c:~ c: EN 0 .
0 ~o • • ()0 () oo t: s~ c: CT
0 (I) "'i u, C\1
5 0
0
0 0 <0 5 0 0 000 00 0 0 00 "'f 0 0 00 0 0 0
-2 -1 0 2 -2 -1 0 2 -2 -1 0 2 Quantiles of Standard Normal Quantiles of Standard Normal Quantiles of Standard Normal
Nickel No Transformation Square Root Transformation Natural Logarithmic Transformation
C! • • • "' 0 co C\i
• Ill C\1
Ill
~co 0 0 c: c: .s 8C! 0
0 ~"' ~C! t: c:~ • §..q CT ....J
() (I)
• Ill "' • 0 •
C\1
0 0 C! a a 0 a 0 0
-2 -1 0 2 -2 -1 0 2 -2 -1 0 2 Quantiles of Standard Normal Quantiles of Standard Normal Quantiles of Standard Normal
Potassium No Transformation Square Root Transformation Natural Logarithmic Transformation
0 • 0 • • 0
"' "' C\1 • "' ....: 0
8 0 C\1 '<t 0 0> ....: ~8 0 0 c: c: .s~ 0
OLO () ()'
0 ~o ~co 5-C') c: c:o ....J 8g (I)
0
• <0
0 0 0 C\1
"' "' ui
• • • • • -2 -1 0 2 -2 -1 0 2 -2 -1 0 2
Quantiles of Standard Normal Quantiles of Standard Normal Quantiles of Standard Normal
Figure E-1 (continued). Probability plots for inorganic sediment data
LA-UR-03-2661 E-7 May2003
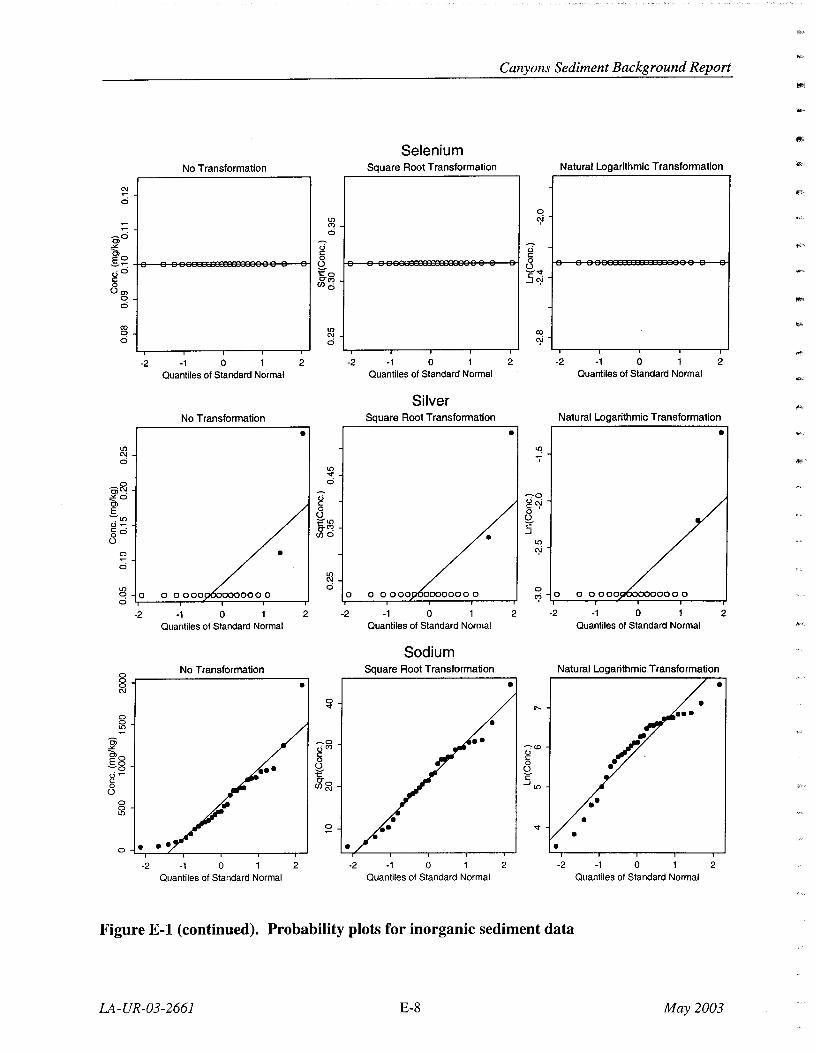
Oi ""
C\1
c:i
co a c:i
on C\1 c:i
0
c:i
on 0 c:i
0 0 0 C\1
0 0 on
<»a .Sg u~ c: 0 ()
0 0 on
0
-2
0
-2
• -2
No Transformation
-1 0 Quantiles of Standard Normal
No Transformation
•
0 0 000 000000 0
-1 0 Quantiles of Standard Normal
No Transformation
• • -1 0
Quantiles of Standard Normal
2
•
2
•
2
on (")
c:i
u c: 0 ()
1:a """' cnc:i
u c:
8
on C\1 c:i
~on t:(") 0" . cno
on C\1 c:i
~
~a
c..i"' c: 0 () :;: ""a en"'
a
-2
0
-2
• -2
Selenium Square Root Transformation
-1 0 Quantiles of Standard Normal
Silver Square Root Transformation
•
0 0 000 0000000 0
-1 0 Quantiles of Standard Normal
Sodium Square Root Transformation
•
-1 0 Quantiles of Standard Normal
Canyons Sediment Background Report
2
•
2
•
2
u c:
8 ~-.r c: . ...JC)I
0
Natural Logarithmic Transformation
-2 -1 0 2 Quantiles of Standard Normal
Natural Logarithmic Transformation
•
<? 0 00000
-2 -1 0 2 Quantiles of Standard Normal
Natural Logarithmic Transformation
•
--,.co (.) c: 0 ()
c ...Jon
•• • <t
• • -2 -1 0 2
Quantiles of Standard Normal
Figure E-1 (continued). Probability plots for inorganic sediment data
LA-UR-03-2661 E-8 May2003
"'"

Canyons Sediment Background Report
Sulfate No Transformation Square Root Transformation Natural Logarithmic Transformation
"' • co • "' • C') M
• 0 C') • 0
"' M • "' ~N C)
~"' ""' cJ <no §"~"
UN c: .§_N (.) 0
(.) cJ t CC! C:ll) CT -'N 8~ (/)
C')
0 Ill
"' N
~ 0 0 0 0 0 0 0 0 0 0 0 0 0 0 0_
-1.0 0.0 0.5 1.0 -1.0 0.0 0.5 1.0 -1.0 0.0 0.5 1.0 Quantiles of Standard Normal Quantiles of Standard Normal Quantiles of Standard Normal
Tantalum No Transformation Square Root Transformation Natural Logarithmic Transformation
CX> ~
ci "' "' ~ ci '7
~co C)~
g~ -:--~ ~ci '-'• .s 80 c: 0
cJ t ~ C:"f CT c:o
8;; (/) _Jc:; "' C')
ci N
N ~ ~ 0 ci C')
•."'\!~ ci
-1.0 0.0 0.5 1.0 -1.0 0.0 0.5 1.0 -1.0 0.0 0.5 1.0 Quantiles of Standard Normal Quantiles of Standard Normal Quantiles of Standard Normal
Thallium No Transformation Square Root Transformation Natural Logarithmic Transformation
• • • 0 ~ • M ~ •
"' •• "' C\i ci •
~C! "JC\1 -""' 0
C,N c: . 'Jci E 0~ c:
(.) 0 Jli ti"l (.) t c c:~ CT 0 (/) -' (.) CX> ~ ~ ci '7
"' ci 0
"' 0 0 00 ci 0 0 000 0 0 OOCXJ
~ -2 -1 0 2 -2 -1 0 2 -2 -1 0 2
Quantiles of Standard Normal Quantiles of Standard Normal Quantiles of Standard Normal
Figure E-1 (continued). Probability plots for inorganic sediment data
LA-UR-03-2661 E-9 May 2003

Canyons Sediment Background Report
if'',
Thorium No Transformation Square Root Transformation Natural Logarithmic Transformation
.,, 0
,.._ • • C\i • • "' • '"' C\i • • • co • ~ • •
~LO Cl ~o
""' gN c..io ~'"
0, .S..r 0 c: .
(.) o~ (.)
c..i t: c • ., c: 0' ...J
8"' (/)~ • "' ci "'' • • C\1 • "'· • ~
0 ci • •
"' -1.0 0.0 0.5 1.0 -1.0 0.0 0.5 1.0 -1.0 0.0 0.5 1.0
Quantiles of Standard Normal Quantiles of Standard Normal Quantiles of Standard Normal
Total Thorium II''
No Transformation Square Root Transformation Natural Logarithmic Transformation
• • • 0 • -i •
"' • "' • "' • C\i
c; • ('j
~ c..i • c: c..i
E 8~ c: • oo
"":'o t:"' 0· o~
~N
c: 0' c: 0 (/) ...J
(.)
"' C\i ~
"' 0 • C\i • • -1.0 0.0 0.5 1.0 -1.0 0.0 0.5 1.0 -1.0 0.0 0.5 1.0
Quantiles of Standard Normal Quantiles of Standard Normal Quantiles of Standard Normal
Titanium No Transformation Square Root Transformation Natural Logarithmic Transformation
0 0 0 0 • "' • tci • ....
• • "' 0
"' •• ~ •• Iii
"' •• <D 0 Iii
~o • ~"' ""co d~ g ~ Eo 0 c 10
0 ~LO 2- (.)
0 "' t:: •• ~"' c a.,.. • c .
8g •• en~ ...JU')
• •• "' .. 0
•• 10
0 ;::! • ~ • "' • -<i
0 • ~ • <D • ~ -<i -2 -1 0 1 2 -2 -1 0 1 2 -2 -1 0 1 2
Ouantiles of Standard Normal Quantiles of Standard Normal Quantiles of Standard Normal
Figure E-1 (continued). Probability plots for inorganic sediment data
LA-UR-03-2661 E-10 May 2003

Canyons Sediment Background Report
Uranium No Transformation Square Root Transformation Natural Logarithmic Transformation
a • "": • • C\i U')
c:i • • • "!
a ll:! c:i
~ -:-a d~ (.) .
c:~
E 0 c:a (.) 0•
~a (.) d~ teo s~ c: CT • 0 (/)a (.) '7
U') <0
ll:! • c:i c:i '7
• .... a 000 • 0 c:i • C)i • -2 -1 0 2 -2 -1 0 2 -2 -1 0 2
Quantiles of Standard Normal Quantiles of Standard Normal Quantiles of Standard Normal
Total Uranium No Transformation Square Root Transformation Natural Logarithmic Transformation
a • ,.._ • C\i • • U')
C\i • <0 ll:!
~l(J ~"! rJC\1 -:-a c, c: (.) .
..s .... 0 c:~
(.) 0 (.)
rJ t stD c: c5fll:! 8"' c:i ••
C\1 •• • a "! • c:i
• • -2 -1 0 2 -2 -1 0 2 -2 -1 0 2
Quantiles of Standard Normal Quantiles of Standard Normal Quantiles of Standard Normal
Vanadium No Transformation Square Root Transformation Natural Logarithmic Transformation
a • a • C\1 (') • • .... U')
C\i U')
a c; C\i '§, g(t) rJ •• E 0 a~ ~a (.)
u~ rJ~ t •• c c: CT ....1 0 (/) "! (.)
•• C\1 U')
U')
c:i • • a • • • c:i
-2 -1 0 2 -2 -1 0 2 -2 -1 0 2 Quantiles of Standard Normal Quantiles of Standard Normal Quantiles of Standard Normal
Figure E-1 (continued). Probability plots for inorganic sediment data
LA-UR-03-2661 E-ll May 2003

Canyons Sediment Background Report
Zinc No Transformation Square Root Transformation Natural Logarithmic Transformation
• • • • • •
CD
<.i c: 0 ()
tlO <T
(/)
'¢ • • ...
0 (") • • • •
-2 -1 0 2 -2 -1 0 2 -2 -1 0 2
Quantiles of Standard Normal Quantiles of Standard Normal Quantiles of Standard Normal
Figure E-1 (continued). Probability plots for inorganic sediment data
LA-UR-03-2661 E-12 May 2003

Canyons Sediment Background Report
Americium-241 No Transformation Square Root Transformation Natural Logarithmic Transformation
• • • '<t CXl • <? • ~ • c) • 0 • C") • 0 • co ~o CXl
C> dO ~<'i "" u' () • c .s 0 c 0-t • 0 .. () uo • :e""': c c"' cro oo en -'"' ()c) - "'i - "' • c) •
co • 0 0 0 • ~ "'i c) • c) •
-2 -1 0 2 -2 -1 0 2 -2 -1 0 2 Quantiles of Standard Normal Quantiles of Standard Normal Quantiles of Standard Normal
Cesium-137 No Transformation Square Root Transformation Natural Logarithmic Transformation
• • • C'! 0 ~
~
Ol«! CXl '7 .-,.c) • Do u u c
c. 0 c :;~ ~co 0
() t:· c:"' cO cro 0 en ...J'
o-r • c)
'<1: 0
"' '? c)
"' 0 00 0 0 0 00 c) 0 0 c)
-2 -1 0 2 -2 -1 0 2 -2 -t 0 2 Quantiles of Standard Normal Quantiles of Standard Normal Quantiles of Standard Normal
Plutonium-238 No Transformation Square Root Transformation Natural Logarithmic Transformation co
8 • • c)
• ,.._ • 0 • '<t c) "' 8 u;i c)
0> co ••• ....,.0 • "" u . u ()"' cO
.e.g 0 co () •• 0 .
()~ go tLO c cro 0 eno ...J ()
0 • •• Lt:! c) '<t 0 ~ c)
"' 0 0 C") • • • ··- • • • ··-9 0
c) -2 -1 0 2 -2 -1 0 2 -2 -1 0 2
Quantiles of Standard Normal Quantiles of Standard Normal Quantiles of Standard Normal
Figure E-2. Probability plots for radionuclide sediment data
LA-UR-03-2661 E-13 May 2003
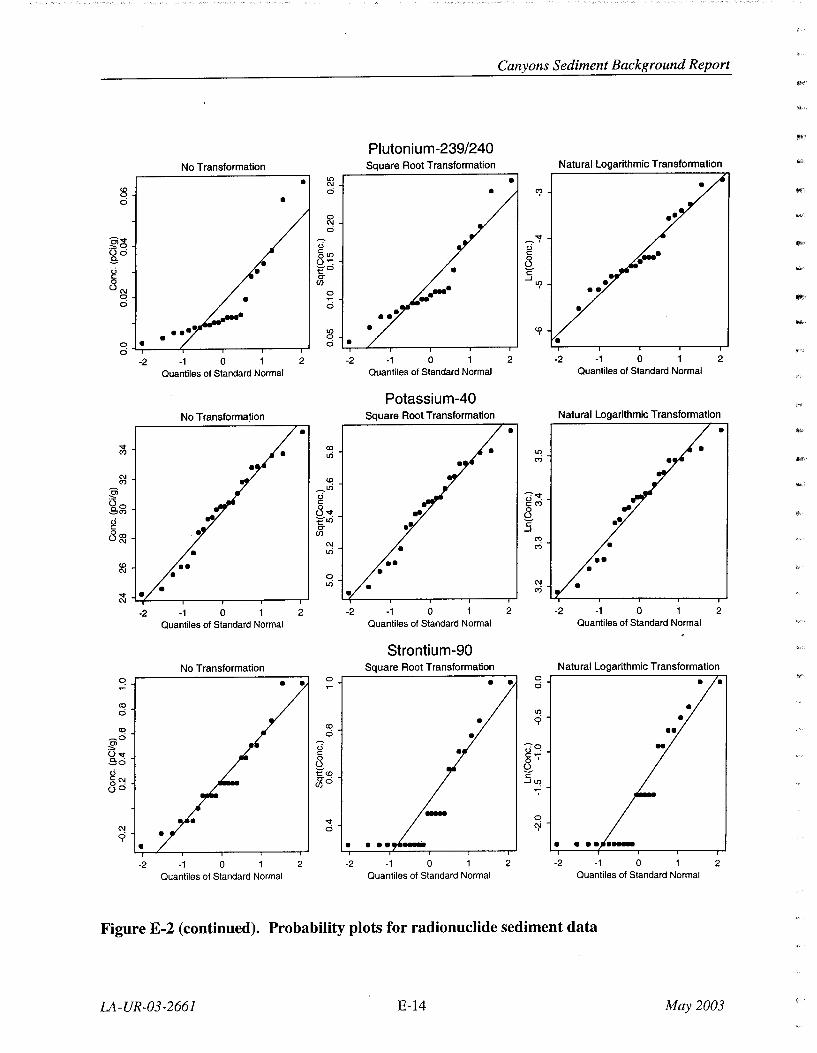
Canyons Sediment Background Report
,.,
Plutonium-239/240 ill''
No Transformation Square Root Transformation Natural Logarithmic Transformation "" • U") •
CD C\J •
0 0 • "? .. , 0 •
0 C\J 0
Ci"<t d ~"i f'><
a~ d §U"J c: -· ,e, 0 • 0'": (.) • u • :eo c: ""'' c: 0" --' • 0 (/) '? • (.)C\1
0 •• 0 0 • ~ l!tN
0 • •
.,., U") '\' • 0
0 • 0 • • 0
-2 -1 0 2 -2 -1 0 2 -2 -1 0 2
Quantiles of Standard Normal Quantiles of Standard Normal Quantiles of Standard Normal
Potassi u m-40 No Transformation Square Root Transformation Natural Logarithmic Transformation
• • • "<t ro • • C') u'i
U")
• M ""' C\J CD C')
_u'i g u -:-"<t
Oo c: u ' <:<'>
SM 0 0 (.)"<t (.) u tlt) c: •• c: 0" • --' 8re (/)
C')
"! • M • • U")
CD •• •• • • C\J • • •
0 u'i • C\J • • M
"<t • • C\J
-2 -1 0 2 -2 -1 0 2 -2 -1 0 2
Quantiles of Standard Normal Quantiles of Standard Normal Quantiles of Standard Normal
Strontium-90 No Transformation Square Root Transformation Natural Logarithmic Transformation
<=! • • <=! • • 0 0 • •
ro • 0 U")
• 9 • CD
ro _o 0 • •• 0> u -:-a .. :::, O<t c: • u ' a.· 0 c:~
~o (.) O' (.)
u :e'CD c: c:C\1 go --'~ 0 . (.)0 ";' - 0
"<t ~ C\J 0
9 • • • • • - • ••• ·--2 -1 0 2 -2 -1 0 2 -2 -1 0 2
Quantiles of Standard Normal Quantiles of Standard Normal Quantiles of Standard Normal
Figure E-2 (continued). Probability plots for radionuclide sediment data
LA-UR-03-2661 E-14 May 2003
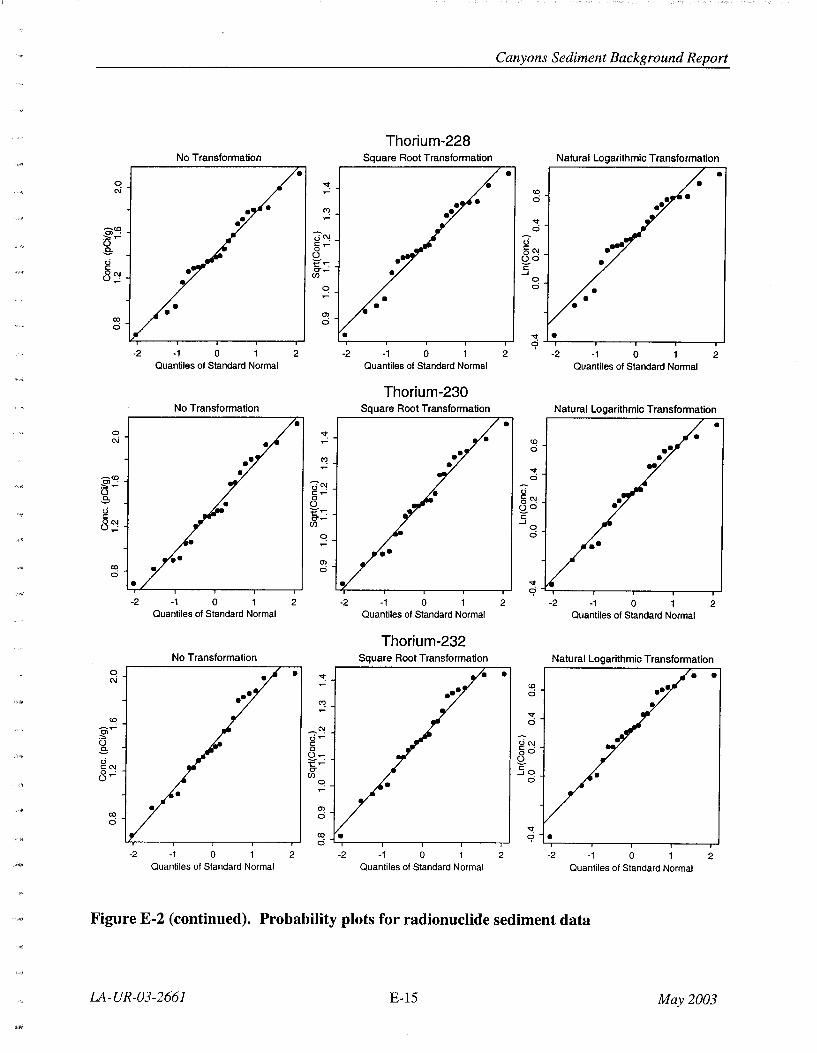
Canyons Sediment Background Report
Thorium-228 No Transformation Square Root Transformation Natural Logarithmic Transformation
• • • 0 ~ • C\i <D
• 0 • ~ •• '<!" ~<D 0 "'. d~ ,~
c3 () c~
§~ .e, 0 () ()O g t.-: c • cr~ .....1 0"' en 0,...: 0
q 0
• • • • ell <X) 0 0
'<!" • 9 -2 -1 0 2 -2 -1 0 2 -2 -1 0 2
Quantiles of Standard Normal Quantiles of Standard Normal Quantiles of Standard Normal
Thorium-230 No Transformation Square Root Transformation Natural Logarithmic Transformation
• • • 0 ~ • • C\i <D • 0
•• ~
• '<!" ~<D 0 "'. -;JC\f =»~
c3 () c~ • c"' .e, 0 () 0 .
()0 c3 t'": c c cr~ .....1 0(\j en 0 0,...: • 0 q •• ••
<X) ell 0 0
• '<!"
9 -2 -1 0 2 -2 -1 0 2 -2 -1 0 2
Quantiles of Standard Normal Quantiles of Standard Normal Quantiles of Standard Normal
Thorium-232 No Transformation Square Root Transformation Natural Logarithmic Transformation
0 • ~ • • • C\i • <D
•• 0 • ~
'<!"
"' 0 g;T"" ~"!
u~ u"' () c c . .e, 0 co o~ () c3 :e...: So CC\1 CT 0 . en • ()~
q 0
• "' <X) 0 0
'<!" <X) • 9 • 0
-2 -1 0 2 -2 -1 0 2 -2 -1 0 2 ·,·'f<'Ji: Quantiles of Standard Normal Quantiles of Standard Normal Quantiles of Standard Normal
Figure E-2 (continued). Probability plots for radionuclide sediment data
LA-UR-03-2661 E-15 May 2003

"
Canyons Sediment Background Report ~·1
"'"
Tritium Iiiii''
No Transformation Square Root Transformation Natural Logarithmic Transformation ''" 0 C')
• 0 • ~ !!'! 0
LO "? C\1 0 "'e
<D • 0 go • d~ g'¢ ~" u co a. 8 O' :;;g u
t:'LO c .. , §d •• c-~ .J u eno • •
C\1 0 "? • ..., 0 0 0
• ~"'
• • LO • 0 0 0 0
-2 -1 0 2 -2 -1 0 2 -2 -1 0 2 Quantiles of Standard Normal Quantiles of Standard Normal Quantiles of Standard Normal
Uranium-234 No Transformation Square Root Transformation Natural Logarithmic Transformation
LO ~ C\i • • co
• 0 •
0 ""':
C\i
Ol '<t
:::. cj ..-,.o u •• CC\1
() c S,LO
0 ' 0 u~ u o-r-= t: c c 0" 0 en .JO u 0
C! C! • • '<t
co 9 • 0 • • -2 -1 0 2 -2 -1 0 2 -2 -1 0 2
Quantiles of Standard Normal Quantiles of Standard Normal Quantiles of Standard Normal
Uranium-235 No Transformation Square Root Transformation Natural Logarithmic Transformation
<D 0 ~ • '<t • • 0 0 • 0 • • • • C)i
LO ... C') - •
C\1 0 • ~ - • cno • <Jo • ~~ :::. g~ u • CC')
So 0 . uo 0
<Jco t: u c §o 0" .J uo en~ .. C! 0 "? ..
0 '<t C\1 0 0 0 LO
0 0 0 <? 0 0
-2 -1 0 2 -2 -1 0 2 -2 -1 0 2 Quantiles of Standard Normal Quantiles of Standard Normal Quantiles of Standard Normal
Figure E-2 (continued). Probability plots for radionuclide sediment data
LA-UR-03-2661 E-16 May2003
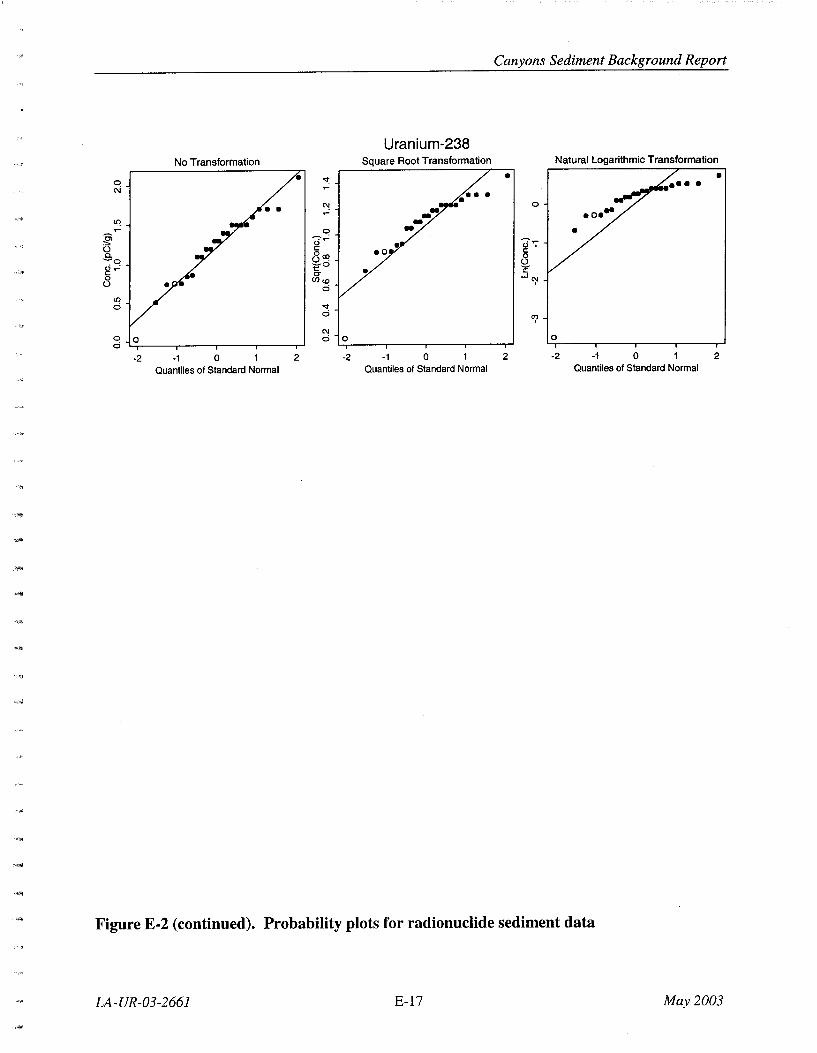
Canyons Sediment Background Report
Uranium-238 No Transformation Square Root Transformation Natural Logarithmic Transformation
0 • "": • • C\i
• • C\! 0 ~
"1 ~ ~ • Cl -;].,... --:-~ :::, • () c: (.)o
eo c: c. 8~ 0 ~a () 0~ :eo • <= c: "" 8 U)CJ:) ....JC)I
ci I{)
ci '<t ci '? C\J
0 0 ci 0 0 ci
-2 -1 0 2 -2 -1 0 2 -2 -1 0 2
Quantiles of Standard Normal Quantiles of Standard Normal Quantiles of Standard Normal
Figure E-2 (continued). Probability plots for radionuclide sediment data
LA-UR-03-2661 E-17 May 2003

Canyons Sediment Background Report
APPENDIX F S-PLUS CODE USED TO CALCULATE LOGNORMAL UTLS
File: lnorm_utll.s
function( q,p,n,ave,sd,nt) { # lnorm_utll.s is used as function LUTLl in Splus # This function is used to estimate the upper p% CI of the qth percentile #percentile for a lognormal distribution. Uses Gilbert's MBE (minimum unbiased estimator) of LN. # q = the quantile to estimate # p = the confidence limit of q # n = number of values sampled # ave = mean of logtranformed data # sd =st. dev. of logtranformed data # nt = number of simulation trials # ............................................................... .
# Calculate the qth quantile of the normal distribution ql <- qnorm(q)
# Initialize arrays tl <- rep(-l,n) t2 <- rep(-l,nt)
i <- 0
repeat
{ i <- i+ 1
# Get the "n" lognormal samples tl <- rlnorm(n,ave,sd)
# Calculate the mean and sd the hard way dummy<- lnormUMV.s(tl) avel <- dummy$mu sdl <- sqrt(dummy$s2)
# Calculate an estimate of the qth percentile t2[i] <- exp(avel+ql *sdl) if(i>=nt) break
}
# Find the upper p* 100% of the qth percentile quantile(t2,p) }
LA-UR-03-2661 F-1 May2003
'""
...
...
''"

Canyons Sediment Background Report
File: lnormUMV.s
function(x) { # lnormUMV.s (Splus function) # Calls: psi.s #Min Variance Unbiased ests of parameters of lognormal(mu, var=s2) distn #for X-lognorm(mu,s2), Y=log(X)-normal(mu,s2) # retums:E=mean(X), V=var(X) # mu=mean(Y),s2=var(Y) # ref:Gilbert('87),Stat Methods for Env Pollution Mon, pp165-166
n <- length(x) y <-log(x) ymu <- mean(y) vy <- var(y) psi1 <- psi.s(vy/2, n) psi2 <- psi.s(2 * vy, n) psi3 <- psi.s((vy * (n - 2))/(n- 1), n) E <- exp(ymu) * psi1 V <- exp(2 * ymu) * (psi2- psi3) mu <- log(E"2/(V + E"2)"0.5) s2 <-log(V/E"2 + 1) retum(E, V, mu, s2)
LA-UR-03-2661 F-2 May 2003

Canyons Sediment Background Report
File: psi.s
function(t, n) { # psi.s (Splus function) #called by lnormUMV.s #psi function in Gilbert('87) Stat. Meth. Env. Pollution. Mon, pp 165 # for Min Variance Unbiased ests of parameters of lognormal(mu, var=s2) distn
psi<- 0
}
psi[1] <- ((n- 1) * t)/n for(i in 1:25) {
}
psi[i + 1] <- (psi[i] * (n- 1)"2 * t)/((i + 1) * n * (n + (2 * i - 1)))
if(abs((psi[i + 1] - psi[i])/psi[i]) < 1e-09) break
psi<- 1 + sum(psi) psi
LA-UR-03-2661 F-3 May 2003
..
~·