uas operational assessment: visual compliance -...
TRANSCRIPT

DOT/FAA/TC-16/11 Federal Aviation Administration William J. Hughes Technical Center Atlantic City International Airport, NJ 08405
UAS Operational Assessment: Visual Compliance Human-in-the-Loop Simulation to Assess How UAS Integration in Class C Airspace Will Affect Air Traffic Control Specialists Todd R. Truitt, Ph.D., FAA Human Factors Branch, ANG-E25 Carolina M. Zingale, Ph.D., FAA Human Factors Branch, ANG-E25 Alex Konkel, Ph.D., T.G. O’Brien & Associates, Inc.
January 2016 Technical Report This document is available to the U.S. public through the National Technical Information Service (NTIS), Springfield, Virginia 22161. This document is also available from the Federal Aviation Administration William J. Hughes Technical Center at actlibrary.tc.faa.gov
U.S. Department of Transportation Federal Aviation Administration

NOTICE
This document is disseminated under the sponsorship of the U.S. Department of Transportation in the interest of information exchange. The United States Government assumes no liability for the contents or use thereof. The United States Government does not endorse products or manufacturers. Trade or manufacturers’ names appear herein solely because they are considered essential to the objective of this report. This document does not constitute Federal Aviation Administration (FAA) certification policy. Consult your local FAA aircraft certification office as to its use. This report is available at the FAA William J. Hughes Technical Center’s full-text Technical Reports Web site: http://actlibrary.tc.faa.gov in Adobe® Acrobat® portable document format (PDF).

Technical Report Documentation Page
1. Report No.
DOT/FAA/TC-16/11
2. Government Accession No.
3. Recipient’s Catalog No.
4. Title and Subtitle
UAS Operational Assessment: Visual Compliance - Human-in-the-Loop Simulation to Assess How UAS Integration in Class C Airspace Will Affect Air Traffic Control Specialists
5. Report Date
January 2016
6. Performing Organization Code
ANG-E25
7. Author(s)
Todd R. Truitt, Ph.D., FAA Human Factors Branch, ANG-E25 Carolina M. Zingale, Ph.D., FAA Human Factors Branch, ANG-E25 Alex Konkel, Ph.D., T.G. O’Brien & Associates, Inc.
8. Performing Organization Report No.
DOT/FAA/TC-16/11
9. Performing Organization Name and Address
Federal Aviation Administration Human Factors Branch William J. Hughes Technical Center Atlantic City International Airport, NJ 08405
10. Work Unit No. (TRAIS)
11. Contract or Grant No.
12. Sponsoring Agency Name and Address
Federal Aviation Administration Emerging Technologies Team 800 Independence Ave. Washington, DC 20591
13. Type of Report and Period Covered
Technical Report
14. Sponsoring Agency Code
AJV-115
15. Supplementary Notes
16. Abstract
This report documents issues associated with the inability of Unmanned Aircraft Systems (UAS) to comply with visual compliance rules (14 CFR Part 91) in Class C airspace. The visual compliance limitations of UAS increase aircraft spacing requirements and restrict UAS pilots and Air Traffic Control Specialists (ATCS) from conducting operations (a) that help ATCS manage their workload and (b) that improve airspace efficiency. The authors conducted high-fidelity, human-in-the-loop simulations to examine how UAS integration in Class C airspace affected ATCS subjective ratings of workload and performance. The authors also collected objective measures of communications, airspace efficiency, and safety. The results indicated that UAS integration tended to increase ATCS workload ratings and to decrease their self-rated performance. Radio communications also became shorter and more frequent when UAS were present. UAS integration tended to reduce airspace efficiency, but it did not affect safety. The authors expect that training and experience with UAS operations will mitigate effects associated with ATCS workload and self-rated performance. However, UAS integration may reduce efficiency in congested airspace until UAS implement technological or procedural solutions that allow them to overcome the limitations associated with visual compliance. The authors provide recommendations for continued UAS research that will inform the development of FAA standards and procedures for the safe and efficient integration of UAS into the National Airspace System.
17. Key Words
Air Traffic Control
Integration
Unmanned Aircraft Systems
Visual Compliance
18. Distribution Statement
This document is available to the U.S. public through the National Technical Information Service (NTIS), Springfield, Virginia 22161. This document is also available from the Federal Aviation Administration William J. Hughes Technical Center at actlibrary.tc.faa.gov
19. Security Classification (of this report)
Unclassified
20. Security Classification (of this page)
Unclassified
21. No. of Pages
179 22. Price
Form DOT F 1700.7 (8-72) Reproduction of completed page authorized

THIS PAGE IS BLANK INTENTIONALLY.

iii
Table of Contents
Page
Acknowledgments ................................................................................................................... ix
Executive Summary ................................................................................................................. xi
1. Introduction ........................................................................................................................... 1
1.1 Background ............................................................................................................................................ 1
1.2 Objective ................................................................................................................................................ 3
1.3 Scope ...................................................................................................................................................... 3
2. Description of Research Task ............................................................................................... 3
2.1 Statement of Research Requirements ................................................................................................ 3
2.2 Research Questions and Hypotheses ................................................................................................. 4
2.3 Expectations .......................................................................................................................................... 5
2.3.1 Outputs ........................................................................................................................................ 5 2.3.2 Outcomes and Benefits .............................................................................................................. 5
3. Roles and Responsibilities ..................................................................................................... 5
4. Method ................................................................................................................................... 6
4.1 Participants ............................................................................................................................................ 6
4.2 Research Personnel............................................................................................................................... 6
4.3 Assumptions and Constraints ............................................................................................................. 8
4.4 Equipment ............................................................................................................................................. 9
4.4.1 Hardware ...................................................................................................................................... 9 4.4.2 Software...................................................................................................................................... 10
4.5 Materials ............................................................................................................................................... 10
4.5.1 Informed Consent .................................................................................................................... 10 4.5.2 Data Collection Instruments ................................................................................................... 11 4.5.3 Standard Operating Procedures and Letters of Agreement ............................................... 11 4.5.4 Airspace ...................................................................................................................................... 11 4.5.5 Traffic Scenarios ....................................................................................................................... 13
4.5.5.1 Practice .......................................................................................................................... 13 4.5.5.2 Multiple Low Approaches .......................................................................................... 13 4.5.5.3 Missed Approaches at HWD ..................................................................................... 13 4.5.5.4 Arrival Stream to OAK 30 ......................................................................................... 14 4.5.5.5 Exploratory ................................................................................................................... 15
4.6 Pre-Testing ........................................................................................................................................... 15
4.7 Design ................................................................................................................................................... 16
4.7.1 Experimental Design ................................................................................................................ 16 4.7.2 Dependent Variables ................................................................................................................ 16
4.8 Procedure ............................................................................................................................................. 18
4.8.1 Schedule of Events and Timetable ......................................................................................... 18 4.8.2 In-Briefing .................................................................................................................................. 19

iv
4.8.3 Training and Practice Scenarios .............................................................................................. 19 4.8.4 Data Collection Procedure ...................................................................................................... 19
5. Data Analysis ....................................................................................................................... 21
6. Results and Discussion ........................................................................................................ 22
6.1 Experiment One – Multiple Low Approach Procedures to OAK 30 ........................................ 22
6.1.1 Sector System Data ................................................................................................................... 22 6.1.1.1 Aircraft Time and Distance Flown in the Mulford Sector .................................... 23 6.1.1.2 Aircraft Time and Distance Flown in the Grove Sector ....................................... 23 6.1.1.3 Number of Arrivals ..................................................................................................... 23
6.1.2 Simulation Pilot Commands ................................................................................................... 24 6.1.2.1 Simulation Pilot Commands for the Mulford Sector ............................................. 24 6.1.2.2 Simulation Pilot Commands for the Grove Sector ................................................ 25
6.1.3 Voice Communications............................................................................................................ 25 6.1.3.1 PTT Transmission for the Mulford Sector .............................................................. 25 6.1.3.2 Landline Transmissions for the Mulford Sector ..................................................... 26 6.1.3.3 PTT Transmission for the Grove Sector ................................................................. 27 6.1.3.4 Landline Transmissions for the Grove Sector ........................................................ 27
6.1.4 Subjective Ratings of Workload ............................................................................................. 28 6.1.5 Losses of Separation ................................................................................................................. 30 6.1.6 Post-Scenario Questionnaire ................................................................................................... 31
6.1.6.1 Participant Responses for the Mulford Sector ........................................................ 31 6.1.6.2 Participant Responses for the Grove Sector ........................................................... 34
6.1.7 Summary of Results – Experiment One ............................................................................... 36
6.2 Experiment Two – UAS Integration to OAK 30 with Missed Approaches at HWD ............. 36
6.2.1 Sector System Data ................................................................................................................... 36 6.2.1.1 Aircraft Time and Distance Flown in the Mulford Sector .................................... 37 6.2.1.2 Aircraft Time and Distance Flown in the Grove Sector ....................................... 37 6.2.1.3 Number of Arrivals ..................................................................................................... 37
6.2.2 Simulation Pilot Commands ................................................................................................... 38 6.2.2.1 Simulation Pilot Commands for the Mulford Sector ............................................. 38 6.2.2.2 Simulation Pilot Commands for the Grove Sector ................................................ 39
6.2.3 Voice Communications............................................................................................................ 39 6.2.3.1 PTT Transmissions for the Mulford Sector ............................................................ 39 6.2.3.2 Landline Transmissions for the Mulford Sector ..................................................... 40 6.2.3.3 PTT Transmissions for the Grove Sector ............................................................... 41 6.2.3.4 Landline Transmissions for the Grove Sector ........................................................ 41
6.2.4 Subjective Ratings of Workload ............................................................................................. 42 6.2.5 Losses of Separation ................................................................................................................. 45 6.2.6 Post-Scenario Questionnaire ................................................................................................... 47
6.2.6.1 Participant Responses for the Mulford Sector ........................................................ 47 6.2.6.2 Participant Responses for the Grove Sector ........................................................... 49
6.2.7 Summary of Results – Experiment 2 ..................................................................................... 51
6.3 Experiment Three – UAS Integration in the Arrival Stream to OAK 30 .................................. 51
6.3.1 Sector System Data ................................................................................................................... 51 6.3.1.1 Aircraft Time and Distance Flown in the Mulford Sector .................................... 51 6.3.1.2 Aircraft Time and Distance Flown in the Grove Sector ....................................... 53

v
6.3.1.3 Number of Arrivals ..................................................................................................... 54 6.3.2 Simulation Pilot Commands ................................................................................................... 55
6.3.2.1 Simulation Pilot Commands for the Mulford Sector ............................................. 55 6.3.2.2 Simulation Pilot Commands for the Grove Sector ................................................ 56
6.3.3 Voice Communications............................................................................................................ 56 6.3.3.1 PTT Transmissions for the Mulford Sector ............................................................ 56 6.3.3.2 Landline Transmissions for the Mulford Sector ..................................................... 58 6.3.3.3 PTT Transmissions for the Grove Sector ............................................................... 59 6.3.3.4 Landline Transmissions for the Grove Sector ........................................................ 59
6.3.4 Subjective Ratings of Workload ............................................................................................. 60 6.3.5 Losses of Separation ................................................................................................................. 62 6.3.6 Post-Scenario Questionnaire ................................................................................................... 64
6.3.6.1 Participant Responses for the Mulford Sector ........................................................ 64 6.3.6.2 Participant Responses for the Grove Sector ........................................................... 66
6.3.7 Summary of Results – Experiment Three ............................................................................. 68
6.4 Exploratory Scenario .......................................................................................................................... 68
6.4.1 Post-Scenario Questionnaire ................................................................................................... 68 6.4.2 Summary of Results – Exploratory Scenario ........................................................................ 71
6.5 Post-Experiment Questionnaire ....................................................................................................... 71
7. Participant Debrief .............................................................................................................. 72
7.1 General Debrief Comments .............................................................................................................. 72
7.2 Experiment One – Multiple Low Approaches at OAK 30 - Debrief Comments .................... 73
7.3 Experiment Two – Missed Approaches at HWD - Debrief Comments ................................... 74
7.4 Experiment Three – Arrival Stream to OAK 30 - Debrief Comments ..................................... 74
7.5 Exploratory Scenario – Debrief Comments ................................................................................... 74
8. Conclusion ........................................................................................................................... 75
9. Recommendations for Future Research .............................................................................. 76
References................................................................................................................................ 77
Acronyms ................................................................................................................................. 78
Appendix A: Informed Consent Statement .......................................................................... A-1
Appendix B: Biographical Questionnaire ............................................................................ B-1
Appendix C: Post-Scenario Questionnaire ........................................................................... C-1
Appendix D: Post-Experiment Questionnaire ..................................................................... D-1
Appendix E: WAK Instructions ............................................................................................ E-1
Appendix F: Justification for Repeated Measures ANOVA Procedure ............................... F-1
Appendix G: Open-Ended Responses to the Post-Scenario Questionnaire ........................ G-1
Appendix H: Open-Ended Responses to the Post-Experiment Questionnaire ................. H-1
vi
List of Illustrations
Figures Page
Figure 1. ATCS workstations in the RDHFL. .............................................................................................. 10
Figure 2. Mulford and Grove sectors with surrounding North and South sectors. ................................ 11
Figure 3. Airport diagram of Oakland International Airport (OAK). ....................................................... 12
Figure 4. Mean WAK rating by interval at the Mulford sector. ................................................................. 29
Figure 5. Mean WAK rating by interval at the Grove sector. ..................................................................... 29
Figure 6. Mean WAK rating by interval at the Mulford sector. ................................................................. 43
Figure 7. Mean WAK response time by condition and interval at the Mulford sector. ......................... 44
Figure 8. Mean WAK rating by interval at the Grove sector. ..................................................................... 44
Figure 9. Mean WAK response time by condition at the Grove sector. .................................................. 45
Figure 10. Mean distance flown (nmi) by condition in the Mulford sector. ............................................. 52
Figure 11. Mean time (s) flown by condition in the Mulford sector. ........................................................ 53
Figure 12. Mean number of ground-air PTT transmissions by condition at the Mulford sector.......... 57
Figure 13. Mean duration of ground-air PTT transmissions by condition at the Mulford sector. ....... 57
Figure 14. Mean duration of air-ground PTT transmissions by condition at the Mulford sector. ....... 58
Figure 15. Mean WAK rating by interval at the Mulford sector. ............................................................... 61
Figure 16. Mean WAK rating by condition at the Mulford sector. ........................................................... 61
Figure 17. Mean WAK rating by interval at the Grove sector. .................................................................. 62
Tables Page
Table 1. Dependent Variables and Data Sources ........................................................................................ 17
Table 2. Daily Schedule ................................................................................................................................... 18
Table 3. Counterbalancing Order by Sector and Condition for Experiment 1 ...................................... 20
Table 4. Counterbalancing Order by Sector and Condition for Experiment 2 ...................................... 20
Table 5. Counterbalancing Order by Sector and Condition for Experiment 3 ...................................... 21
Table 6. Mean (M) Number and Standard Deviation (SD) of Arrivals by Condition, Type, and Runway ............................................................................................................................................... 24
Table 7. Mean (M) Number and Standard Deviation (SD) of Simulation Pilot Commands for the Mulford Sector by Condition and Type of Command ......................................................... 25
Table 8. Mean (M) Number and Standard Deviation (SD) of Simulation Pilot Commands for the Grove Sector by Condition and Type of Command ............................................................ 25
Table 9. Mean (M) Number and Duration of Ground-Air/Air-Ground PTT Transmissions at the Mulford Sector ........................................................................................................................... 26
Table 10. Ground-Ground Landline Transmissions at the Mulford Sector ........................................... 27
Table 11. Mean (M) Number and Duration of Ground-Air and Air-Ground PTT Transmissions at the Grove Sector ....................................................................................................................... 27
Table 12. Ground-Ground Landline Transmissions at the Grove Sector .............................................. 28

vii
Table 13. Means (M) and Standard Deviations (SD) of Responses for Each Item of the PSQ by Condition for the Mulford Sector ............................................................................................... 33
Table 14. Means (M) and Standard Deviations (SD) of Responses for Each Item of the PSQ by Condition for the Grove Sector .................................................................................................. 35
Table 15. Mean (M) Number and Standard Deviation (SD) of Arrivals by Condition, Runway, and Type.......................................................................................................................................... 38
Table 16. Mean (M) Number and Standard Deviation (SD) of Simulation Pilot Commands for the Mulford Sector by Condition and Type of Command ...................................................... 39
Table 17. Mean (M) Number and Standard Deviation (SD) of Simulation Pilot Commands for the Grove Sector by Condition and Type .................................................................................. 39
Table 18. Mean (M) Number and Duration of Ground-Air and Air-Ground PTT Transmissions at the Mulford Sector .................................................................................................................... 40
Table 19. Ground-Ground Landline Transmissions at the Mulford Sector ........................................... 41
Table 20. Mean (M) Number and Duration of Ground-Air and Air-Ground PTT Transmissions at the Grove Sector ....................................................................................................................... 41
Table 21. Ground-Ground Landline Transmissions at the Grove Sector .............................................. 42
Table 22. Means (M) and Standard Deviations (SD) of Responses for Each Item of the PSQ by Condition for the Mulford Sector ............................................................................................... 48
Table 23. Means (M) and Standard Deviations (SD) of Responses for Each Item of the PSQ by Condition for the Grove Sector .................................................................................................. 50
Table 24. Mean (M) Number and Standard Deviation (SD) of Arrivals by Condition, Runway, and Type.......................................................................................................................................... 54
Table 25. Mean (M) Number and Standard Deviation (SD) of Simulation Pilot Commands for the Mulford Sector by Condition and Type of Command ...................................................... 55
Table 26. Mean (M) Number and Standard Deviation (SD) of Simulation Pilot Commands for the Grove Sector by Condition and Type of Command ......................................................... 56
Table 27. Ground-Ground Landline Transmissions for the Mulford Sector ......................................... 59
Table 28. Ground-Ground Landline Transmissions for the Grove Sector ............................................ 60
Table 29. Means (M) and Standard Deviations (SD) of Responses for Each Item of the PSQ by Condition for the Mulford Sector ............................................................................................... 65
Table 30. Means (M) and Standard Deviations (SD) of Responses for Each Item of the PSQ by Condition for the Grove Sector .................................................................................................. 67
Table 31. Means (M) and Standard Deviations (SD) of Responses for each item of the PSQ for the Mulford Sector ........................................................................................................................ 69
Table 32. Means (M) and Standard Deviations (SD) of Responses for each item of the PSQ for the Grove Sector ............................................................................................................................ 70
Table 33. Means (M) and Standard Deviations (SD) of Responses for Each Item of the PEQ ......... 71

THIS PAGE IS BLANK INTENTIONALLY.

ix
Acknowledgments
This research project was sponsored by the Federal Aviation Administration (FAA) Unmanned Aircraft Systems (UAS) Integration Office. The research project was accomplished with dedicated and daily support from the UAS Research Support Team, Program Managers, Air Traffic Control Subject Matter Experts (SMEs), Computer Scientists, and many others.
Jim Williams – FAA, Manager-UAS Integration Office, AFS-080
Randy Willis – FAA, Emerging Technologies Team, Manager Strategic Operations Team, AJV-115
Sabrina Saunders-Hodge – FAA, UAS Research and Development Portfolio Manager, ANG-C2
H. Claude Jones – FAA, UAS R&D Portfolio Branch Manager, ANG-C21
William Oehlschlager – FAA, UAS Detect & Avoid NextGen Program Manager, ANG-C21
Michael McNeil – FAA, Engineering Development Services Division Manager, ANG-C3
John Warburton – FAA, Navigation Branch Manager, ANG-C32
Karen Buondonno – FAA, UAS Integration Technical Lead, ANG-C32
Gary Mueller – FAA, Section Manager, ANG-E142
John Reinhardt – FAA, UAS R&D Integration, External Partnership Program Lead, ANG-C2
Paul Rumberger – FAA, UAS R&D Integration, External Partnership Program Lead, ANG-C2
Diane Ford – FAA, UAS R&D Integration TCRG Project Lead, ANG-C2
Bacilia Herrera – Beacon Management Group, Business Analyst
Derrick Aubuchon – Flight Research Associates, SME
Steve Entis – ATAC, SME
Bill Thomas – SST, SME
Paul Lunsford – A3, SME
Cherlynn Jones – B3 Solutions, SME
Joe Romino – B3 Solutions, SME
Wallace Daczkowski – Engility, Systems Engineer
John Dilks – Engility, Technician
Yevgeniy Tabekman – Engility, DESIREE Software Engineer
Neil Cohen – Engility, DESIREE Software Engineer
Laura Hamann – Engility, DESIREE Software Engineer
Nicole Smith – Engility, DESIREE Software Engineer
Daniel D’Ascenzo – FAA, DESIREE Software Engineer
Rob Buonpastore – Engility, DESIREE Software Engineer
John Mick – GDIT, DESIREE Software Engineer
Samantha Fullerton – JVN, TGF Software Engineer

x
Hadi Nader – JVN, TGF Software Engineer
Kerry Bowers – FAA, Program Analyst, ANG-C32
Marie Gale – ALPHA-Native Services, LLC, Secretary III
Scott Doucett – FAA, TGF Manager, ANG-E161
Steve Allen – Hi-Tec Systems, TGF Pilot
Max Hutchins – Hi-Tec Systems, TGF Pilot
Jack “JC” Lester – Hi-Tec Systems, TGF Pilot
Andre Lonchanbon – Hi-Tec Systems, TGF Pilot
Larry Pecan – Hi-Tec Systems, TGF Pilot
Ron Strac – Hi-Tec Systems, TGF Pilot
Mike Vispisiano – Hi-Tec Systems, TGF Pilot
Tom Vispisiano – Hi-Tec Systems, TGF Pilot
Tom Weston – Hi-Tec Systems, TGF Pilot
Hal Olsen – Hi-Tec Systems, Program Manager
Albert Macias – FAA, RDHFL Team Lead, ANG-E14
Ed Little – Engility, Network Systems Engineer - Data Storage and Archiving
Christian Sassi – GDIT, DESIREE Software Engineer
Christopher Continisio – GDIT, DESIREE Software Engineer
Bina Pastakia – FAA, Engineering Research Psychologist, ANG-C32
Dr. James Won – MIT/LL, Research Psychologist
Henry Dorsey – The Analytic Sciences Corporation (TASC), Technical Specialist
Matthew Dworsky – TASC, Human Factors Specialist
Lacey Thompson – FAA, Operations Research Analyst, ANG-C32
Tyler Travis – Regulus Group, Project Support
April Jackman – TASC, Technical Editor
Michael Levine – GDIT, Senior Technical Editor

xi
Executive Summary
The access of Unmanned Aircraft Systems (UAS) to the National Airspace System (NAS) is a priority because public and civil users are increasingly interested in using UAS for a broad range of purposes. Current requests for access to the NAS are subject to technical and operational assessments of the specific UAS operation in question based on interim approval guidance. UAS operations are subject to operational limitations when there is any perceived risk to the public. The Federal Aviation Administration (FAA) and the broader UAS community are interested in reducing these restrictions to improve and advance integration of UAS into the NAS. Therefore, validated operational standards and policies need to be established. The goal of this research is to determine the certification obstacles for UAS and equipment that will replace the pilot’s “see and avoid” functions in order to provide a means of compliance to 14 CFR Part 91. The results of this simulation will identify and document issues associated with UAS integration in Class C airspace and the potential impact to Air Traffic Control Specialists (ATCS). The results will inform FAA policy and decision-making, provide recommendations, and identify areas for further research to determine how to best integrate UAS into the NAS.
The research described in this report addresses the inability of UAS to comply with FAA regulations and air traffic control clearances that rely on direct pilot observation (i.e., visual compliance) and the resulting impact to the NAS. Currently, UAS in controlled airspace must be accompanied by a chase aircraft with an onboard observer or a ground observer to address components of the visual compliance requirement—additional horizontal separation is required between UAS and other aircraft as a result. The visual compliance requirement also prevents ATCS from clearing a UAS pilot to maintain visual separation from another aircraft, asking a UAS pilot to report an aircraft or airport in sight, clearing a UAS pilot for a visual approach, and providing control instructions that would cause the UAS to fly into Instrument Meteorological Conditions. All of these limitations posed by the visual compliance requirement may affect ATCS and the airspace they manage.
We conducted three experiments using a high-fidelity, human-in-the-loop simulation as a research platform. Six groups of two ATCS participants each (N = 12) provided data in the experiments. In Experiment One, we examined UAS integration in the Terminal Radar Approach Control (TRACON) traffic pattern using low approaches. In Experiment Two, we examined how missed approaches at a secondary airport interacted with UAS approaches at a primary airport. In Experiment Three, we examined different levels of UAS integration in the arrival stream. During each experiment, the participants controlled traffic in two Class C airspace arrival sectors that we derived from Northern California TRACON airspace. We collected multiple objective and subjective measures including airspace efficiency, participant workload, communications, and performance.
We analyzed the data separately for each experiment and each sector. Overall, the participants managed traffic safely in all three experiments as measured by the relatively low number of losses of separation and absence of mid-air and near mid-air collisions. However, we found that airspace efficiency was reduced and the participants’ perceptions of traffic management were often lower in conditions that included UAS. In Experiment One, aircraft spent more time and traveled a greater distance in the final approach sector and the participants handled more aircraft in the adjacent sector when UAS were in the airspace. UAS also affected communication patterns. The participants made more but shorter communications when UAS were in the airspace, possibly because they had to perform more control actions to manage UAS. Shorter communications may suggest an increased urgency or pace. The participants reported that UAS had a negative effect on their performance.

xii
They reported that their efficiency was lower, that their workload due to separation requirements was higher, that the overall difficulty of scenarios was higher, and that some aspects of their situation awareness were lower when UAS were in the airspace.
The results of Experiment Two indicated that the integration of UAS in the airspace may affect aircraft handling and ATCS perceptions of traffic management. In one sector, the participants issued more altitude and approach commands and the participants and pilots made shorter transmissions when UAS were in the airspace. Workload rating response times, a secondary measure of workload, were also higher when UAS were in the airspace. In one sector, workload rating response times were affected by both the presence of UAS and the scenario time interval—the longest rating response time occurred during the time interval when a missed approach interfered with UAS operations. The participants reported that the presence of UAS increased scenario difficulty and had a negative effect on their performance for sequencing aircraft and on aspects of their situation awareness.
The results of Experiment Three, which included scenarios with lower and higher levels of UAS operations, indicated that the integration of UAS in the airspace may negatively affect airspace efficiency, aircraft handling, and ATCS perceptions of traffic management. The most negative effects were obtained with higher levels of UAS integration. In one sector, the participants handled more aircraft and the aircraft spent more time and traveled longer distances in scenarios with a higher level of UAS integration compared to scenarios without UAS or with a lower level of UAS integration. There were also fewer full stop arrivals in scenarios with a higher level of UAS integration. The participants issued more heading commands and more commands overall when a higher number of UAS operations were integrated in the airspace. The participants also issued more speed and approach commands when UAS were present. In the final approach sector, the participants made more and shorter transmissions with a higher number of UAS operations, suggesting more urgency. The participants’ workload ratings were higher and they rated scenarios as more difficult with a higher number of UAS operations, but the participants’ overall workload was negatively affected whenever any UAS were integrated into the airspace.
Overall, the results indicated that UAS integration may affect airspace efficiency and ATCS communications and workload. UAS integration did not affect measures of risk or safety. It is important to note that none of the participants in this simulation had experience controlling UAS prior to participating in these experiments. Their comments indicated that training will be required for ATCS to become familiar with UAS performance characteristics and capabilities. ATCS’ negative perceptions of the impact that UAS had on various aspects of their performance should be reduced or subside with training and experience with UAS operations. Our data suggest that a low number of UAS operations in Class C airspace are tenable and should have relatively small effects on the airspace and ATCS. However, until UAS are able to meet the requirements for visual compliance, rising levels of UAS operations in busy Class C airspace may have significant effects on ATCS communications, workload, and airspace efficiency.

1
1. INTRODUCTION
This document presents the final report of the Unmanned Aircraft Systems (UAS) Operational Assessment: Visual Compliance study conducted by the Federal Aviation Administration (FAA). The high-fidelity, Human-in-the-Loop (HITL) simulation was conducted at the FAA William J. Hughes Technical Center (WJHTC) Research Development and Human Factors Laboratory (RDHFL) located in New Jersey. This research is one component in a portfolio of activities that supports a goal of the FAA’s Technical Community Requirement Group (TCRG) to investigate issues pertaining to the integration of UAS into the National Airspace System (NAS).
As part of a cross-cutting UAS research team located at the WJHTC, the FAA’s Navigation Branch (ANG-C32) and the Human Factors Branch (ANG-E25) led the effort in support of tasking from the FAA Research and Development (R&D) Integration Division (ANG-C2). The team conducted a high-fidelity, HITL simulation comprised of three experiments to investigate the impact of UAS pilots’ inability to comply with sections of Title 14 of the Code of Federal Regulations (14 CFR; FAA, 2013e) due to the lack of an onboard pilot and how those limitations may affect Air Traffic Control Specialist (ATCS) communications, workload, self-reported performance, and airspace safety and efficiency. Results will contribute to the identification of Air Traffic Control (ATC) requirements for the use of clearances and instructions that rely on the use of direct visual observation by a UAS pilot, as well as provide recommendations for future research.
1.1 Background
UAS access to the NAS is a priority because public and civil users are increasingly interested in using UAS for a broad range of purposes. UAS operations have increased in both the public and private sectors, and the eventual goal is to enable UAS to fly routinely in the NAS as manned aircraft currently do. Current requests for access to the NAS are subject to technical and operational assessments of the specific UAS operation in question based on interim approval guidance. UAS operations are subject to operational limitations when there is any perceived risk to the public. The UAS community is interested in reducing these restrictions to improve and advance integration of UAS into the NAS. Therefore, validated operational standards and policies need to be established.
To standardize the certification processes and ultimately reduce restrictions associated with UAS certification, the FAA needs to determine the parameters, operations, and procedures that define acceptable UAS behavior while maintaining the highest level of safety and without reducing existing capacity, decreasing safety, negatively impacting current operators, or increasing risk (FAA, 2013b). There are many challenges that must be addressed before the basis for certification and operations of UAS are standardized and made routine.
The safe and efficient integration of UAS into the NAS is a primary goal for the FAA as well as UAS manufacturers and operators. ATCS must continue to safely separate all aircraft, including UAS, during all phases of flight. However, UAS are not currently compliant with sections of Title 14 of the Code of Federal Regulations (14 CFR) that pertain to aircraft (FAA, 2013e). For instance,
the “see and avoid” provisions of 14 CFR § 91.113b (2014) cannot be satisfied by UAS operators due to the absence of an onboard pilot. ATCS are unable to issue standard clearances and instructions to UAS, such as “cleared for the visual approach” or “maintain visual separation.” UAS operations require an alternative method of compliance or procedural risk mitigation to address the see and avoid limitations and fulfill the visual compliance requirement. A permanent and consistent method of visual compliance is needed for UAS operations in the NAS without the need for waivers

2
or exemptions (FAA, 2013e). One method of visual compliance or risk mitigation under consideration by the FAA is for UAS to have Detect, Sense, and Avoid (DSA) provisions that satisfy the see and avoid mandate for manned aircraft. DSA would provide UAS with the capability to remain well clear from, and to avoid collisions with, other airborne traffic. DSA would provide the functions of self-separation and collision avoidance to fulfill the regulatory requirements of see and avoid (FAA, 2013c). Some of the methods being considered for DSA include radar observation, forward- or side-looking cameras, non-cooperative and cooperative detection systems, visual observation from one or more ground sites, monitoring by patrol or chase aircraft, or a combination of the above. Research is still underway to develop autonomous DSA systems for UAS.
For the purposes of this document, the visual compliance requirement is defined as the use of established manned aircraft procedures involving direct visual observation by a pilot. Procedures that require visual compliance include collision avoidance, maintaining self-separation from other aircraft (i.e., visual separation); conducting a visual approach; reporting an aircraft in sight; reporting an airport in sight; and terrain and obstruction clearance.
Currently, an ATCS who controls air traffic in a radar facility may clear a pilot to use visual separation from another aircraft up to—but not including—18,000 feet (ft) Mean Sea Level (MSL). When a pilot is instructed to “maintain visual separation,” the pilot must have established a positive visual identification of the specified aircraft and then maneuver his aircraft well clear of that aircraft (FAA, 2013a). By using visual separation, an ATCS can manage workload by reducing communications and by transferring separation responsibilities to the pilot. Visual separation also allows for more efficient air traffic management because separation standards are relaxed and more aircraft can maneuver in the same volume of airspace. While an ATCS can instruct a manned aircraft to maintain visual separation from another aircraft (including UAS) an ATCS may not instruct a UAS pilot to maintain visual separation from any other aircraft because UAS do not meet the visual compliance requirements. Therefore, some benefits associated with visual separation are presumably reduced when UAS are in the airspace.
An ATCS must currently provide one extra mile of separation between a UAS and a manned aircraft because each UAS in controlled airspace must be accompanied by a chase aircraft (FAA, 2013e). The chase aircraft, with an onboard observer, addresses components of the visual compliance requirement to maintain terrain and obstruction clearance—UAS can only fly in Visual Meteorological Conditions (VMC). However, adding an extra mile of separation to each UAS flight could impact ATCS workload and airspace efficiency as the number of UAS in the airspace increases.
An ATCS may also clear a manned aircraft for a visual approach to land. A visual approach is an ATC authorization for an aircraft on an Instrument Flight Rules (IFR) flight plan to proceed visually and clear of clouds to the airport of intended landing (FAA, 2013a). Before executing a visual approach, the pilot must have either the airport or the identified preceding aircraft in sight. The pilot may then continue the approach to the airport without further instructions from ATC. Like visual separation, the use of visual approaches affords an ATCS the opportunity to manage workload and improve airspace efficiency. An ATCS does not have to issue any further control instructions to the pilot after issuing a visual approach. The pilot also does not have to fly the published approach procedure which can save time and reduce distance flown. However, UAS pilots are prohibited from accepting a visual approach clearance from ATC (FAA, 2013d, 2013e). Furthermore, a UAS cannot execute a missed approach procedure. An ATCS must handle a UAS as a go around and provide appropriate separation. Therefore, the inability of a UAS to conduct a visual approach procedure, as well as the need to execute a go around if the UAS is unable to continue to the airport, requires additional interactions with ATC and can increase ATCS workload.

3
Finally, UAS, like other aircraft, must avoid the wake turbulence of larger aircraft to prevent loss of control or airframe damage. Further research is needed to determine the risks and repercussions of UAS encounters with wake turbulence (Government Accountability Office, 2008). ATCS implement wake turbulence separation by maintaining regular time or distance intervals between IFR aircraft (longitudinal separation). ATCS also issue wake-turbulence advisories to Visual Flight Rules (VFR) aircraft. Without direct visual observation, a UAS pilot’s ability to assess wake turbulence may be compromised.
The research presented here addresses the potential impact of UAS integration on ATCS and the NAS due to the inability of UAS to comply with ATCS clearances that require the use of direct visual observation by a pilot. Without the use of direct visual observation, UAS pilots cannot see and avoid other aircraft, maintain visual separation from other aircraft, execute visual approaches, avoid terrain and obstacles, or maintain adequate distance from clouds. All of these limitations have the potential to affect ATCS workload, communications, perceived performance, and airspace safety and efficiency. We conducted three experiments to examine the integration of UAS operations in complex Class C airspace that contained commercial and general aviation (GA) IFR controlled traffic and VFR uncontrolled traffic.
1.2 Objective
The objective of the research presented here was to conduct multiple high-fidelity, HITL simulation experiments to determine if a UAS pilots’ inability to comply with ATC instructions and clearances requiring visual means may affect ATCS and the NAS. In particular, we assessed ATCS communications, workload, and self-reported performance, and airspace efficiency and safety. We designed the experiments to obtain results that can inform FAA policy and decision-making regarding UAS visual compliance and identify areas for further research to determine how to best integrate UAS into the NAS.
1.3 Scope
The research described in this document is part of a series of Sense and Avoid (SAA) research tasks currently underway. The research examined how visual compliance limitations of a UAS may affect ATCS performance (e.g., workload, communications) and NAS operations (e.g., safety, efficiency) in the Terminal Radar Approach Control (TRACON) environment. We conducted high-fidelity, HITL simulation experiments to collect objective and subjective data from a sample of ATCS participants. We used terminal Class C airspace based on two arrival sectors in Northern California TRACON (NCT) to construct all air traffic scenarios. The results provide preliminary information about how ATCS will manage interactions between manned aircraft and UAS under both IFR and VFR operations. The research also identified areas where further research may be required.
2. DESCRIPTION OF RESEARCH TASK
In this section, we outline the specific research requirements addressed by the task and the expected outcomes and benefits from the execution of the work. We also describe how the task ties in to the overall FAA Concept of Operations for UAS Integration in the NAS.
2.1 Statement of Research Requirements
The description of the research requirements for this task is included in the Provider Research Execution Plan for task UAS-13-01 SAA System Certification Obstacles (A11L.UAS.1). Those requirements state that this research will assess system certification obstacles in equipment and

4
systems designed to satisfy “see and avoid.” This research addressed the certification obstacles related to aircraft systems and equipment that provide a means of compliance with 14 CFR Part 91 and that replace pilot functions that are certified through knowledge, testing, practical test standards, and airman certification. This research also addressed UAS inabilities to visually comply with regulations and with ATC clearances and instructions and the resulting impacts to the NAS. The research included experiments using real-time HITL simulations of NAS operations and investigated the effects on the NAS due to the inability of UAS to comply by visual means. The long-term goal for this requirement is to determine the certification obstacles for systems and equipment replacing pilots’ “see and avoid” functions to provide a means of compliance to 14 CFR Part 91.
2.2 Research Questions and Hypotheses
Our primary research question was, “Does the inability of UAS pilots to perform direct visual observation (i.e., the lack of visual compliance) affect ATCS communications, workload, self-reported performance, or sector safety or efficiency?” We designed the experiment to test five primary hypotheses using null hypothesis significance testing.
The null (H0) and alternative hypotheses (H1) tested in each experiment can be stated as:
H0: The lack of visual compliance by UAS pilots does not affect ATCS communications.
H1: The lack of visual compliance by UAS pilots affects ATCS communications.
H0: The lack of visual compliance by UAS pilots does not affect ATCS self-reported workload.
H1: The lack of visual compliance by UAS pilots affects ATCS self-reported workload.
H0: The lack of visual compliance by UAS pilots does not affect ATCS self-reported performance.
H1: The lack of visual compliance by UAS pilots affects ATCS self-reported performance.
H0: The lack of visual compliance by UAS pilots does not affect sector safety.
H1: The lack of visual compliance by UAS pilots affects sector safety.
H0: The lack of visual compliance by UAS pilots does not affect sector efficiency.
H1: The lack of visual compliance by UAS pilots affects sector efficiency.
The tests that were not statistically significant did not allow us to reject a null hypothesis and, therefore, did not support the alternative hypothesis. The tests that were statistically significant allowed us to reject a null hypothesis and provided support for the alternative hypothesis.

5
2.3 Expectations
2.3.1 Outputs
As a part of this research requirement, three deliverables were generated. The first of these deliverables was a whitepaper summarizing the results of a literature review of requirements, regulations, orders, and research that has been conducted with relevance to UAS compliance based on visual means (Dworsky & Dorsey, 2013).
The second and third deliverables pertain to the HITL simulation. The second deliverable, the Task Plan, described the experiment, data collection, and analyses. The Task Plan served as the guiding document for simulation planning and conduct. The third deliverable, the current Technical Report, presents the experiment, data analyses, and relevant results. This Technical Report, approved by the sponsor, documents results and recommendations to support the development of standard operating procedures for ATC regarding UAS operations. The Technical Report also recommends additional research required.
2.3.2 Outcomes and Benefits
Our long-term research goal is to determine the certification obstacles for systems and equipment replacing pilot’s “see and avoid” functions to provide a means of compliance to 14 CFR Part 91.113. The experiments provided initial information by evaluating the impact to the NAS of the inability of UAS to comply with visual clearances and instructions.
The current Technical Report documents the results of the HITL experiments that compared multiple experimental conditions (air traffic scenarios that included UAS) with matched control conditions (baseline scenarios that did not include UAS). The experiments provided information about how the inability of UAS to comply with visual-based ATC clearances and instructions may affect ATCS workload, communications, self-reported performance, and NAS operations (i.e., safety and efficiency). By documenting potential problems associated with UAS visual compliance, the results of the experiments will aid the sponsor in the development of standard operating procedures for ATC. The results will also serve as a foundation for the development and testing of strategies, procedures, and tools that may reduce the impact of effects that result from limited UAS visual compliance.
3. ROLES AND RESPONSIBILITIES
In this section, we provide an outline of the roles, responsibilities, and Points of Contact (POCs) for the organizations involved in the research project.
Sponsor: UAS Integration Office, AFS-080
POC: Chris Swider, AFS-088
POC: Randy Willis, AJV-115
The UAS Integration Office (AFS-080) was the sponsoring organization responsible for providing the research requirements and funding for this project as well as providing the overall leadership and direction of the research. AJV-115 also provided ATC Subject Matter Expert (SME) support for the planning and development of the research, approved the Task Plan, and approved this Technical Report.

6
ANG UAS R&D Portfolio Manager: New Entrants Division, ANG-C2
POC: Sabrina Saunders-Hodge, ANG-C2
The NextGen New Entrants Division served as the liaison between the FAA sponsoring organization and the performing research organization. ANG-C2 was responsible for designating the performer and ensuring all milestones and performance standards for conducting the research were met.
Performing Organization: Human Factors Branch, ANG-E25
POC: Todd Truitt
ANG-E25 served as the Principal Investigator; wrote the Task Plan based on the sponsor’s research requirements; designed and conducted the real-time HITL experiment; provided leadership to develop, configure, and implement the necessary laboratory hardware and software; performed data analyses; and produced the Technical Report. The Principal Investigator was also responsible for submitting monthly status reports and ensuring deadlines were met and risks mitigated. ANG-E25 was supported by other organizations within ANG to plan the HITL, develop and implement laboratory hardware and software, and develop associated materials as needed.
WJHTC Cross-cutting UAS Research Support Team, ANG-C
John Warburton (ANG-C32) served as the Task Manager. Karen Buondonno (ANG-C32) served as the Technical Lead. ANG-C32 provided task oversight, provided direct support, and managed the task budget.
4. METHOD
4.1 Participants
A total of 12 ATCS from Level 10-12 TRACON facilities served as participants. The participants were Certified Professional Controllers (CPC) from Boston, Charlotte, Dallas-Fort Worth, Houston, Minneapolis, Philadelphia, and Seattle TRACONs. All of the participants were male and ranged in age from 26 years to 55 years (M = 43.3, SD = 11.3, Mdn = 48.5). The participants were experienced controllers and had worked as an ATCS from 6.3 years to 33.2 years (M = 20.7, SD = 10.2, Mdn = 24.0) and had worked as a CPC for the FAA from 5.9 years to 29.2 years (M = 19.5, SD = 9.0, Mdn = 23.5). The participants had actively controlled traffic in a TRACON facility for 5.9 years to 24.1 years (M = 13.9, SD = 6.6, Mdn = 12.0) and had actively controlled traffic for 12 months within the past year. Not all participants had experience using the Standard Terminal Automation Replacement System (STARS); their experience using STARS ranged from 0 years to 14 years (M = 6.9, SD = 4.9, Mdn = 7.7). Using 10-point scales (1 = extremely low, 10 = extremely high), the participants rated their current skill as a CPC as high (M = 8.8, SD = 1.1), level of stress as low (M = 3.0, SD = 2.2), and motivation to participate in the study as high (M = 9.2, SD = 1.2). None of the participants had previous experience with UAS operations.
4.2 Research Personnel
Researchers from the FAA and contract support personnel designed and implemented the research effort. The Task Lead, supported by research and laboratory support services staff, conducted the experiment. The Task Lead was responsible for the overall administration of the experiment.
7
Task Lead
o Met with project sponsor or sponsor’s representatives to develop research requirements and testable hypotheses;
o Conducted the experiment as the Principal Investigator;
o Ensured that all aspects of the experiment, including hardware, software, and data collection instruments, were developed and functioning during shakedown and data collection. Also ensured that any deficiencies were corrected in a timely manner;
o Oversaw participant and simulation pilot training;
o Implemented the experimental design and schedule, including participant assignments and counterbalancing of condition orders;
o Used the Distributed Environment for Simulation, Rapid Engineering, and Experimentation (DESIREE) and the Target Generation Facility (TGF) software to configure and start, or supervised the configuration and start of, each practice and experimental run;
o Monitored the experiment during data collection and documented problems with the simulation as they occurred;
o Resolved all data collection issues as they occurred;
o Performed data reduction and analysis;
o Conducted appropriate descriptive and inferential data analysis and interpreted and reported results; and
o Authored the Technical Report, addressed reviewer comments and edits, and made all final decisions regarding content.
Research Assistants
o Provided support to prepare the experiment and conduct shakedown and data collection;
o Ensured that all questionnaires for SMEs and participants were properly labeled, distributed, and collected;
o Ensured that simulation pilots and simulation pilot workstations were prepared prior to each run;
o Monitored the experiment during data collection and documented problems with the simulation as they occurred;
o Performed data reduction and analysis;
o Conducted appropriate descriptive data analysis;
o Co-authored Technical Report; and
o Assisted the Task Lead as needed.

8
Subject Matter Experts
o Constructed air traffic scenarios;
o Defined ATC hardware and software requirements;
o Assisted during shakedown to test and verify ATC hardware and software capabilities;
o Conducted participant and simulation pilot training as needed; and
o Served as ATC Agent (i.e., “Ghost”) Controllers.
Simulation Pilots
o Simulated aircraft flight operations via simulation pilot workstations and voice communication system.
Laboratory Support Services
o Ensured overall operation of the laboratory;
o Implemented all hardware, software, video recording, audio recording, data collection, and data reduction and analysis requirements;
o Provided support during shakedown and data collection to ensure proper operation of all hardware and software;
o Performed daily backups of all experiment data;
o Performed data reduction and analysis as needed; and
o Provided and managed federal and contract support simulation pilots.
4.3 Assumptions and Constraints
UAS operations are currently regulated by FAA Notices JO 7210.846 and JO 8900.207 (FAA, 2013d, 2013e) and by a Certificate of Waiver or Authorization (COA; FAA 2012b) written for each specific operation. In the following list, we identify particular assumptions and constraints related to UAS operations in the current NAS. We also identify additional assumptions and constraints posed by the experiment itself.
VMC prevailed except for limited instances of clouds as described in the scenarios.
All UAS operations operated under the limitations of a fictional COA specifically designed for this experiment.
Manned aircraft operated under VFR or IFR as required by each scenario.
All UAS operated under VFR or IFR as required by each scenario.
Air traffic scenarios contained only one type of UAS aircraft model that approximated a General Atomics MQ-9 Reaper. The experiment did not capture any effects that would potentially result from different UAS performance characteristics.

9
Participants controlled simulated air traffic only in the TRACON airspace sectors described in this technical report. SME ghost controllers and the air traffic scenario determined air traffic operations in the airspace immediately surrounding the participant-controlled sectors. The Principal Investigator instructed the SME agent controllers to be as consistent as possible in all operations.
The simulated airspace was based on actual airspace from Northern California TRACON. The airspace was modified by a SME to reduce the number of complex altitude shelves, minimum vectoring altitudes (MVA), and surrounding sectors. The results of this experiment may be generalized to other Class C TRACON airspaces within the NAS.
All UAS operations were line-of-sight operations, there was no delay in voice communications between the UAS pilot and ATC, and there was no control latency for inputs by the UAS pilot to the aircraft itself.
4.4 Equipment
The experiment took place at the RDHFL at the FAA William J. Hughes Technical Center. The participants operated simulated STARS workstations in Experiment Room 1, and simulation pilots and SME Agents operated TGF simulation software and STARS workstations in an adjacent room.
4.4.1 Hardware
Each ATCS workstation included a Barco 2K x 2K Liquid Crystal Display (LCD), a STARS keyboard and trackball, and an emulated Terminal Voice Switching and Communication System (see Figure 1). The Barco LCD designed for ATC use provides the same resolution (2048 x 2048 pixels) and display size (19.83 in x 19.83 in; 503.8 mm x 503.8 mm; 28.05 in diagonal; 712.4 mm diagonal) that ATCS use in the field. Many ATC facilities worldwide, including ATC facilities in the United States, use the Barco LCD as a primary radar display. Above each radar display we provided an emulation of the ASOS Controller Equipment-Information Display System (ACE-IDS). The ACE-IDS presented on a 21.3″ touchscreen with an active display area of 17″ (432 mm) wide and 12.75″ (324 mm) high with a 1600 x 1200-pixel resolution. The touchscreens used resistive technology that allowed the participants to activate the display surface with their fingertip. The participants could use the ACE-IDS to access a variety of information including airspace maps, radio frequencies, airport diagrams, and approach plates. A Workload Assessment Keypad (WAK; Stein, 1985) was also located at each workstation just below the communications panel. Ceiling-mounted color video cameras were located above and behind each ATCS workstation. Simulation pilots and SMEs used workstations to affect simulated aircraft movements and communications. Each simulation pilot workstation included a computer, keyboard, mouse, display of aircraft information, and communications system. SMEs used the Barco 2K x 2K LCDs, STARS keyboard and trackball, emulated ACE-IDS, and Terminal Voice Switching and Communication System.

10
Figure 1. ATCS workstations in the RDHFL.
4.4.2 Software
The simulation used DESIREE and the TGF to implement required capabilities. DESIREE presented the STARS interface and simulated STARS functionality. The TGF provided aircraft performance models, generated aircraft tracks based on predefined flight plans, and managed the simulation pilot workstations. Both DESIREE and TGF provided data collection capabilities; for example, number of aircraft maneuvers (such as heading, speed, and altitude changes) and time and distance flown within each sector.
4.5 Materials
The following materials were used in the experiment.
4.5.1 Informed Consent
Each participant read and signed an informed consent form before the experiment (see Appendix A). The informed consent form describes the study and the rights and responsibilities of the participants, including that their participation is voluntary, all information they provided is anonymous and confidential, and indicates any foreseeable risks to which they were subjecting themselves. Signing the form indicated their voluntary consent to participate in the experiment.

11
4.5.2 Data Collection Instruments
We used a Biographical Questionnaire (see Appendix B) to collect general background information about each participant and to assess their prior level of experience as an ATCS and with UAS. The participants completed a Post-Scenario Questionnaire (PSQ; see Appendix C) to provide feedback after each scenario. At the end of the study, the participants completed the Post-Experiment Questionnaire (PEQ; see Appendix D) to provide feedback on the overall experiment.
4.5.3 Standard Operating Procedures and Letters of Agreement
Typical standard operating procedures and letters of agreement were adhered to for the airspace selected for study. All UAS operations were simulated according to the COA designed for this study.
4.5.4 Airspace
The airspace comprised simplified sectors and surrounding airspace based on the Mulford and Grove sectors of NCT. Simplification of the airspace was necessary because we recruited participants from TRACON facilities across the NAS (with the exception of NCT) and the participants had to learn the airspace in a relatively short period of time. SMEs simplified the airspace by consolidating the multiple sectors that surround the Mulford and Grove sectors into North and South sectors. This simplification reduced the number of sector handoff symbols and radio frequencies that participants had to memorize. SMEs also removed the complex altitude shelf structure of the Mulford and Grove sectors to simplify operations within the sectors. Figure 2 depicts the simplified airspace.
Figure 2. Mulford and Grove sectors with surrounding North and South sectors.

12
The participants controlled traffic in the Grove and Mulford sectors and managed arrivals into Oakland International Airport (OAK). As Figure 3 shows, OAK comprises four runways: 30/12, 28L/10R, 28R/10L, and 33/15. We simulated air traffic for a “West” configuration that required arrivals to use OAK runways 30, 28L, and 28R. We did not use runway 33/15. The Grove sector included airspace at or below (AOB) 6,000 ft Mean Sea Level (MSL). The Grove sector was located above the final approach course to OAK runways 28L and 28R and was responsible for directing traffic to these runways. The Mulford sector included airspace AOB 6,000 ft. The Mulford sector was located above the final approach course to OAK runway 30 and the final approach course to Hayward Executive Airport (HWD) runway 28L and was responsible for directing traffic to these runways.
Figure 3. Airport diagram of Oakland International Airport (OAK).

13
The North and South sectors were ghost sectors. Each ghost sector was manned by an ATC SME. The North sector managed traffic AOB 19,000 ft MSL (FL190) and from between 7,000 ft MSL to FL190 over the Grove sector. The South sector managed traffic AOB FL190 and from between 7,000 ft MSL to FL190 over the Mulford sector.
4.5.5 Traffic Scenarios
An ATC SME created one practice scenario, seven experimental scenarios, and one exploratory scenario. The ATC SME then created multiple versions of each scenario by changing only the aircraft callsigns. Changing only the callsigns allowed us to maintain consistency across test conditions and made the scenarios less recognizable as identical to the participants. The ATC SME created ten versions of the practice scenario, two versions of each experimental scenario, and two versions of the exploratory scenario. The practice scenario was 45 minutes in duration and the experimental scenarios were 30 minutes in duration. The exploratory scenario was 36 minutes in duration. All UAS aircraft had a “BERRY” callsign along with two digits (e.g., BERRY81, BERRY88). All scenarios started with only a few aircraft in the airspace and then traffic increased for about the first 5 minutes of the scenario. Traffic remained steady until the end of the scenarios.
4.5.5.1 Practice
We used the practice scenario to train participants on the airspace and simulation hardware and software. The practice scenario comprised all manned aircraft. There were 87 total aircraft in the practice scenario (61 arrivals, 19 departures, and 7 overflights). Eighteen of the aircraft were uncontrolled VFR flights, and 69 of the aircraft were controlled IFR flights. Of primary concern to the participants were 17 arrivals at OAK 30, 12 arrivals and 2 departures at OAK 28R, 6 arrivals and 4 departures at HWD 28L. The practice scenario also contained other traffic that impacted the participants’ airspace. There were 13 arrivals at San Francisco International Airport (SFO) 28R, 13 arrivals at SFO 28L, and 2 departures at SFO 28R. Of the 19 departures, there were 6 at Norman Y. Mineta San Jose International Airport (SJC), there were 4 at Buchanan Field (CCR), and there was 1 at San Carlos Airport (SQL).
4.5.5.2 Multiple Low Approaches
We used the Multiple Low Approaches scenarios in Experiment 1. The Multiple Low Approaches – No UAS scenario comprised 71 total aircraft (42 arrivals, 27 departures, and 2 overflights). Eighteen of the aircraft were uncontrolled VFR flights, and 53 of the aircraft were controlled IFR flights. There were 12 arrivals at OAK 30, 7 arrivals and 4 departures at OAK 28R, and 6 departures at HWD 28L. Background traffic that impacted the participants’ sectors were 10 arrivals at SFO 28R and 12 arrivals at SFO 28L and 2 departures at SFO 28R, 6 departures at SJC, 2 departures at CCR, 3 departures at SQL, and 4 departures at Palo Alto Airport (PAO). During this scenario, five aircraft arriving at OAK 30 requested multiple approaches.
The Multiple Low Approaches – Integrated UAS scenario was the same as the Multiple Low Approaches – No UAS scenario, except five of the manned aircraft arriving at OAK 30 were replaced with UAS. The UAS had similar performance characteristics as the aircraft that they replaced. The UAS were evenly spaced throughout the scenario and were intermingled with other arrivals at OAK 30. Every UAS arriving at OAK 30 requested multiple approaches.
4.5.5.3 Missed Approaches at HWD
We used the Missed Approaches at HWD scenarios in Experiment 2. The Missed Approaches at HWD – No UAS scenario comprised 64 total aircraft (46 arrivals, 11 departures, and 7 overflights).

14
Eleven of the aircraft were uncontrolled VFR flights, and 53 of the aircraft were controlled IFR flights. There were 12 arrivals at OAK 30, 9 arrivals and 2 departures at OAK 28R, and 3 departures and 5 arrivals at HWD 28L. Background traffic that impacted the participants’ sectors were 9 arrivals at SFO 28R and 11 arrivals at SFO 28L as well as 2 departures at SJC, 2 departures at SQL, 1 departure at PAO, and 1 departure at CCR.
During this scenario, two aircraft arriving at HWD 28L executed a missed approach procedure after the participant at Mulford had transferred control and communications to the OAK Airport Traffic Control Tower (ATCT). The ATC SME ghost controller simulating OAK ATCT operations then coordinated the missed approach with the participant at Mulford. The standard ATC instruction that we used for a missed approach at HWD was “turn left heading 210, climb and maintain 2,000.” However, during the coordination between OAK ATCT and Mulford, the participant at Mulford could provide an alternate clearance for the missed approach at their discretion. Once the ATC SME ghost controller simulating OAK ATCT provided the aircraft with the appropriate heading and altitude clearance (as coordinated), he handed the aircraft off and transferred control of the aircraft to the participant at Mulford. The same two aircraft in the scenario always executed the missed approach procedure. To control the timing of when the missed approach occurred (notwithstanding the variance of how each participant controlled traffic in the sector), the same two aircraft executed the missed approach procedure each time we ran the scenario. As stated in section 4.5.5, aircraft had different callsigns each time the participants within a group experienced a particular scenario.
The Missed Approaches at HWD – Integrated UAS scenario was the same as the Missed Approaches at HWD – No UAS scenario, except 10 of the manned aircraft arriving at OAK 30 were replaced with UAS. The UAS had similar performance characteristics as the aircraft that they replaced. The UAS were evenly spaced throughout the scenario and were intermingled with other arrivals at OAK 30.
4.5.5.4 Arrival Stream to OAK 30
We used the Arrival Stream to OAK 30 scenarios in Experiment 3. The Arrival Stream to OAK 30 – No UAS scenario comprised 91 total aircraft (56 arrivals, 25 departures, and 10 overflights). Twenty-two of the aircraft were uncontrolled VFR flights, and 69 were controlled IFR flights. There were 20 arrivals at OAK 30, and there were 13 arrivals and 5 departures at OAK 28R. Background traffic that impacted the participants’ sectors were 10 arrivals at SFO 28R and 13 arrivals at SFO 28L; 1 departure at SFO 28R, 3 departures at CCR, 4 departures at SQL, 2 departures at Reid-Hillview Airport (RHV), 5 departures at PAO, 1 departure at Livermore Municipal Airport (LVK), 1 departure at Tracy Municipal Airport (TCY), and 1 departure at SJC.
The Arrival Stream to OAK 30 – Low UAS Integration scenario was the same as the Arrival Stream to OAK 30 – No UAS scenario, except 8 of the manned aircraft arriving at OAK 30 were replaced with UAS. The UAS had similar performance characteristics as the aircraft that they replaced. The UAS were evenly spaced throughout the scenario and were intermingled with other arrivals at OAK 30.
The Arrival Stream to OAK 30 – High UAS Integration scenario was the same as the Arrival Stream to OAK 30 – No UAS scenario, except 13 of the manned aircraft arriving at OAK 30 were replaced with UAS. The UAS had the same performance characteristics as the aircraft that they replaced. The UAS were evenly spaced throughout the scenario and were intermingled with other arrivals at OAK 30.

15
4.5.5.5 Exploratory
An ATC SME created the Exploratory scenario to examine several particular UAS operations that were of interest to the project sponsor. There was no matching baseline condition for the Exploratory scenario. The Exploratory scenario comprised 79 aircraft (44 arrivals, 28 departures, and 7 overflights). Twenty-one of the 79 aircraft were uncontrolled VFR flights, and 58 aircraft were controlled IFR flights. There were 13 arrivals and 1 departure at OAK 30, and there were 9 arrivals and 3 departures at OAK 28R. Background traffic that impacted the participants’ sectors were 10 arrivals at SFO 28R, 12 arrivals at SFO 28L, and 1 departure at SFO 28R, 4 departures at SJC, 3 departures at CCR, 1 departure at SQL, 4 departures at PAO, 2 departures at Moffet Federal Airfield (NUQ), and 3 departures at LVK.
The first UAS operation of interest concerned UAS departing VFR and then requesting an IFR clearance below the MVA. Two instances of this UAS operation occurred in the Exploratory scenario. The first UAS departed VFR from OAK 30. The simulation pilot then made a radio call to the participant at the Grove sector and stated, “Approach, BERRY81 is VFR and would like to pick up our pre-filed clearance to Edwards Air Force Base (EDW).” Shortly thereafter, a second UAS departed for Beale Air Force Base (BAB) and the simulation pilot made a radio call to the participant at the Mulford sector and stated, “Approach, BERRY82 is VFR, approximately 10 miles North of Moffett, request to pick up pre-filed IFR clearance to BAB.” As soon as each aircraft departed, the simulation pilots entered commands that caused the UAS to climb very slowly (approximately 100-200 ft/min) so the UAS would stay at or below the MVA. The simulation pilots kept the UAS in a slow-climbing configuration until the appropriate participant gave a clearance to climb to a higher altitude or issued a terrain advisory.
The second UAS operation of interest was a UAS arrival at OAK 30 that refused a base turn due to clouds. When the participant issued the clearance for the base turn to a particular (scripted) UAS, the simulation pilot responded, “Approach, BERRY83, unable. Turn will place us Instrument Meteorological Conditions (IMC) in clouds. Can accept turn in 5 miles.”
The third UAS operation involved the UAS chase aircraft losing sight of the UAS. Once a particular (scripted) aircraft was established on final approach to OAK 30, a simulation pilot made a radio call to the participant at the Mulford sector and stated, “Approach, BERRY83, our chase aircraft has lost sight of us. Chase is proceeding direct to the lost-link loiter point (LLP). We would also like to proceed to the LLP at 5,000 ft and attempt to rejoin.” An ATC SME at the ghost controller position then generated the chase aircraft by making the appropriate simulation command entry. The chase aircraft (e.g., CHASE11) then appeared on the participants’ STARS displays with a discrete beacon code at 3,000 ft MSL and a heading of 310 degrees. A simulation pilot then initiated radio contact with the participant at the Mulford sector by stating, “Approach, CHASE11 is approximately <state position>, squawking <beacon code>, request direct LLP, VFR at 5,000 ft so that we can rejoin with BERRY83.”
4.6 Pre-Testing
We conducted an informal shakedown to test all simulation and data collection capabilities and to test and refine the experimental procedure. The informal shakedown also provided the opportunity to train simulation pilots on the idiosyncrasies involved with the study and UAS operations. The informal shakedown did not use ATCS from the field and relied solely on the research team, including experimenters, software and hardware engineers, and ATC SMEs. During the informal shakedown, we systematically tested all components of the simulation including data collection and storage. The research team documented, corrected, and tested all identified issues.

16
4.7 Design
4.7.1 Experimental Design
The study comprised three separate experiments. Data collection took place over the course of six weeks. We collected data from a total of six groups of two participants each for a total sample size of N = 12. We conducted the experiments consecutively for each group of participants. Each group of participants spent five days at the RDHFL.
The first experiment examined multiple approaches and UAS integration in the TRACON traffic pattern to OAK 30 and used a single factor (Condition: No UAS vs. Integrated UAS Operations) within-subjects repeated measures design. During the No UAS Condition, the air traffic scenario contained only manned aircraft. During the Integrated UAS Condition, UAS operations were integrated with manned aircraft operations. We counterbalanced the order of conditions across each group and participant/position combination, as discussed in section 4.8.4, Data Collection Procedure, such that half of the participants controlled traffic in the No UAS condition first, and half of the participants controlled traffic in the Integrated UAS condition first.
The second experiment examined how missed approaches at HWD interacted with UAS approaches at OAK 30 and used a single factor (Condition: No UAS vs. Integrated UAS Operations) within-subjects repeated measures design. During the No UAS condition, the air traffic scenario contained only manned aircraft and manned aircraft executed missed approaches at HWD. During the Integrated UAS condition, manned aircraft executed missed approaches at HWD with both manned and UAS aircraft on approach to OAK 30. We counterbalanced the order of conditions across each group and participant/position combination, as discussed in section 4.8.4, Data Collection Procedure, such that half of the participants controlled traffic in the No UAS condition first, and half of the participants controlled traffic in the Integrated UAS condition first.
The third experiment examined UAS integration in the arrival stream to OAK 30 and used a single factor (Condition: No UAS vs. Low UAS Integration vs. High UAS Integration) within-subjects repeated measures design. During the No UAS condition, the air traffic scenario contained only manned aircraft. During the Low UAS Integration condition, eight UAS operations were integrated with manned aircraft operations. During the High UAS Integration condition, thirteen UAS operations were integrated with manned aircraft operations. We counterbalanced the order of conditions across each group and participant/position combination, as discussed in section 4.8.4, Data Collection Procedure.
4.7.2 Dependent Variables
We recorded numerous dependent variables during each scenario using automated data collection by DESIREE, TGF, and the communications system. The participants provided questionnaire responses after each scenario. In this section, we list dependent variables that were collected via automated tools, such as DESIREE or TGF (see Table 1). Refer to the appropriate appendices for dependent variables collected via questionnaires and rating forms—Biographical Questionnaire (Appendix B), PSQ (Appendix C), and PEQ (Appendix D).

17
Table 1. Dependent Variables and Data Sources
SAFETY DEPENDENT VARIABLE DATA SOURCE COMMENT
Number of Loss of Separation TGF, SME review of audio/video recordings Loss of standard separation as defined by FAA Order 7110.65
Closest Point of Approach TGF Shortest Euclidian distance (nmi) between two aircraft during a loss of separation
Composite Slant Range TGF √[(vertical maintained/vertical separation required)2
+(horizontal maintained/ horizontal separation required)2]
Number of Near Mid-Air Collisions TGF, SME review of audio/video recordings Separation between two aircraft is 500 ft horizontal and +/- 100 ft vertical or less
Number of Mid-Air Collisions TGF Airborne collision of two or more aircraft
EFFICIENCY DEPENDENT VARIABLE DATA SOURCE COMMENT
Aircraft Distance Flown in Sector (nmi) TGF Based on geographical sector boundaries
Aircraft Time in Sector (seconds) TGF Based on geographical sector boundaries
Number of Low Approach Arrivals SME review of audio/video recordings Arrival aircraft requests and executes low approach without landing
Number of Missed Approach Arrivals SME review of audio/video recordings Arrival aircraft executes missed approach due to inability to land
Number of Full Stop Arrivals SME review of audio/video recordings Arrival aircraft lands on and exits runway
COMMUNICATIONS DEPENDENT VARIABLE DATA SOURCE COMMENT
Number of Controller-to-Pilot Transmissions by Sector
Communication System A transmission is recorded each time a controller presses the push-to-talk switch to communicate with a pilot
Duration of Controller-to-Pilot Transmissions (milliseconds) by Sector
Communications System Duration of time in milliseconds from controller key press to key release
Number of Pilot-to-Controller Transmissions by Sector
Communication System A transmission is recorded each time a pilot presses the push-to-talk switch to communicate with a controller
Duration of Pilot-to-Controller Transmissions (milliseconds) by Sector
Communications System Duration of time in milliseconds from pilot key press to key release
Number of Controller-to-Controller Transmissions by Sector
Communication System A transmission is recorded each time a controller presses the push-to-talk switch to communicate with another controller
Duration of Controller-to-Controller Transmissions (milliseconds) by Sector
Communication System Duration of time in milliseconds from controller key press to key release
WORKLOAD DEPENDENT VARIABLE DATA SOURCE COMMENT
Subjective Workload Rating WAK/DESIREE Online rating of workload made by the participant at pre-defined intervals
WAK Response Time (milliseconds) WAK/DESIREE Secondary measure of workload
TASK LOAD DEPENDENT VARIABLE DATA SOURCE COMMENT
Number of Heading Commands TGF Commands entered by simulation pilot only
Number of Altitude Commands TGF Commands entered by simulation pilot only
Number of Speed Commands TGF Commands entered by simulation pilot only
Number of Approach Commands TGF Commands entered by simulation pilot only
Number of Visual Approach Commands TGF Commands entered by simulation pilot only

18
4.8 Procedure
4.8.1 Schedule of Events and Timetable
The participants traveled to the RDHFL on Wednesday of one week and returned to their respective TRACON facilities on Thursday of the following week. Training occurred on Thursday and Friday of the participants’ first week, and testing occurred Monday through Wednesday of the following week. The participants arrived and worked in groups of two. Table 2 contains the daily schedule of events for each group of participants. The first half of Day 1 was reserved for in-briefing and training. The participants controlled traffic using practice scenarios for the remainder of Day 1 and all of Day 2. Each practice scenario was 45 minutes in duration with a minimum 15-minute break between each scenario. Each experimental scenario was 30 minutes in duration with 15 minutes at the end of each scenario for questionnaires. A break of at least 15 minutes was scheduled between the completion of questionnaires and the subsequent scenario.
Table 2. Daily Schedule
Time Day 1
Thursday Time Day 2 Friday Time
Day 3 Monday Time
Day 4 Tuesday Time
Day 5 Wednesday
0830 Informed
Consent & In Brief
0830 Training as
Needed 0830 Exp Prep 0830 Exp Prep 0830 Exp Prep
0900 Airspace &
STARS Training
0900 Practice
Scenario 5 0900
Exp 1A Run 1
0900 Exp 2B Run 8
0900 Exp 4A Run 15
1000 Break 0945 Break 0945 Break 0945 Break 0945 Break
1015 Airspace &
STARS Training
1000 Practice
Scenario 6 1000
Exp 1B Run 2
1000 Exp 3A Run 9
1000 Exp 4A Run 16
1145 Lunch 1045 Break 1045 Break 1045 Break 1045 Break
1245 Practice
Scenario 1 1100
Practice Scenario 7
1100 Exp 1A Run 3
1100 Exp 3B Run 10
1100 Make Up Run
as Needed
1330 Break 1145 Lunch 1145 Lunch 1145 Lunch 1145 Lunch
1345
Practice Scenario 2
1245 Practice
Scenario 8 1245
Exp 1B Run 4
1245 Exp 3C Run 11
1245 Make-Up Run
as Needed
1430 Break 1330 Break 1330 Break 1330 Break 1430 PEQ & Debrief
1445 Practice
Scenario 3 1345
Practice Scenario 9
1345 Exp 2A Run 5
1345 Exp 3A Run 12
1630 End of Day
1530 Break 1430 Break 1430 Break 1430 Break
1545 Practice
Scenario 4 1445
Practice Scenario 10
1445 Exp 2B Run 6
1445 Exp 3B Run 13
1630 End of Day 1530 Break 1530 Break 1530 Break
1545 Training:
Remaining Issues
1545 Exp 2A Run 7
1545 Exp 3C Run 14
1630 End of Day 1630 End of Day 1630 End of Day
Note. Exp = Experiment; PEQ = Post Experiment Questionnaire.

19
4.8.2 In-Briefing
The participants received an in-briefing on the background and objectives of the study. ATC SMEs also provided an overview of the airspace, procedures, and simulated laboratory environment including STARS functionality and communication system.
4.8.3 Training and Practice Scenarios
The participants received one-half day of classroom training on the simulated airspace and STARS interface and functionality. The participants then controlled traffic in five practice scenarios at each sector (total of 10 practice scenarios). Each practice scenario was 30 minutes in duration and contained only manned aircraft. An experimenter assigned each participant to one of the two sectors (Mulford or Grove). The participants controlled air traffic at those sectors for two consecutive scenarios and then they switched sectors. This process continued until each participant had completed four practice scenarios at each sector. The participants then switched sectors one final time to complete the final practice scenario.
4.8.4 Data Collection Procedure
Once the participants arrived at the RDHFL, they listened to the in-brief and asked any initial questions they had about the simulation. Then, each participant, the Principal Investigator, and a witness signed an Informed Consent Statement (see Appendix A). The participants then completed the Biographical Questionnaire (see Appendix B) and received a briefing on the schedule of events (Table 2) and an overview of the experiment. The participants then received classroom training from an ATC SME on the airspace and STARS interface and functionality and the communication system. After receiving training, the participants completed 10 practice scenarios.
Once the participants completed the practice scenarios, they controlled air traffic in a total of 16 scenarios. The participants controlled air traffic at each sector position for all scenarios in all three experiments and the exploratory scenario. Each experimental scenario was 30 minutes in duration. The researchers assigned each participant to one of the two sectors according to a counterbalancing scheme. After completing all scenarios in an experiment, the participants switched sectors and repeated the procedure. The participants always completed Experiment 1 (Multiple Approaches to OAK 30 – No UAS vs. Integrated UAS) first, Experiment 2 (Missed Approaches at HWD – No UAS vs. Integrated UAS) second, and Experiment 3 (Arrival Steam to OAK 30 – No UAS vs. Low UAS Integration vs. High UAS Integration) third. We counterbalanced the order of conditions within each experiment across participant groups (see Table 3, Table 4, and Table 5). After completing all experimental scenarios, the participants controlled air traffic in two 36-minute exploratory scenarios. An experimenter provided instructions to the participants prior to each scenario. During each scenario, the participants were responsible for controlling the air traffic, communicating, coordinating, and maintaining flight data as they would in the field.
During each scenario, we collected subjective and objective measures. We used the WAK to collect the participants’ subjective ratings of their workload during each scenario. The WAK measure, based on the research of Stein (1985), used a 10-button keypad to assess each participant’s workload. Every 4 min the WAK prompted the participant for a workload rating by making an alerting sound (a high-pitched chirp) and illuminating the WAK buttons. Participants had 20 s to respond to the prompt by selecting one of the 10 numbered WAK buttons to indicate their current level of workload. An experimenter read the WAK instructions to the participants before beginning each scenario (see Appendix E). At the end of each scenario, the participants completed the PSQ (see Appendix C).

20
Table 3. Counterbalancing Order by Sector and Condition for Experiment 1
Group Mulford Grove Condition
Order
1 P1 P2 1 2
P2 P1 1 2
2 P3 P4 2 1
P4 P3 2 1
3 P5 P6 1 2
P6 P5 1 2
4 P7 P8 2 1
P8 P7 2 1
5 P9 P10 1 2
P10 P9 1 2
6 P11 P12 2 1
P12 P11 2 1
Note. P = Participant.
Table 4. Counterbalancing Order by Sector and Condition for Experiment 2
Group Mulford Grove Condition
Order
1 P1 P2 1 2
P2 P1 1 2
2 P3 P4 2 1
P4 P3 2 1
3 P5 P6 1 2
P6 P5 1 2
4 P7 P8 2 1
P8 P7 2 1
5 P9 P10 1 2
P10 P9 1 2
6 P11 P12 2 1
P12 P11 2 1
Note. P = Participant.

21
Table 5. Counterbalancing Order by Sector and Condition for Experiment 3
Group Mulford Grove Condition
Order
1 P1 P2 1 2 3
P2 P1 2 3 1
2 P3 P4 3 1 2
P4 P3 1 2 3
3 P5 P6 2 3 1
P6 P5 3 1 2
4 P7 P8 3 2 1
P8 P7 2 1 3
5 P9 P10 1 3 2
P10 P9 3 2 1
6 P11 P12 2 1 3
P12 P11 1 3 2
Note. P = Participant.
We recorded digital audio and video data from each participant. We recorded the controller and pilot transmissions via the voice communications system. Controller conversations were also recorded via the participants’ headset microphones. Cameras mounted on the ceiling recorded an over-the-shoulder view of each controller position. The ReVue box hardware and software recorded each participant’s STARS display and all radio and landline communications.
All information provided by the participants was anonymous. A participant code was attached to all data for research purposes. The participants’ names and identities are not listed in this technical report and will not be released in any reports. All data collected in the study will be used for scientific purposes only and will be kept confidential by law. Laboratory personnel will not disclose or release any Personally Identifiable Information to any FAA personnel, or elsewhere, and will not publish it in any report, except as may be required by statute.
5. DATA ANALYSIS
We provided summary information for the Biographical Questionnaire and PEQ. We conducted inferential statistical analyses, t tests, or repeated measures Analysis of Variance (ANOVAs) on the data from the experimental scenarios and the PSQs for all three experiments (see Appendix F). For all experiments, we analyzed any significant main effects and interactions as needed with the appropriate post-hoc tests. Additional analyses were conducted as necessary. We reported the results as significant when p values were less than or equal to .05. We reported Cohen’s d (for t tests)

22
or partial eta-squared (ηp², for ANOVAs) to indicate the effect size.1 We reported only significant results as needed.
Although the participants worked together to control traffic in the Mulford and Grove sectors, there was no experimental basis or theoretical reasoning for comparing the two sectors to each other. Therefore, we analyzed the data generated from each sector position separately.
For the exploratory scenario, we observed the participants’ ability to manage the various UAS activities and the participants provided subjective data via the PSQ. We summarized the SME observations and participant responses and provide extended summaries of the most critical issues.
6. RESULTS AND DISCUSSION
In the next section, we present the results and discussion of each experiment.
6.1 Experiment One – Multiple Low Approach Procedures to OAK 30
We designed the first experiment to determine if the presence of UAS during multiple low approach arrivals to OAK 30 has any effect on sector efficiency, number of ATC commands, communications, participants’ subjective rating of workload, and safety. There are two primary differences between UAS and manned aircraft in this experiment. First, every UAS is required by a COA to have a chase aircraft and, therefore, an ATCS must add an additional mile of separation to accommodate a formation flight. Second, UAS do not comply with FAA regulations regarding visual compliance (FAA, 2013e). Therefore, an ATCS cannot issue any ATC instruction that relies on direct observation, or visual compliance, by the pilot to UAS. This means that the participants could not instruct a UAS pilot to maintain visual separation from any other aircraft—IFR separation standards were required at all times. The participants were also unable to ask a UAS pilot to report an airport in sight and could not issue a visual approach clearance to a UAS. Multiple aircraft conducting low approach procedures to the same runway (OAK 30) created a steady flow of aircraft in the TRACON traffic pattern and allowed us to identify potential issues posed by UAS and the associated limitations of visual compliance regulations.
6.1.1 Sector System Data
For each experimental run, we used geographical sector boundaries to count the total number of aircraft, the total distance flown, and the total time in each sector. We also counted the number of unique aircraft that flew through each sector. We measured the mean time (s) and distance flown (nmi) by each unique aircraft in the Mulford and Grove sectors because an aircraft could have flown into and out of a sector more than once. For example, an aircraft that flew into the Grove sector, then flew into the Mulford sector, and then flew back into the Grove sector was counted as a single unique operation for time and distance calculations. We only calculated mean time and distance flown for unique aircraft. We did not calculate mean time and distance based on the total number of operations because that would have skewed the data sets to include very short times and distances and would have produced an artificial source of variability. We also counted three types of arrivals for each experimental run: Low Approach, Missed Approach, and Full Stop.
1 Cohen (1988, 1992) describes the use of Cohen’s d and partial eta squared to evaluate effect size. For both measures, a value of 0.20 is considered a small effect, 0.50 is considered a medium effect, and 0.80 or greater is considered a large effect.

23
6.1.1.1 Aircraft Time and Distance Flown in the Mulford Sector
The total number of aircraft that flew through the Mulford sector did not differ between the No UAS condition (M = 40.0, SD = 1.4) and the Integrated UAS condition (M = 40.3, SD = 1.1). The number of unique aircraft that flew through the Mulford sector did not differ between the No UAS condition (M = 36.2, SD = 0.4) and the Integrated UAS condition (M = 36.6, SD = 0.5).
The total distance (nmi) flown in the Mulford sector was significantly greater in the Integrated UAS condition (M = 522, SD = 25) compared to the No UAS condition (M = 498, SD = 19), t(11) = 3.07, p = .011, Cohen’s d = 1.07. The total time (in seconds, s) that aircraft flew in the sector was significantly longer in the Integrated UAS condition (M = 13389, SD = 607) compared to the No UAS condition (M = 13008, SD = 349), t(11) = 2.54, p = .028, Cohen’s d = 0.77.
The mean distance flown (nmi) per aircraft in the Mulford sector was significantly greater in the Integrated UAS condition (M = 14.3, SD = 0.6) compared to the No UAS condition (M = 13.8, SD = 0.6), t(11) = 2.59, p = .025, Cohen’s d = 0.82. There were no significant differences between conditions for the mean time flown (s) in the sector, No UAS (M = 360, SD = 11), Integrated UAS (M = 366, SD = 15).
These results suggest that efficiency in the Mulford sector was somewhat negatively affected when UAS were in the airspace.
6.1.1.2 Aircraft Time and Distance Flown in the Grove Sector
The total number of aircraft that flew through the Grove sector was higher in the Integrated UAS condition (M = 49.3, SD = 3.2) compared to the No UAS condition (M = 47.9, SD = 2.2), t(11) = 2.40, p = .035, Cohen’s d = 0.49. However, there was no difference between conditions in the mean number of unique aircraft that flew through the Grove sector, No UAS (M = 40.9, SD = 1.2) and the Integrated UAS (M = 41.1, SD = 0.9).
There were no significant differences between conditions for the total distance (nmi) flown, No UAS (M = 733, SD = 22) and the Integrated UAS (M = 740, SD = 23). There were no significant differences between conditions for the total time (s) that aircraft flew in the Grove sector, No UAS (M = 18965, SD = 407) and the Integrated UAS (M = 19117, SD = 446).
In the Grove sector, there was no significant difference between conditions for the mean distance (nmi) flown per aircraft, No UAS (M = 17.9, SD = 0.7) and the Integrated UAS (M = 18.0, SD = 0.6). There was no significant difference between conditions for the mean time (s) flown per aircraft, No UAS (M = 464, SD = 15) and the Integrated UAS (M = 466, SD = 14) in the Grove sector.
These results suggest that efficiency in the Grove sector was not affected by the presence of UAS.
6.1.1.3 Number of Arrivals
After we completed data collection, an ATC SME reviewed audio and video recordings of each experimental run. The ATC SME recorded the number of arrivals for all runways beneath the Mulford and Grove sectors. Arrivals were classified as one of three types: Low Approach, Full Stop, or Missed Approach. Arrivals occurred only at runways OAK 30, OAK 28R/L, and HWD. For purposes of analysis, all arrivals were attributed to the participant working at the Mulford sector even though OAK 28R/L was beneath the Grove sector. We analyzed the arrival count data by using paired t tests and, where appropriate, Wilcoxon Matched Pairs t tests (the non-parametric equivalent of a t test).

24
We analyzed the number of each arrival type by condition (see Table 6). No Low Approaches or Missed Approaches occurred at runways OAK 28R/L or HWD. Every participant had one Full Stop arrival at HWD. Neither the number of Low Approach arrivals at OAK 30 nor the total number of Full Stop arrivals, No UAS (M = 12.4, SD = 1.1) and Integrated UAS (M = 12.6, SD = 0.8), differed significantly between conditions. Missed Approach arrivals were infrequent, and we analyzed them using the Wilcoxon Matched Pairs t test. The number of Missed Approach arrivals did not differ significantly between conditions. Overall, the presence of UAS did not affect the number of arrivals to any runway regardless of type of arrival.
Table 6. Mean (M) Number and Standard Deviation (SD) of Arrivals by Condition, Type, and Runway
Type of Approach
Low Approach
Full Stop
Missed Approach
Condition Runway M SD M SD M SD
No UAS OAK 30 5.7 (0.5) 5.4 (1.1) 0.7 (0.5) OAK 28R/L 0.0 (0.0) 6.0 (0.0) 0.0 (0.0) HWD 0.0 (0.0) 1.0 (0.0) 0.0 (0.0)
Integrated UAS OAK 30 5.6 (0.7) 5.8 (0.6) 0.3 (0.5) OAK 28R/L 0.0 (0.0) 5.8 (0.6) 0.0 (0.0) HWD 0.0 (0.0) 1.0 (0.0) 0.0 (0.0)
6.1.2 Simulation Pilot Commands
We recorded the number of simulation pilot commands entered for the Mulford and Grove sectors as a measure of controller clearances. We evaluated the most common commands used in the simulation—altitude, heading, speed, approach, and visual approach—in our analyses. We compared the total number of commands entered and the number of commands entered by type (e.g., altitude) between experimental conditions. We conducted separate analyses for the Mulford and Grove sectors.
6.1.2.1 Simulation Pilot Commands for the Mulford Sector
Table 7 shows the mean numbers of simulation pilot commands entered for the Mulford sector. Neither the total number nor the number of any command types differed significantly between conditions.

25
Table 7. Mean (M) Number and Standard Deviation (SD) of Simulation Pilot Commands for the Mulford Sector by Condition and Type of Command
No
UAS
Integrated UAS
Command M SD M SD
Altitude 32.2 (4.8) 33.0 (6.6) Heading 27.2 (6.6) 30.7 (8.9)
Speed 25.3 (6.7) 28.3 (7.8)
Approach 15.1 (4.0) 13.5 (3.3) Visual Approach 3.0 (3.2) 3.3 (2.5) Totals 102.8 (11.5) 108.8 (15.7)
6.1.2.2 Simulation Pilot Commands for the Grove Sector
Table 8 shows the mean numbers of simulation pilot commands entered for the Grove sector. Neither the total number nor the number of any command types differed significantly between conditions.
Table 8. Mean (M) Number and Standard Deviation (SD) of Simulation Pilot Commands for the Grove Sector by Condition and Type of Command
No
UAS
Integrated UAS
Command M SD M SD
Altitude 19.8 (3.8) 20.7 (3.4) Heading 18.0 (4.5) 18.6 (5.4)
Speed 3.9 (3.1) 3.0 (2.9)
Approach 1.4 (2.9) 1.3 (2.3) Visual Approach 5.8 (2.9) 6.3 (1.9) Totals 48.9 (7.2) 49.9 (9.3)
6.1.3 Voice Communications
We recorded all voice communications to evaluate the number and duration of air-ground (pilot-to-Mulford/Grove) and ground-air (Mulford/Grove-to-pilot) Push-to-Talk (PTT) transmissions for the Mulford and Grove sectors. We also recorded the number and duration of ground-ground landline transmissions between the participants and the ghost controllers who simulated the North and South sectors and the OAK and HWD ATCTs. We evaluated the mean number and duration of PTT and landline transmissions for the Mulford and Grove sectors separately.
6.1.3.1 PTT Transmission for the Mulford Sector
We measured the number and duration of the ground-air PTT transmissions from the Mulford sector to the pilots and the air-ground PTT transmissions from the pilots to the Mulford sector. Table 9 shows the mean number and duration of these transmissions.

26
Table 9. Mean (M) Number and Duration of Ground-Air/Air-Ground PTT Transmissions at the Mulford Sector
No
UAS
Integrated UAS
Transmission Measure M SD M SD
Ground-Air Number 145.1 (17.9) 156.5 (17.9)
Duration (s) 4.4 (0.6) 4.1 (0.6)
Air-Ground Number 161.2 (15.4) 167.9 (16.0)
Duration (s) 3.4 (0.1) 3.2 (0.2)
Note. (s) = Seconds.
There were significantly more ground-air PTT transmissions for the Mulford sector in the Integrated UAS condition than in the No UAS condition, t(11) = -2.23, p = .048 Cohen’s d = 0.64. However, the ground-air PTT transmission durations were shorter in the Integrated UAS condition than in the No UAS condition, t(11) = 3.00 , p = .012, Cohen’s d = 0.58. Therefore, the controllers made more, but shorter (by about 0.4 s) ground-air PTT transmissions when UAS were in the Mulford sector.
The number of air-ground transmissions did not differ significantly between conditions. However, air-ground PTT durations were shorter in the Integrated UAS condition than in the No UAS condition, t(11) = 4.38 , p = .001, Cohen’s d = 1.57. Therefore, both the pilots and the controllers made shorter PTT transmissions when UAS were in the Mulford sector.
6.1.3.2 Landline Transmissions for the Mulford Sector
We measured the number of ground-ground landline transmissions between the Mulford controllers and the ghost controllers. The number of ground-ground landline transmissions varied across participants and across conditions so it was not possible to statistically evaluate these data. We report only descriptive statistics for these measures. There were a total of 47 ground-ground landline transmissions in the No UAS condition and a total of 52 ground-ground landline transmissions in the Integrated UAS condition with mean durations of 7.2 s, (SD = 3.8) and 5.5 s (SD = 2.7), respectively.
We collapsed the ground-ground landline communications data by sector rather than by Mulford controller-to-ghost controller or ghost controller-to-Mulford controller because these data were not categorized separately for the first two participants due to a data recording error and because the overall number of ground-ground communications was low. Categorizing the data by sector allowed us to examine whether there appeared to be general trends in communication patterns based on condition. Table 10 presents the total number of ground-ground landline transmissions for each sector as well as the mean number and duration of the transmissions for each sector. The greatest number of ground-ground landline transmissions occurred between the Mulford and South sectors in both conditions, and there were more transmissions between these sectors when UAS were in the airspace.

27
Table 10. Ground-Ground Landline Transmissions at the Mulford Sector
No UAS Integrated UAS
Duration (s) Duration (s) Sectors Number M (SD) Number M (SD)
Mulford + South 16 8.2 (4.9) 25 6.8 (2.8)
Mulford + North 9 4.7 (3.7) 7 3.8 (2.9)
Mulford + OAK 13 8.4 (2.6) 8 7.0 (2.2)
Mulford + HWD 9 5.1 (2.5) 12 4.4 (1.7)
Totals 47 7.2 (3.8) 52 5.5 (2.7)
Note. (s) = Seconds.
6.1.3.3 PTT Transmission for the Grove Sector
We measured the number and duration of the ground-air PTT transmissions from the Grove controllers to the pilots and the air-ground PTT transmissions from the pilots to the Grove controllers. Table 11 shows the mean number and duration of these PTT transmissions.
Table 11. Mean (M) Number and Duration of Ground-Air and Air-Ground PTT Transmissions at the Grove Sector
No
UAS
Integrated UAS
Transmission Measure M SD M SD
Ground-Air Number 119.4 (18.1) 117.1 (11.6)
Duration (s) 4.2 (0.6) 4.1 (0.6)
Air-Ground Number 141.4 (16.8) 142.7 (18.8)
Duration (s) 3.0 (0.4) 2.7 (0.3)
Note. (s) = Seconds.
Overall, we found no statistically significant differences between the No UAS condition and the Integrated UAS condition for either the number or duration of PTT transmissions at the Grove sector, indicating that there were no differences in communications when UAS were in the Grove sector.
6.1.3.4 Landline Transmissions for the Grove Sector
The ground-ground landline transmissions varied across participants in the Grove sector as they did in the Mulford sector. We report only the descriptive statistics for these data and present summaries by sector in Table 12. Overall, there were 39 ground-ground landline transmissions in the No UAS condition and 42 ground-ground landline transmissions in the Integrated UAS condition with a mean transmission duration of 8.2 s, (SD = 5.4) and 7.7 s (SD = 5.8), respectively.

28
The greatest number of communications occurred between the Grove and North sectors in both conditions. There were no apparent differences between conditions.
Table 12. Ground-Ground Landline Transmissions at the Grove Sector
No UAS Integrated UAS
Duration (s) Duration (s) Sectors Number M (SD) Number M (SD)
Grove + South 10 7.3 (4.3) 10 8.0 (2.9)
Grove + North 21 8.5 (6.9) 22 7.9 (2.9)
Grove + OAK 7 9.3 (2.0) 9 7.0 (2.8)
Grove + HWD 1 4.5 (0.0) 1 7.7 (0.0)
Totals 39 8.2 (5.4) 42 7.7 (5.8)
Note. (s) = Seconds.
6.1.4 Subjective Ratings of Workload
Participants rated their subjective level of workload using the 10-button WAK (Stein 1985). If the participant did not respond within 20 seconds, the response was coded as missing. We coded failures to respond as missing data because it is unknown if the participant was too busy to respond or simply did not notice the WAK prompt. To allow for statistical analysis, we replaced missing responses with the mean WAK rating for the respective condition and time interval. In Experiment 1, there were 336 WAK prompts (12 participants by 7 intervals by 2 conditions by 2 sectors); of these, only 11 (3.3%) were missed. The missing responses were randomly distributed across interval, condition, and sector. We analyzed the WAK ratings using a 7 (Interval – one rating every 4 minutes) x 2 (Condition – No UAS vs. Integrated UAS) repeated measures ANOVA. We performed the same analysis for WAK response time (i.e., the time it took for the participants to enter a response after the WAK prompt).
When participants worked the Mulford sector, there was a significant effect of Interval for WAK ratings, F(6, 66) = 11.41, p < .001, ηp² = 0.51. The WAK ratings increased from the first interval (4 min) to the second interval (8 min) and then stayed level until the last interval (28 min), HSD(66) = 1.19 (see Figure 4). There was no statistically significant difference between the mean WAK ratings in the Integrated UAS condition (M = 3.6, SD = 1.5) compared to the No UAS condition (M = 3.4, SD = 1.2). There were no significant effects associated with WAK response time.

29
Figure 4. Mean WAK rating by interval at the Mulford sector.
When controllers worked the Grove sector, there was a significant effect of Interval for WAK ratings, F(6, 66) = 17.74, p < .001, ηp² = 0.62, indicating that the participants’ subjective level of workload changed over the course of the scenario. As Figure 5 shows, WAK ratings increased gradually from the first interval (4 min) to the sixth interval (24 min) and then decreased in the final interval (28 min), HSD(66) = 1.31. Subjective workload did not differ significantly between the Integrated UAS condition (M = 2.8, SD = 1.2) and the No UAS condition (M = 2.6, SD = 1.1). There were no significant effects associated with WAK response time.
Figure 5. Mean WAK rating by interval at the Grove sector.

30
6.1.5 Losses of Separation
During training, an ATC SME instructed the participants on the aircraft separation standards. We used standard separation minima of 3 nmi horizontal and 1,000 ft vertical. All UAS were categorized as small aircraft for purposes of wake turbulence separation. For aircraft operating directly behind another aircraft, directly behind and less than 1,000 ft below an aircraft, or following an aircraft conducting an instrument approach, separation was as follows:
Heavy behind heavy (4 miles)
Large/heavy behind B757 (4 miles)
Small behind B757 (5 miles)
Small/large behind heavy (5 miles)
For aircraft landing behind another aircraft on the same runway or behind an aircraft making a full stop or low approach arrival, the ATC SME instructed the participants to separate aircraft to ensure the following minima existed at the time the preceding aircraft was over the landing threshold:
Small behind large (4 miles)
Small behind B757 (5 miles)
Small behind heavy (6 miles)
For aircraft established on final approach to OAK 30 the ATC SME instructed the participants that 2.5 nmi separation between aircraft was authorized except for UAS.
For standard formation flights, 1 mile was added to the appropriate radar separation minima. UAS were always part of a formation flight due to the COA requirement for a chase aircraft. However, the ATC SME did not brief the participants to add 2 miles to the appropriate separation minima between two UAS, and we did not use that criterion in our analysis.
For Class C service separation, the SMEs instructed the participants to ensure separation of VFR aircraft from IFR aircraft by any one of the following:
Visual separation
500 feet vertical separation
Target resolution
Radar separation minima for wake turbulence
For passing or diverging aircraft, the participants did not have to apply separation standards when:
Aircraft were on opposite courses and had passed each other
Aircraft were on the same or crossing courses and one aircraft had crossed the projected course of the other and their course differed by an angle of at least 15 degrees
Target resolution

31
After we completed data collection, an ATC SME reviewed the audio and video recordings of each experimental run to identify Losses of Separation (LOS) in the Mulford sector. The ATC SME recorded the time at which the LOS occurred, the type of aircraft involved, whether the aircraft were IFR or VFR, and which separation rules were in effect (e.g., 2.5 nmi between non-UAS aircraft on final approach). We analyzed the data by using the TGF Data Reduction and Analysis Tool (DRAT) software to determine the Closest Point of Approach (CPA), minimum horizontal distance, and minimum vertical distance for each identified aircraft pair. We used the minimum horizontal and vertical distance measures to calculate the composite slant range as defined in FAA Order JO 7210.633 (FAA, 2012a). The composite slant range provides a single value of separation that represents both the vertical and horizontal dimensions, the formula for which is √[(vertical maintained/vertical separation required)2 +(horizontal maintained/horizontal separation required)2]. Values range from 0 to 1.41 in which 1.41 indicates “100% separation on both axes,” and lower numbers indicate less separation between aircraft. Because the aircraft slowed unexpectedly on final, we eliminated from our analyses any LOS event that occurred when aircraft were on final approach.
We observed a total of nine LOS in this experiment: one LOS in the No UAS condition, and eight LOS in the UAS Integration condition. None of the LOS were Near Mid-Air Collisions (NMACs). The nine LOS occurred among five participants, but four LOS occurred for one participant. Given the small number of LOS and lack of variability across participants, we were unable to conduct statistical analyses on these data, so we provide descriptive statistics only.
The CPA for the LOS in the No UAS condition was 0.9 nmi and the composite slant range was 1.02. This LOS occurred between two IFR aircraft. In the Integrated UAS condition, the mean CPA for the eight LOS was 0.6 nmi (SD = 0.7 nmi) and the mean composite slant range was 0.57 (SD = 0.34). Five of the eight LOS involved UAS. Three LOS occurred between UAS and VFR aircraft, and two LOS occurred between UAS and IFR aircraft. There were no NMACs in either condition.
6.1.6 Post-Scenario Questionnaire
The participants completed the PSQ (Appendix C) after each experimental run. The participants responded with Likert scale ratings, and they had the option of providing additional comments. The participants’ comments are shown by item in Appendix G. When analyzing the PSQ responses, we were interested in two main questions: Did the participants’ responses change between conditions? (e.g., Did the presence of UAS lead to differences in self-reported performance?) And for UAS-specific questions, did the participants believe that the presence of UAS affected their performance or ability to handle air traffic in the airspace sector? We analyzed each item using a two-tailed, paired t test.
6.1.6.1 Participant Responses for the Mulford Sector
Table 13 shows mean ratings and standard deviations for each of the PSQ items from participants at the Mulford sector. The participants’ ratings did not differ significantly between conditions for Items 1 through 6 of the PSQ—which were based on the National Aeronautics and Space Administration-Task Load Index (NASA-TLX; Hart & Staveland, 1988). The participants’ ratings also did not differ significantly between conditions for PSQ items relating to performance (Items 7-10) or safety (Item 11). However, the participants’ ratings for overall efficiency (Item 12) was significantly lower in the Integrated UAS condition compared to the No UAS condition, t(11) = 2.70, p = .021, Cohen’s d = 0.66. Generally, the participants did not report different levels of workload between conditions, but the participants rated workload due to aircraft separation

32
requirements (Item 18) as being significantly higher in the Integrated UAS condition, t(11) = 2.93, p = .014, Cohen’s d = 0.67. The participants’ ratings of situation awareness (Items 20-22) did not differ significantly between conditions. The participants rated the overall difficulty of the scenario (Item 24) as being significantly higher in the Integrated UAS conditions compared to the No UAS condition, t(11) = 2.45, p = .032, Cohen’s d = 0.77.
Three PSQ items assessed the participants’ opinion about the impact that UAS had on their overall performance, workload, and situation awareness in Integrated UAS condition only (Items 13, 19, and 23). For these items, the participants’ responses could range from 1 (negative effect) to 9 (positive effect), with a rating of 5 indicating no effect. Although situation awareness was not affected, the participants’ ratings indicated that the presence of UAS had a negative effect on their overall performance, t(11) = -2.58, p = .03, Cohen’s d = 0.74, and overall workload, t(11) = -5.70, p < .001, Cohen’s d = 1.64, in the Mulford sector.

33
Table 13. Means (M) and Standard Deviations (SD) of Responses for Each Item of the PSQ by Condition for the Mulford Sector
Item No UAS M (SD)
Integrated UAS M (SD)
1 – Mental Demand 4.8 (1.5) 5.6 (2.2)
2 – Physical Demand 2.8 (1.6) 2.8 (1.9)
3 – Temporal Demand 4.8 (2.0) 4.5 (2.0)
4 – Performance 7.3 (2.6) 7.2 (2.5)
5 – Effort 5.8 (1.5) 6.5 (2.2)
6 – Frustration 3.8 (2.0) 4.2 (2.5)
7 – Rate your overall level of ATC performance during this scenario. 6.5 (2.7) 6.9 (2.7)
8 – Rate your performance for identifying aircraft conflicts during this scenario. 6.3 (2.7) 7.0 (2.4)
9 – Rate your performance for separating aircraft efficiently during this scenario. 6.6 (2.6) 6.7 (2.8)
10 – Rate your performance for sequencing aircraft during this scenario. 7.3 (1.6) 7.7 (2.1)
11 – Rate the overall safety of operations during this scenario. 7.0 (2.5) 7.1 (2.5)
12 – Rate the overall efficiency of operations during this scenario. 7.6 (1.6) 6.3 (2.2)
13 – If there were UAS in the scenario you just completed, what effect did UAS operations have on your overall performance? NA 3.7 (1.7)
14 – Rate your overall workload during this scenario. 5.8 (1.5) 6.3 (1.7)
15 – Rate your workload due to coordination and communication with other sectors during this scenario. 2.7 (1.7) 3.2 (2.0)
16 – Rate your workload due to controller-pilot communication during this scenario. 4.0 (1.8) 3.9 (2.2)
17 – Rate your workload due to scanning for aircraft conflicts during this scenario. 6.3 (2.1) 6.0 (2.1)
18 – Rate your workload due to aircraft separation requirements during this scenario. 4.9 (1.5) 6.3 (2.6)
19 – If there were UAS in the scenario you just completed, what effect did UAS operations have on your overall workload? NA 3.2 (1.1)
20 – Rate your overall level of situation awareness during this scenario. 7.4 (1.7) 7.5 (1.9)
21 – Rate your situation awareness for detecting aircraft conflicts during this scenario. 6.8 (2.1) 7.3 (1.6)
22 – Rate your situation awareness for aircraft separation during this scenario. 7.2 (2.3) 7.5 (1.8)
23 – If there were UAS in the scenario you just completed, what effect did UAS operations have on your overall situation awareness? NA 4.8 (2.4)
24 – Rate the overall difficulty of this scenario. 5.4 (1.4) 6.6 (1.6)
25 – Rate the overall performance of the simulation pilots in terms of their responding to control instructions, phraseology, and providing readbacks. 7.2 (1.9) 7.5 (1.4)
Note. NA = Not Applicable.

34
6.1.6.2 Participant Responses for the Grove Sector
Table 14 shows mean ratings and standard deviations for each of the PSQ items from participants at the Grove sector. The participants’ ratings did not differ significantly between conditions for Items 1 through 6 of the PSQ (which were based on the NASA-TLX; Hart & Staveland, 1988). The participants’ ratings also did not differ significantly between conditions for PSQ items relating to performance (Items 7-10), safety and efficiency (Items 11-12), and workload (Items 14-18). The participants rated their overall level of situation awareness (Item 20) and their situation awareness for detecting aircraft conflicts (Item 21) as being lower in the Integrated UAS condition than in the No UAS condition, t(11) = 2.42, p = .034, Cohen’s d = 0.60, and t(11) = 2.20, p = .050, Cohen’s d = 0.55, respectively. There was no significant difference between conditions for the participants’ rating of their situation awareness for aircraft separation (Item 22). The participants rated the overall difficulty of the scenario (Item 24) to be significantly higher in the UAS Integration condition than in the No UAS condition, t(11) = 2.59, p = .025, Cohen’s d = 0.38. The participants’ ratings of simulation pilot performance (Item 25) did not differ between conditions.
Three PSQ items assessed the participants’ opinion about the impact that UAS had on their overall performance, workload, and situation awareness in Integrated UAS condition only (Items 13, 19, and 23). For these items, the participants’ responses could range from 1 (negative effect) to 9 (positive effect), with a rating of 5 indicating no effect. The participants rated the presence of UAS as having no effect on their overall performance, workload, or situation awareness at the Grove sector as none of the ratings for these items differed significantly from the midpoint rating of 5.
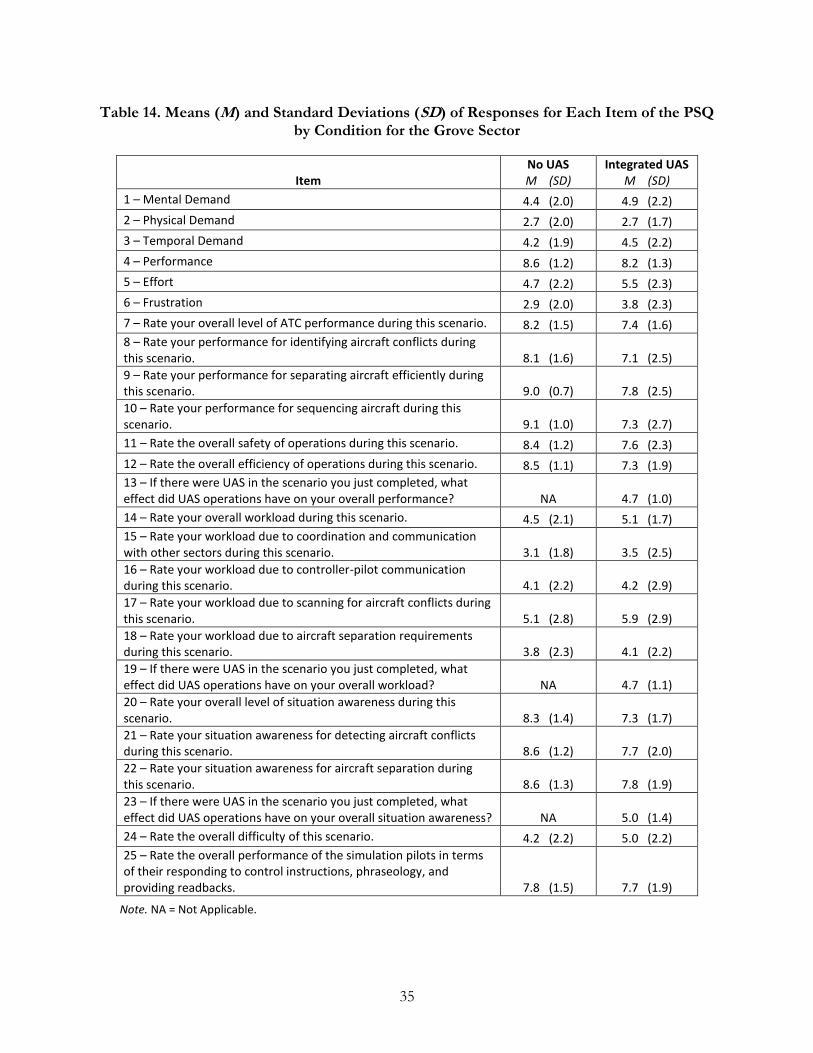
35
Table 14. Means (M) and Standard Deviations (SD) of Responses for Each Item of the PSQ by Condition for the Grove Sector
Item No UAS M (SD)
Integrated UAS M (SD)
1 – Mental Demand 4.4 (2.0) 4.9 (2.2)
2 – Physical Demand 2.7 (2.0) 2.7 (1.7)
3 – Temporal Demand 4.2 (1.9) 4.5 (2.2)
4 – Performance 8.6 (1.2) 8.2 (1.3)
5 – Effort 4.7 (2.2) 5.5 (2.3)
6 – Frustration 2.9 (2.0) 3.8 (2.3)
7 – Rate your overall level of ATC performance during this scenario. 8.2 (1.5) 7.4 (1.6)
8 – Rate your performance for identifying aircraft conflicts during this scenario. 8.1 (1.6) 7.1 (2.5)
9 – Rate your performance for separating aircraft efficiently during this scenario. 9.0 (0.7) 7.8 (2.5)
10 – Rate your performance for sequencing aircraft during this scenario. 9.1 (1.0) 7.3 (2.7)
11 – Rate the overall safety of operations during this scenario. 8.4 (1.2) 7.6 (2.3)
12 – Rate the overall efficiency of operations during this scenario. 8.5 (1.1) 7.3 (1.9)
13 – If there were UAS in the scenario you just completed, what effect did UAS operations have on your overall performance? NA 4.7 (1.0)
14 – Rate your overall workload during this scenario. 4.5 (2.1) 5.1 (1.7)
15 – Rate your workload due to coordination and communication with other sectors during this scenario. 3.1 (1.8) 3.5 (2.5)
16 – Rate your workload due to controller-pilot communication during this scenario. 4.1 (2.2) 4.2 (2.9)
17 – Rate your workload due to scanning for aircraft conflicts during this scenario. 5.1 (2.8) 5.9 (2.9)
18 – Rate your workload due to aircraft separation requirements during this scenario. 3.8 (2.3) 4.1 (2.2)
19 – If there were UAS in the scenario you just completed, what effect did UAS operations have on your overall workload? NA 4.7 (1.1)
20 – Rate your overall level of situation awareness during this scenario. 8.3 (1.4) 7.3 (1.7)
21 – Rate your situation awareness for detecting aircraft conflicts during this scenario. 8.6 (1.2) 7.7 (2.0)
22 – Rate your situation awareness for aircraft separation during this scenario. 8.6 (1.3) 7.8 (1.9)
23 – If there were UAS in the scenario you just completed, what effect did UAS operations have on your overall situation awareness? NA 5.0 (1.4)
24 – Rate the overall difficulty of this scenario. 4.2 (2.2) 5.0 (2.2)
25 – Rate the overall performance of the simulation pilots in terms of their responding to control instructions, phraseology, and providing readbacks. 7.8 (1.5) 7.7 (1.9)
Note. NA = Not Applicable.

36
6.1.7 Summary of Results – Experiment One
Overall, the results of Experiment One indicate that the integration of UAS, given their current limitations (e.g., unable to accept visual clearances), may negatively affect airspace efficiency and controller perceptions of traffic management. We found that aircraft spent more time and traveled a greater distance in the Mulford sector and that more aircraft were handled in the Grove sector when UAS were in the airspace. Controllers working the Grove sector may not have handed off aircraft as quickly as when UAS were in the airspace in an attempt to help the Mulford controller manage workload and traffic in the Mulford sector more effectively. Other results indicate that the Mulford controller was busier when UAS were in the airspace. The presence of UAS influenced controller perceptions of how they managed traffic. The Mulford controllers reported that UAS had a negative effect on their performance, and that, 1) their efficiency was lower, 2) their workload due to separation requirements was higher, and, 3) the overall difficulty of scenarios was higher when UAS were in the airspace. The Grove controllers also reported some negative effects when UAS were in the airspace—their overall situation awareness and their situation awareness for detecting conflicts was lower, and the overall difficulty of scenarios was higher.
UAS also affected communication patterns. The number of ground-air transmissions increased when UAS were in the airspace and the duration of both the ground-air and air-ground transmission decreased in the Mulford sector. The controllers made more but shorter communications when UAS were in the airspace. One possible reason for the increase in transmissions may be that more control actions were required to manage the UAS because they could not accept visual clearances. The shorter communication durations when UAS were present also suggests an increased urgency in communications, although this increase was slight.
6.2 Experiment Two – UAS Integration to OAK 30 with Missed Approaches at HWD
We designed this experiment to test the effects of a manned aircraft on missed approach at a secondary airport (HWD) interfering with UAS on approach to a primary airport (OAK 30). As stated in section 4.5.5.3, Missed Approaches at HWD, the standard ATC instruction that we used for a missed approach at HWD was “turn left heading 210, climb and maintain 2,000.” This standard missed approach procedure directed the aircraft executing the missed approach to fly directly across the final approach course to OAK 30. The HWD missed approach procedure forced the participant working the Mulford sector (and the OAK 30 final) to either vector the aircraft on final, issue a go-around instruction, or issue a visual separation clearance. Issuing a visual separation clearance is the least disruptive of the options; however, the participants could not issue a visual separation clearance to UAS. Therefore, we expected that a manned aircraft executing a missed approach procedure at HWD would be more disruptive when UAS were on the final approach to OAK 30 compared to when manned aircraft were on the final approach to OAK 30.
6.2.1 Sector System Data
For each experimental run, we used geographical sector boundaries to count the total number of aircraft, the total distance flown, and the total time in each sector. We also counted the number of unique aircraft that flew through each sector. We measured the mean time (s) and distance flown (nmi) by each unique aircraft in the Mulford and Grove sectors because an aircraft could have flown into and out of a sector more than once. For example, an aircraft that flew into the Grove sector, then flew into the Mulford sector, and then flew back into the Grove sector was counted as a single unique operation for time and distance calculations. We only calculated mean time and distance flown for unique aircraft. We did not calculate mean time and distance based on the total number

37
of operations because that would have skewed the data sets to include very short times and distances and would have produced an artificial source of variability. We also counted three types of arrivals for each experimental run: Low Approach, Missed Approach, and Full Stop.
6.2.1.1 Aircraft Time and Distance Flown in the Mulford Sector
The total number of aircraft that flew through the Mulford sector did not differ between the No UAS condition (M = 32.5, SD = 1.4) and the Integrated UAS condition (M = 32.3, SD = 1.3). The number of unique aircraft that flew through the Mulford sector was the same in both conditions (M = 30.0, SD = 0.0).
Neither the total distance flown (nmi) in the Mulford sector, No UAS (M = 476, SD = 34); Integrated UAS (M = 496, SD = 28), nor the total time (s) that aircraft flew in the sector, No UAS (M = 11,880, SD = 667); Integrated UAS (M = 12,230, SD = 647), differed between conditions.
There were also no significant differences between conditions for the mean distance flown (nmi) per aircraft (No UAS, M = 15.9, SD = 1.1; Integrated UAS, M = 16.5, SD = 0.9) or for the mean time (s) flown per aircraft in the Mulford sector (No UAS, M = 396, SD = 22; Integrated UAS, M = 408, SD = 22).
These results suggest that efficiency in the Mulford sector was not affected by the presence of UAS.
6.2.1.2 Aircraft Time and Distance Flown in the Grove Sector
There was no significant difference between conditions for the total number of aircraft that flew through the Grove sector (No UAS, M = 35.3, SD = 1.0; Integrated UAS, M = 36.3, SD = 2.1). Likewise, there was no significant difference between conditions for the mean number of unique aircraft that flew through the sector (No UAS, M = 32.7, SD = 0.7; Integrated UAS, M = 33.2, SD = 0.9).
There was no significant difference between conditions for the total distance (nmi) flown in the Grove sector, (No UAS, M = 491, SD = 29; Integrated UAS, M = 503, SD = 29) or for the total time (s) that aircraft flew in the sector (No UAS, M = 13076, SD = 700; Integrated UAS, M = 13,361, SD = 643).
There was also no significant difference between conditions for the mean distance (nmi) flown per aircraft (No UAS, M = 15.0, SD = 0.9; Integrated UAS, M = 15.2, SD = 0.9) or mean time (s) flown per aircraft (No UAS, M = 400, SD = 21; Integrated UAS, M = 403, SD = 19) in the Grove sector.
These results suggest that efficiency in the Grove sector was not affected by the presence of UAS.
6.2.1.3 Number of Arrivals
After we completed data collection, an ATC SME reviewed audio and video recordings of each experimental run. The ATC SME recorded the number of arrivals for all runways beneath the Mulford and Grove sectors. Arrivals were classified as one of three types: Low Approach, Full Stop, or Missed Approach. Arrivals occurred only at runways OAK 30, OAK 28R/L, and HWD. For purposes of analysis, all arrivals were attributed to the participant working at the Mulford sector even though OAK 28R was beneath the Grove sector. We analyzed the arrival count data by using paired t tests and Wilcoxon Matched Pairs t tests when necessary.

38
We analyzed the number of each arrival type by condition (see Table 15). No Low Approaches occurred during the experiment. The total number of Full Stop arrivals, No UAS (M = 18.3, SD = 1.4) and Integrated UAS (M = 17.8, SD = 2.2), did not differ significantly between conditions. Although two of the Missed Approach arrivals were scripted in each experimental run, Missed Approach arrivals were infrequent, and we analyzed them using the Wilcoxon Matched Pairs t test. The number of Missed Approach arrivals did not differ significantly between conditions. Overall, the presence of UAS did not affect the number of arrivals to any runway regardless of type of arrival.
Table 15. Mean (M) Number and Standard Deviation (SD) of Arrivals by Condition, Runway, and Type
Type of Approach
Low
Approach
Full Stop
Missed
Approach
Condition Runway M SD M SD M SD
No UAS OAK 30 0.0 (0.0) 8.3 (0.8) 0.3 (0.7) OAK 28R/L 0.0 (0.0) 6.1 (0.7) 0.1 (0.3) HWD 0.0 (0.0) 3.8 (0.9) 2.1 (0.3)
Integrated UAS OAK 30 0.0 (0.0) 7.6 (1.9) 0.7 (1.2) OAK 28R/L 0.0 (0.0) 6.4 (0.8) 0.0 (0.0) HWD 0.0 (0.0) 3.8 (0.6) 2.1 (0.5)
6.2.2 Simulation Pilot Commands
We recorded the number of simulation pilot commands entered for the Mulford and Grove sectors as a measure of controller clearances. We evaluated the most common commands used in the simulation—altitude, heading, speed, approach, and visual approach—in our analyses. We compared the total number of commands entered and the number of commands entered by type (e.g., altitude) between experimental conditions. We conducted separate analyses for the Mulford and Grove sectors.
6.2.2.1 Simulation Pilot Commands for the Mulford Sector
The mean numbers of simulation pilot commands entered for the Mulford sector are provided in Table 16. The total number of simulation pilot commands for the Mulford sector did not differ significantly between conditions. However, the simulation pilots entered significantly more altitude commands, t(11) = 2.36, p = .038, Cohen’s d = 0.61, and approach commands, t(11) = 5.21, p < .001 Cohen’s d = 1.8, in the Integrated UAS condition. The Mulford simulation pilots entered more visual approach commands in the No UAS condition, t(11) = 4.20, p = .002, Cohen’s d = 1.7, as expected, because controllers could not issue visual approach clearances to the UAS in the Integrated UAS condition.

39
Table 16. Mean (M) Number and Standard Deviation (SD) of Simulation Pilot Commands for the Mulford Sector by Condition and Type of Command
No
UAS
Integrated UAS
Command M SD M SD
Altitude 39.3 (3.9) 42.4 (5.9) Heading 32.3 (8.7) 37.3 (9.3)
Speed 19.0 (7.3) 15.5 (5.7)
Approach 12.3 (3.3) 16.7 (1.2) Visual Approach 6.5 (4.2) 1.3 (0.8) Totals 109.4 (12.6) 113.2 (13.1)
6.2.2.2 Simulation Pilot Commands for the Grove Sector
The mean numbers of simulation pilot commands entered for the Grove sector are provided in Table 17. Neither the total number nor the number of any command types differed significantly between conditions.
Table 17. Mean (M) Number and Standard Deviation (SD) of Simulation Pilot Commands for the Grove Sector by Condition and Type
No
UAS
Integrated UAS
Command M SD M SD
Altitude 19.2 (3.0) 19.6 (3.9) Heading 19.0 (4.7) 20.5 (7.6)
Speed 4.9 (2.9) 5.1 (2.8)
Approach 1.3 (2.1) 1.0 (1.7) Visual Approach 8.9 (2.8) 8.5 (1.9) Totals 53.3 (6.1) 54.7 (11.3)
6.2.3 Voice Communications
We recorded all voice communications to evaluate the number and duration of air-ground (pilot-to-Mulford/Grove) and ground-air (Mulford/Grove-to-pilot) Push-to-Talk (PTT) transmissions for the Mulford and Grove sectors. We also recorded the number and duration of ground-ground landline transmissions between the participants and the ghost controllers who simulated the North and South sectors and the OAK and HWD ATCTs. We evaluated the mean number and duration of PTT and landline transmissions for the Mulford and Grove sectors separately.
6.2.3.1 PTT Transmissions for the Mulford Sector
We measured the number and duration of the ground-air PTT transmissions from the Mulford sector to the pilots and the air-ground PTT transmissions from the pilots to the Mulford sector. Table 18 shows the mean number and duration of these transmissions. The number of ground-air PTT transmissions from the Mulford sector to the pilots did not differ significantly between

40
conditions. However, the participants made shorter (by about 0.3 s) PTT transmissions in the Integrated UAS Condition compared to in the No UAS condition, t(11) = 2.55 , p = .027, Cohen’s d = 0.41.
The number of air-ground PTT transmissions did not differ significantly between conditions. However, as with the ground-air PTT transmission, the duration of air-ground PTT transmissions were shorter in the Integrated UAS Condition compared to in the No UAS condition, t(11) = 2.73 , p = .02, Cohen’s d = 0.84. Therefore, both the controllers and the pilots made shorter PTT transmissions when UAS were in the Mulford sector.
Table 18. Mean (M) Number and Duration of Ground-Air and Air-Ground PTT Transmissions at the Mulford Sector
No
UAS
Integrated UAS
Transmission Measure M SD M SD
Ground-Air Number 161.5 (16.7) 161.9 (14.3)
Duration (s) 4.2 (0.8) 3.9 (0.6)
Air-Ground Number 179.3 (15.1) 180.6 (14.2)
Duration (s) 3.1 (0.2) 2.9 (0.2)
Note. (s) = Seconds.
6.2.3.2 Landline Transmissions for the Mulford Sector
We also measured the number of ground-ground landline transmissions between the Mulford sector and the ghost sectors. The number of ground-ground landline transmissions varied across participants and across conditions so it was not possible to evaluate these data statistically. We report only descriptive statistics for these measures. There were a total of 103 ground-ground landline transmissions in the No UAS condition and a total of 98 ground-ground landline transmissions in the Integrated UAS condition with mean transmission durations of 5.7 s, (SD = 2.1) and 6.4 s (SD = 3.1), respectively.
We collapsed the ground-ground landline communications by sector rather than by Mulford controller-to-ghost controller or ghost controller-to-Mulford controller because these data were not categorized separately for the first two participants due to a data recording error and because the overall number of ground-ground landline communications was low. Categorizing the data by sector allowed us to examine whether there were general trends in communication patterns based on condition. Table 19 presents the total number of ground-ground landline transmissions for each sector as well as the mean number and duration of transmissions for each sector. The greatest number of ground-ground landline transmissions appeared to occur between the Mulford sector and HWD ATCT in both conditions. This observation is not surprising given that the air traffic scenario included missed approaches at HWD that would have required coordination between HWD ATCT and the Mulford sector. There were no apparent differences in the data between conditions.

41
Table 19. Ground-Ground Landline Transmissions at the Mulford Sector
No UAS Integrated UAS
Duration (s) Duration (s)
Sectors Number M (SD) Number M (SD)
Mulford + South 27 6.0 (2.2) 22 7.9 (2.4)
Mulford + North 5 2.8 (1.8) 6 3.1 (2.3)
Mulford + OAK 1 9.7 (0.0) 6 10.0 (3.8)
Mulford + HWD 70 6.2 (1.6) 64 5.3 (1.2)
Totals 103 5.7 (2.1) 98 6.4 (3.1)
Note. (s) = Seconds.
6.2.3.3 PTT Transmissions for the Grove Sector
We measured the number and duration of the ground-air PTT transmissions from the Grove sector to the pilots and the air-ground PTT transmissions from the pilots to the Grove sector. Table 20 shows the mean number and duration of these transmissions.
Table 20. Mean (M) Number and Duration of Ground-Air and Air-Ground PTT Transmissions at the Grove Sector
No
UAS
Integrated UAS
Transmission Measure M SD M SD
Ground-Air Number 104.1 (11.6) 111.3 (20.6)
Duration (s) 4.1 (0.7) 4.1 (0.7)
Air-Ground Number 124.7 (13.9) 132.3 (23.0)
Duration (s) 3.0 (0.3) 3.0 (0.3)
Note. (s) = Seconds.
Overall, we found no statistically significant differences between conditions for either the number or duration of ground-air or air-ground PTT transmissions, indicating that there were no differences in communications when UAS were in the Grove sector.
6.2.3.4 Landline Transmissions for the Grove Sector
The ground-ground landline transmissions varied across participants in the Grove sector as they did in the Mulford sector and we report only the descriptive statistics for these data along with summary data by sector (see Table 21). Overall, the total number of ground-ground landline transmissions for the No UAS condition and the Integrated UAS condition was 39 and 42, with mean durations of 8.2 s, (SD = 5.4) and 7.7 s (SD = 5.8), respectively. The greatest number of landline transmissions occurred between the Grove and North sectors in both conditions.

42
There were no apparent differences for the number or duration of ground-ground landline transmissions between conditions.
Table 21. Ground-Ground Landline Transmissions at the Grove Sector
No UAS Integrated UAS
Duration (s) Duration (s) Sectors Number M (SD) Number M (SD)
Grove + South 10 7.3 (4.3) 10 8.0 (2.9)
Grove + North 21 8.5 (6.9) 22 7.9 (2.9)
Grove + OAK 7 9.3 (2.0) 9 7.0 (2.8)
Grove + HWD 1 4.5 (0.0) 1 7.7 (0.0)
Totals 39 8.2 (5.4) 42 7.7 (5.8)
Note. (s) = Seconds.
6.2.4 Subjective Ratings of Workload
Participants rated their subjective level of workload using the 10-button WAK (Stein 1985). If the participant did not respond within 20 seconds, the response was coded as missing. We coded failures to respond as missing data because it is unknown if the participant was too busy to respond or simply did not notice the WAK prompt. To allow for statistical analysis, we replaced missing responses with the mean WAK rating for the respective condition and time interval. There were 336 WAK prompts (12 participants by 7 intervals by 2 conditions by 2 sectors); of these, there were only 5 (1.5%) missed responses. The missing responses appeared to be randomly distributed across interval, condition, and sector. We analyzed the WAK ratings using a 7 (Interval – one rating every 4 minutes) x 2 (Condition – No UAS vs. Integrated UAS) repeated measures ANOVA. We performed the same analysis for WAK response time (i.e., the time it took for the participants to enter a response after the WAK prompt).
When the participants worked the Mulford sector, there was a significant effect of Interval on WAK ratings, F(6, 66) = 20.95, p < . 001, ηp² = 0.66, indicating that participants’ subjective level of workload changed over the course of the scenario. As Figure 6 shows, ratings increased from the first interval (4 min) to the second interval (8 min) and then continued to increase from the third interval (12 min) to the fourth interval (16 min) where ratings leveled off before decreasing in the final interval (28 min), HSD(66) = 1.47. WAK ratings did not differ significantly between the Integrated UAS condition (M = 4.4, SD = 1.8) and the No UAS condition (M = 4.3, SD = 1.7).

43
Figure 6. Mean WAK rating by interval at the Mulford sector.
There was a significant interaction between Condition and Interval for WAK response time at the Mulford sector, F(6, 66) = 2.73, p = .020, ηp² = 0.20. The time it took for the participants to respond to the WAK device can be considered as a secondary measure of workload and this result suggests that the participants had higher workload at Mulford in the Integrated UAS condition even though it was not reflected in their numerical WAK ratings. As Figure 7 shows, the interaction was due to the duration of the WAK response time at interval four (16 min) in the Integrated UAS condition, HSD(66) = 2.08. Interval four corresponds with the time in the air traffic scenario when an aircraft executed a scripted missed approach at HWD. The missed approach at HWD could have increased workload because the standard missed approach procedure was for the aircraft to turn left heading 210 and climb to 2,000 ft MSL, directing the aircraft to cross the OAK 30 final approach course at a conflicting altitude. If the participant at Mulford had already handed the OAK 30 traffic to OAK ATCT, he would have had a limited number of options to maintain separation between the aircraft on missed approach at HWD and the OAK 30 final traffic. If there was UAS traffic conflicting with the aircraft on a missed approach at HWD, the participant could not use visual separation between the two aircraft and would have had even fewer control options than if both aircraft were manned. The significant interaction effect is likely due to additional workload imposed by the aircraft executing a missed approach at HWD and a conflicting UAS on the OAK 30 final approach. The increased time it took for the participants to respond to the WAK during interval four suggests that the participants had higher workload during the scripted missed approach event in the Integrated UAS condition even though it was not reflected in their numerical WAK ratings.

44
Figure 7. Mean WAK response time by condition and interval at the Mulford sector.
When the participants controlled traffic at the Grove sector, there was a significant effect of Interval on WAK ratings, F(6, 66) = 7.91, p < .001, ηp² = 0.80, indicating that participants’ subjective level of workload changed over the course of the scenario. As Figure 8 shows, WAK ratings increased from the second interval (8 min) to the fourth interval (16 min), and then remained level until the last interval (28 min), HSD(66) = 1.12. Mean WAK ratings did not differ significantly between the Integrated UAS condition (M = 2.4, SD = 1.2) and the No UAS condition (M = 2.2, SD = 1.2).
Figure 8. Mean WAK rating by interval at the Grove sector.

45
WAK response times were significantly longer at the Grove sector for the Integrated UAS condition, (M = 2.7, SD = 0.7) compared to the No UAS condition (M = 2.3, SD = 0.6), F(1, 11) = 6.40, p = .028, ηp² = 0.37 (see Figure 9). The time it took for the participants to respond to the WAK device can be considered as a secondary measure of workload and this result suggests that the participants had higher workload at Grove in the Integrated UAS condition even though it was not reflected in their numerical WAK ratings.
Figure 9. Mean WAK response time by condition at the Grove sector.
6.2.5 Losses of Separation
During training, an ATC SME instructed the participants on the aircraft separation standards. We used standard separation minima of 3 nmi horizontal and 1,000 ft vertical. All UAS were categorized as small aircraft for purposes of wake turbulence separation. For aircraft operating directly behind another aircraft, directly behind and less than 1,000 ft below an aircraft, or following an aircraft conducting an instrument approach, separation was as follows:
Heavy behind heavy (4 miles)
Large/heavy behind B757 (4 miles)
Small behind B757 (5 miles)
Small/large behind heavy (5 miles)
For aircraft landing behind another aircraft on the same runway or behind an aircraft making a full stop or low approach arrival, the ATC SME instructed the participants to separate aircraft to ensure the following minima existed at the time the preceding aircraft was over the landing threshold:
Small behind large (4 miles)
Small behind B757 (5 miles)
Small behind heavy (6 miles)

46
For aircraft established on final approach to OAK 30, the ATC SME instructed the participants that 2.5 nmi separation between aircraft was authorized except for UAS.
For standard formation flights, 1 mile was added to the appropriate radar separation minima. UAS were always part of a formation flight due to the COA requirement for a chase aircraft. However, the ATC SME did not brief the participants to add 2 miles to the appropriate separation minima between two UAS, and we did not use that criterion in our analysis.
For Class C service separation, the SMEs instructed the participants to ensure separation of VFR aircraft from IFR aircraft by any one of the following:
Visual separation
500 feet vertical separation
Target resolution
Radar separation minima for wake turbulence
For passing or diverging aircraft, the participants did not have to apply separation standards when:
Aircraft were on opposite courses and had passed each other
Aircraft were on the same or crossing courses and one aircraft had crossed the projected course of the other and their course differed by an angle of at least 15 degrees
Target resolution
After we completed data collection, an ATC SME reviewed the audio and video recordings of each experimental run to identify LOS in the Mulford sector. The ATC SME recorded the time at which the LOS occurred, the type of aircraft involved, whether the aircraft were IFR or VFR, and which separation rules were in effect (e.g., 2.5 nmi between non-UAS aircraft on final approach). We analyzed the data by using the TGF DRAT software to determine the CPA, minimum horizontal distance, and minimum vertical distance for each identified aircraft pair. We used the minimum horizontal and vertical distance measures to calculate the composite slant range as defined in FAA Order JO 7210.633 (FAA, 2012a). The composite slant range provides a single value of separation that represents both the vertical and horizontal dimensions, the formula for which is √[(vertical maintained/vertical separation required)2 +(horizontal maintained/horizontal separation required)2]. Values range from 0 to 1.41 in which 1.41 indicates “100% separation on both axes,” and lower numbers indicate less separation between aircraft. Because the aircraft slowed unexpectedly on final, we eliminated from our analyses any LOS event that occurred when aircraft were on final approach.
We observed a total of nine LOS in this experiment, six LOS in the No UAS condition and three LOS in the Integrated UAS condition. None of the LOS were NMACs. All of the LOS occurred for one participant. Given the small number of LOS and lack of variability across participants, we were unable to conduct statistical analyses on these data, so we provide descriptive statistics only.
In the No UAS condition, the mean CPA for the six LOS was 1.76 nmi (SD = 0.9 nmi) and the mean composite slant range was 0.96 nmi (SD = 0.28). One of the six LOS occurred between a VFR and an IFR aircraft. In the Integrated UAS condition, the mean CPA for the three LOS was 2.0 nmi (SD = 0.7 nmi) and the mean composite slant range was 1.00 nmi (SD = 0.05). Two of the three LOS involved UAS—one LOS occurred between two UAS, and the other LOS occurred

47
between a UAS and an IFR aircraft. The third LOS occurred between a VFR and an IFR (non-UAS) aircraft. There were no NMACs in either condition.
6.2.6 Post-Scenario Questionnaire
The participants completed the PSQ (see Appendix C) after each experimental run. The participants responded with Likert scale ratings, and they had the option of providing additional comments. The participants’ comments are shown by item in Appendix G. When analyzing the PSQ responses, we were interested in two main questions: Did the participants’ responses change between conditions? (e.g., Did the presence of UAS lead to differences in self-reported performance?) And for UAS-specific questions, did the participants believe that the presence of UAS affected their performance or ability to handle air traffic in the airspace sector? We analyzed each item using a two-tailed, paired t test.
6.2.6.1 Participant Responses for the Mulford Sector
Table 22 shows mean ratings and standard deviations for each of the PSQ items from participants at the Mulford sector. The participants’ ratings for the NASA-TLX (Hart & Staveland, 1988) items (Items 1-6) did not differ significantly between conditions. The participants’ responses to various aspects of performance (Items 7-9) also did not differ between conditions, with the exception of their self-rated performance for sequencing aircraft (Item 10). The participants rated their performance for sequencing aircraft as being significantly lower in the Integrated UAS condition, t(11) = 3.15, p = .009, Cohen’s d = 0.96. The participants’ ratings for safety (Item 11), efficiency (Item 12), and workload (Items 14-18) did not differ between conditions. The participants rated their overall situation awareness (Item 20) as being lower in the Integrated UAS condition, t(11) = 2.61, p = 0.24, Cohen’s d = 0.67, but their ratings for more specific aspects of situation awareness (Items 21-22) did not differ between conditions. The participants’ ratings of scenario difficulty (Item 24) and simulation pilot performance (Item 25) did not differ significantly between conditions.
Three PSQ items assessed the participants’ opinion about the impact that UAS had on their overall performance, workload, and situation awareness in Integrated UAS condition only (Items 13, 19, and 23). For these items, the participants’ responses could range from 1 (negative effect) to 9 (positive effect), with a rating of 5 indicating no effect. The participants’ ratings indicated that the presence of UAS had a negative effect on their overall performance, t(11) = -3.53, p < .001, Cohen’s d = 1.02, and workload, t(11) = -3.73, p < .001, Cohen’s d = 1.08; however, there was no effect on their situation awareness.

48
Table 22. Means (M) and Standard Deviations (SD) of Responses for Each Item of the PSQ by Condition for the Mulford Sector
Item
No UAS M (SD)
Integrated UAS M (SD)
1 – Mental Demand 6.3 (2.2) 6.8 (2.3)
2 – Physical Demand 3.4 (2.5) 3.5 (2.5)
3 – Temporal Demand 5.8 (2.7) 6.1 (2.5)
4 – Performance 6.4 (1.6) 6.3 (2.1)
5 – Effort 6.8 (2.4) 6.9 (1.8)
6 – Frustration 5.0 (2.7) 5.4 (2.0)
7 – Rate your overall level of ATC performance during this scenario. 6.6 (1.9) 6.3 (2.0)
8 – Rate your performance for identifying aircraft conflicts during this scenario. 7.1 (1.8) 6.9 (1.8)
9 – Rate your performance for separating aircraft efficiently during this scenario. 6.5 (2.2) 5.6 (2.3)
10 – Rate your performance for sequencing aircraft during this scenario. 7.5 (2.0) 5.6 (2.0)
11 – Rate the overall safety of operations during this scenario. 6.9 (2.0) 6.3 (2.1)
12 – Rate the overall efficiency of operations during this scenario. 6.6 (1.9) 5.6 (2.1)
13 – If there were UAS in the scenario you just completed, what effect did UAS operations have on your overall performance? NA 3.1 (1.9)
14 – Rate your overall workload during this scenario. 6.6 (2.1) 7.3 (1.5)
15 – Rate your workload due to coordination and communication with other sectors during this scenario. 4.4 (3.1) 4.7 (2.5)
16 – Rate your workload due to controller-pilot communication during this scenario. 5.0 (2.8) 5.9 (3.0)
17 – Rate your workload due to scanning for aircraft conflicts during this scenario. 6.4 (2.5) 6.7 (1.5)
18 – Rate your workload due to aircraft separation requirements during this scenario. 6.0 (2.3) 6.8 (1.7)
19 – If there were UAS in the scenario you just completed, what effect did UAS operations have on your overall workload? NA 3.0 (1.9)
20 – Rate your overall level of situation awareness during this scenario. 7.5 (1.6) 6.5 (1.5)
21 – Rate your situation awareness for detecting aircraft conflicts during this scenario. 7.4 (2.1) 6.5 (2.1)
22 – Rate your situation awareness for aircraft separation during this scenario. 7.3 (2.3) 6.2 (2.0)
23 – If there were UAS in the scenario you just completed, what effect did UAS operations have on your overall situation awareness? NA 3.8 (1.9)
24 – Rate the overall difficulty of this scenario. 6.7 (2.3) 6.6 (2.0)
25 – Rate the overall performance of the simulation pilots in terms of their responding to control instructions, phraseology, and providing readbacks. 6.9 (2.5) 6.3 (2.2)
Note. NA = Not Applicable.

49
6.2.6.2 Participant Responses for the Grove Sector
Table 23 shows the mean ratings and standard deviations for each of the PSQ items from participants at the Grove sector. The participants’ ratings for the NASA-TLX (Hart & Staveland, 1988) items (Items 1-6) did not differ significantly between conditions. The participants’ ratings of performance (Items 7-10), overall safety (Item 11), overall efficiency (Item 12), and workload (Items 14-18) also did not differ significantly between conditions. The participants’ ratings for overall situation awareness (Item 20) did not differ significantly between conditions, but they rated their situation awareness for detecting aircraft conflict (Item 21) and their situation awareness for aircraft separation as being significantly lower in the Integrated UAS condition, t(11) = 1.91, p = .082, Cohen’s d = 0.28, and t(11) = 2.60, p = .025, Cohen’s d = 0.36, respectively. The participants also rated the difficulty of the scenario (Item 24) as being significantly higher in the Integrated UAS condition, t(11) = 2.20, p = .050, Cohen’s d = 0.45. The participants’ ratings of simulation pilot performance (Item 25) did not differ significantly between conditions.
Three PSQ items assessed the participants’ opinion about the impact that UAS had on their overall performance, workload, and situation awareness in Integrated UAS condition only (Items 13, 19, and 23). For these items, the participants’ responses could range from 1 (negative effect) to 9 (positive effect), with a rating of 5 indicating no effect. The participants’ ratings indicated that the presence of UAS had a negative effect on their overall performance, t(11) = -2.57, p = .026, Cohen’s d = 0.74, workload, t(11) = -2.28, p < .044, Cohen’s d = 0.66, and situation awareness, t(11) = -2.28, p = .043, Cohen’s d = 0.66.

50
Table 23. Means (M) and Standard Deviations (SD) of Responses for Each Item of the PSQ by Condition for the Grove Sector
Item No UAS M (SD)
Integrated UAS M (SD)
1 – Mental Demand 3.3 (1.7) 3.6 (1.9)
2 – Physical Demand 2.2 (1.3) 2.2 (1.3)
3 – Temporal Demand 2.7 (1.5) 3.3 (2.0)
4 – Performance 8.4 (1.8) 8.2 (1.9)
5 – Effort 3.5 (2.0) 4.5 (2.3)
6 – Frustration 2.2 (1.8) 3.1 (2.2)
7 – Rate your overall level of ATC performance during this scenario. 8.3 (2.4) 8.0 (2.3)
8 – Rate your performance for identifying aircraft conflicts during this scenario. 8.7 (1.7) 8.4 (2.1)
9 – Rate your performance for separating aircraft efficiently during this scenario. 8.8 (1.5) 8.4 (2.2)
10 – Rate your performance for sequencing aircraft during this scenario. 8.8 (1.4) 8.5 (2.2)
11 – Rate the overall safety of operations during this scenario. 9.1 (1.0) 8.4 (2.1)
12 – Rate the overall efficiency of operations during this scenario. 8.8 (1.4) 8.0 (2.0)
13 – If there were UAS in the scenario you just completed, what effect did UAS operations have on your overall performance? NA 4.0 (1.4)
14 – Rate your overall workload during this scenario. 3.5 (1.6) 4.2 (1.7)
15 – Rate your workload due to coordination and communication with other sectors during this scenario. 2.5 (2.2) 2.4 (1.4)
16 – Rate your workload due to controller-pilot communication during this scenario. 3.1 (2.2) 3.4 (2.9)
17 – Rate your workload due to scanning for aircraft conflicts during this scenario. 3.8 (2.3) 4.6 (2.2)
18 – Rate your workload due to aircraft separation requirements during this scenario. 3.3 (1.8) 3.3 (2.0)
19 – If there were UAS in the scenario you just completed, what effect did UAS operations have on your overall workload? NA 4.12 (1.3)
20 – Rate your overall level of situation awareness during this scenario. 8.3 (1.7) 8.5 (1.5)
21 – Rate your situation awareness for detecting aircraft conflicts during this scenario. 8.5 (1.6) 8.0 (2.0)
22 – Rate your situation awareness for aircraft separation during this scenario. 8.8 (1.5) 8.1 (2.2)
23 – If there were UAS in the scenario you just completed, what effect did UAS operations have on your overall situation awareness? NA 4.3 (1.1)
24 – Rate the overall difficulty of this scenario. 3.1 (2.0) 4.0 (2.0)
25 – Rate the overall performance of the simulation pilots in terms of their responding to control instructions, phraseology, and providing readbacks. 7.9 (2.8) 8.0 (1.8)
Note. NA = Not Applicable.

51
6.2.7 Summary of Results – Experiment 2
Overall, the results of Experiment 2 indicate that the integration of UAS in the airspace, given their current limitations (e.g., unable to accept visual clearances), may affect aircraft handling and controller perception of traffic management. In the Mulford sector, the number of simulation pilot commands entered (a proxy for controller clearances issued) differed depending on whether UAS were in the airspace. There were more altitude and approach commands entered in scenarios with UAS. Communication patterns also differed; the duration of transmissions between controllers and pilots was lower when UAS were in the airspace.
Workload response times, a secondary measure of workload, were also influenced by the presence of UAS. Longer workload response times suggest that the respondent is busy with other tasks. Although the workload ratings themselves did not differ between conditions, workload response times did differ. The Mulford controllers’ workload response times were affected by both the presence of UAS and the time in the scenario—with the longest response time occurring at the time of a missed approach at HWD that turned across the OAK 30 final when UAS were in the airspace. For the Grove controllers, workload response times were higher overall when UAS were in the airspace.
The presence of UAS had a negative effect on the participants’ perceptions of their performance. The Mulford controllers reported that the presence of UAS negatively affected their situation awareness and their performance for sequencing aircraft. The Grove controllers reported that their situation awareness for detecting conflicts and for aircraft separation was lower when UAS were in the airspace and that the scenarios were more difficult when UAS were in the airspace.
6.3 Experiment Three – UAS Integration in the Arrival Stream to OAK 30
We designed this experiment to focus on UAS integration in the arrival stream to OAK 30 and to examine various levels of UAS operations. As described in section 4.5.5.4, Air Traffic Scenarios, Arrival Stream to OAK 30, we compared a No UAS condition to a Low UAS Integration condition and a High UAS Integration condition.
6.3.1 Sector System Data
For each experimental run, we used geographical sector boundaries to count the total number of aircraft, the total distance flown, and the total time in each sector. We also counted the number of unique aircraft that flew through each sector. We measured the mean time (s) and distance flown (nmi) by each unique aircraft in the Mulford and Grove sectors because an aircraft could have flown into and out of a sector more than once. For example, an aircraft that flew into the Grove sector, then flew into the Mulford sector, and then flew back into the Grove sector was counted as a single unique operation for time and distance calculations. We only calculated mean time and distance flown for unique aircraft. We did not calculate mean time and distance based on the total number of operations because that would have skewed the data sets to include very short times and distances and would have produced an artificial source of variability. We also counted three types of arrivals for each experimental run: Low Approach, Missed Approach, and Full Stop.
6.3.1.1 Aircraft Time and Distance Flown in the Mulford Sector
There was a significant difference between conditions for the total number of aircraft that flew through the Mulford sector, No UAS (M = 45.7, SD = 1.0), Low UAS Integration (M = 45.3, SD = 1.0), and High UAS Integration (M = 46.5, SD = 1.2), F(2, 22) = 3.87, p = .036, ηp² = 0.26. The post-hoc test showed that there was a higher total number of aircraft that flew through the Mulford

52
sector in the High UAS Integration condition compared to the Low UAS Integration condition, HSD(22) = 1.15. There was no significant difference between the No UAS condition and either of the two UAS Integration conditions. The number of unique aircraft that flew through the Mulford sector did not differ between conditions, No UAS (M = 44.9, SD = 1.0), Low UAS Integration (M = 44.7, SD = 0.9), and High UAS Integration (M = 45.1, SD = 0.5).
The total distance (nmi) flown in the Mulford sector was significantly greater in the High UAS Integration condition (M = 624, SD = 30) compared to the No UAS condition (M = 591, SD = 27), F(2, 22) = 4.28, p = .027, ηp² = 0.28, HSD(22) = 29.90. There was no significant difference in total distance (nmi) flown between the Low UAS Integration condition (M = 597, SD = 26) and the other two conditions.
The total time (s) flown in the Mulford sector was significantly longer in the High UAS Integration condition (M = 15529, SD = 659) compared to the No UAS condition (M = 14675, SD = 638), F(2, 22) = 7.45, p = .003, ηp² = 0.40, HSD(22) = 3069.48. There was no significant difference in total time (s) flown between the Low UAS Integration condition (M = 15003, SD = 791) and the other two conditions.
Figure 10 shows the mean distance flown (nmi) per aircraft in the Mulford sector by condition. The mean distance flown was significantly greater in the High UAS Integration condition (M = 13.8, SD = 0.7) compared to the No UAS condition (M = 13.2, SD = 0.7), F(2, 22) = 3.82, p = .038, ηp² = 0.26, HSD(22) = 0.63. There was no significant difference in mean distance (nmi) flown per unique aircraft between the Low UAS Integration condition (M = 13.4, SD = 0.5) and the other two conditions.
Figure 10. Mean distance flown (nmi) by condition in the Mulford sector.
Figure 11 shows the mean time (s) flown per aircraft in the Mulford sector by condition. The mean time flown was significantly longer in the High UAS Integration condition (M = 345, SD = 15) compared to the No UAS condition (M = 327, SD = 16), F(2, 22) = 6.70, p = .005, ηp² = 0.38, HSD(22) = 12.10. There were no significant differences for mean time (s) flown in the sector between the Low UAS Integration condition (M = 336, SD = 17) and the other two conditions.

53
Figure 11. Mean time (s) flown by condition in the Mulford sector.
These results suggest that efficiency in the Mulford sector was negatively affected in the High UAS Integration condition. Aircraft spent more time and traveled over more distance in that condition.
6.3.1.2 Aircraft Time and Distance Flown in the Grove Sector
There was no significant difference between conditions for the total number of aircraft that flew through the Grove sector, No UAS (M = 55.9, SD = 1.6), Low UAS Integration (M = 56.3, SD = 1.5), and High UAS Integration (M = 56.0, SD = 1.5). Likewise, there was no significant difference between conditions for the mean number of unique aircraft that flew through the sector, No UAS (M = 50.2, SD = 0.7), Low UAS Integration (M = 50.5, SD = 0.7), and High UAS Integration (M = 50.4, SD = 1.2).
There was no significant difference between conditions for the total distance (nmi) flown in the Grove sector (No UAS, M = 796, SD = 59; Low UAS Integration, M = 811, SD = 36; and High UAS Integration, M = 805, SD = 38) or for total time (s) that aircraft flew in the sector (No UAS, M = 19982, SD = 1196; Low UAS Integration, M = 20398, SD = 783; and High UAS Integration, M = 20191, SD = 860).
There were no significant differences between conditions for the mean distance (nmi) flown per aircraft (No UAS, M = 15.9, SD = 1.1; Low UAS Integration, M = 16.1, SD = 0.7; and High UAS Integration, M = 16.0, SD = 0.5) or mean time (s) flown per aircraft (No UAS, M = 398, SD = 23; Low UAS Integration, M = 404, SD = 16; and High UAS Integration, M = 400, SD = 13) in the Grove sector.
These results suggest that efficiency was not affected in the Grove sector when UAS were present.

54
6.3.1.3 Number of Arrivals
After we completed data collection, an ATC SME reviewed audio and video recordings of each experimental run. The ATC SME recorded the number of arrivals for all runways beneath the Mulford and Grove sectors. Arrivals were classified as one of three types: Low Approach, Full Stop, or Missed Approach. Arrivals occurred only at runways OAK 30, OAK 28R/L, and HWD. For purposes of analysis, all arrivals were attributed to the participant working at the Mulford sector even though OAK 28R/L was beneath the Grove sector.
We analyzed the number of each arrival type by condition (see Table 24). No Low Approach arrivals occurred during the experiment, and there were no Full Stop arrivals at HWD. There was a significant difference across conditions in the total number of Full Stop arrivals, F(2, 22) = 11.26, p < .001, ηp² = 0.51. There were fewer Full Stop arrivals in the High UAS Integration condition (M = 22.1, SD = 1.7) compared to in the No UAS condition (M = 25.0, SD = 1.9) and in the Low UAS Integration condition (M = 24.8, SD = 2.8), HSD(22) = 1.71. There was no difference between the total number of Full Stop arrivals between the No UAS condition and the Low UAS Integration condition. Because Missed Approach arrivals occurred infrequently, we used a Friedman ANOVA (the non-parametric equivalent of a repeated-measures ANOVA) to analyze the number of Missed Approach arrivals by condition. There was a significant effect of Condition for the number of Missed Approach arrivals, χ2(2) = 7.00, p = .030; but this effect occurred only because there were no Missed Approach arrivals in the Low UAS Integration condition. We used a Wilcoxon t test to verify that there was no significant difference in the number of Missed Approach arrivals between the No UAS condition and the High UAS Integration condition. Overall, the presence of UAS only had a negative effect on the overall number of Full Stop arrivals in the High UAS Integration condition.
Table 24. Mean (M) Number and Standard Deviation (SD) of Arrivals by Condition, Runway, and Type
Type of Approach
Low
Approach
Full Stop
Missed
Approach
Condition Runway M SD M SD M SD
No UAS OAK 30 0.0 (0.0) 14.3 (1.7) 0.5 (0.9) OAK 28R/L 0.0 (0.0) 10.8 (0.8) 0.0 (0.0) HWD 0.0 (0.0) 0.0 (0.0) 0.0 (0.0)
Low UAS Integration OAK 30 0.0 (0.0) 14.1 (1.8) 0.0 (0.0) OAK 28R/L 0.0 (0.0) 10.7 (1.4) 0.0 (0.0) HWD 0.0 (0.0) 0.0 (0.0) 0.0 (0.0)
High UAS Integration OAK 30 0.0 (0.0) 11.8 (1.0) 0.4 (0.5) OAK 28R/L 0.0 (0.0) 10.3 (1.1) 0.0 (0.0) HWD 0.0 (0.0) 0.0 (0.0) 0.0 (0.0)

55
6.3.2 Simulation Pilot Commands
We recorded the number of simulation pilot commands entered for the Mulford and Grove sectors as a measure of controller clearances. We evaluated the most common commands used in the simulation—altitude, heading, speed, approach, and visual approach—in our analyses. We compared the total number of commands entered and the number of commands entered by type (e.g., altitude) between experimental conditions. We conducted separate analyses for the Mulford and Grove sectors.
6.3.2.1 Simulation Pilot Commands for the Mulford Sector
The mean numbers of simulation pilot commands entered for the Mulford sector are provided in Table 25 The total number of simulation pilot commands differed significantly between conditions, F(2, 22) = 7.77, p <. 003, ηp² = 0.41. The post-hoc analysis indicated that each of the conditions differed significantly from one another, HSD(22) = 12.04, with the greatest number of commands entered in the High UAS Integration condition.
Table 25. Mean (M) Number and Standard Deviation (SD) of Simulation Pilot Commands for the Mulford Sector by Condition and Type of Command
No
UAS
Low UAS Integration
High
UAS Integration
Command M SD M SD M SD
Altitude 34.0 (7.0) 34.8 (7.5) 36.1 (7.3) Heading 24.9 (7.6) 29.8 (8.8) 35.2 (10.9)
Speed 30.4 (8.7) 37.9 (10.0) 37.0 (8.9)
Approach 7.0 (7.0) 12.6 (3.7) 15.4 (3.7) Visual Approach 11.6 (6.3) 5.3 (3.3) 2.8 (1.9) Totals 107.9 (13.3) 120.4 (18.0) 126.5 (19.0)
There were significantly more heading commands entered in the High UAS Integration condition than in either the Low UAS Integration condition or the No UAS condition, F(2, 22) = 5.83, p = .009, ηp² = 0.35, HSD(22) = 7.55.
The number of speed commands entered also differed significantly between conditions, F(2, 22) = 6.33, p = .007, ηp² = 0.37. The simulation pilots entered more speed commands in both the High UAS Integration and Low UAS Integration conditions compared to the No UAS condition, HSD(22) = 5.78. However, there was no significant difference between the number of speed commands entered in the High UAS Integration and Low UAS Integration conditions.
The number of approach commands entered differed significantly between conditions, F(2, 22) = 21.89, p < .001, ηp² = 0.67. The simulation pilots entered more approach commands in both the High UAS Integration and Low UAS Integration conditions compared to the No UAS condition, HSD(22) = 3.25. However, there was no significant difference between the number of approach commands entered in the High UAS Integration and Low UAS Integration conditions.
Finally, the number of visual approach commands entered also differed significantly between conditions, F(2, 22) = 27.19, p < .001, ηp² = 0.71. The simulation pilots entered more visual approach commands in the No UAS condition than in either of the other two conditions, HSD(22) = 3.10. This result is not surprising because controllers could not issue visual clearances to the UAS

56
in either of those conditions. There was no significant difference in the number of visual approach commands entered in the Low UAS Integration and the High UAS Integration conditions.
6.3.2.2 Simulation Pilot Commands for the Grove Sector
The mean numbers of simulation pilot commands entered for the Grove sector are provided in Table 26. Neither the total number nor the number of any command types differed significantly across conditions.
Table 26. Mean (M) Number and Standard Deviation (SD) of Simulation Pilot Commands for the Grove Sector by Condition and Type of Command
No
UAS
Low UAS Integration
High
UAS Integration
Command M SD M SD M SD
Altitude 26.2 (3.9) 26.7 (5.1) 26.0 (3.6) Heading 27.8 (9.7) 24.3 (5.7) 23.5 (6.6)
Speed 6.8 (3.3) 9.2 (5.2) 9.3 (4.4)
Approach 1.5 (2.9) 2.1 (4.0) 1.3 (2.8) Visual Approach 12.7 (3.9) 13.0 (4.2) 13.0 (3.6) Totals 75.0 (13.5) 75.3 (10.7) 73.1 (10.2)
6.3.3 Voice Communications
We recorded all voice communications to evaluate the number and duration of air-ground (pilot-to-Mulford/Grove) and ground-air (Mulford/Grove-to-pilot) PTT transmissions for the Mulford and Grove sectors. We also recorded the number and duration of ground-ground landline transmissions between the participants and the ghost controllers who simulated the North and South sectors and the OAK and HWD ATCTs. We evaluated the mean number and duration of PTT and landline transmissions for the Mulford and Grove sectors separately.
6.3.3.1 PTT Transmissions for the Mulford Sector
We measured the number and duration of the ground-air PTT transmissions from the Mulford controllers to the pilots and the air-ground PTT transmissions from the pilots to the Mulford controllers. Figure 12 shows the mean number of ground-air transmissions. The number of ground-air PTT transmissions differed significantly by condition, F(2, 22) = 4.59, p = .022, ηp² = 0.29. The post-hoc analysis indicated that there were more ground-air PTT transmissions at the Mulford sector in the High UAS Integration condition than in the No UAS condition, HSD(22) = 13.13. There was no difference in the number of ground-air PTT transmissions between the No UAS condition and the Low UAS Integration condition at the Mulford sector).

57
Figure 12. Mean number of ground-air PTT transmissions by condition at the Mulford sector.
Figure 13 shows the mean duration of the ground-air transmissions. Ground-air PTT transmission durations differed significantly across conditions in the Mulford sector, F(2, 22) = 12.05, p = .030, ηp² = 0.52. The post-hoc analysis indicated that ground-air PTT transmission durations in the Mulford sector were shorter in the High UAS Integration condition compared to the Low UAS Integration condition and the No UAS condition, HSD(22) = 0.17 There was no difference between the No UAS condition and the Low UAS Integration condition.
Figure 13. Mean duration of ground-air PTT transmissions by condition at the Mulford sector.
The number of air-ground PTT transmissions in the Mulford sector did not differ significantly across the No UAS (M = 180.3, SD = 15.0), Low UAS Integration (M =179.3, SD =11.6), and High UAS Integration (M = 190.5, SD =19.5) conditions. However, the duration of air-ground PTT transmissions did differ significantly across conditions, F(2, 22) = 3.95, p = .030, ηp² = 0.26 (see Figure 14). The post-hoc analysis indicated that air-ground PTT transmission durations at the

58
Mulford sector were shorter in the High UAS Integration condition compared to in the No UAS condition, HSD(22) = 0.18. Therefore, both the controllers and the pilots made shorter transmissions when UAS were in the Mulford sector.
Figure 14. Mean duration of air-ground PTT transmissions by condition at the Mulford sector.
6.3.3.2 Landline Transmissions for the Mulford Sector
We also measured the number of ground-ground landline transmissions between the Mulford controllers and the ghost controllers. The number of ground-ground landline transmissions varied across participants and across conditions so it was not possible to evaluate these data statistically. We report only descriptive statistics for these measures. There were a total of 18 ground-ground landline transmissions in the No UAS condition, a total of 21 ground-ground landline transmissions in the Low UAS Integration condition, and a total of 26 ground-ground landline transmissions in the High UAS Integration condition, with mean durations of 7.7 s (SD = 3.5), 6.8 s (SD = 3.5), and 6.2 s (SD = 3.8), respectively.
We collapsed the ground-ground landline transmissions by sector rather than by Mulford-to-ghost controller or ghost controller-to-Mulford because these data were not categorized separately for the first two participants due to a data recording error and because the overall number of ground-ground landline communications was low. Categorizing the data by sector allowed us to examine whether there were general trends in communication patterns based on condition. Table 27 presents the total number of ground-ground landline transmissions for each sector as well as the mean number and duration of ground-ground landline transmissions for each sector. The greatest number of ground-ground landline transmissions occurred between the Mulford and South sectors in all conditions. There also appeared to be slightly more ground-ground landline transmissions between Mulford and OAK ATCT when UAS were in the airspace.

59
Table 27. Ground-Ground Landline Transmissions for the Mulford Sector
No UAS Low UAS Integration High UAS Integration
Sectors Number Duration (s)
M (SD) Number Duration (s)
M (SD) Number Duration (s)
M (SD)
Mulford + South 15 8.6 (3.4) 14 7.7 (3.3) 13 6.5 (3.9)
Mulford + North 5 5.1 (2.8) 4 2.9 (0.9) 4 2.3 (0.6)
Mulford + OAK 1 9.9 (0.0) 4 9.7 (1.5) 9 7.8 (3.4)
Mulford + HWD 0 0.0 (0.0) 0 0.0 (0.0) 0 0.0 (0.0)
Totals 18 7.7 (3.5) 21 6.8 (3.5) 26 6.2 (3.8)
6.3.3.3 PTT Transmissions for the Grove Sector
We measured the number and duration of the ground-air PTT transmissions from the Grove controllers to the pilots and the air-ground PTT transmissions from the pilots to the Grove controllers. Overall, we found no statistically significant differences across conditions for either the number or duration of these transmissions, indicating that there were no differences in PTT communications when UAS were in the Grove sector.
6.3.3.4 Landline Transmissions for the Grove Sector
The ground-ground landline transmissions varied across participants at the Grove sector as they did in the Mulford sector. We report only the descriptive statistics for these data and present summaries by sector in Table 28. Overall, the total number of ground-ground landline transmissions in the No UAS condition was 21, the total number of ground-ground landline transmissions in the Low UAS condition was 28, and the total number of ground-ground landline transmissions in the High UAS condition was 21, with mean durations of 5.3 s, (SD = 3.9), 5.4 s (SD = 3.3), and 5.6 s (SD = 2.8), respectively. The greatest number of ground-ground landline transmission occurred between the Grove sector and the North sector in both conditions. There were no apparent trends in the data between conditions.

60
Table 28. Ground-Ground Landline Transmissions for the Grove Sector
No UAS Low UAS Integration High UAS Integration
Sectors Number Duration (s)
M (SD) Number Duration (s)
M (SD) Number Duration (s)
M (SD)
Grove + South 4 5.5 (3.0) 6 7.2 (4.4) 3 5.7 (1.9)
Grove + North 16 4.9 (4.2) 20 4.8 (3.0) 15 5.0 (3.2)
Grove + OAK 1 9.9 (0.0) 2 5.8 (0.0) 3 7.6 (1.1)
Grove + HWD 0 0.0 (0.0) 0 0.0 (0.0) 0 0.0 (0.0)
Totals 21 5.3 (3.9) 28 5.4 (3.3) 21 5.6 (2.8)
6.3.4 Subjective Ratings of Workload
Participants rated their subjective level of workload using the 10-button WAK (Stein 1985). If the participant did not respond within 20 seconds, the response was coded as missing. We coded failures to respond as missing data because it is unknown if the participant was too busy to respond or simply did not notice the WAK prompt. To allow for statistical analysis, we replaced missing responses with the mean WAK rating for the respective condition and time interval. There were 504 WAK prompts (12 participants by 7 intervals by 3 conditions by 2 sectors); of these, there were 12 missed responses (2.4%). The missing responses were randomly distributed across interval, condition, and sector. We analyzed the WAK ratings using a 7 (Interval – one rating every 4 minutes) x 3 (Condition – No UAS vs. Low UAS Integration vs. High UAS Integration) repeated measures ANOVA. We performed the same analysis for WAK response time (i.e., the time it took for the participants to enter a response after the WAK prompt).
When participants controlled traffic at the Mulford sector, there was a significant effect of Interval, F(6, 66) = 13.99, p < .001, ηp² = 0.56, indicating that participants’ subjective level of workload changed over the course of the scenario. As Figure 15 shows, WAK ratings increased from the first interval (4 min) to the third interval (12 min), and then remained level until the final interval (28 min), HSD(66) = 1.56.

61
Figure 15. Mean WAK rating by interval at the Mulford sector.
Figure 16 shows the mean WAK ratings for each condition in the Mulford sector. There was a significant main effect of Condition for WAK ratings in the Mulford sector, F(2, 22) = 5.31, p = .013, ηp² = 0.33. The post-hoc test showed that WAK ratings were significantly higher in the High UAS Integration condition (M = 4.4, SD = 1.9) compared to in the No UAS condition (M = 3.6, SD = 1.9) and the Low UAS Integration condition (M = 4.0, SD = 1.8), HSD(22) = 1.68. There was no statistical difference between WAK ratings in the No UAS condition and in the Low UAS Integration condition. There were no significant effects for WAK response time.
Figure 16. Mean WAK rating by condition at the Mulford sector.

62
There was a significant effect of Interval for WAK ratings at the Grove sector, F(6, 66) = 14.77, p < .001, ηp² = 0.57, indicating that participants’ subjective level of workload changed over the course of the scenario. As Figure 17 shows, ratings increased from the first interval (4 min) to the second interval (8 min) and then increased again in the fourth interval (16 min) before decreasing in the final interval (28 min), HSD(66) = 1.70. There was neither a significant effect of Condition nor an interaction between Condition and Interval. There were no significant effects of either Condition or Interval on WAK response time.
Figure 17. Mean WAK rating by interval at the Grove sector.
6.3.5 Losses of Separation
During training, an ATC SME instructed the participants on the aircraft separation standards— We used standard separation minima of 3 nmi horizontal and 1,000 ft vertical. All UAS were categorized as small aircraft for purposes of wake turbulence separation. For aircraft operating directly behind another aircraft, directly behind and less than 1,000 ft below an aircraft, or following an aircraft conducting an instrument approach, separation was as follows:
Heavy behind heavy (4 miles)
Large/heavy behind B757 (4 miles)
Small behind B757 (5 miles)
Small/large behind heavy (5 miles)
For aircraft landing behind another aircraft on the same runway or behind an aircraft making a full stop or low approach arrival, the ATC SME instructed the participants to separate aircraft to ensure the following minima existed at the time the preceding aircraft was over the landing threshold:
Small behind large (4 miles)
Small behind B757 (5 miles)
Small behind heavy (6 miles)

63
For aircraft established on final approach to OAK 30, the ATC SME instructed the participants that 2.5 nmi separation between aircraft was authorized except for UAS.
For standard formation flights, 1 mile was added to the appropriate radar separation minima. UAS were always part of a formation flight due to the COA requirement for a chase aircraft. However, the ATC SME did not brief the participants to add 2 miles to the appropriate separation minima between two UAS, and we did not use that criterion in our analysis.
For Class C service separation, the SMEs instructed the participants to ensure separation of VFR aircraft from IFR aircraft by any one of the following:
Visual separation
500 feet vertical separation
Target resolution
Radar separation minima for wake turbulence
For passing or diverging aircraft, the participants did not have to apply separation standards when:
Aircraft were on opposite courses and had passed each other
Aircraft were on the same or crossing courses and one aircraft had crossed the projected course of the other and their course differed by an angle of at least 15 degrees
Target resolution
After we completed data collection, an ATC SME reviewed the audio and video recordings of each experimental run to identify LOS in the Mulford sector. The ATC SME recorded the time at which the LOS occurred, the type of aircraft involved, whether the aircraft were IFR or VFR, and which separation rules were in effect (e.g., 2.5 nmi between non-UAS aircraft on final approach). We analyzed the data by using the TGF DRAT software to determine the CPA, minimum horizontal distance, and minimum vertical distance for each identified aircraft pair. We used the minimum horizontal and vertical distance measures to calculate the composite slant range as defined in FAA Order JO 7210.633 (FAA, 2012a). The composite slant range provides a single value of separation that represents both the vertical and horizontal dimensions, the formula for which is √([vertical maintained/vertical separation required)2 +(horizontal maintained/horizontal separation required)2]. Values range from 0 to 1.41 in which 1.41 indicates “100% separation on both axes,” and lower numbers indicate less separation between aircraft. Because the aircraft slowed unexpectedly on final, we eliminated from our analyses any LOS event that occurred when aircraft were on final approach.
We observed a total of three LOS in this experiment. One LOS occurred in each condition and occurred for three different participants. There were no NMACs in any of the conditions.
The LOS in the No UAS condition occurred between two IFR aircraft and had a CPA of 3.2 nmi and the composite slant range was 1.07. In the Low UAS Integration condition, the LOS occurred between two IFR (non-UAS) aircraft with a CPA of 1.8 nmi and a composite slant range of 0.68. In the High UAS Integration condition, the LOS occurred between a UAS and an IFR aircraft with a CPA of 1.1 nmi and a composite slant range of 0.28.

64
6.3.6 Post-Scenario Questionnaire
The participants completed the PSQ (see Appendix C) after each experimental run. The participants responded with Likert scale ratings, and they had the option of providing additional comments. The participants’ comments are shown by item in Appendix G. When analyzing the PSQ responses, we were interested in two main questions: Did the participants’ responses change between conditions? (e.g., Did the presence of UAS lead to differences in self-reported performance?) And for UAS-specific questions, did the participants believe that the presence of UAS affected their performance or ability to handle air traffic in the air space sector? We analyzed each item using a one-way, repeated measures ANOVA followed by post-hoc analyses with Tukey’s HSD as needed.
6.3.6.1 Participant Responses for the Mulford Sector
Table 29 shows mean ratings and standard deviations for each of the PSQ items from participants at the Mulford sector. The participants’ ratings for the NASA-TLX (Hart & Staveland, 1988) items (Items 1-6) did not differ significantly between conditions. The participants’ ratings of performance (Items 7-10), overall safety (Item 11), and overall efficiency (Item 12) also did not differ significantly between conditions. The participants’ ratings of workload did not differ significantly between conditions (Items 14-17) except for their ratings of workload due to aircraft separation. The participants rated their workload due to aircraft separation requirements (Item 18) as being significantly higher in the High UAS Integration condition than in the Low UAS Integration and No UAS conditions, F(2, 22) = 4.84, p = .018, ηp² = 0.31, HSD(22) = 1.80. The participants’ ratings for situation awareness (Items 20-22) did not differ between conditions. The participants rated the difficulty of the scenario (Item 24) as being higher in the High UAS Integration condition than in the Low UAS Integration and the No UAS conditions, F(2, 22) = 4.26, p = .027, ηp² = 0.28, HSD(22) = 1.79.
Three PSQ items assessed the participants’ opinion about the impact that UAS had on their overall performance, workload, and situation awareness in Integrated UAS condition only (Items 13, 19, and 23). For these items, the participants’ responses could range from 1 (negative effect) to 9 (positive effect), with a rating of 5 indicating no effect.
The participants rated their overall performance (Item 13) as being negatively affected by the presence of UAS in both the Low UAS Integration condition, t(11) = -5.00, p < .001, Cohen’s d = 1.44, and the High UAS Integration condition, t(11) = 3.63, p = .004, Cohen’s d = 1.05. The participants also said that the presence of UAS had a negative effect on their overall workload (Item 19) in both the Low UAS Integration condition, t(11) = 6.77, p < .001, Cohen’s d = 1.96, and the High UAS Integration condition, t(11) = 4.26, p = .001, Cohen’s d = 1.23. The participants’ ratings indicated that the presence of UAS did not have an effect on their overall situation awareness (Item 23).

65
Table 29. Means (M) and Standard Deviations (SD) of Responses for Each Item of the PSQ by Condition for the Mulford Sector
Item No UAS
M (SD)
Low UAS Integration
M (SD)
High UAS Integration
M (SD)
1 – Mental Demand 5.3 (3.0) 5.8 (2.4) 6.8 (2.3)
2 – Physical Demand 3.0 (2.7) 2.7 (1.7) 2.9 (2.3)
3 – Temporal Demand 4.7 (3.1) 4.7 (2.7) 5.8 (2.3)
4 – Performance 7.7 (2.4) 8.0 (1.9) 7.0 (1.5)
5 – Effort 5.6 (3.1) 5.9 (2.4) 6.9 (2.7)
6 – Frustration 3.5 (3.1) 3.5 (2.2) 4.2 (1.9)
7 – Rate your overall level of ATC performance during this scenario. 7.2 (3.0) 7.6 (1.9) 6.5 (2.1)
8 – Rate your performance for identifying aircraft conflicts during this scenario. 7.7 (2.5) 8.2 (1.9) 7.7 (1.5)
9 – Rate your performance for separating aircraft efficiently during this scenario. 7.4 (2.8) 8.1 (1.8) 6.9 (2.3)
10 – Rate your performance for sequencing aircraft during this scenario. 8.0 (2.2) 8.2 (1.6) 7.5 (1.9)
11 – Rate the overall safety of operations during this scenario. 7.5 (2.5) 8.0 (1.5) 6.8 (2.3)
12 – Rate the overall efficiency of operations during this scenario. 7.9 (2.5) 7.4 (1.9) 6.7 (1.9)
13 – If there were UAS in the scenario you just completed, what effect did UAS operations have on your overall performance? NA 3.3 (1.2) 3.0 (1.9)
14 – Rate your overall workload during this scenario. 6.2 (2.7) 6.7 (1.7) 7.1 (1.8)
15 – Rate your workload due to coordination and communication with other sectors during this scenario. 2.8 (1.6) 3.1 (1.6) 3.4 (2.7)
16 – Rate your workload due to controller-pilot communication during this scenario. 3.6 (3.0) 4.0 (2.9) 4.5 (3.0)
17 – Rate your workload due to scanning for aircraft conflicts during this scenario. 5.7 (2.4) 5.8 (2.2) 5.8 (1.7)
18 – Rate your workload due to aircraft separation requirements during this scenario. 5.2 (2.4) 6.6 (2.6) 7.4 (1.8)
19 – If there were UAS in the scenario you just completed, what effect did UAS operations have on your overall workload? NA 3.2 (0.9) 2.6 (1.9)
20 – Rate your overall level of situation awareness during this scenario. 7.8 (1.6) 7.8 (1.8) 7.3 (1.6)
21 – Rate your situation awareness for detecting aircraft conflicts during this scenario. 7.9 (1.6) 7.7 (1.8) 7.5 (1.2)
22 – Rate your situation awareness for aircraft separation during this scenario. 8.0 (1.7) 7.8 (1.6) 7.4 (1.4)
23 – If there were UAS in the scenario you just completed, what effect did UAS operations have on your overall situation awareness? NA 4.1 (1.8) 4.0 (2.2)
24 – Rate the overall difficulty of this scenario. 5.5 (2.8) 5.6 (1.7) 7.4 (1.6)
25 – Rate the overall performance of the simulation pilots in terms of their responding to control instructions, phraseology, and providing readbacks. 8.3 (1.4) 8.1 (1.5) 7.5 (1.9)
Note. NA = Not Applicable.

66
6.3.6.2 Participant Responses for the Grove Sector
Table 30 shows the mean ratings and standard deviations for each of the PSQ items from participants at the Grove sector. The participants’ ratings for the NASA-TLX (Hart & Staveland, 1988) items (Items 1-6) did not differ significantly between conditions. The participants’ ratings of performance (Items 7-10), overall safety (Item 11), overall efficiency (Item 12), workload (Items 14-18), situation awareness (Items 20-22), scenario difficulty (Item 24), and simulation pilot performance (Item 25) also did not differ significantly between conditions.
Three PSQ items assessed the participants’ opinion about the impact that UAS had on their overall performance, workload, and situation awareness in Integrated UAS condition only (Items 13, 19, and 23). For these items, the participants’ responses could range from 1 (negative effect) to 9 (positive effect), with a rating of 5 indicating no effect. The participants indicated that the presence of UAS had no effect on their overall performance (Item 13) or situation awareness (Item 23). However, the participants rated the presence of UAS as having a negative effect on their overall workload in the High UAS Integration condition only, t(11) = 2.42, p = .034, Cohen’s d = 0.70. Table 30 shows mean ratings and standard deviations for the PSQ at the Grove sector.

67
Table 30. Means (M) and Standard Deviations (SD) of Responses for Each Item of the PSQ by Condition for the Grove Sector
Item No UAS
M (SD)
Low UAS Integration
M (SD)
High UAS Integration
M (SD)
1 – Mental Demand 5.9 (2.9) 5.7 (2.4) 5.6 (2.9)
2 – Physical Demand 3.3 (2.4) 3.0 (2.3) 2.9 (2.4)
3 – Temporal Demand 5.6 (3.1) 5.2 (2.7) 5.2 (3.0)
4 – Performance 8.0 (2.1) 7.8 (1.5) 8.3 (1.2)
5 – Effort 6.3 (3.0) 6.2 (2.6) 6.1 (2.5)
6 – Frustration 3.7 (2.4) 3.9 (2.4) 3.8 (2.9)
7 – Rate your overall level of ATC performance during this scenario. 7.9 (2.2) 7.6 (1.3) 7.8 (1.5)
8 – Rate your performance for identifying aircraft conflicts during this scenario. 8.1 (1.7) 7.8 (1.5) 7.9 (1.4)
9 – Rate your performance for separating aircraft efficiently during this scenario. 7.3 (2.2) 8.0 (1.7) 8.1 (1.2)
10 – Rate your performance for sequencing aircraft during this scenario. 8.3 (1.7) 8.1 (1.9) 8.3 (1.2)
11 – Rate the overall safety of operations during this scenario. 7.2 (2.3) 7.7 (1.6) 7.7 (1.2)
12 – Rate the overall efficiency of operations during this scenario. 7.8 (1.8) 7.5 (1.5) 7.7 (1.0)
13 – If there were UAS in the scenario you just completed, what effect did UAS operations have on your overall performance? NA 4.7 (0.7) 4.2 (1.4)
14 – Rate your overall workload during this scenario. 6.3 (2.5) 6.2 (1.9) 6.3 (2.4)
15 – Rate your workload due to coordination and communication with other sectors during this scenario. 2.6 (1.2) 3.5 (2.4) 2.6 (1.4)
16 – Rate your workload due to controller-pilot communication during this scenario. 5.3 (3.4) 4.5 (3.0) 5.3 (3.3)
17 – Rate your workload due to scanning for aircraft conflicts during this scenario. 6.2 (2.6) 6.5 (2.7) 6.3 (2.6)
18 – Rate your workload due to aircraft separation requirements during this scenario. 5.4 (2.2) 5.3 (1.8) 5.5 (2.6)
19 – If there were UAS in the scenario you just completed, what effect did UAS operations have on your overall workload? NA 4.6 (0.8) 4.2 (1.2)
20 – Rate your overall level of situation awareness during this scenario. 7.6 (2.0) 7.5 (1.5) 7.8 (1.1)
21 – Rate your situation awareness for detecting aircraft conflicts during this scenario. 7.7 (1.6) 7.3 (1.7) 7.8 (1.0)
22 – Rate your situation awareness for aircraft separation during this scenario. 7.8 (1.5) 7.8 (1.1) 8.2 (1.0)
23 – If there were UAS in the scenario you just completed, what effect did UAS operations have on your overall situation awareness? NA 4.7 (1.1) 4.5 (1.2)
24 – Rate the overall difficulty of this scenario. 6.2 (2.7) 5.9 (2.1) 6.2 (2.5)
25 – Rate the overall performance of the simulation pilots in terms of their responding to control instructions, phraseology, and providing readbacks. 7.6 (2.5) 7.4 (1.8) 7.1 (3.0)
Note. NA = Not Applicable.

68
6.3.7 Summary of Results – Experiment Three
Overall, the results of Experiment Three indicate that the integration of UAS in the airspace, given their current limitations (e.g., unable to accept visual clearances), may negatively affect airspace efficiency, aircraft handling, and controller perception of traffic management. The most negative effects were associated with the High UAS Integration condition. The controllers in the Mulford sector handled more aircraft, and the aircraft spent more time and traveled longer distances, in scenarios with a high level of UAS compared to scenarios without UAS or with a low level of UAS. There were also fewer full stop arrivals in scenarios with a high level of UAS compared to either of the other conditions.
The number of simulation pilot commands (a proxy for controller clearances issued) also differed depending on whether UAS were in the airspace. The total number of commands and the number of heading commands entered was higher in scenarios with a high level of UAS compared to scenarios with no UAS or a low level of UAS. The number of speed and approach commands was higher in conditions with UAS than without UAS.
UAS also affected communication patterns. The Mulford controllers made more and shorter transmissions, and the pilots also made shorter transmissions, with a high level of UAS. The Mulford controller WAK workload ratings were highest with high levels of UAS. However, on the PSQ, the Mulford controllers indicated that UAS had a negative effect on overall workload whenever UAS were integrated in the airspace. The Mulford controllers also reported that workload was high due to aircraft separation requirements and that scenarios were more difficult with high levels of UAS. The Grove controllers indicated that there was a negative effect of UAS on overall workload with a high level of UAS.
6.4 Exploratory Scenario
We implemented the Exploratory scenario to examine several events that were of interest to the project sponsor but could not be included in an experimental design. Therefore, this scenario has no associated control condition—and only a limited set of inferential statistical analyses on the questionnaire data were performed. The participants completed the Exploratory scenario (as described in section 4.5.5.5) at the conclusion of the three experiments. Each participant completed the Exploratory scenario in the Mulford sector and in the Grove sector. After completing the Exploratory scenario, we administered the PSQ to obtain feedback about the participants’ reactions to managing traffic that included two UAS departing VFR, and then requesting an IFR clearance below the MVA and a UAS arrival at OAK 30 that refused a base turn due to clouds. Also during the Exploratory scenario, a chase plane lost sight of the UAS while on final approach to OAK 30. We do not report any data regarding time and distance flown in sector, losses of separation, communications, or WAK ratings because we were unable to draw any conclusions from these measures without a corresponding control condition.
6.4.1 Post-Scenario Questionnaire
Table 31 shows mean ratings and standard deviations for each of the PSQ items from participants at the Mulford sector. Because there was no control condition for the Exploratory scenario, we only analyzed the three items on the PSQ that pertained to the effect of UAS (Items 13, 19, and 23). For these items, the participants’ responses could range from 1 (negative effect) to 9 (positive effect), with a rating of 5 indicating no effect. We used a two-tailed t test to determine if the participants’ ratings differed significantly from a neutral rating of 5. The Mulford participants indicated that the presence of UAS had a negative effect on their overall performance (Item 13),

69
t(11) = -4.18, p = .002, Cohen’s d = 1.25, and on their overall situation awareness (Item 23), t(11) = -2.61, p = .024, Cohen’s d = 1.0. The participants’ ratings for workload due to the presence of UAS (Item 19) in the Mulford sector did not differ significantly from a neutral rating of 5.
Table 31. Means (M) and Standard Deviations (SD) of Responses for each item of the PSQ for the Mulford Sector
Item Rating
M (SD)
1 – Mental Demand 5.3 (2.8)
2 – Physical Demand 2.5 (2.0)
3 – Temporal Demand 4.7 (2.6)
4 – Performance 7.8 (1.9)
5 – Effort 5.5 (2.6)
6 – Frustration 3.7 (2.4)
7 – Rate your overall level of ATC performance during this scenario. 7.6 (2.0)
8 – Rate your performance for identifying aircraft conflicts during this scenario. 7.1 (2.6)
9 – Rate your performance for separating aircraft efficiently during this scenario. 7.2 (2.6)
10 – Rate your performance for sequencing aircraft during this scenario. 8.1 (2.6)
11 – Rate the overall safety of operations during this scenario. 7.3 (2.5)
12 – Rate the overall efficiency of operations during this scenario. 7.3 (2.0)
13 – If there were UAS in the scenario you just completed, what effect did UAS operations have on your overall performance? 3.5 (1.2)
14 – Rate your overall workload during this scenario. 5.2 (2.5)
15 – Rate your workload due to coordination and communication with other sectors during this scenario. 3.1 (1.9)
16 – Rate your workload due to controller-pilot communication during this scenario. 4.8 (2.9)
17 – Rate your workload due to scanning for aircraft conflicts during this scenario. 5.3 (2.7)
18 – Rate your workload due to aircraft separation requirements during this scenario. 4.6 (2.3)
19 – If there were UAS in the scenario you just completed, what effect did UAS operations have on your overall workload? 3.4 (1.2)
20 – Rate your overall level of situation awareness during this scenario. 7.7 (2.1)
21 – Rate your situation awareness for detecting aircraft conflicts during this scenario. 7.6 (1.9)
22 – Rate your situation awareness for aircraft separation during this scenario. 7.7 (1.8)
23 – If there were UAS in the scenario you just completed, what effect did UAS operations have on your overall situation awareness? 3.8 (1.7)
24 – Rate the overall difficulty of this scenario. 5.3 (2.5)
25 – Rate the overall performance of the simulation pilots in terms of their responding to control instructions, phraseology, and providing readbacks. 7.3 (2.1)

70
Table 32 shows mean ratings and standard deviations for each of the PSQ items from participants at the Grove sector. The Grove participants indicated that the presence of UAS had a negative effect on their overall performance (Item 13), t(11) = -2.77, p = .018, Cohen’s d = 0.76, and on their overall workload (Item 19), t(11) = -2.61, p = .020, Cohen’s d = 0.74. The participants’ ratings for situation awareness due to the presence of UAS (Item 23) in the Grove sector did not differ significantly from a neutral rating of 5. The participants’ comments on the PSQ for the Exploratory scenario are available in Appendix G.
Table 32. Means (M) and Standard Deviations (SD) of Responses for each item of the PSQ for the Grove Sector
Item Rating
M (SD)
1 – Mental Demand 5.2 (2.6)
2 – Physical Demand 2.6 (2.0)
3 – Temporal Demand 4.8 (2.9)
4 – Performance 7.2 (2.9)
5 – Effort 5.0 (2.6)
6 – Frustration 4.3 (2.7)
7 – Rate your overall level of ATC performance during this scenario. 7.5 (2.2)
8 – Rate your performance for identifying aircraft conflicts during this scenario. 8.1 (1.6)
9 – Rate your performance for separating aircraft efficiently during this scenario. 8.0 (1.8)
10 – Rate your performance for sequencing aircraft during this scenario. 8.3 (1.6)
11 – Rate the overall safety of operations during this scenario. 8.1 (1. 6)
12 – Rate the overall efficiency of operations during this scenario. 7.6 (1.9)
13 – If there were UAS in the scenario you just completed, what effect did UAS operations have on your overall performance? 3.7 (1.7)
14 – Rate your overall workload during this scenario. 4.5 (2.1)
15 – Rate your workload due to coordination and communication with other sectors during this scenario. 4.1 (2.9)
16 – Rate your workload due to controller-pilot communication during this scenario. 5.9 (3.1)
17 – Rate your workload due to scanning for aircraft conflicts during this scenario. 5.3 (2.5)
18 – Rate your workload due to aircraft separation requirements during this scenario. 5.0 (2.3)
19 – If there were UAS in the scenario you just completed, what effect did UAS operations have on your overall workload? 3.6 (1.9)
20 – Rate your overall level of situation awareness during this scenario. 7.3 (1.5)
21 – Rate your situation awareness for detecting aircraft conflicts during this scenario. 7.7 (1.2)
22 – Rate your situation awareness for aircraft separation during this scenario. 7.8 (1.5)
23 – If there were UAS in the scenario you just completed, what effect did UAS operations have on your overall situation awareness? 4.5 (1.2)
24 – Rate the overall difficulty of this scenario. 4.8 (2.2)
25 – Rate the overall performance of the simulation pilots in terms of their responding to control instructions, phraseology, and providing readbacks. 6.4 (2.6)

71
6.4.2 Summary of Results – Exploratory Scenario
Overall, the participants were able to manage the various UAS events that occurred in the Exploratory scenario. It became clear though as the scenario developed, and based on the participants’ comments to the PSQ and debriefing (see section 7.5), that the scripted events caused some confusion regarding proper phraseology and procedures. Although the participants rated their overall workload as moderate and their situation awareness as relatively high, they thought that UAS operations did have some negative effect on these two aspects of their ability to control traffic in the Mulford sector. Likewise, when the participants worked at the Grove sector, they rated their overall workload as moderate and their overall performance as high. They reported that the presence of UAS operations had a negative effect on these two aspects of their ability to control traffic. The participants’ perceived negative effects of UAS operations may have been due to their unfamiliarity with the particular UAS operations that occurred in the Exploratory scenario, and suggest that ATCS must receive sufficient training on all aspects of UAS operations including off-nominal situations.
6.5 Post-Experiment Questionnaire
The participants completed the PEQ (see Appendix D) after completing the three experiments. The participants responded with Likert scale ratings, and they had the option of providing additional comments. Means and standard deviations for these items are presented in Table 33. For Items 1-8, a rating of “1” indicated extremely low and a rating of “10” indicated extremely high. For Item 9, a rating of “1” indicated a negative effect, a rating of “9” indicated a positive effect, and a rating of “5” indicated no effect. The participants’ comments for each item are available in Appendix H.
Table 33. Means (M) and Standard Deviations (SD) of Responses for Each Item of the PEQ
Item Rating
M (SD)
1 – Rate the overall realism of the simulation experience compared to actual ATC operations. 6.3 (1.6)
2 – Rate the realism of the simulation hardware compared to actual equipment. 7.9 (2.0)
3 – Rate the realism of the simulation software compared to the actual functionality. 7.3 (1.9)
4 – Rate the realism of the airspace compared to actual NAS airspace. 8.6 (1.7)
5 – Rate the realism of the simulation traffic scenarios compared to actual NAS traffic. 6.3 (1.8)
6 – To what extent did the WAK online workload rating technique interfere with your ATC performance?
2.2 (2.3)
7 – How effective was the airspace training? 7.5 (2.2)
8 – How effective was the STARS training? 9.3 (1.0)
9 – In your opinion, what effect would UAS operations have on Class C airspace? 3.0 (1.2)
The participants rated the overall realism of the simulation (Item 1) as moderate due primarily to UAS performance characteristics inside the final marker. Some of the participants also noted difficulties in communicating with the simulation pilots. They rated the realism of the simulation hardware (Item 2), software (Item 3), and airspace (Item 4) as highly realistic. They rated the realism of the simulation traffic scenarios (Item 5) as moderate, primarily due to issues related to VFR aircraft. The participants reported that the WAK had very little effect on their performance (Item 6), and they rated the effectiveness of the airspace (Item 7) and STARS training (Item 8) as high. Regarding UAS operations in Class C airspace, the participants thought that the presence of UAS operations would have a moderately negative effect (Item 9), primarily due to the issues associated

72
with visual compliance, especially the inability to use visual separation and the increased separation requirements needed for formation flights.
Item 10 of the PEQ asked the participants, “What are the major challenges with integrating UAS operations in Class C airspace?” The participants most frequently mentioned issues associated with visual compliance and the need for increased separation as major challenges.
Item 11 of the PEQ asked the participants, “What additional tools, requirements, or procedures are needed to integrate UAS operations into the NAS?” In response, the participants provided a wide variety of responses. One participant thought that STARS already provided the necessary tools to integrate UAS, whereas other participants thought that restrictions should be placed on UAS operations (e.g., segregate UAS, or only schedule UAS operations at off-peak times). The participants also stated that UAS integration would require (a) ATCS training on UAS and UAS operations, (b) airspace reconfiguration, (c) elimination of additional separation requirements due to the chase aircraft, (d) UAS be able to land at most runways, (e) rules on UAS flying on IFR flight plans, (f) rules on terrain and obstruction avoidance, (g) published approaches, (h) separation and weight classifications, (i) published holding points, (j) safe communication systems, and (k) GPS navigation.
7. PARTICIPANT DEBRIEF
After each group of participants completed the experiments, we conducted a debriefing. During the debriefing, the participants had the opportunity to summarize their experience in the simulation and provide their thoughts on the effect that UAS integration would have on NAS operations. The debriefing also gave the participants an opportunity to ask the experimenters any questions they had about the experiment, visual compliance issues, or UAS integration. In the next section, we summarize the participants’ comments from the debriefing.
7.1 General Debrief Comments
Overall, the participants reacted negatively to UAS’ inability to use visual procedures. The participants indicated that UAS inability to comply with visual procedures reduced airspace efficiency, increased the complexity of managing arrival traffic, impacted the ability to use simultaneous approaches on parallel runways, and added to controller workload. The need to add spacing to accommodate the chase aircraft further reduced airspace efficiency, especially on the arrival stream. The participants reported that the slower speed of the UAS on approach (i.e., 80 kts 3 nmi out) made it more difficult to manage arrivals efficiently because the participants had to extend final approach. Although not evaluated in this simulation, other comments indicated that UAS could further reduce efficiency because UAS would not use high speed taxi exits at the airport and, therefore, would not be able to leave the runway as quickly as other aircraft. Some comments also indicated that UAS increased risk and reduced safety because of their inability to see and avoid other aircraft. However, the participants did not believe that UAS negatively affected their situation awareness in the simulation.
The participants expressed a number of uncertainties about UAS capabilities and procedures. They commented on the need to receive more training on UAS and that some of the difficulties they encountered in the simulation were due to lack of familiarity with UAS operating characteristics. Some of the comments indicated that the participants found that workload and the need to pre-plan were reduced as the simulation progressed and they gained more experience with UAS.
The participants reported a need to have a designation on the radar display to indicate UAS aircraft type and weight category. They also expressed uncertainty as to what would happen when a

73
UAS is unable to comply with procedures. For example, UAS must fly IFR but cannot fly under IMC conditions. When this happens with manned aircraft, the pilot is instructed to “Maintain VFR” until the aircraft is at or above the MVA and clear of clouds. If the UAS is below the MVA and cannot remain clear of clouds, ATC cannot legally issue an IFR clearance. The participants thought that the FAA may need to develop some UAS procedures for this situation. The participants also thought that UAS may need some sort of terrain clearance waiver or onboard radar to maintain terrain clearance. Currently, all ATCS can do is issue an advisory (as per FAA Order 7110.65 Series). The participants noted that if the UAS pilot cannot maintain VFR (e.g., provide own separation for terrain and obstacles) below MVA prior to IFR pickup, the controller has no options. They suggested that UAS pilots should file and pick up IFR clearances on the ground.
There were some mixed responses to the issue of whether UAS affected safety. Some of the participants reported that they were “more cautious” when working UAS and felt that safety was impacted because the burden of “see and avoid” rests with manned aircraft. However, other comments indicated that UAS would not reduce safety.
Although the participants were instructed to call traffic for UAS during the simulation, they reported that they were uncertain about doing so. Some participants indicated that they did not always call traffic, especially as workload increased. One participant indicated that he “forgot” about the chase aircraft. Other participants commented that the chase aircraft should be able to report “traffic in sight.”
Most of the participants indicated that they did not give UAS priority over other aircraft. The participants’ comments suggested that because UAS are less flexible than manned aircraft, the overall operation would be less efficient if UAS were given priority. Some participants reported that they turned UAS away from other traffic. Other participants indicated that more planning was required to sequence the UAS arrivals (e.g., they needed to put slower UAS behind faster arrivals), but overall, they were not given priority. One participant indicated that procedures would need to be developed to address how UAS fit into priority in the NAS (e.g., public safety vs. package delivery).
Some participants made suggestions about how UAS should begin to be integrated into the NAS. For example, they indicated that initial UAS integration should be at low-level or secondary airports, occur during non-peak hours, or take place in sterilized airspace. The participants also commented that UAS would be more easily integrated in Class B airspace than Class C airspace because of VFR traffic in Class C airspace. The participants also reported that they believed considerable training on UAS operation and capabilities would be needed before UAS are integrated into the NAS.
7.2 Experiment One – Multiple Low Approaches at OAK 30 - Debrief Comments
Overall, the participants thought that UAS operations decreased efficiency and increased workload in Experiment 1. In addition to not being able to use visual approaches, the UAS were slower than other aircraft and required additional spacing because of the chase aircraft. The participants found that the 7 mile final approach fix was “unusual” given the number of aircraft in the sector and that it led to compression and increased workload in the Feeder position. Some of the participants suggested that UAS should be grouped with similar performing aircraft and segregated from other aircraft (e.g., land at a different runway) to improve efficiency. Other participants indicated that the UAS should be clearly designated on the radar display so that ATCS could more readily determine that additional spacing is required.

74
7.3 Experiment Two – Missed Approaches at HWD - Debrief Comments
Overall, the participants thought that UAS operations decreased efficiency and increased workload in Experiment 2. In addition to not being able to use visual approaches, the UAS were slower than other aircraft and required additional spacing because of the chase aircraft. The participants commented that the missed approaches at HWD caused increased workload. Some participants indicated that they left UAS arrivals to OAK at a higher altitude on the approach, kept them on the frequency longer, and turned the aircraft on missed approach at HWD away from the OAK arrivals to maintain separation. The participants also said that the two airports (OAK, HWD) had to be treated as one final and that UAS prevented them from using the “blow by” technique, where they would allow a faster aircraft to pass a slower aircraft using visual separation. The participants also stated that UAS operations may result in some safety being compromised (due to the lack of visual compliance) even if GA traffic monitors the local frequencies (e.g., UNICOM, ATCT).
7.4 Experiment Three – Arrival Stream to OAK 30 - Debrief Comments
Overall, the participants thought that UAS operations decreased efficiency and increased workload in Experiment 3. In addition to not being able to use visual approaches, the UAS were slower than other aircraft and required additional spacing because of the chase aircraft. The presence of UAS increased workload, and a higher number of UAS further added to complexity and workload. Scenarios with a high level of UAS became “much more difficult.” The participants reported that their traffic calls decreased as the number of UAS increased. In addition, low altitude VFR aircraft added to workload more than high altitude VFR aircraft. The participants also commented that they kept UAS at a higher altitude longer to protect the VFR aircraft flying at lower altitudes.
7.5 Exploratory Scenario – Debrief Comments
Overall, the participants indicated that they needed more experience and training on UAS behavior and operations. The participants were confused because UAS were on IFR flight plans but could not fly using visual flight rules. When the UAS departed VFR and then requested their pre-filed IFR flight plan while still below the MVA, the participants typically asked the UAS to climb before issuing the IFR clearance, but participants usually did not issue a terrain alert. Some of the participants were not familiar with operations in mountainous terrain. When the UAS refused a base turn to final due to clouds, the participants simply extended the downwind leg and then issued the base turn when the UAS was able. Although most of the participants said that the UAS pilot’s refusal to initiate the base turn was not an issue, some of the participants thought that it may have an impact in other circumstances (e.g., if other traffic is a factor). The participants said that in general the chase aircraft losing sight of the UAS was manageable. They simply issued an altitude clearance to separate the chase aircraft from the UAS and then directed both aircraft to the pre-established Lost Link Point at Mt. Diablo. However, the participants noted that they were not familiar with the correct phraseology to use in that situation, and some of the participants even forgot about the chase aircraft until the UAS pilot reported that the chase aircraft had lost sight of the UAS.

75
8. CONCLUSION
We designed the experiments presented here to identify and document issues associated with UAS inability to comply with visual compliance requirements. Each experiment showed that the integration of UAS operations into the NAS will likely have some effect on ATCS and the airspace they manage.
In Experiment One, we compared integrated UAS operations to all manned aircraft operations in the TRACON traffic pattern by having all aircraft on approach to OAK 30 execute multiple low approaches. When UAS were present, more aircraft flew through the Grove sector and aircraft spent more time and flew farther in the Mulford sector. When the participants worked the Mulford sector, they reported that UAS had a negative effect on their performance, lowered their efficiency, and increased their workload. The number and pace of communications also changed when UAS were present. The presence of UAS in the Mulford sector increased the number of ground-air communications and decreased the duration of air-ground and ground-air communications. When the participants worked the Grove sector, they reported lower overall situation awareness and lower situation awareness for detecting conflicts. The participants reported that the scenarios in both sectors were more difficult when UAS were present.
In Experiment Two, we examined the effect of missed approaches by a manned aircraft at HWD on integrated UAS versus all manned aircraft on the final approach to OAK 30. The presence of UAS resulted in the participants issuing more altitude and approach clearances and, again, the pace of ground-air communications changed, suggesting greater urgency. During the missed approach events, the participants’ time to respond to workload ratings at the Mulford sector increased when UAS were present. Workload rating response times are considered a secondary measure of workload, with longer times suggesting that workload was increasing even though that increase was not reflected in the ratings themselves. Workload rating response times were also longer throughout the entire scenario when the participants worked the Grove sector. The participants reported that the presence of UAS had a negative effect on their situation awareness and their ability to sequence aircraft in the Mulford sector. The participants also reported that the presence of UAS in the Grove sector had a negative impact on their situation awareness for detecting conflicts and aircraft separation and that the presence of UAS made the scenario more difficult.
In Experiment Three, we compared all manned aircraft operations to a low level of UAS integration and to a high level of UAS integration in the arrival stream to OAK 30. In the High UAS Integration condition at the Mulford sector, the participants handled more aircraft, the aircraft were in the sector longer and flew farther in the sector, and there were fewer full stop arrivals compared to the other two conditions. The presence of UAS increased the total number of ATCS commands issued and the number of heading commands issued in the High UAS Integration conditions compared to the other two conditions. The number of speed and approach commands was also higher whenever UAS were present. The presence of UAS in the High UAS Integration condition resulted in higher workload ratings and more communications. Ground-air and air-ground communications became shorter, again indicating an increased pace. The participants reported that the presence of UAS had a negative effect on their overall workload; in particular, the workload related to aircraft separation requirements.
The Exploratory scenario also revealed issues associated with UAS integration into the NAS. Although the Exploratory scenario was not experimentally controlled, it was clear from the participants’ ratings and feedback that training is required for UAS operations, especially when those operations are off-nominal. While the participants were able to adapt and manage the

76
situations that occurred in the Exploratory scenario, their feedback indicated that they would need more experience and training in UAS operations to become more confident and efficient in managing those situations.
Taken together, the results of the three experiments and the Exploratory scenario support a basic conclusion: The limitations posed by UAS—including increased separation standards, the inability to use visual separation, the inability to conduct visual approaches, and the inability to fly in IMC—all have the potential to affect NAS operations. Overall, a low volume of UAS operations in Class C airspace may be tenable and have relatively small effects on ATCS and the airspace. While UAS operations did not appear to affect safety, increasing levels of UAS operations may affect sector efficiency and ATCS communications and workload in Class C airspace sectors that are primarily responsible for managing arrivals. Until the FAA develops alternative technological or procedural solutions to address the inability of UAS to comply with visual procedures, integrated UAS operations are likely to affect ATCS workload and communications and airspace efficiency. However, ATCS’ negative perceptions of the impact that UAS may have on various aspects of their performance should be reduced, or subside, with adequate training as they become more familiar with UAS operations and their associated limitations.
9. RECOMMENDATIONS FOR FUTURE RESEARCH
The focus of the current research was to identify and document issues with UAS integration in the current NAS. As the FAA develops future technologies and procedures that reduce the current limitations of UAS visual compliance, research should examine those solutions to determine if they affect ATCS workload, communications, self-rated performance, and airspace safety and efficiency. Future research should consider other elements of the NAS as well as how those elements may affect UAS integration. For example, the current study did not consider the airport environment and how the ability of UAS to exit the runway may affect TRACON operations. If UAS are not able to exit the runway in a timely manner, then that performance characteristic must be considered for both ATCT and TRACON operations. In the study presented, we focused on Class C airspace and presented what may be considered as a worst-case scenario for UAS visual compliance issues. Our results suggest that the greatest impact of UAS integration will be in areas of congested airspace. Future research should consider other types of congested airspace so that the FAA can have a more complete understanding of the potential impacts that may accompany full UAS integration.

77
References
Cohen, J. (1988). Statistical power analysis for the behavioral sciences (2nd ed.). Hillsdale, NJ: Lawrence Erlbaum Associates, Inc.
Cohen, J. (1992). Statistics a power primer. Psychology Bulletin, 112, 155–159.
Dworsky, M., & Dorsey, H. (2013). Visual compliance literature review – Sense and Avoid (SAA) system certification obstacles, UAS-13-01 Task B [Whitepaper].
Federal Aviation Administration. (2012a). Air Traffic Organization Quality Assurance Program (FAA Order, JO 7210.633). Washington, DC: U.S. Department of Transportation, FAA.
Federal Aviation Administration. (2012b). 2010-CSA-69-COA-R Certificate of Waiver Authorization. Washington, DC: FAA, AJV-13.
Federal Aviation Administration. (2013a). Air traffic control (FAA Order, JO 7110.65U). Washington, DC: FAA.
Federal Aviation Administration. (2013b). Integration of civil Unmanned Aircraft Systems (UAS) in the National Airspace System (NAS) roadmap. Washington, DC: FAA.
Federal Aviation Administration. (2013c). Sense and Avoid (SAA) for Unmanned Aircraft Systems (UAS) second caucus workshop report. Washington, DC: FAA.
Federal Aviation Administration. (2013d). Unmanned aircraft operations in the National Airspace System (FAA Notice, N JO 7210.846). Washington, DC: FAA.
Federal Aviation Administration. (2013e). Unmanned Aircraft Systems (UAS) operational approval (FAA Notice, N JO 8900.207). Washington, DC: FAA.
Geisser, S., & Greenhouse, S. W. (1958). An extension of Box’s results on the use of the F distribution in multivariate analysis. Annals of Mathematical Statistics, 29, 885–891.
Government Accountability Office. (2008). Report to congressional requesters on unmanned aircraft systems: Federal actions needed to ensure safety and expand their potential uses within the National Airspace System (GAO- 08-511). Washington, DC: GAO.
Hart, S. G., & Staveland, L. E. (1988). Development of NASA-TLX (Task Load Index): Results of empirical and theoretical research. In P. A. Hancock and N. Meshkati (Eds.), Human Mental Workload. Amsterdam: North Holland Press.
Hays, W. L. (1988). Statistics (4th ed.). New York: Harcourt Brace Jovanovich College Publishers.
Huynh, H., & Feldt, L. S. (1970). Conditions under which mean square ratios in repeated measures designs have exact F distributions. Journal of the American Statistical Association, 65, 1582–1589.
Kirk, R. E. (1982). Experimental design: Procedures for the behavioral sciences (2nd ed.). Belmont, CA: Brooks-Cole.
Right-of-way rules: Except water operations, 14 C.F.R. § 91.113b (2014).
Rouanet, H., & Lepine, D. (1970). Comparisons between treatments in a repeated measurement design: ANOVA and multivariate methods. British Journal of Mathematics and Statistics for Psychology, 23, 147–163.
Stein, E. (1985). Air traffic controller workload: An examination of workload probe (DOT/FAA/CT-TN84/24). Atlantic City International Airport, NJ: Federal Aviation Administration Technical Center.

78
Acronyms
ACE-IDS ASOS Controller Equipment – Information Display System
ANOVA Analysis of Variance
AOB At or Below
ATC Air Traffic Control
ATCS Air Traffic Control Specialists
ATCT Airport Traffic Control Tower
BAB Beale Air Force Base
COA Certificate of Waiver or Authorization
CCR Buchanan Field
CFR Code of Federal Regulations
CPA Closest Point of Approach
CPC Certified Professional Controller
DESIREE Distributed Environment for Simulation, Rapid Engineering, and Experimentation
DRAT Data Reduction and Analysis Tool
DSA Detect, Sense, and Avoid
FAA Federal Aviation Administration
GA General Aviation
HITL Human-In-The-Loop
HWD Hayward Executive Airport
IFR Instrument Flight Rules
IMC Instrument Meteorological Conditions
LCD Liquid Crystal Display
LLP Lost-Link Loiter Point
LOS Losses of Separation
LVK Livermore Municipal Airport
MANOVA Multivariate Analysis of Variance
MSL Mean Sea Level
MVA Minimum Vectoring Altitude
NAS National Airspace System
NASA-TLX National Aeronautics and Space Administration-Task Load Index
NCT Northern California TRACON
NMAC Near Mid-Air Collision

79
NUQ Moffet Federal Airfield
OAK Oakland International Airport
PAO Palo Alto Airport
PEQ Post-Experimental Questionnaire
PSQ Post-Scenario Questionnaire
PTT Push-To-Talk
RDHFL Research Development and Human Factors Laboratory
RHV Reid-Hillview Airport
SAA Sense and Avoid
SFO San Francisco International Airport
SJC Norman Y. Mineta San Jose International Airport
SME Subject Matter Expert
SQL San Carlos Airport
STARS Standard Terminal Automation Replacement System
TCRG Technical Community Requirements Group
TCY Tracy Municipal Airport
TGF Target Generation Facility
TRACON Terminal Radar Approach Control
UAS Unmanned Aircraft Systems
VFR Visual Flight Rules
VMC Visual Meteorological Conditions
WAK Workload Assessment Keypad
WJHTC William J. Hughes Technical Center


Appendix A: Informed Consent Statement

A-1
Informed Consent Statement
I, ______________________________, understand that this study, entitled “Operational Assessment: UAS Visual Compliance” is sponsored by the Federal Aviation Administration and is being directed by Dr. Todd R. Truitt. Nature and Purpose: I have been recruited to volunteer as a participant in this project. The purpose of the study is to conduct a high-fidelity simulation to determine how Unmanned Aircraft Systems (UAS) integration may affect air traffic operations in Class C airspace. The results of the study will be used to identify future research and to inform air traffic control standards and procedures for integrating UAS into the National Airspace System. Experimental Procedures: Each participant will possess skills at a Terminal Radar Approach Control (TRACON) facility rated as Level 11 or 12. Because our simulated TRACON environment is similar to a configuration of Northern California TRACON (NCT), controllers from NCT may not participate to ensure valid results. All participants must have normal, or corrected to normal, vision. The participants will arrive at the William J. Hughes Technical Center in groups of two and will participate over 5 days. Each participant will complete TRACON tasks at two different sectors. The first day of the study will consist of a project briefing, equipment familiarization, UAS-related training, and practice scenarios. Practice scenarios will continue throughout the second day to ensure that participants are familiar with the airspace. Each scenario will last approximately 30-45 minutes. Data collection will begin on the third day and continue through the fourth day. The participants will complete data collection on the fifth day. We will run any make-up scenarios as needed on the fifth day and complete a final debriefing. The participants will work from about 8:30 AM to about 4:30 PM every day with a lunch break and at least two rest breaks. The participants will control TRACON traffic under various experimental conditions that include air traffic scenarios either with or without UAS operations. The participants will provide online ratings of subjective workload during each scenario. After each scenario, the participants will complete questionnaires to evaluate the impact of UAS operations on participant workload and performance. Subject Matter Experts and experimenters will observe and take notes during each scenario to further assess the UAS integration concepts. An automated data collection system will record system operations and generate a set of standard measures including safety, efficiency, and communications. The simulation will be audio-video recorded so researchers can derive objective measures and reexamine any important events. Discomfort and Risks: As a participant in this study, I understand that I will not be exposed to any intrusive measurement techniques. I understand that I will not be exposed to any foreseeable risks beyond what I usually experience in my every day job. Anonymity and Confidentiality: My participation in this study is strictly confidential. All information that I provide will be anonymous to the experimenters. I understand that a participant code will be attached to my data for research purposes. My name and identity will not be released in any reports. All data collected in the study will be used for

A-2
scientific purposes only and must be kept confidential by law. Laboratory personnel will not disclose or release any Personally Identifiable Information (PII) to any FAA personnel or elsewhere, or publish it in any report, except as may be required by statute. I understand that situations when PII may be disclosed are discussed in detail in FAA Order 1280.18 Protecting Personally Identifiable Information (PII). Benefits: I understand that I will be able to provide the researchers with valuable feedback and insight into the effects of UAS integration in Class C airspace. My data will help the FAA to establish the feasibility of these methods and procedures within such an environment. I understand that the only benefit to me is that I will be able to provide the researchers with valuable feedback and insight regarding UAS integration in the NAS. My data will help the FAA to identify the human factors issues with UAS integration and help inform FAA standards and procedures for UAS integration. Participant Responsibilities: I am aware that to participate in this study I must be a current Certified Professional Controller in the Terminal specialty. I will control traffic and answer any questions asked during the study to the best of my ability. I will not discuss the content of the experiment with other potential participants until the study is completed. Participant Assurances: I understand that my participation in this study is completely voluntary and I can withdraw at any time without penalty. I also understand that the researchers in this study may terminate my participation if they believe it is in my best interest. I understand that if new findings develop during the course of this research that may relate to my decision to continue participation, I will be informed. I have not given up any of my legal rights or released any individual or institution from liability for negligence. Dr. Truitt has adequately answered all the questions I have asked about this study, my participation, and the procedures involved. I understand that Dr. Truitt or another member of the research team will be available to answer any questions concerning procedures throughout this study. If I have questions about this study or need to report any adverse effects from the research procedures, I will contact Dr. Truitt at (609) 485-4351. Compensation and Injury: I agree to immediately report any injury or suspected adverse effect to Dr. Truitt. Local clinics and hospitals will provide any treatment, if necessary. I agree to provide, if requested, copies of all insurance and medical records arising from any such care for injuries/medical problems. Signature Lines: I have read this informed consent statement. I understand its contents, and I freely consent to participate in this study under the conditions described. I understand that, if I want to, I may have a copy of this form. Research Participant:________________________________________Date:__________ Investigator:_______________________________________________Date:__________ Witness:__________________________________________________Date:__________


Appendix B: Biographical Questionnaire

B-1
Biographical Questionnaire
Instructions:
This questionnaire is designed to obtain information about your background and experience as an Air Traffic
Control Specialist. Researchers will only use this information to describe the participants in this study as a
group. Your identity will remain anonymous.
Demographic Information and Experience
1. What is your gender? Male Female
2. What is your age? _____ years
3. How long have you worked as an ATCS (include FAA
developmental, CPC, and military experience)? _____ years _____ months
4. How long have you worked as a CPC for the FAA (include
Oceanic, En Route, TRACON, Tower)? _____ years _____ months
5. How long have you actively controlled traffic in a TRACON
facility? _____ years _____ months
6. How many of the past 12 months have you actively controlled
traffic in a TRACON facility? _____ months
7. How long have you controlled traffic using STARS? _____ years _____ months
8. Rate your current skill as a CPC. Not
Skilled
Extremely
Skilled
9. Rate your current level of stress. Not
Stressed
Extremely
Stressed
10. Rate your level of motivation to participate in this study. Not
Motivated
Extremely
Motivated
11. Do you have previous ATC experience with UAS at your
facility? Yes No
11a. On average, how many UAS operations do you handle per
month? _____ per month

B-2
11b. In your experience, how did UAS operations affect the ATC
services in your sector? Negative
Effect
|
None
Positive
Effect
Comments:
____________________________________________________________________________________
____________________________________________________________________________________
____________________________________________________________________________________
11c. Please list the types of UAS that you have worked in your sector.


Appendix C: Post-Scenario Questionnaire

C-1
Post-Scenario Questionnaire
Please answer the following questions based upon your experience in the scenario just completed.
Task Load Index - The Task Load Index rating scales represent a standard technique to make inferences about
user workload in any task. For our research purposes, the term “task” refers to controlling traffic in the
simulation.
1. Mental Demand – How much mental and perceptual activity
was required (e.g., thinking, deciding, calculating,
remembering, looking, searching, etc.)? Was the task easy or
demanding, simple or complex, exacting or forgiving?
Extremely
Low
Extremely
High
2. Physical Demand – How much physical activity was required
(e.g., pushing, pulling, turning, controlling, activating, etc.)?
Was the task easy or demanding, slow or brisk, slack or
strenuous, restful or laborious?
Extremely
Low
Extremely
High
3. Temporal Demand - How much time pressure did you feel
due to the rate or pace at which the tasks or task elements
occurred? Was the pace slow and leisurely or rapid and
frantic?
Extremely
Low
Extremely
High
4. Performance – How successful do you think you were in
accomplishing the goals of the task set by the experimenter (or
yourself)?
Very Poor Very Good
5. Effort – How hard did you have to work (mentally and
physically) to accomplish your level of performance?
Extremely
Low
Extremely
High
6. Frustration – How insecure, discouraged, irritated, stressed
and annoyed versus secure, gratified, content, relaxed and
complacent did you feel during the task?
Extremely
Low
Extremely
High

C-2
Performance
7. Rate your overall level of ATC performance during this scenario. Extremely
Low
Extremely
High
Comments:
____________________________________________________________________________________
____________________________________________________________________________________
____________________________________________________________________________________
8. Rate your performance for identifying aircraft conflicts during
this scenario. Extremely
Low
Extremely
High
Comments:
____________________________________________________________________________________
____________________________________________________________________________________
____________________________________________________________________________________
9. Rate your performance for separating aircraft efficiently during
this scenario. Extremely
Low
Extremely
High
Comments:
____________________________________________________________________________________
____________________________________________________________________________________
____________________________________________________________________________________

C-3
10. Rate your performance for sequencing aircraft during this
scenario. Extremely
Low
Extremely
High
Comments:
____________________________________________________________________________________
____________________________________________________________________________________
____________________________________________________________________________________
11. Rate the overall safety of operations during the scenario. Extremely
Low
Extremely
High
Comments:
____________________________________________________________________________________
____________________________________________________________________________________
____________________________________________________________________________________
12. Rate the overall efficiency of operations during the scenario. Extremely
Low
Extremely
High
Comments:
____________________________________________________________________________________
____________________________________________________________________________________
____________________________________________________________________________________
13. If there were UAS in the scenario you just completed, what effect
did UAS operations have on your overall performance? Negative
Effect
|
None
Positive
Effect
Comments:
____________________________________________________________________________________
____________________________________________________________________________________
____________________________________________________________________________________

C-4
Workload
14. Rate your overall workload during this scenario. Extremely
Low
Extremely
High
Comments:
____________________________________________________________________________________
____________________________________________________________________________________
____________________________________________________________________________________
15. Rate your workload due to coordination and communication
with other sectors during this scenario. Extremely
Low
Extremely
High
Comments:
____________________________________________________________________________________
____________________________________________________________________________________
____________________________________________________________________________________
16. Rate your workload due to controller-pilot communication
during this scenario. Extremely
Low
Extremely
High
Comments:
____________________________________________________________________________________
____________________________________________________________________________________
____________________________________________________________________________________

C-5
17. Rate your workload due to scanning for aircraft conflicts
during this scenario. Extremely
Low
Extremely
High
Comments:
____________________________________________________________________________________
____________________________________________________________________________________
____________________________________________________________________________________
18. Rate your workload due to aircraft separation requirements
during this scenario. Extremely
Low
Extremely
High
Comments:
____________________________________________________________________________________
____________________________________________________________________________________
____________________________________________________________________________________
19. If there were UAS in the scenario you just completed, what effect
did UAS operations have on your overall workload? Negative
Effect
|
None
Positive
Effect
Comments:
____________________________________________________________________________________
____________________________________________________________________________________
____________________________________________________________________________________

C-6
Situation Awareness
20. Rate your overall level of situation awareness during this
scenario. Extremely
Low
Extremely
High
Comments:
____________________________________________________________________________________
____________________________________________________________________________________
____________________________________________________________________________________
21. Rate your situation awareness for detecting aircraft conflicts
during this scenario. Extremely
Low
Extremely
High
Comments:
____________________________________________________________________________________
____________________________________________________________________________________
____________________________________________________________________________________
22. Rate your situation awareness for aircraft separation during
this scenario. Extremely
Low
Extremely
High
Comments:
____________________________________________________________________________________
____________________________________________________________________________________
____________________________________________________________________________________

C-7
23. If there were UAS in the scenario you just completed, what effect
did UAS operations have on your overall situation awareness? Negative
Effect
|
None
Positive
Effect
Comments:
____________________________________________________________________________________
____________________________________________________________________________________
____________________________________________________________________________________

C-8
Scenario Difficulty and Simulation Pilots
24. Rate the overall difficulty of the scenario. Extremely
Low
Extremely
High
Comments:
____________________________________________________________________________________
____________________________________________________________________________________
____________________________________________________________________________________
25. Rate the overall performance of the simulation pilots in terms
of their responding to control instructions, phraseology, and
providing readbacks.
Extremely
Low
Extremely
High
Comments:
____________________________________________________________________________________
____________________________________________________________________________________
____________________________________________________________________________________
26. Do you have any additional comments or clarifications about your experience during this scenario?
____________________________________________________________________________________
____________________________________________________________________________________
____________________________________________________________________________________
____________________________________________________________________________________
____________________________________________________________________________________


Appendix D: Post-Experiment Questionnaire

D-1
Post-Experiment Questionnaire
Instructions:
Please answer the following questions based upon your overall experience in the experiment you just completed.
Simulation Realism and Research Equipment
1. Rate the overall realism of the simulation experience compared
to actual ATC operations. Extremely
Unrealistic
Extremely
Realistic
Comments:
____________________________________________________________________________________
____________________________________________________________________________________
____________________________________________________________________________________
2. Rate the realism of the simulation hardware compared to actual
equipment. Extremely
Unrealistic
Extremely
Realistic
Comments:
____________________________________________________________________________________
____________________________________________________________________________________
____________________________________________________________________________________
3. Rate the realism of the simulation software compared to actual
functionality. Extremely
Unrealistic
Extremely
Realistic
Comments:
____________________________________________________________________________________
____________________________________________________________________________________
____________________________________________________________________________________

D-2
4. Rate the realism of the airspace compared to actual NAS airspace. Extremely
Unrealistic
Extremely
Realistic
Comments:
____________________________________________________________________________________
____________________________________________________________________________________
____________________________________________________________________________________
5. Rate the realism of the simulation traffic scenarios compared to
actual NAS traffic. Extremely
Unrealistic
Extremely
Realistic
Comments:
____________________________________________________________________________________
____________________________________________________________________________________
____________________________________________________________________________________
6. To what extent did the WAK online workload rating technique
interfere with your ATC performance?
Not At
All
A Great
Deal
Comments:
____________________________________________________________________________________
____________________________________________________________________________________
____________________________________________________________________________________

D-3
Effectiveness of Training
7. How effective was the airspace training? Extremely
Ineffective
Extremely
Effective
Comments:
____________________________________________________________________________________
____________________________________________________________________________________
____________________________________________________________________________________
8. How effective was the STARS training? If you did not receive
STARS training during this study, please respond “NA”. Extremely
Ineffective
Extremely
Effective
Comments:
____________________________________________________________________________________
____________________________________________________________________________________
____________________________________________________________________________________

D-4
Overall Effect of UAS Operations
9. In your opinion what effect would UAS operations have on Class
C Airspace? Negative
Effect
|
None
Positive
Effect
Comments:
____________________________________________________________________________________
____________________________________________________________________________________
____________________________________________________________________________________
10. What are the major challenges with integrating UAS operations in Class C Airspace?
____________________________________________________________________________________
____________________________________________________________________________________
____________________________________________________________________________________
____________________________________________________________________________________
____________________________________________________________________________________
____________________________________________________________________________________
____________________________________________________________________________________
____________________________________________________________________________________

D-5
11. What additional tools, requirements, or procedures are needed to integrate UAS operations in the NAS?
____________________________________________________________________________________
____________________________________________________________________________________
____________________________________________________________________________________
____________________________________________________________________________________
____________________________________________________________________________________
____________________________________________________________________________________
____________________________________________________________________________________
____________________________________________________________________________________
12. Do you have any additional comments regarding the experiment?
_________________________________________________________________________________
_________________________________________________________________________________
_________________________________________________________________________________
_________________________________________________________________________________
_________________________________________________________________________________

Appendix E: WAK Instructions

E-1
WAK Instructions
The full set of instructions will be read at the beginning of each test day. An abbreviated set of instructions will be read prior to each experimental run. The abbreviated instructions will omit the first paragraph below.
One purpose of this research is to obtain an accurate evaluation of controller workload. By workload, we mean all the physical and mental effort that you must exert to do your job. This includes maintaining the “picture,” planning, coordinating, decision making, communicating, and whatever else is required to maintain a safe and expeditious traffic flow. Workload is your perception of how hard you must work to perform all of the tasks necessary to meet these demands, not necessarily a measure of how much traffic you are working. Workload levels fluctuate. All controllers, no matter how proficient, will experience all levels of workload at one time or another. It does not detract from a controller’s professionalism when he indicates that he is working very hard at certain times or that he is hardly working at other times.
Every 4 minutes the WAK device, located at your position, will emit a brief tone and the 10 buttons will illuminate. The buttons will remain lit for 20 seconds. Please tell us what your workload is at that moment by pushing one of the buttons numbered from 1 to 10.
At the low end of the scale (1 or 2), your workload is low - you can accomplish everything easily. As the numbers increase, your workload is getting higher. The numbers 3, 4, and 5 represent increasing levels of moderate workload where the chance of error is still low but steadily increasing. The numbers 6, 7, and 8 reflect relatively high workload where there is some chance of making errors. At the high end of the scale are the numbers 9 and 10, which represent a very high workload, where it is likely that you will have to leave some tasks unfinished. Feel free to use the entire rating scale and tell us honestly how hard you are working at the instant that you are prompted. Do not sacrifice the safe and expeditious flow of traffic in order to respond to the WAK device.

Appendix F: Justification for Repeated Measures ANOVA Procedure

F-1
Justification for Repeated Measures ANOVA Procedure
Experimenters often use a repeated measures design to control, and thereby reduce, the error variability in the data due to differences between participants. Too much error variability may prevent the researcher from detecting significant effects of experimental conditions (treatments). However, we must consider some special statistical assumptions when analyzing data from a repeated measures design. In a repeated measures design, the experimenter has set up the conditions such that participants in certain parts of the experiment are more alike than participants in other parts of the experiment. For example, participants who have expertise in one technical specialty are more similar to one another than to participants in a different technical specialty. Therefore, given repeated measurements, there is a correlation between the scores of participants in the same group (e.g., similar technical specialty and area-specific knowledge). The correlation of scores among participants also results in dependencies among experimental conditions.
Researchers initially justified the use of the F test in a repeated measures design by assuming that the condition of compound symmetry exists across conditions or participants. However, for the condition of compound symmetry to be met, each treatment must have the same true variance over all conditions (pooled within-group), and the covariance (across participants) for each pair of treatments must be a constant. Although the assumption of compound symmetry is sufficient to justify the use of the F test2 in a repeated measures design, it is not a necessary condition. In fact, the compound symmetry assumption is very strict and not likely to hold true, especially in experiments using a repeated measures design. The compound symmetry assumption does not have to be met to justify use of the F test. Huynh and Feldt (1970) and Rouanet and Lepine (1970), among others, have shown that the circularity assumption (or sphericity assumption), which is both mathematically necessary and sufficient, can be made to support the use of the F test in repeated measures designs. The circularity assumption simply states that the components of the within-subjects model are orthogonal (independent) components. For more information on the assumptions associated with repeated measures designs, refer to Hays (1988) and Kirk (1982).
One way to ensure that the statistical assumptions associated with a repeated measures design are satisfied is to analyze the data by using the multivariate analysis of variance (MANOVA) method. In the MANOVA method, the different scores from each participant are handled as if they are actually scores from different variables. This method alleviates the necessity of the assumptions associated with the analysis of variance (ANOVA) F test. Significant MANOVA effects are then tested further by ANOVA F tests and particular post hoc comparisons. However, the MANOVA approach may not be feasible for small sample designs where degrees of freedom are insufficient.
Another way to analyze data from a repeated measures design while accounting for the circularity assumption is to implement a three-step testing method, as suggested by Hays (1988) and Kirk (1982). In this method, the data is first analyzed by an ANOVA. If the result is not significant, then the analysis stops—and the researcher must conclude that there is no effect of the independent variables in question. If the ANOVA is significant, then the Geisser-Greenhouse (G-G) F test (or conservative F test) is conducted (Geisser & Greenhouse, 1958).
2 The F test is justified (i.e., valid) when the reported F values adhere to the F distribution.

F-2
Essentially, the G-G F test adjusts the degrees of freedom used to calculate the F statistic to make the test more conservative (i.e., less likely to find a significant difference by chance, where none exists). The G-G F test ensures that the researcher is not capitalizing on chance or on violations of the circularity assumption. If the G-G F test is significant, then the result is highly significant. If the G-G F test is not significant, then the circularity assumption may have been violated and the Box adjustment —Huynh-Feldt [H-F] F test or adjusted F test—is calculated (Huynh & Feldt, 1970). If the H-F F test is computed, then that result is the final determinant regarding whether a significant effect is present or not. We will use this latter method for the present experiment. We will conduct multiple comparisons of means using Tukey’s Honestly Significant Difference (HSD) post hoc test. If a significant main effect or interaction of main effects is found, then the Tukey’s HSD post hoc test will be computed to explain the interaction for all relevant analyses.
We selected this three-step approach to minimize the probability of a Type II error (i.e., False acceptance of the null hypothesis, or finding no effect where one actually exists) while sacrificing an increase in the probability of a Type I error (i.e., False rejection of the null hypothesis, or finding an effect where none actually exists). We also will conduct a number of planned comparisons to examine conditions of interest more closely. Such an approach will increase the likelihood that the statistical analyses will detect effects caused by the experimental conditions. To balance this arguably liberal approach to data analysis, we will use the Tukey HSD to conduct post hoc tests, rather than calculating simple main effects.


Appendix G: Open-Ended Responses to the Post-Scenario Questionnaire

G-1
Note: Some questions were responded to even though no response was expected (e.g., Item 13 asked
about UAS if UAS were present, but no UAS were present in some conditions). These responses are
marked by italics. Also, any notation in brackets [] is provided by the authors, not the participants.
Experiment 1 – Multiple Approaches to KOAK 30
PSQ Item 7 – Rate your overall level of ATC performance in this scenario.
Mulford Sector
No UAS Integration
I did better than the previous UAS problem
Felt a step behind trying to familiarize
myself w/the airspace and ‘hot spots’ on a
Monday morning
Basic scenario, no problems
Integrated UAS
ASA 976 was on green tag – distraction
Didn’t expect the UAS to slow so much
inside the marker
I was quite mediocre
Ran minimal spacing to RWY30, speed
control was right on
Grove Sector
No UAS Integration
I believe I was on top of it. No tasks went
unfinished, and were completed in a timely
manner
Integrated UAS
Could have been more efficient
AMF I thought was going to RWY30 but was
really going to RWY28R

G-2
PSQ Item 8 - Rate your performance for identifying aircraft conflicts during this scenario.
Mulford Sector
No UAS Integration
Recognized them-however, couple too late
for comfort
Still not scanning that great, some of it is
due to lack of airspace knowledge of
Oakland area
Many targets under final close to airport
Integrated UAS
Am used to class Bravo where usually
aircraft that close to final are being worked
by ATC
Got to get the SJC dept Northbound out of
the way
More workload issuing traffic to UAS
Grove Sector
No UAS Integration
It was basic traffic scan nothing overbearing
Integrated UAS
Besides the one loss [?] it was good
PSQ Item 9 - Rate your performance for separating aircraft efficiently during this scenario.
Mulford Sector
No UAS Integration
Integrated UAS
Could have done a lot better
All had appropriate separation
Couple of separation loss, go-around a/c to
high
Grove Sector
No UAS Integration
Very simple once the habit was found
Integrated UAS

G-3
PSQ Item 10 - Rate your performance for sequencing aircraft during this scenario.
Mulford Sector
No UAS Integration
A bit too tight on 2 sets of UAS’ [?]
Waited until the appropriate time to
sequence the heavy UPS. I didn’t want them
to be in front of a small
Sequencing seemed obvious, conflicting
overflights not so much
Integrated UAS
About average
All weight classes were done properly and
maintained excellent efficiency
Grove Sector
No UAS Integration
Very simple
Integrated UAS
Communications issue, lost separation with
overflight and arrival
Changed a sequence late
Did well once I realized AMF was going to
the proper airport

G-4
PSQ Item 11 - Rate the overall safety of operations during this scenario.
Mulford Sector
No UAS Integration
Integrated UAS
Nobody would follow a heavy that close
Wake turbulence small behind a large was
quite an issue
UAs didn’t affect safety in this scenario
Grove Sector
No UAS Integration
At one time I had two tags overlap and
couldn’t see the altitudes. Also, I assigned
an aircraft 3,000 and they descended to
2,800 caught it and corrected it.
Multiple approaches complicated this
sector
Integrated UAS
Never thought safety was compromised

G-5
PSQ Item 12 - Rate the overall efficiency of operations during the scenario.
Mulford Sector
No UAS Integration
Put the heavy in the appropriate spot
Integrated UAS
Could have done better
The only reason this is not higher
[participant rating 6] is because the UAS
need one extra mile for chase plane
More experience with UAS= more efficiency
Grove Sector
No UAS Integration
Very efficient, felt like I gave the sector next
to me a good feed to final w/appropriate
speeds
Getting used to the flow
Integrated UAS
Grove sector- need to identify and
implement a good ‘flow’ to feed Mulford
sector when they have increased load of
acft
The efficiency was good, but could have
been regarding AMF

G-6
PSQ Item 13 - If there were UAS in the scenario you just completed, what effect did UAS operations
have on your overall performance?
Mulford Sector
No UAS Integration
A new operation (to me) with new rules.
The missed approach procedures and lack
of visual separation would complicate it.
Integrated UAS
UAS practice approaches?
They are not capable to see other aircraft
on approach which may require more than
one attempt
Inability to use all ATC tools – see and avoid
No #10?
Most of the VFR traffic was for the UAS
aircraft & since they cannot see that traffic
do you issue it or vector them away from
unknown or unverified? Also the way they
slowed down plus you need 4 miles in trail
at RY threshold with a UAS behind a large
Increased my attention to spacing &
sequencing
On the negative side but a reasonable
challenge in this scenario
Extra separation along with poor aircraft
performance makes you work harder for
sequence
Grove Sector
No UAS Integration
I wasn’t capped out on my ability to separate or
maintain an efficient flow of traffic [rating=5]
Integrated UAS
A lot of VFR aircraft we went in contact with
Minimal in Grove
They all came separated, and never had to turn
or adjust altitude for conflicts

G-7
PSQ Item 14 - Rate your overall workload during this scenario.
Mulford Sector
No UAS Integration
Sequencing and speed control to RWY30
Seemed heavy the first 10 minutes, then
manageable
Integrated UAS
If I knew the airspace it would be a lot less
Workload was high due to wake turbulence
and keeping the final reeled in, not wasting
space
Grove Sector
No UAS Integration
Integrated UAS
PSQ Item 15 - Rate your workload due to coordination and communication with other sectors during
this scenario.
Mulford Sector
No UAS Integration
Ask OAK tower once to see if they could
provide visual
Integrated UAS
Communication issues caused more
workload
Grove Sector
No UAS Integration
Not much coordination, didn’t feel
overworked
Integrated UAS

G-8
PSQ Item 16 - Rate your workload due to controller-pilot communication during this scenario.
Mulford Sector
No UAS Integration
One key call missed. I instructed a turn to
final and got no response. Recovered well
Integrated UAS
Probably shouldn’t call VFR traffic to the
UAS
Pilots were responsive. UAS require more
transmissions.
Grove Sector
No UAS Integration
Couple missed calls, nothing too bad
though. It happens like that in the field also.
Integrated UAS
No readback errors, etc.
PSQ Item 17 - Rate your workload due to scanning for aircraft conflicts during this scenario.
Mulford Sector
No UAS Integration
Too many TCAS possibilities
Integrated UAS
VFR target volume… and location
Same comment as #14 [if I knew the
airspace it would be a lot less]
Grove Sector
No UAS Integration
Always was able to look for traffic.
Integrated UAS

G-9
PSQ Item 18 - Rate your workload due to aircraft separation requirements during this scenario.
Mulford Sector
No UAS Integration
It helped being able to use visual separation
with the AMFs & Twin Beaches
Wake turbulence took quite a bit of my
mental capacity.
Integrated UAS
Extra mile for UAS
Grove Sector
No UAS Integration
Visual approach sector (Grove)
Integrated UAS
Knowing that UAS needed an extra mile I
was focused on that a great deal
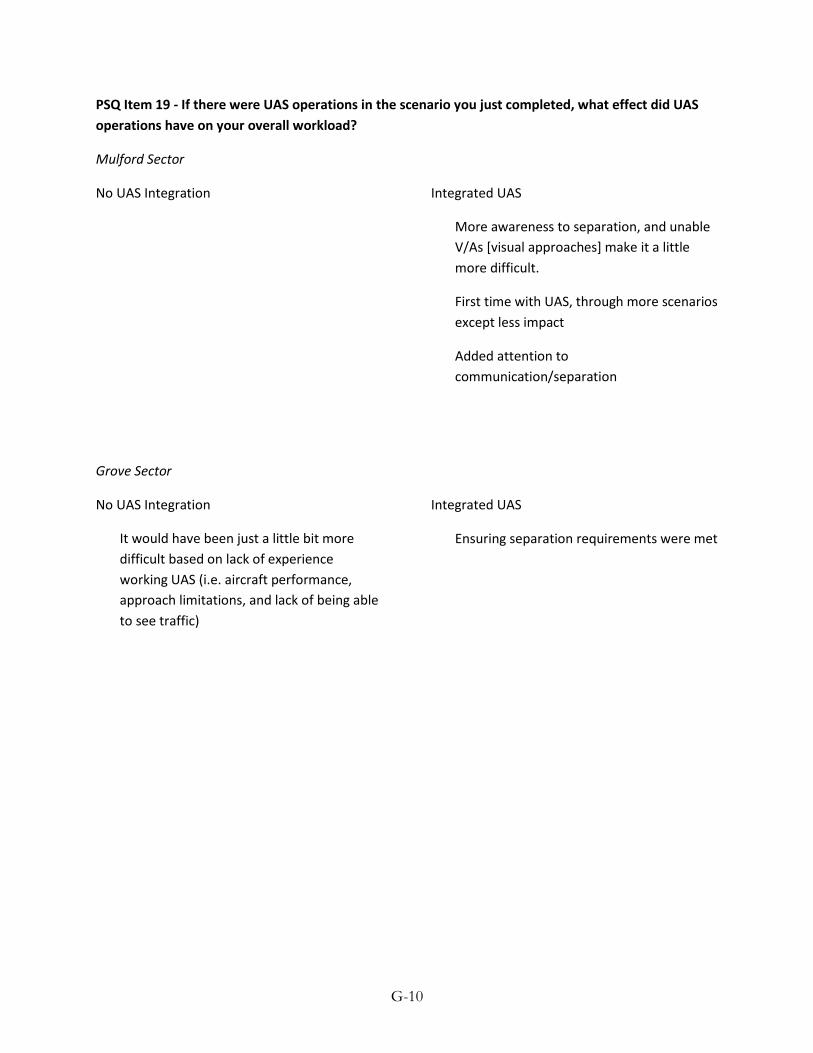
G-10
PSQ Item 19 - If there were UAS operations in the scenario you just completed, what effect did UAS
operations have on your overall workload?
Mulford Sector
No UAS Integration
Integrated UAS
More awareness to separation, and unable
V/As [visual approaches] make it a little
more difficult.
First time with UAS, through more scenarios
except less impact
Added attention to
communication/separation
Grove Sector
No UAS Integration
It would have been just a little bit more
difficult based on lack of experience
working UAS (i.e. aircraft performance,
approach limitations, and lack of being able
to see traffic)
Integrated UAS
Ensuring separation requirements were met

G-11
PSQ Item 20 - Rate your overall level of situation awareness during this scenario.
Mulford Sector
No UAS Integration
Ensuring turns to final and base turns are
accomplished on time.
Bad first 10 mins.
Integrated UAS
Grove Sector
No UAS Integration
Less during highest volume as far as
Mulford sector
Integrated UAS
Once again my only downfall was the AMF
RWY assignment
PSQ Item 21 - Rate your situation awareness for detecting aircraft conflicts during this scenario.
Mulford Sector
No UAS Integration
I feel there is always room for improvement
[rating=7]
Integrated UAS
UAS increased this [rating 9]
Can always be better [rating=7]
Grove Sector
No UAS Integration
I was not overtasked so this was pretty
easy.
Integrated UAS

G-12
PSQ Item 22 - Rate your situation awareness for aircraft separation during this scenario.
Mulford Sector
No UAS Integration
Ensuring wake turbulence separation was
being adhered to.
Integrated UAS
Same as 21 [‘UAS increased this’]
Grove Sector
No UAS Integration
Same as 21 [‘I was not overtasked so this
was pretty easy’]
Integrated UAS

G-13
PSQ Item 23 - If there were UAS in the scenario you just completed, what effect did UAS operations
have on your overall situation awareness?
Mulford Sector
No UAS Integration
I haven’t seen it yet, but I’m sure it would be
increased due to lack of experience
[participant provided a 4 rating]
Awareness may be the same but scan may
slow down
Integrated UAS
I felt I had to put a little more thinking into
the UASs.
They complicated matters a lot
Had to watch closer
Again, extra attention
Grove Sector
No UAS Integration
The reason it is not none is just due to
unfamiliarity of working UAS [rating=6]
Integrated UAS
Just trying to get a feel for how the UAS
flew and what speeds they could do
One situation where I could have set a
better sequence for the next sector if visual
separation was available
G-14
PSQ Item 24 - Rate the overall difficulty of the scenario.
Mulford Sector
No UAS Integration
Integrated UAS
Speed difference, VFR conflicts, extra miles
in trail/wake turbulence
New item UAS separation and aircraft
performance
Grove Sector
No UAS Integration
Easy
Integrated UAS
PSQ Item 25 - Rate the overall performance of the simulation pilots in terms of their responding to
control instructions, phraseology, and providing readbacks.
Mulford Sector
No UAS Integration
No key missed call, didn’t affect safety, just
efficiency.
Some bad readbacks on approach
clearances
Integrated UAS
Only 1 or 2 missed calls
They did a better job than I did!
No issues
Grove Sector
No UAS Integration
One loss comm ACFT
They performed well with no incorrect
turns, etc.
Not bad, couple mistakes nothing that
would have compromised the scenario
Integrated UAS

G-15
PSQ Item 26 – Do you have any additional comments or clarifications about your experience during
this scenario?
Mulford Sector
No UAS Integration
Think I was a little tired/lazy on this
problem because of focusing [?] on the
previous one
This problem/scenario was much easier for
me to work than the preceding UAS
problem. Some of that may have been due
to first thing Monday morning.
Request for multiple approaches was
simplified because they didn’t come directly
back to me from the tower
Integrated UAS
Reference #24 and #25 above [ratings=6
and 9]. Poor pilot response and more
complexity could make it messy
Grove Sector
No UAS Integration
Better coordination needs to happen
between pilots on frequency changes to
raise the level of realism
Integrated UAS
Communication issues were the only issue
Aircraft speeds on final approach are erratic
and inconsistent
Being the first scenario with UAS acft, the
scenario posed the challenge of ‘placement’
of said acft in a position to provide the most
efficient feed to final, AKA Mulford
Had 1 A/C drop off radar scope N184DA

G-16
Experiment 2 –Missed Approaches at KHWD
PSQ Item 7 – Rate your overall level of ATC performance in this scenario.
Mulford Sector
No UAS Integration
Let comm issues affect me
It was ok could have been better
Many similar call signs and missed appchs
and pilot readbacks
Integrated UAS
Better than last because I had experienced
missed approaches previously
Grove Sector
No UAS Integration
I saw Mulford getting overwhelmed so I
slow and vectored aircraft away.
Integrated UAS
I forgot the UAS were in flight and was
using 3 mi.
No issues, helped where I could.
PSQ Item 8 - Rate your performance for identifying aircraft conflicts during this scenario.
Mulford Sector
No UAS Integration
Integrated UAS
HWD missed app w/aircraft on app to OAK
RWY30
Grove Sector
No UAS Integration
Integrated UAS
Knew I had to climb the missed app off of
HWD to 5,000.

G-17
PSQ Item 9 - Rate your performance for separating aircraft efficiently during this scenario.
Mulford Sector
No UAS Integration
Missed an MVA to the east
Integrated UAS
Pulled a Berry out for resequencing
Grove Sector
No UAS Integration
Integrated UAS
More comfortable with airspace and traffic
flows
PSQ Item 10 - Rate your performance for sequencing aircraft during this scenario.
Mulford Sector
No UAS Integration
A bit too tight on 2 sets of UAS’ [?]
Could have been better, JBU [Jet Blue] on
the VA didn’t work
w/exception of one acft that was vectored
to wrong localizer by bully controller [joke]
Integrated UAS
Not sure if could have been done better.
There were two instances where I lost
separation on a pair of Berry inside tower
airspace
Grove Sector
No UAS Integration
Assigned AMF 28L at OAK to ensure they
didn’t get delayed due to slower GA aircraft
landing 28R at OAK.
Took back a hand-off flash, spun the R30
arrival on downwind and flashed again due
to volume
Integrated UAS
Moved one to 28L and worked out well.

G-18
PSQ Item 11 - Rate the overall safety of operations during this scenario.
Mulford Sector
No UAS Integration
Integrated UAS
However, loss of sep between a PA31 &
BE99 (2.5 mi + 200’!)
Would have been higher if the pilots were
on their game [rating 7]
Grove Sector
No UAS Integration
Integrated UAS
PSQ Item 12 - Rate the overall efficiency of operations during the scenario.
Mulford Sector
No UAS Integration
I felt behind with this volume to work it
efficiently
Integrated UAS
Same comment as 11 [‘would have been
higher if the pilots were on their game’]
Final was too long on a couple occasions.
Playing it safe with the UAS
Grove Sector
No UAS Integration
Integrated UAS

G-19
PSQ Item 13 - If there were UAS in the scenario you just completed, what effect did UAS operations
have on your overall performance?
Mulford Sector
No UAS Integration
Concentrating so much on what I had, not
sure if I could have handles any UAS
Integrated UAS
A lot of extra thinking with the number of
them
See above [‘Final was too long on a couple
occasions. Playing it safe with the UAS’]
Overrunning a slow A/C on Loc/DME [?] 28L
HWD
The inability to get visual separation by a
UAS increased workload/complexity
Grove Sector
No UAS Integration
Integrated UAS
Didn’t affect my sector.
PSQ Item 14 - Rate your overall workload during this scenario.
Mulford Sector
No UAS Integration
Integrated UAS
Working very hard to massage the final
Grove Sector
No UAS Integration
Integrated UAS
Worked a little harder by taking the missed
app from Mulford.

G-20
PSQ Item 15 - Rate your workload due to coordination and communication with other sectors during
this scenario.
Mulford Sector
No UAS Integration
I do not understand why I have to ‘hand off’
an aircraft, that has either HWD or OAK in
its data block, to the tower where it is
landing. This seems like unnecessary &
extra coordination! This maybe the way
they do it at NCT but it is something I have
never had to do. If a tower has a Bvite [?]
then why do you have to hand them off
also? I can understand calling in inbounds
to towers without a Bvite [?], but this is
basically what we are doing to HWD & OAK
towers.
HWD tower missed approach
Integrated UAS
Had to coordinate two go-arounds off HWD
Grove Sector
No UAS Integration
Integrated UAS

G-21
PSQ Item 16 - Rate your workload due to controller-pilot communication during this scenario.
Mulford Sector
No UAS Integration
Repeating instructions and traffic calls
Some pilot responses were slow which
affected my workload
Integrated UAS
A lot of missed calls!
Grove Sector
No UAS Integration
Integrated UAS
Slow responses from pilots
PSQ Item 17 - Rate your workload due to scanning for aircraft conflicts during this scenario.
Mulford Sector
No UAS Integration
So many airplanes so little room
Integrated UAS
Normal scan
Grove Sector
No UAS Integration
Integrated UAS

G-22
PSQ Item 18 - Rate your workload due to aircraft separation requirements during this scenario.
Mulford Sector
No UAS Integration
I should have used more visual separation
Integrated UAS
Grove Sector
No UAS Integration
Integrated UAS
PSQ Item 19 - If there were UAS operations in the scenario you just completed, what effect did UAS
operations have on your overall workload?
Mulford Sector
No UAS Integration
So much going on probably would have had
sectors around me spin aircraft if any UAS
Integrated UAS
Ensuring they had an extra mile was very
hard considering how many UAS there were
More special handling
Grove Sector
No UAS Integration
Integrated UAS
Just some minor sequencing & speed
control.
G-23
PSQ Item 20 - Rate your overall level of situation awareness during this scenario.
Mulford Sector
No UAS Integration
Had to be with the level of traffic [rating 10]
Integrated UAS
Grove Sector
No UAS Integration
Integrated UAS
Once again my only downfall was the AMF
RWY assignment
PSQ Item 21 - Rate your situation awareness for detecting aircraft conflicts during this scenario.
Mulford Sector
No UAS Integration
Hard to stay on top of the picture
Integrated UAS
Grove Sector
No UAS Integration
Integrated UAS
PSQ Item 22 - Rate your situation awareness for aircraft separation during this scenario.
Mulford Sector
No UAS Integration
Integrated UAS
Grove Sector
No UAS Integration
Integrated UAS
High for my sector but I was busy enough at
times I couldn’t watch out for Mulford

G-24
PSQ Item 23 - If there were UAS in the scenario you just completed, what effect did UAS operations
have on your overall situation awareness?
Mulford Sector
No UAS Integration
Extremely heavy workload which led to
higher situational awareness
Integrated UAS
It made me more attentive
Grove Sector
No UAS Integration
Integrated UAS
More attention needed mostly due to new
rules to apply
PSQ Item 24 - Rate the overall difficulty of the scenario.
Mulford Sector
No UAS Integration
Integrated UAS
It wasn’t that difficult, what made it difficult
was missed calls by the pilots
Grove Sector
No UAS Integration
Integrated UAS
Only because I took the missed app from
HWD. If I didn’t do that it would have been
a 1. [rating 4]

G-25
PSQ Item 25 - Rate the overall performance of the simulation pilots in terms of their responding to
control instructions, phraseology, and providing readbacks.
Mulford Sector
No UAS Integration
Repeating instructions and traffic calls with
no response
Integrated UAS
Stuck comm, couple wrong turns
Last run of day
Quite a few missed calls at key times such
as turn to finals, and turns for VFR’s away
from traffic
Grove Sector
No UAS Integration
Integrated UAS
On the lower side but Grove was not so
busy that it had a big effect
PSQ Item 26 – Do you have any additional comments or clarifications about your experience during
this scenario?
Mulford Sector
No UAS Integration
If UAS efficiency would have been
compromised
Integrated UAS
Question #6 ‘insecure’ does not fit the
other adjectives used to describe
‘frustration’.
Grove Sector
No UAS Integration
This scenario for Grove was very slow
required very little controller ability. With
such a low workload I could help Mulford
out watching their traffic and realizing they
didn’t need another airplane so I was able
to delay (2) aircraft by vectoring and
slowing.
Integrated UAS

G-26
Experiment 3 –Arrival Stream with VFR Crossing Traffic
PSQ Item 7 – Rate your overall level of ATC performance in this scenario.
Mulford Sector
No UAS Integration
Had a deal , other than
that it was good
Basic VFR day. Followed
aircraft visually.
Low UAS Integration
Did well, could have
tightened a couple up on
final.
No unusual
situations/manageable
traffic
High UAS Integration
Had to break an aircraft
due to UAS
Grove Sector
No UAS Integration
Was able to help the
sector next to me while
still maintaining the flow
to RWY28R
Low UAS Integration
Problem got away from
me. Stopped taking
handoffs for a period
High UAS Integration
Right up to the edge with
28R/28L arrivals at one
point

G-27
PSQ Item 8 – Rate your performance for identifying aircraft conflicts during this scenario.
Mulford Sector
No UAS Integration
Not overworked.
I feel I failed to recognize
and resolve the
sequence to R30 on the
eastern limits of Mulford
sector
Low UAS Integration
It wasn’t overly busy, so
this task was pretty easy.
High UAS Integration
Grove Sector
No UAS Integration
Low UAS Integration
High UAS Integration
High volume -> less
performance
PSQ Item 9 – Rate your performance for separating aircraft efficiently during this scenario.
Mulford Sector
No UAS Integration
Low UAS Integration
Same comment as 8 [‘It
wasn’t overly busy, so
this task was pretty
easy’]
High UAS Integration
Grove Sector
No UAS Integration
Low UAS Integration
High UAS Integration

G-28
PSQ Item 10 – Rate your performance for sequencing aircraft during this scenario.
Mulford Sector
No UAS Integration
See above [‘I feel I failed
to recognize and resolve
the sequence to R30 on
the eastern limits of
Mulford sector’]
Low UAS Integration
High UAS Integration
Right sequence made,
bad turns by me.
Grove Sector
No UAS Integration
Low UAS Integration
High UAS Integration
With a little speed
control, it worked fine
PSQ Item 11 – Rate the overall safety of operations during this scenario.
Mulford Sector
No UAS Integration
Low UAS Integration
Everyone was separated.
A couple times was too
busy to call VFR traffic to
IFR airplanes.
High UAS Integration
Grove Sector
No UAS Integration
Safety was ensured but
got in a pinch when I
could only use 3 altitudes
in such a limited space
Low UAS Integration
High UAS Integration

G-29
PSQ Item 12 – Rate the overall efficiency of operations during this scenario.
Mulford Sector
No UAS Integration
I know I demonstrated
little skill at efficiency in
this scenario
Low UAS Integration
High UAS Integration
Reason for the lower
number due to breakout
[rating=6]
Grove Sector
No UAS Integration
Low UAS Integration
I took a couple 30
landers and changed
them to 28R to get them
to the airport quicker.
High UAS Integration
Might have taken a
couple of aircraft to 28L
to increase efficiency

G-30
PSQ Item 13 – If there were UAS in the scenario you just completed, what effect did UAS operations
have on your overall performance?.
Mulford Sector
No UAS Integration
For obvious reasons
[rating=1; participant did
not feel he did well in the
scenario]
Due to the inability to
use the follow technique,
so I would have to been
more cautious.
Low UAS Integration
Speed inside the FAF is
very low which requires
significant space behind
The extra spacing makes
it hard
They need more room
than I’m used to on final
for compression.
Not able to use visual
separation with UAS
increases workload and
complexity
High UAS Integration
Way too many UASs for a
normal airport
Too slow on final inside
marker
Due to having to add 1
extra mile for formation
flight! [gave 1 rating]
So much more thinking
and separation
standards.
Too many UAS to run
problem effectively
without excessive speed
control
Grove Sector
No UAS Integration
Traffic complexity was
high and UAS would have
made more difficult
Low UAS Integration
High UAS Integration
Basically assigned them
all a heading and a speed

G-31
PSQ Item 14 – Rate your overall workload during this scenario.
Mulford Sector
No UAS Integration
Acft cleared but not
descending to airport
Low UAS Integration
Did well, could have
tightened a couple up on
final.
No unusual
situations/manageable
traffic
High UAS Integration
Grove Sector
No UAS Integration
A lot of tasks to
complete in a short
period of time.
Low UAS Integration
High UAS Integration
Very basic
problem/scenario
Again, on edge for a time

G-32
PSQ Item 15 – Rate your workload due to coordination and communication with other sectors during
this scenario.
Mulford Sector
No UAS Integration
Low UAS Integration
High UAS Integration
Many acft came off their
final, turned into other
TFC
Min 3 afct not following
procedure after
readback
Grove Sector
No UAS Integration
Low UAS Integration
One handoff called for
from North
High UAS Integration

G-33
PSQ Item 16 – Rate your workload due to controller-pilot communication during this scenario.
Mulford Sector
No UAS Integration
Low UAS Integration
High UAS Integration
I believe extra talking
due to a couple of bad
entries or keyboard
problem
Grove Sector
No UAS Integration
Low UAS Integration
Similar call signs.
Readback/hearback
High UAS Integration
Slow or incorrect
readbacks
PSQ Item 17 – Rate your workload due to scanning for aircraft conflicts during this scenario.
Mulford Sector
No UAS Integration
Low UAS Integration
High UAS Integration
Grove Sector
No UAS Integration
With limitations on
airspace and altitude
available, this took most
of my attention
Low UAS Integration
High UAS Integration

G-34
PSQ Item 18 – Rate your workload due to aircraft separation requirements during this scenario.
Mulford Sector
No UAS Integration
Low UAS Integration
The extra mile for UAS
aircraft
The UAS adds to this,
especially the way they
perform.
Manageable flow
High UAS Integration
Harder with UAS rules
Several separation/speed
adjustments due to slow
UAE’s
Increased separation for
UAS
Grove Sector
No UAS Integration
Low UAS Integration
Using 28L as an out is not
always best
High UAS Integration
They all came to me
separated and just
maintained it

G-35
PSQ Item 19 – If there were UAS in the scenario you just completed, what effects did UAS operations
have on your overall workload?
Mulford Sector
No UAS Integration
A lot extra thinking a
creating larger gaps to fit
UAS aircraft
Low UAS Integration
More space on approach
A great amount of your
time is used watching
and analyzing this due to
the unknown
Use of speed control
early with all A/C when
UAS’ are present due to
compression with the
FAF
High UAS Integration
Once again too many at
the same time
Extra space on approach
Slow on final inside
marker
With the extra mileage
requirements increased
my workload
tremendously.
Above [‘Harder with UAS
rules’]
Grove Sector
No UAS Integration
That airspace wasn’t big
enough to allow more
aircraft in it
Low UAS Integration
I’m feeling more
comfortable with these
aircraft
High UAS Integration

G-36
PSQ Item 20 – Rate your overall level of situation awareness during this scenario.
Mulford Sector
No UAS Integration
Unable to make an
effective plan
Low UAS Integration
UAS adds to this
High UAS Integration
Grove Sector
No UAS Integration
Low UAS Integration
High UAS Integration
PSQ Item 21 – Rate your situation awareness for detecting aircraft conflicts during this scenario.
Mulford Sector
No UAS Integration
Low UAS Integration
Same as 20 [‘UAS adds to
this’]
High UAS Integration
Grove Sector
No UAS Integration
Low UAS Integration
Lower due to volume
High UAS Integration

G-37
PSQ Item 22 – Rate your situation awareness for aircraft separation during this scenario.
Mulford Sector
No UAS Integration
Low UAS Integration
Same as 20 [‘UAS adds to
this’]
High UAS Integration
Grove Sector
No UAS Integration
Low UAS Integration
High UAS Integration
PSQ Item 23 – If there were UAS present in this scenario, what effect did UAS operations have on your
overall situation awareness?
Mulford Sector
No UAS Integration
Would have had to work
mentally harder
Low UAS Integration
Had to be more aware of
speed and spacing
further out from airport
to accommodate slowing
of UAS’
High UAS Integration
Situational awareness
increased due to UAS
Had to pay more
attention
Was more aware of
speeds and slowing
manned A/C early to
compensate for slow
UAEs
Grove Sector
No UAS Integration
Low UAS Integration
High UAS Integration

G-38
PSQ Item 24 – Rate the overall difficulty of the scenario.
Mulford Sector
No UAS Integration
Low UAS Integration
It would have been
about a 4 if there were
no UAS [rated 8]
High UAS Integration
Scenario busy; but add 3
afct problems, etc, you
would classify 9-10.
Due to number of
aircraft & UAS
[rating=10]
Grove Sector
No UAS Integration
That was challenging for
about 20 minutes
Low UAS Integration
I added a couple aircraft
to 28R so it increased the
difficulty a little
[rating=5]
High UAS Integration

G-39
PSQ Item 25 – Rate the overall performance of the simulation pilots in terms of their responding to
control instructions, phraseology, and providing readbacks.
Mulford Sector
No UAS Integration
Acft not descending to
airport after being
cleared…
Low UAS Integration
Much better
High UAS Integration
A couple miscomms can
lead to a lot more work
on both ends
Grove Sector
No UAS Integration
Excellent job keeping up!
Inputting wrong
instructions, not
checking on
Good sob
Low UAS Integration
Much better
Real world, at times
High UAS Integration
No response, turning
wrong aircraft, not
checking on

G-40
PSQ Item 26 – Do you have any additional comments or clarifications about your experience during
this scenario?
Mulford Sector
No UAS Integration
Basic final problem
Low UAS Integration
VFR targets inside FAF?
Should be a sterile final
for UAS
High UAS Integration
Maybe speeds on aircraft
can be a little more
realistic
Entirely too many
aircraft on 30 final with
increased UAS
separation and the lack
of visual separation
Grove Sector
No UAS Integration
Low UAS Integration
With the amount of VFR
traffic, causing alarms to
go off continuously is
very distracting
High UAS Integration
Cat 1 small aircraft slow
too much inside the
marker
Two C208’s on final
should be almost 0
compression
For the Grove sector it
was a pretty basic
problem with like type
aircraft going to OAK
RWY28R. Not hard at all

G-41
Exploratory Scenario
PSQ Item 7 – Rate your overall level of ATC performance in this scenario.
Mulford Sector
None
Grove Sector
Very simple scenario. I have found that having UAS as overflights adds very little workload.
It can always go smoother I feel
PSQ Item 8 – Rate your performance for identifying aircraft conflicts during this scenario.
Mulford Sector
Got caught with the 50 and 60 crossing RY30 arrival path at same time and spun an arrival
Grove Sector
None
PSQ Item 9 – Rate your performance for separating aircraft efficiently during this scenario.
Mulford Sector
None
Grove Sector
1 UAS below MVA
PSQ Item 10 – Rate your performance for sequencing aircraft during this scenario.
Mulford Sector
None
Grove Sector
None

G-42
PSQ Item 11 – Rate the overall safety of operations during this scenario.
Mulford Sector
Questions about UAS VFR-IFR, IFR-VFR
Grove Sector
Would have been higher if pilots were on their game [rating=8]
Lost comm took a lot of time
PSQ Item 12 – Rate the overall efficiency of operations during this scenario.
Mulford Sector
None
Grove Sector
None
PSQ Item 13 – If there were UAS in the scenario you just completed, what effect did UAS operations
have on your overall performance?.
Mulford Sector
Chase aircraft didn’t take vectors to reacquire UAS
Questions as stated in #11 [‘Questions about UAS VFR-IFR, IFR-VFR’]
With one of two UAS and this amount of traffic it was very routine
UAS unable to fly through cloud created more workload, i.e. slowing two subsequent manned A/C. UAS requesting to go to hold point created much more coordination. UAS calling for IFR pickup unable to maintain own terrain & obstruction avoidance created more workload/coordination
Lack of procedures and knowledge of UAS operations added to workload in dealing w/
IMC/UMC issues
Grove Sector
I used 3 laterally but needed 4
Slow climb rate of UAS’ required extra attention

G-43
PSQ Item 14 – Rate your overall workload during this scenario.
Mulford Sector
UAS, chase operations
More manageable than some
Grove Sector
The only reason it’s this high was due to the pilots
PSQ Item 15 – Rate your workload due to coordination and communication with other sectors during
this scenario.
Mulford Sector
None
Grove Sector
More calls to North
PSQ Item 16 – Rate your workload due to controller-pilot communication during this scenario.
Mulford Sector
None
Grove Sector
Many times there was no/slow response
PSQ Item 17 – Rate your workload due to scanning for aircraft conflicts during this scenario.
Mulford Sector
None
Grove Sector
Conflicts with IFR’s climbing out against arrivals

G-44
PSQ Item 18 – Rate your workload due to aircraft separation requirements during this scenario.
Mulford Sector
None
Grove Sector
None
PSQ Item 19 – If there were UAS in the scenario you just completed, what effects did UAS operations
have on your overall workload?
Mulford Sector
Same as comment 13 [‘With one of two UAS and this amount of traffic it was very routine’]
Not too hard with this amount of traffic
Increased coordination/communications
Grove Sector
UAS’ required more than usual coordination and keypad entries
PSQ Item 20 – Rate your overall level of situation awareness during this scenario.
Mulford Sector
None
Grove Sector
None
PSQ Item 21 – Rate your situation awareness for detecting aircraft conflicts during this scenario.
Mulford Sector
None
Grove Sector
None

G-45
PSQ Item 22 – Rate your situation awareness for aircraft separation during this scenario.
Mulford Sector
None
Grove Sector
None
PSQ Item 23 – If there were UAS present in this scenario, what effect did UAS operations have on your
overall situation awareness?
Mulford Sector
Inability to turn in clouds, UAS on its own?
Minimal effect
Same as comment 13 [‘With one of two UAS and this amount of traffic it was very routine’]
Grove Sector
UAS activity demanded a more vigilant scan
PSQ Item 24 – Rate the overall difficulty of the scenario.
Mulford Sector
Most of the difficulty arose due to NORDO/loss communications with aircraft or aircraft being
on wrong frequency.
Grove Sector
None
PSQ Item 25 – Rate the overall performance of the simulation pilots in terms of their responding to
control instructions, phraseology, and providing readbacks.
Mulford Sector
A lot of two/three attempts to comm
Grove Sector
One of the pilots didn’t respond to many of my first calls. By the time I had to call a third time I
was getting pretty upset.

G-46
PSQ Item 26 – Do you have any additional comments or clarifications about your experience during
this scenario?
Mulford Sector
I don’t know if this was supposed to be a NORDO problem but that’s what it seemed like to me!
Grove Sector
Climb rates of UAS’ could cause problems with meeting MVA requirement and anticipating ‘topping’ other A/C on route of flight
Chase 11 dropped off radar as Berry 93 entered lost link holding
also lost comm with Chase 11


Appendix H: Open-Ended Responses to the Post-Experiment Questionnaire

H-1
PEQ Item 1 - Rate the overall realism of the simulation experience compared to actual ATC operations.
As we stated the speeds of the aircraft are a little off.
UAS too slow, several aircraft descent rates.
Aircraft slow too much, too quickly, and too soon inside the marker. Between two like type
small aircraft there should be no more than .5 mile of compression.
Turn rates, climb rates are not consistent with actual aircraft (some, not all aircraft).
It compares with other simulated environments in the field.
Procedures for the big picture weren’t there.
It would have been a 10 if the compression between manned aircraft was more realistic. Being
from a level 12 facility if those manned aircraft would have slowed down that much, they would
have been broken out and sent somewhere to hold until the end of the push.
While actual ATC radios are usually referred to as “sucks” and you had/have a lot of hear back
read back errors those are usually with 120kt aircraft not 200-250kt planes.
Due to “glitches” in the transfer co communications, you often had delayed “check-ins” that
often were critical during a busy portion of the scenario. *Having experienced pilots operate
the remote was great!
PEQ Item 2 - Rate the realism of the simulation hardware compared to actual equipment.
Not user friendly.
OK.
Same equipment same layout.
Most functions are similar and available.
Very realistic other than the call lines for North, South, OAK, and HWD.
Similar.
Minimal/basic, but adequate to perform tasks.
PEQ Item 3 - Rate the realism of the simulation software compared to actual functionality.
Overall pretty good.
Same as 1 [UAS too slow, several aircraft descent rates].
Besides aircraft inside the marker, they turn too quickly when going fast. Turn rate is not much
different when doing 230 kts or 170 kts.
Most functions are similar and available.
Again, minimal. Would like to be able to add a few more “scratchpad” functions. For instance,
being able to identify a temporary altitude would erase the necessity to coordinate the same
with adjacent positions, etc. “V30” indicate “visual to follow”, ILS 30 would be I30 – other
examples.

H-2
PEQ Item 4 - Rate the realism of the airspace compared to actual NAS airspace.
Based on training the airspace is very tight and this exercise proved that.
Airspace seems confined, but I’m used to it at A90.
Probably would have been more realistic with some shelving of the airspace.
It was simplified for us.
Depiction of airspace boundaries, finals, MVAs all good. The altitudes in MVA(s) often not to
scale and a bit sloppy.
PEQ Item 5 - Rate the realism of the simulation traffic scenarios compared to actual NAS traffic.
Having that many UASs to a major airline runway would not be best.
Traffic climb and descent rates unrealistic, some airspeeds, when aircraft slows to 190 – then
cleared a couple aircraft sped up unrealistically to airport.
Less VFR conflictions in real world even on beautiful VFR busy days.
Some of the VFR targets wouldn’t happen if climbing out of HWD on the OAK30 LOC outbound.
Traffic levels seemed unrealistic, amount of traffic with lack of spacing from adjacent sectors.
Amount of overflights/VFR conflicts seemed unrealistic.
Too many VFR targets flying through final.
Other than the unrealistic slowdowns inside the FAF, it was very realistic.
It is hard to believe that there would be that many VFR aircraft that close to a major airport not
talking to ATC!
Because of the “unknown” of UAS dev., I cannot fully determine its accuracy.
PEQ Item 6 - To what extent did the WAK online workload rating technique interfere with you ATC
performance?
Loss of concentration on traffic situations.
Little distraction if any.
PEQ Item 7 - How effective was the airspace training?
Good job.
Slower problem to start would help to get used to airspace.
Good pre-brief on airspace.
Almost overkill, but effective.
Airspace training was simply watching slides – more effective to sit at scope and learn.
Quick and superficial.
I do not understand the benefit of keeping it a secret that we would simulate OAK Approach.
Could have saved an hour or two on the first day. 99% of the approach controllers know the
altitudes and fixes of the main approaches to the major airports that they control.

H-3
The training was adequate, but would maybe like a copy of the airspace on day one – many
would find comfort in the possession of the same. As proclaimed on day one though, it really
wasn’t necessary to provide a copy – the two-day “training” runs were a good acclimation.
PEQ Item 8 - How effective was the STARS training?
Taught us local patch/Tech Center entries well.
I felt confident training was available if the need arose.
Coming from a STARS facility made this very easy.
NA came from a STARS facility.
PEQ Item 9 - In your opinion what effect would UAS operations have on Class C airspace?
If you could dedicate a lesser used runway for operations it could be better.
As long as very strict operations procedures are directed and followed it could be done.
Not being able to follow traffic visually is the biggest factor, adding a mile to separation has its
disadvantages. Flying IFR but need to avoid clouds adds work load.
I don’t see how a UAS can fly VFR and not use any form of visual separation.
UASs create greater workload and take away 50% of your chances at using visual separation.
UASs low slow speeds inside the FAF require a larger interval on final and a less efficient
operation. Sequencing becomes more critical to maximize number of operations.
The limited capabilities and increased separation requirements will undoubtedly negatively
impact the workforce.
Just need to have rules, procedures, and training to integrate UAS ops.
The lack of using visual separation with UAS at a busy airport will have a negative effect on
airspace operations.
It appeared to me if the UAS was in a departure or overflight mode it had very little impact.
However, in the arrival/final mode it had huge impact based on aircraft performance and extra
spacing requirements.
I haven’t worked a Class C airspace in almost 18 years. It’s been Class Bravo since then so I
cannot remember the difference between B and C. The extra mile required for a flight is a
definite nuisance.
For those familiar with “flight formations”, it would have little-to-none. The only question
would be, how would multiple operations affect the airspace.
PEQ Item 10 - What are the major challenges with integrating UAS operations in Class C airspace?
The amount of VFRs, other traffic and increased spacing.
There would need to be protected airspace for arrivals and departures.
Same as above [Not being able to follow traffic visually is the biggest factor, adding a mile to
separation has its disadvantages. Flying IFR but need to avoid clouds adds work load]. Remote
airport operations away from commercial/GA traffic would help.

H-4
The volume of VFR aircraft not on frequency, the extra spacing required because they use a
flight of 2. The fact they require basically an ILS approach and are limited to the UAS runway. If
UAS were to start flying into Class C airspace and had all of these constraints and requirements
they would need to be scheduled away from peak hours to limit the negative effect to the
airlines.
Controller training; determining what runway to be used will have the least impact on the
operation; creating approaches that mirror ILS or GPS approaches; and creating safe holding
areas.
Lack of being able to fly IMC and see and avoid, LLP procedures that conflict with normal traffic
flows, increased separation, inefficient aircraft performance, other unknown variables that are
impossible to predict.
UAS performance characteristics, rules (i.e., separation), flights – when chase aircraft loses sight
–MARSA?
Visual compliance; UAS characteristics – performance, etc.; lost communications procedures.
The biggest obstacle is lack of visual. Once the aircraft are on the approach any targets in their
way are a potential midair. Getting them to the is [sic] not too bad because you have vectors
and altitude.
The lack of ability to see other aircraft. Without this tool the overall efficiency of the NAS
suffers tremendously. I believe the UAS are safe, just have to be really careful with them and
protect more airspace. It’s almost like protecting for an approach or departure at an
uncontrolled airport IFR.
The extra mile required for a flight if they always have a chase aircraft. Lack of UAS being able
to see traffic they are following or VFR traffic in their face!
Making certain that communication systems have adequate default systems in place.
PEQ Item 11 - What additional tools, requirements, or procedures are needed to integrate UAS
operations in the NAS?
More training, maybe a VFR corridor away from UAS finals.
Airspace would need to be configured to meet the mission goals of the UAS. It’s possible to
create a various amount of configurations with their own set of procedures and rules.
Do we really need to treat them as a flight (add 1 mile)? Handoff position during UAS
operations would help. Need to define what they can do when they’re VFR to IFR requirements
better.
They should be able to fly a standard ILS or have UAS approaches to most runways. They should
be scheduled away from peak traffic times. The chase plan shouldn’t be treated as standard
formation, should fly close enough for standard separation in flight, and specified chase plane
behind UAS on final and maybe an extra mile behind the UAS on final.
Rules governing UASs on IFR flight plan; rules pertaining to terrain and obstruction avoidance;
published approaches; separation/weight classifications; published holding points; safe
communication systems; and convert UAS to a GPS, not lat/long means of navigation.

H-5
They need to have their own set of rules for separation standards and localized SOPs that limit
the impact of the primary users.
Maybe performance rating on UAS – similar to experimental aircraft.
Detailed procedures in UAS operations in the NAS: UAS types, performance; separation
requirements; visual rules compliance.
1. A sterile final. 2. A dedicated runway. 3. Group UAS together or limit them during peak time.
Limit the airports they can fly into. Almost have to create a new order of services provided by
ATC. IFR comes first, UAS comes second, and VFR comes third. Integrating a way for UAS to be
able to use visual separation is a must.
Every facility (TRACON) will need to have lost communication procedures. Does a UAS approach
need to be flight checked or is it instantly certified? Many facilities have a go around/climb out
procedure that is different from the published missed approach (just like Hayward airport does).
What would a UAS do if it went around?
The STARS system provides the needed tools to procure a safe operation of UAS operations in
the NAS. That is, using a “ring” around the flight in order to visualize the extra mile in separating
“flights” vs. single aircraft. “Bats” or “leader lines” are often employed already in STARS in order
to judge distances. The procedure introduced to recover to a waypoint in the event the chase
plane loses sight is paramount. Adding a “north” or a “south” waypoint (i.e., two waypoints)
may aid in aircraft not traversing a busy area.
PEQ Item 12 - Do you have any additional comments regarding the experiment?
I think this shows more work and study is needed to make it a more efficient program.
Great experiment/challenging.
During “airspace familiarization” it would be more beneficial to have different problems to work
to limit monotony. ATCSs have a good memory and don’t forget built in conflicts.
Having a coordinator to help identify conflicts would be helpful especially with som many
unidentified targets in the airspace (during heaviest times).
Very realistic, comparable to level 11/12 traffic. During the pushes or busy times UAS service
can expect delays.
I feel I could have been a more proficient controller if I had known the airspace/frequencies and
approaches better than just learning on the fly. Just email us some of the stuff and I could of
studied it on the plane. I guess it was part of the “experiment” but it seemed unusual to run
problems for 4 days and then introduce “IFR pickups” on the last day. In the real world
controllers don’t get checked out on a position until have seen something like that. In other
words a trainee would have seen that situation at least once. Frustration was mainly caused by
having to hand every aircraft off to the tower(s) and communication problems with pilots.
Yes – I firmly believe that employing people that actually were pilots as a remote, is required to
secure proper phraseology and the understanding of aircraft capabilities when responding to
climb, descend clearances, that often may not be realistic. In one of my sessions, a RPO told me

H-6
his descent radiant would be unrealistic if he accepted my instruction. Real pilot interaction
would increase the realistic component in these scenarios.