uae real estate review - q1 2015 · uae real estate review - q1 2015 ... villas and high end units...
TRANSCRIPT

Interested to know more? Please read on…
Executive Summary:
Please find below a quick snapshot of the key topics covered in this note:
Pricing trends - Sales
In March 2015, average listed property sales prices in Dubai declined to AED 1,253 /sqf (-1.6% m-o-m, -
10% y-o-y). Sales activity slowed down in the fourth quarter of last year. In 2014, annual average sales
prices increased 21% y-o-y, however it is expected to drop by circa 15% in 2015 based on current data.
Pricing trends - Rentals
In March 2015, average listed property rents in Dubai increased by 1.8% m-o-m, but remained stable
year on year. Average rents increased by 21% during 2014, however they are expected to decline by circa
10% y-o-y by the end of 2015.
Who’s buying Dubai residential property?
In the first quarter of 2015, UAE nationals were the largest buyers, representing 24.2% of the total value of
Dubai residential property transactions, while Indian nationals were the second largest investor group
(accounting for 14.2% of the total), and British nationals third representing 7.9%.
Supply dynamics
According to the available data, in Dubai there are currently 370,000 residential units that are already
completed. By the end of 2015 an additional 40,000 units are expected to be completed and hence the
aggregate residential unit stock is expected to reach 410,000 units. Judging by the number of cranes in
Dubai, the supply is unlikely to ease off anytime soon! Clearly this will likely keep the pressure on prices.
Recovery since the 2008 financial crisis
After falling more than 65% since their peak prices in Q3 2008, average Dubai residential prices in March
2015 were around 40% below the peak values, having recovered significantly since the market bottomed
out. Villas and high end apartments seem to be the units of choice in the first quarter of 2015, with prices
in locations such as Arabian Ranches currently around 31.6% less than the peak values, while Jumeirah
Lake Towers pricing is around 22.5% less than peak values.
UAE Banking Sector -Factors relevant to real estate
Pre-Crisis in 2008Q3, so-called "hot money" was flowing into UAE banking system. There was excess
liquidity, annual lending growth exceeded 40% during 2007-2008. Mortgage Loan to Value ratios exceeded
95%, off plan sales and financing was the common practice. Loan to Deposit ratios were above 110%, but
are currently at around 91%.
UAE Real Estate Review - Q1 2015
Regulatory and other factors
The Dubai Government announced that they are considering clamping down on the flipping of off-plan
properties and possibly introducing extra fees and implementing new restrictions on such activity, in an
attempt to further curb speculators. Exact details weren't announced about the fee structure, but it could
possibly be a new system that would charge flippers on a sliding scale, based on how long they had held
the property. One possible method is to introduce some sort of stamp duty.
Economic Outlook
Dubai economy experienced sustainable growth in recent years. In 2014 GDP of Dubai is estimated to
have grown by 4% driven by real estate, trade, tourism and reached almost US$ 99.5 billion (25% of UAE
Nominal GDP). Highest since 2007. Business outlook remains positive. In 2015, GDP of Dubai is
estimated to grow by around 4% again mainly driven by trade, real estate & tourism.
For Abu Dhabi, average listed residential sales price declined to AED 1,355/sqf in March 2015 (2.2% mom,
-4.2% y-o-y). In 2014, annual average sales prices increased 22.5% y-o-y, and on average are expected to
drop by around 10-15% in 2015.
For Abu Dhabi, average listed residential rents declined 2% m-o-m in March, and increased slightly by 1%
y-o-y. In 2014, average annual rents increased by 13.8%, however by the end of 2015 a decline of around
5% y-o-y is expected.
Disclaimer :This report has been issued by the Market Insights & Strategy at National Bank of Abu Dhabi (NBAD) on the basis of publicly available information &other sources considered reliable.This is not to be construed as an offer to buy, or sell securities.While utmost care has been taken to ensure that theinformation provided is accurate and correct, neither NBAD, nor any of its employees shall, in any way, be responsible for the contents. NBAD is licensed byUAE Central Bank. Source: Dubai Land Department, Dubai Statistical Center, UAE Property Finder, Gulf News, Dubizzle.com
The Safest B
ank in th
e Middle East and One of th
e W
orld's 50 Safest B
anks Since 2009 (G
lobal Finance)
Disclaimer :This report has been issued by the Market Insights & Strategy at National Bank of Abu Dhabi (NBAD) on the basis of publicly available information& other sources considered reliable.This is not to be construed as an offer to buy, or sell securities.While utmost care has been taken to ensure that theinformation provided is accurate and correct, neither NBAD, nor any of its employees shall, in any way, be responsible for the contents. NBAD is licensed byUAE Central Bank. Source: Dubai Land Department, Dubai Statistical Center, Dubizzle, UAE Property Finder, Gulf News
The Safest B
ank in th
e Middle East and One of th
e W
orld's 50 Safest B
anks Since 2009 (G
lobal Finance)
6.0%
6.5%
7.0%
7.5%
8.0%
8.5%
9.0%
9.5%
10.0%
50
60
70
80
90
100
110
120
Mar-09 Mar-10 Mar-11 Mar-12 Mar-13 Mar-14 Mar-15
Dubai Average Rent (AED/Sqft)
Average Yield (Rent/Sales Price) - RHS
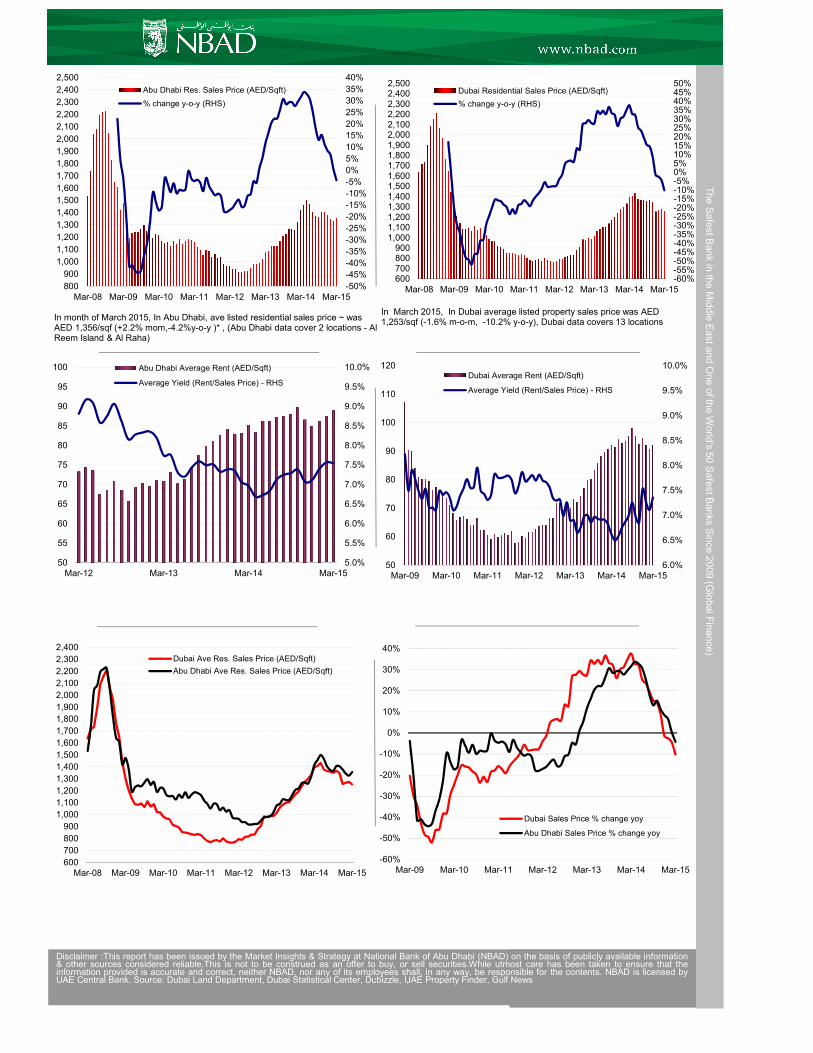
In month of March 2015, In Abu Dhabi, ave listed residential sales price ~ was AED 1,356/sqf (+2.2% mom,-4.2%y-o-y )* , (Abu Dhabi data cover 2 locations - Al Reem Island & Al Raha)
In March 2015, In Dubai average listed property sales price was AED 1,253/sqf (-1.6% m-o-m, -10.2% y-o-y), Dubai data covers 13 locations
600
700
800
900
1,000
1,100
1,200
1,300
1,400
1,500
1,600
1,700
1,800
1,900
2,000
2,100
2,200
2,300
2,400
Mar-08 Mar-09 Mar-10 Mar-11 Mar-12 Mar-13 Mar-14 Mar-15
Dubai Ave Res. Sales Price (AED/Sqft)
Abu Dhabi Ave Res. Sales Price (AED/Sqft)
-60%-55%-50%-45%-40%-35%-30%-25%-20%-15%-10%-5%0%5%10%15%20%25%30%35%40%45%50%
600700800900
1,0001,1001,2001,3001,4001,5001,6001,7001,8001,9002,0002,1002,2002,3002,4002,500
Mar-08 Mar-09 Mar-10 Mar-11 Mar-12 Mar-13 Mar-14 Mar-15
Dubai Residential Sales Price (AED/Sqft)
% change y-o-y (RHS)
-50%
-45%
-40%
-35%
-30%
-25%
-20%
-15%
-10%
-5%
0%
5%
10%
15%
20%
25%
30%
35%
40%
800
900
1,000
1,100
1,200
1,300
1,400
1,500
1,600
1,700
1,800
1,900
2,000
2,100
2,200
2,300
2,400
2,500
Mar-08 Mar-09 Mar-10 Mar-11 Mar-12 Mar-13 Mar-14 Mar-15
Abu Dhabi Res. Sales Price (AED/Sqft)
% change y-o-y (RHS)
5.0%
5.5%
6.0%
6.5%
7.0%
7.5%
8.0%
8.5%
9.0%
9.5%
10.0%
50
55
60
65
70
75
80
85
90
95
100
Mar-12 Mar-13 Mar-14 Mar-15
Abu Dhabi Average Rent (AED/Sqft)
Average Yield (Rent/Sales Price) - RHS
-60%
-50%
-40%
-30%
-20%
-10%
0%
10%
20%
30%
40%
Mar-09 Mar-10 Mar-11 Mar-12 Mar-13 Mar-14 Mar-15
Dubai Sales Price % change yoy
Abu Dhabi Sales Price % change yoy

Source: Dubai Land Department, RERA
Investment Value By Nationality (AED) 2014
Source: Dubai Land Department, RERA
Dubai Residential Units Available & Future Supply
Source: Jones Lang Lasalle
According to Dubai Land Department
(DLD) in 2015Q1, UAE nationals took the
lead with investments worth 24.2% of the
total up from 20.7% in 2014, Indians were
second with investments worth 14.2%
down from 16.5% in 2014. British nationals
came third with investments worth 7.9%.
GCC nationals constituted 37.5% of the
total investment value up from 29% in
2014. Overall Arab nationals constituted
50% of total investment value - up from
40% in 2014. This is a serious jump from
previous year and demonstrates that GCC
nationals are focused more on Dubai.
Investment Value By Nationality (AED) 2015Q1
One of the possible reasons for this is the
ongoing turmoil and geopolitical unrest in
the broader Arab world which is driving
many people to have primary or secondary
homes in Dubai, especially as it is widely
regarded as a much more safe and stable
place to live, relative to many other cities in
the region
In June 2014, Dubai's Land Department
announced that "Growth in real estate
demand has been due to an improving
economy, not speculation". The
announcement came soon after the IMF
and Central Bank UAE warned that the
property market might be overheating.
According to JLL there are currently
390,000 residential units that are already
completed, by the end of 2015 the total
count is expected to surpass 410,000
units. With the pace of additional supply
seemingly relentless, there are clearly
concerns about imbalance in the supply-
demand dynamics of this market.
Disclaimer :This report has been issued by the Market Insights & Strategy at National Bank of Abu Dhabi (NBAD) on the basis of publicly available information &other sources considered reliable.This is not to be construed as an offer to buy, or sell securities.While utmost care has been taken to ensure that theinformation provided is accurate and correct, neither NBAD, nor any of its employees shall, in any way, be responsible for the contents. NBAD is licensed byUAE Central Bank. Source: Dubai Land Department, Dubai Statistical Center, Dubizzle, UAE Property Finder, Gulfnews
The Safest B
ank in the Middle East and One of th
e W
orld's 50 Safest B
anks Since 2009 (G
lobal Finance)
UAE24.17%
GCC exc. UAE13.33%
Non-GCC Arabs12.50%
India14.17%
UK7.88%
Pakistan5.80%
Iran2.64%
Russia2.12%
Other Non-Arabs17.39%
250
260
270
280
290
300
310
320
330
340
350
360
370
380
390
400
410
420
2009 2010 2011 2012 2013 2014 2015F
Future Supply (000)
Available (000)
UAE20.70%
GCC exc. UAE8.39%
Non-GCC Arabs10.91%
India16.47%
UK8.47%
Pakistan6.90%
Other Non-Arabs28.17%

Population growth vs Supply of residential units (Rebased to 100)
Source: Dubai Land Department, RERA, Dubai Statistical Center
Residential Rents/Price Decline 2015Q1 from peak in Q3 of 2008
Source: NBAD Real Estate Database
Lowest point in Rental/Sales Prices vs Peak in Q3 2008
Source: NBAD Real Estate Database
As we can see the supply of residential
units more than doubled since 2008, while
population increased by a more modest
50%, equivalent to circa 800,000 people.
The gap between the two lines indicates
that the supply is growing faster than the
population - however it is important to bear
in mind that people residing outside of
Dubai are also investing in such residential
units, and hence this could to some extent
mitigate an element of any potential over-
supply.
After faling more than 65%, in March 2015,
Dubai average residential prices were
around 40% less than peak values of
2008Q3. Villas and high end units were
the preferred types, prices in locations
such as Arabian Ranches are currently
around 32% less than the record values,
Jumeirah Lake Tower residential sales
price is around 22.5% less than peak
values.
The adjacent graph shows the lowest point
in rents and sales price since their peak in
Q3 2008. In some areas rents and sales
price dropped by as much as 75%. The
Dubai real estate market, after declining
for more than 40 months since its peak
values in around Sept 2008, started to
recover in May 2012, while the recovery in
Abu Dhabi started much later, in around
January 2013.
Disclaimer :This report has been issued by the Market Insights & Strategy at National Bank of Abu Dhabi (NBAD) on the basis of publicly available information &other sources considered reliable.This is not to be construed as an offer to buy, or sell securities.While utmost care has been taken to ensure that theinformation provided is accurate and correct, neither NBAD, nor any of its employees shall, in any way, be responsible for the contents. NBAD is licensed byUAE Central Bank. Source: Dubai Land Department, Dubai Statistical Center, Dubizzle, UAE Property Finder, Gulfnews
The Safest B
ank in the Middle East and One of th
e W
orld's 50 Safest B
anks Since 2009 (G
lobal Finance)
-100%
-90%
-80%
-70%
-60%
-50%
-40%
-30%
-20%
-10%
0%
Arabian Ranches
Dubai Land
Palm Jumeirah
JBR
JLT
Dubai M
arina
Sports City
Business Bay
International C
ity
D.T. B
urj D
ubai
The Greens
DIFC
% Change in Rent Since 2008Q3
% Change in Sales Price Since 2008Q3
-100%
-90%
-80%
-70%
-60%
-50%
-40%
-30%
-20%
-10%
0%
Arabian Ranches
Dubai Land
Palm Jumeirah
JBR
JLT
Dubai M
arina
Sports City
Business Bay
International C
ity
D.T. B
urj D
ubai
The Greens
DIFC
Lowest Rent Since 2008Q3 Peak
Lowest Sales Price Since 2008Q3 Peak
80
90
100
110
120
130
140
150
160
170
180
190
200
210
220
2008 2009 2010 2011 2012 2013 2014 2015F
Population Dubai Residential Supply

Dubai Residential Transactions Volume 12MSum(AED Bn)
Source : Knight Frank
Dubai Property (Comm + Res + Land) 12M Sum (AED Bn)
Source: Dubai Land Department
In March 2015, residential property
transactions, on a 12mth cumulative basis,
declined to AED36 billion (-18% yoy) but
the latest monthly data indicates that the
sales volume may be gradually picking up.
Mortgage transactions currently constitute
36% of total, up from 20% in July 2009.
This clearly indicates that investors have
access to loans, market sentiment is
improving, and banks are indeed lending.
However, it is still noteworthy that despite
this change, circa 64% of all residential
transations are still on a cash basis (i.e.
close to two thirds of the total value of
residential transactions are done with cash
and without any mortgage involved).
Property sales volumes had been
increasing from 2011 to Q1 2014, when
they peaked and sales activity showed
signs of slowing down in last quarter of
2014. Most recent monthly data from
2015Q1 indicates there may be a slight
revival in activity.
The Dubai Real Estate Investor Law
(Tanweer) aims to minimize legal disputes
and protect investors' rights. DLD also
increased the transaction tax on real estate
from 2% to 4% and this shows the
government's intention to reduce the
amount of speculative activity. The market
still has some degree of speculation in it,
but the Real Estate Regulatory Authority
and the UAE Central Bank have been
implementing counter measures which
have led to the regulatory environment
being much better than the 2008 period.
The new regulations require that
developers deposit between 30% and 40%
of the total construction costs in escrow
account before any pre-sales. In addition,
developers are required to have 100%
ownership of their land. These measures
are designed to protect the investors and
generate greater confidence and comfort
among those looking to invest in this
market. Additional details of the
regulations imposed are shown at the back
of this report.
Disclaimer :This report has been issued by the Market Insights & Strategy at National Bank of Abu Dhabi (NBAD) on the basis of publicly available information& other sources considered reliable.This is not to be construed as an offer to buy, or sell securities.While utmost care has been taken to ensure that theinformation provided is accurate and correct, neither NBAD, nor any of its employees shall, in any way, be responsible for the contents. NBAD is licensed byUAE Central Bank. Source: Dubai Land Department, Dubai Statistical Cenler, Dubizzle, UAE Property Finder, Gulfnews
The Safest B
ank in the Middle East and One of th
e W
orld's 50 Safest B
anks Since 2009 (G
lobal Finance)
-60%
-50%
-40%
-30%
-20%
-10%
0%
10%
20%
30%
40%
50%
60%
70%
80%
90%
100%
0
5
10
15
20
25
30
35
40
45
50
55
60
Jul-09 Dec-10 May-12 Oct-13 Mar-15
Residential Mortgage Sales Volume (12M Sum)
Residential Cash Sales Volume (12M Sum)
% change y-o-y (RHS)
-80%
-60%
-40%
-20%
0%
20%
40%
60%
80%
100%
120%
140%
160%
180%
200%
0
20
40
60
80
100
120
140
160
180
200
220
240
260
M-04 M-05 M-06 M-07 M-08 M-09 M-10 M-11 M-12 M-13 M-14 M-15
Property Mortgage Volume (12M Sum)
Property Cash Sales Volume (12M Sum)
% change y-o-y (RHS)
Dubai Population Pyramid By Gender 2013
Source: Dubai Statistical Center (DSC)
Dubai Population By Nationality
Source: Dubai Statistical Center (DSC), National Bureau of Statistics (NBS)
Source: NBAD Real Estate Database
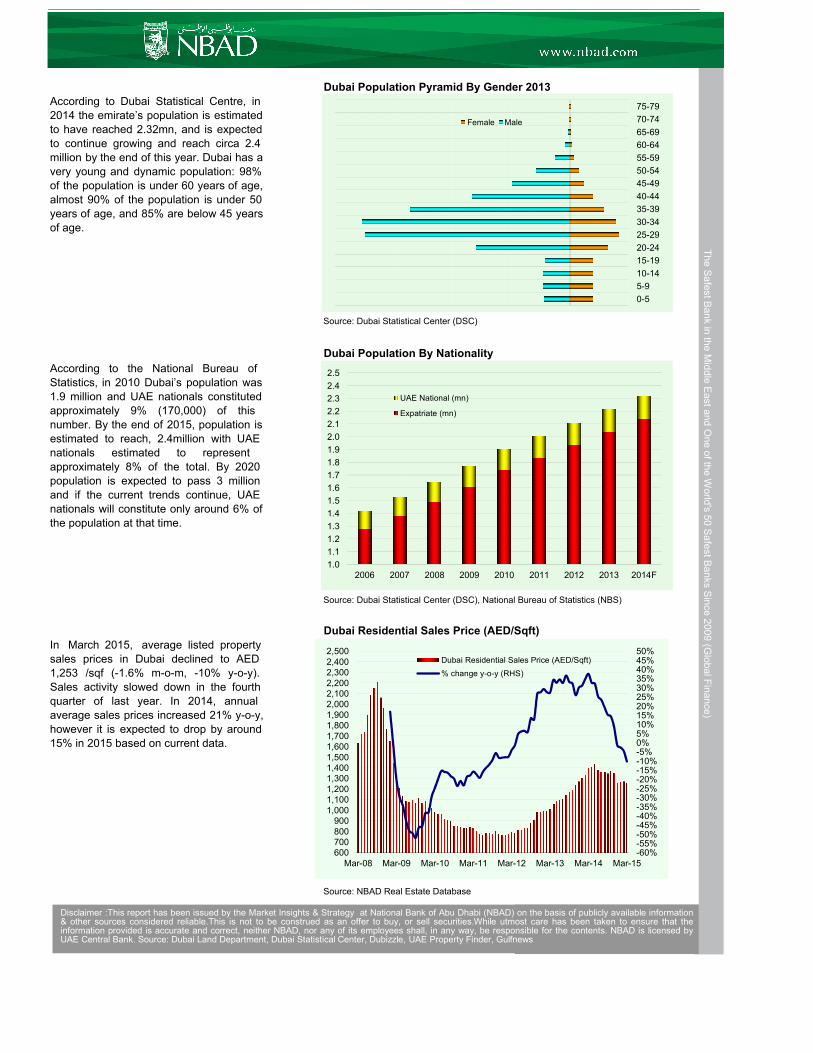
In March 2015, average listed property
sales prices in Dubai declined to AED
1,253 /sqf (-1.6% m-o-m, -10% y-o-y).
Sales activity slowed down in the fourth
quarter of last year. In 2014, annual
average sales prices increased 21% y-o-y,
however it is expected to drop by around
15% in 2015 based on current data.
According to the National Bureau of
Statistics, in 2010 Dubai’s population was
1.9 million and UAE nationals constituted
approximately 9% (170,000) of this
number. By the end of 2015, population is
estimated to reach, 2.4million with UAE
nationals estimated to represent
approximately 8% of the total. By 2020
population is expected to pass 3 million
and if the current trends continue, UAE
nationals will constitute only around 6% of
the population at that time.
Dubai Residential Sales Price (AED/Sqft)
According to Dubai Statistical Centre, in
2014 the emirate’s population is estimated
to have reached 2.32mn, and is expected
to continue growing and reach circa 2.4
million by the end of this year. Dubai has a
very young and dynamic population: 98%
of the population is under 60 years of age,
almost 90% of the population is under 50
years of age, and 85% are below 45 years
of age.
Disclaimer :This report has been issued by the Market Insights & Strategy at National Bank of Abu Dhabi (NBAD) on the basis of publicly available information& other sources considered reliable.This is not to be construed as an offer to buy, or sell securities.While utmost care has been taken to ensure that theinformation provided is accurate and correct, neither NBAD, nor any of its employees shall, in any way, be responsible for the contents. NBAD is licensed byUAE Central Bank. Source: Dubai Land Department, Dubai Statistical Center, Dubizzle, UAE Property Finder, Gulfnews
TTTTThe Safest B
ank in the Middle East and One of th
e W
orld's 50 Safest B
anks Since 2009 (G
lobal Finance)
0-5
5-9
10-14
15-19
20-24
25-29
30-34
35-39
40-44
45-49
50-54
55-59
60-64
65-69
70-74
75-79
Female Male
1.0
1.1
1.2
1.3
1.4
1.5
1.6
1.7
1.8
1.9
2.0
2.1
2.2
2.3
2.4
2.5
2006 2007 2008 2009 2010 2011 2012 2013 2014F
UAE National (mn)
Expatriate (mn)
-60%-55%-50%-45%-40%-35%-30%-25%-20%-15%-10%-5%0%5%10%15%20%25%30%35%40%45%50%
600700800900
1,0001,1001,2001,3001,4001,5001,6001,7001,8001,9002,0002,1002,2002,3002,4002,500
Mar-08 Mar-09 Mar-10 Mar-11 Mar-12 Mar-13 Mar-14 Mar-15
Dubai Residential Sales Price (AED/Sqft)
% change y-o-y (RHS)
Dubai Residential Rent (AED/Sqft)
Source: NBAD Real Estate Database
Abu Dhabi Residential Sales Price (AED/Sqft)
Source: NBAD Real Estate Database
Abu Dhabi Residential Rent (AED/Sqft) vs Yield
Source: NBAD Real Estate Database
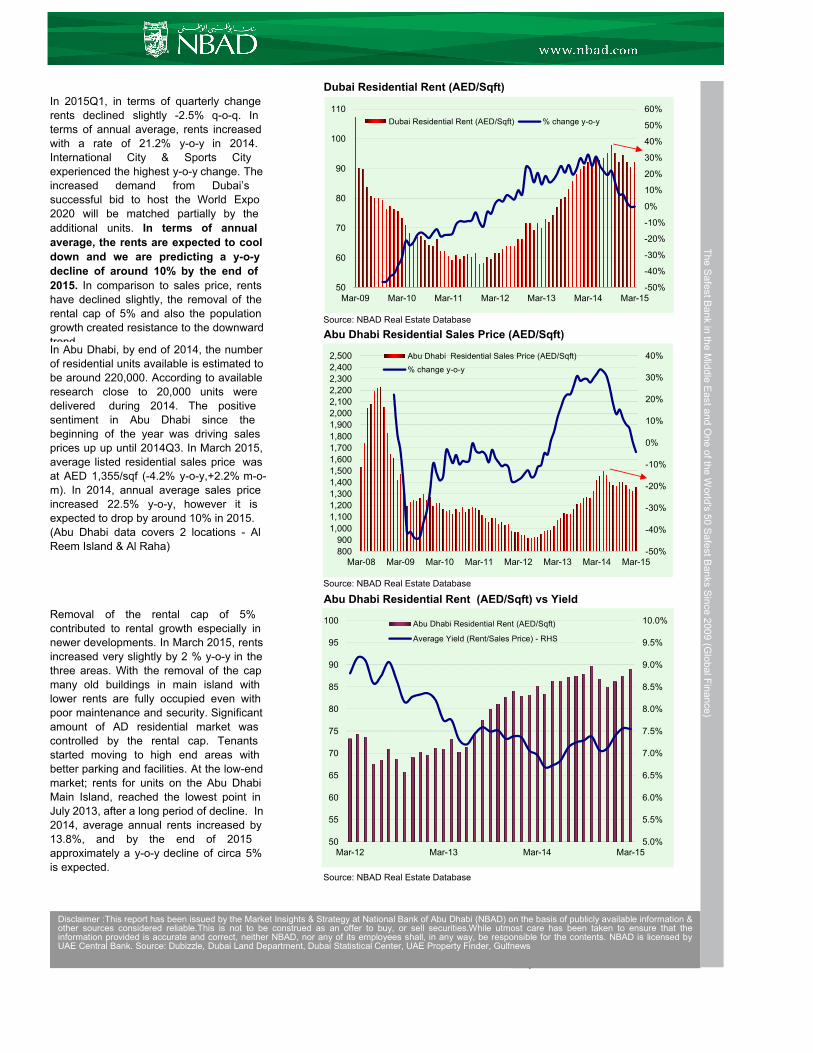
In Abu Dhabi, by end of 2014, the number
of residential units available is estimated to
be around 220,000. According to available
research close to 20,000 units were
delivered during 2014. The positive
sentiment in Abu Dhabi since the
beginning of the year was driving sales
prices up up until 2014Q3. In March 2015,
average listed residential sales price was
at AED 1,355/sqf (-4.2% y-o-y,+2.2% m-o-
m). In 2014, annual average sales price
increased 22.5% y-o-y, however it is
expected to drop by around 10% in 2015.
(Abu Dhabi data covers 2 locations - Al
Reem Island & Al Raha)
Removal of the rental cap of 5%
contributed to rental growth especially in
newer developments. In March 2015, rents
increased very slightly by 2 % y-o-y in the
three areas. With the removal of the cap
many old buildings in main island with
lower rents are fully occupied even with
poor maintenance and security. Significant
amount of AD residential market was
controlled by the rental cap. Tenants
started moving to high end areas with
better parking and facilities. At the low-end
market; rents for units on the Abu Dhabi
Main Island, reached the lowest point in
July 2013, after a long period of decline. In
2014, average annual rents increased by
13.8%, and by the end of 2015
approximately a y-o-y decline of circa 5%
is expected.
In 2015Q1, in terms of quarterly change
rents declined slightly -2.5% q-o-q. In
terms of annual average, rents increased
with a rate of 21.2% y-o-y in 2014.
International City & Sports City
experienced the highest y-o-y change. The
increased demand from Dubai’s
successful bid to host the World Expo
2020 will be matched partially by the
additional units. In terms of annual
average, the rents are expected to cool
down and we are predicting a y-o-y
decline of around 10% by the end of
2015. In comparison to sales price, rents
have declined slightly, the removal of the
rental cap of 5% and also the population
growth created resistance to the downward
trend.
Disclaimer :This report has been issued by the Market Insights & Strategy at National Bank of Abu Dhabi (NBAD) on the basis of publicly available information &other sources considered reliable.This is not to be construed as an offer to buy, or sell securities.While utmost care has been taken to ensure that theinformation provided is accurate and correct, neither NBAD, nor any of its employees shall, in any way, be responsible for the contents. NBAD is licensed byUAE Central Bank. Source: Dubizzle, Dubai Land Department, Dubai Statistical Center, UAE Property Finder, Gulfnews
The Safest B
ank in the Middle East and One of th
e W
orld's 50 Safest B
anks Since 2009 (G
lobal Finance)
T
-50%
-40%
-30%
-20%
-10%
0%
10%
20%
30%
40%
800
900
1,000
1,100
1,200
1,300
1,400
1,500
1,600
1,700
1,800
1,900
2,000
2,100
2,200
2,300
2,400
2,500
Mar-08 Mar-09 Mar-10 Mar-11 Mar-12 Mar-13 Mar-14 Mar-15
Abu Dhabi Residential Sales Price (AED/Sqft)
% change y-o-y
5.0%
5.5%
6.0%
6.5%
7.0%
7.5%
8.0%
8.5%
9.0%
9.5%
10.0%
50
55
60
65
70
75
80
85
90
95
100
Mar-12 Mar-13 Mar-14 Mar-15
Abu Dhabi Residential Rent (AED/Sqft)
Average Yield (Rent/Sales Price) - RHS
-50%
-40%
-30%
-20%
-10%
0%
10%
20%
30%
40%
50%
60%
50
60
70
80
90
100
110
Mar-09 Mar-10 Mar-11 Mar-12 Mar-13 Mar-14 Mar-15
Dubai Residential Rent (AED/Sqft) % change y-o-y
TTTTTTT

Alp Eke
Senior Economist
Market Insights & Strategy
Global Markets, NBAD
P O Box 4, Abu Dhabi, UAE
Tel: +971 2 6110157
12th May 2015
Certificates of Deposit (AED Billion)
Source: Central Bank of UAE (CBUAE)
Certificates issued by the Central Bank
and sold only to banks to absorb excess
liquidity and are also used as an indicator
to determine domestic interest rates. Pre-
Crisis in 2008Q3, hot money was flowing
into UAE banking system, and annual
lending growth exceeded 25% during 2007-
2008. Mortgage Loan to Value ratios
exceeded 95%, off plan sales and
financing was commonplace. Loan to
Deposit (LTD) ratio was above 110%.
Banking sector liquidity has improved
significantly. It is reflected in the net LTD
ratio decline. In June 2014 the LTD ratio
reached lowest point at 87%. Currently in
February 2014, LTD ratio is at around 91%.
Disclaimer :This report has been issued by the Market Insights & Strategy at National Bank of Abu Dhabi (NBAD) on the basis of publicly available information &other sources considered reliable.This is not to be construed as an offer to buy, or sell securities.While utmost care has been taken to ensure that the informationprovided is accurate and correct, neither NBAD, nor any of its employees shall, in any way, be responsible for the contents. NBAD is licensed by UAE CentralBank. Source: Dubizzle, Dubai Land Department, Dubai Statistical Center, UAE Property Finder, Gulfnews
The Safest B
ank in the Middle East and One of th
e W
orld's 50 Safest B
anks Since 2009 (G
lobal Finance)
TTTT
-100%
-50%
0%
50%
100%
150%
200%
250%
300%
350%
400%
450%
500%
0102030405060708090100110120130140150160170180190200210220
Dec-14Sep-12Jun-10Mar-08Dec-05
Certicates Deposit (AED Billion)
% change yoy (LHS)

2002
2. Law 14: Mortgage Registration. Protects banks and financial institutions by registering mortgages on
real estate and enforcement of rights in case of default
20061. Law 7: Real Property Registration. Allows foreigners to own real estate in designated areas
A developer can offer units off plan when 20% of construction has been done or the developer has deposited 20% of
project value with RERA in an ESCROW account
All projects have to registered with RERA. Only RERA registered developer can launch a project.
2013
1. Investor Protection Law (TANWEER): Not yet released. Allows investors to get full refund in case of
developer failure to deliver/complete property in specified time frame or alters specifications of flats without
permission. Allows for compensation for breach of any warranty in contract or misrepresentation by the
developer or broker.
RERA Regulations That Protect Investor Interest
2008
2. Law 8: Escrow Law. This law ensures off plan sales reveue to be used only for the project it is collected
1. Real Estate Regulatory Authority (RERA) formed. RERA becomes the regulatory institution for real
estate market.
2. In July 2013, Government of Dubai announced establishment of a special legal committee to settle the
disputes between the property developers and investors over the cancellation of projects. The decisions of
this legal committee can not be challenged by any Dubai Court
1. Amendments to Law 13 of 2008: Developer can keep full amount paid and claim remaining purchasing
price if at least 80% of the project is completed. Developer can revoke the contract and keep up to 40% of
the purchase price if at least 60% of the project is completed. Developer can revoke the contract and keep
up to 25% of the purchase price if construction started but didn't reach 60%.Developer can revoke the
contract and keep up to 30% of amount paid if construction has not started for reasons beyond control.
1. Law 27: Jointly owned properties (Strata Law). Strata law benefits buyers bringing transparency and
fairness on issues such as service charges, contracts with service providers and the use of common areas
and facilities.
2. Decree 4: Ownership of Land granted for industrial and commercial purposes. The decree allows
holders of commercial granted lands to convert them into freehold payment of fees and market prices
enabling them to use land to raise capital or sell it in open market.
2007
Property market opens up for foreigners
2010
Time Line of Dubai Real Estate Regulation
2009
1. Law 13: Interim Real Estate Registry. Developers can't sell units off plan unless they take possession of
land. All real estate units to be recorded in interim Real Estate Register. In case of default by the investor,
developer must refund money after a deduction not exceeeding 30% of money paid by the investor.
3. In October 2013, Central Bank issued new rules governing bank lending. The new rules will limit home
loans for expatriates to 75% of property's value for investments less then AED5million and 80% for UAE
nationals. For second property expatriates will be allowed 60% of property value and 65% for UAE
nationals.Loans will be limited to maximum of 25 years.Maximum age for last repayment is 65 years for
expatriates and 70 for UAE nationals.
4. In October 2013, Dubai Land Department as real estate regulatory authority in order to prevent
excessive amount of speculation it would double the transfer fee on each sale to 4% of property's value.
Disclaimer :This report has been issued by the Market Insights & Strategy at National Bank of Abu Dhabi (NBAD) on the basis of publicly available information& other sources considered reliable.This is not to be construed as an offer to buy, or sell securities.While utmost care has been taken to ensure that theinformation provided is accurate and correct, neither NBAD, nor any of its employees shall, in any way, be responsible for the contents. NBAD is licensed byUAE Central Bank. Source: Dubai Land Department, Dubai Statistical Center, Dubizzle, UAE Property Finder, Gulfnews
The Safest B
ank in the Middle East and One of th
e W
orld's 50 Safest B
anks Since 2009 (G
lobal Finance)