u2-s1-l3 interpret functions
DESCRIPTION
U2-S1-L3 Interpret Functions. Essential Question: What are the characteristics of a function?. EXAMPLE - PowerPoint PPT PresentationTRANSCRIPT
U2-S1-L3 Interpret Functions
Essential Question:What are the characteristics of a function?
• EXAMPLEEXAMPLE– Sales of video games, including hardware, software,
and accessories, have increased at times and decreased at other times over the years. Annual retail video game sales in the U.S. from 2000 to 2009 can be modeled by the graph of a nonlinear function.
• Why would a linear function not model the sale of Why would a linear function not model the sale of video games well?video games well?
• Describe some points or area on a graph of video Describe some points or area on a graph of video game sales that might be of more interest to game sales that might be of more interest to someone in the video game industry than other someone in the video game industry than other points.points.
• Intercepts – points where the graph intersects an axis.
• Y-intercept – the y-coordinate of the point at which the graph intersects the y-axis
• X-intercept – the x-coordinate of the point at which a graph intersects the x-axis
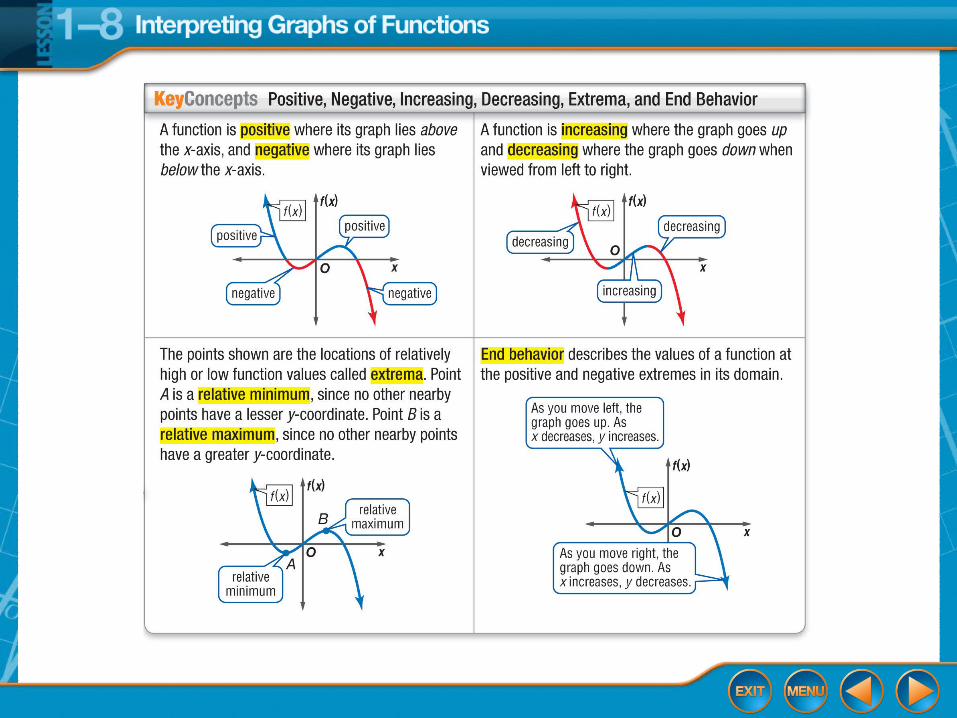
• Graph and Function Behavior– Positive – the graph is above the x-axis
– Negative – the graph is below the x-axis
– Increasing – the graph goes up from left to right
– Decreasing – the graph goes down from left to right
– Extrema – high or low points of the function• Relative Minimum – low point• Relative Maximum – high point
– End Behavior – describes the values of a function at the positive and negative extremes in its domain

• Discrete function: set of distinct points (not connected)
• Continuous function: set of points where any value within the interval is true (connected)

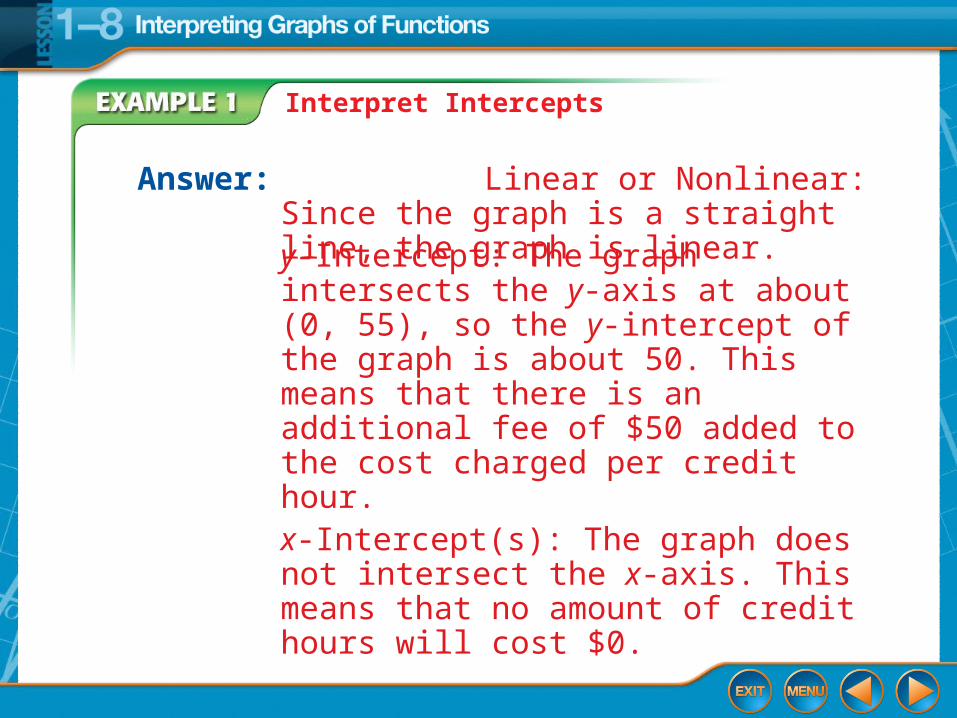
Interpret Intercepts
COLLEGE The graph shows the cost at a community college y as a function of the number of credit hours taken x. Identify the function as linear or nonlinear. Then estimate and interpret the intercepts of the graph of the function.
Interpret Intercepts
Answer: Linear or Nonlinear: Since the graph is a straight line, the graph is linear.y-Intercept: The graph intersects the y-axis at about (0, 55), so the y-intercept of the graph is about 50. This means that there is an additional fee of $50 added to the cost charged per credit hour.x-Intercept(s): The graph does not intersect the x-axis. This means that no amount of credit hours will cost $0.
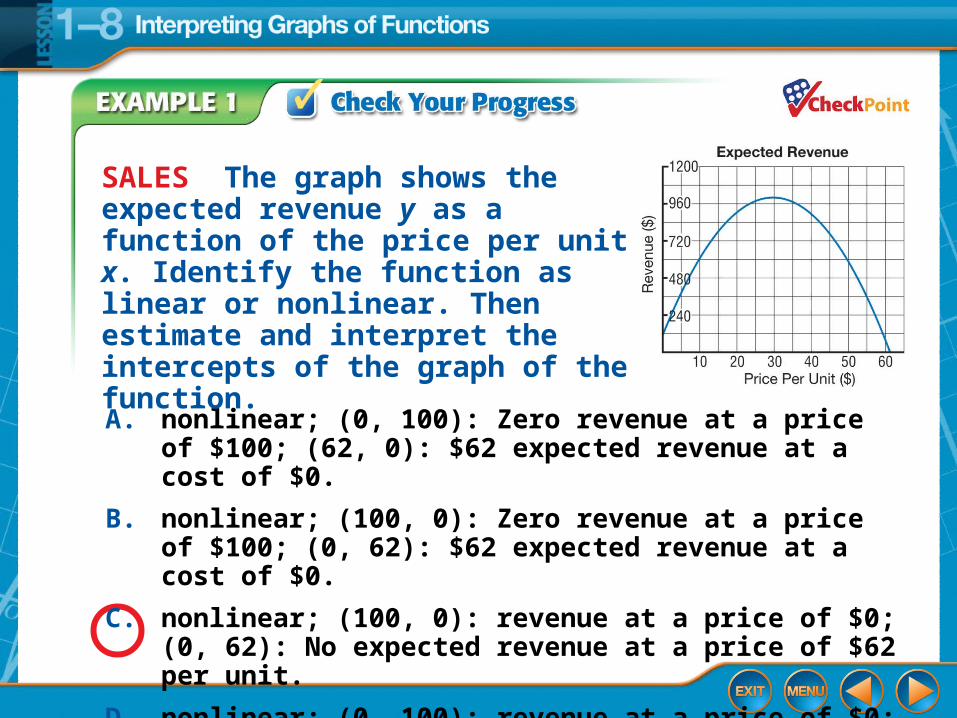
A. nonlinear; (0, 100): Zero revenue at a price of $100; (62, 0): $62 expected revenue at a cost of $0.
B. nonlinear; (100, 0): Zero revenue at a price of $100; (0, 62): $62 expected revenue at a cost of $0.
C. nonlinear; (100, 0): revenue at a price of $0; (0, 62): No expected revenue at a price of $62 per unit.
D. nonlinear; (0, 100): revenue at a price of $0; (62, 0): No expected revenue at a price of $62 per unit.
SALES The graph shows the expected revenue y as a function of the price per unit x. Identify the function as linear or nonlinear. Then estimate and interpret the intercepts of the graph of the function.
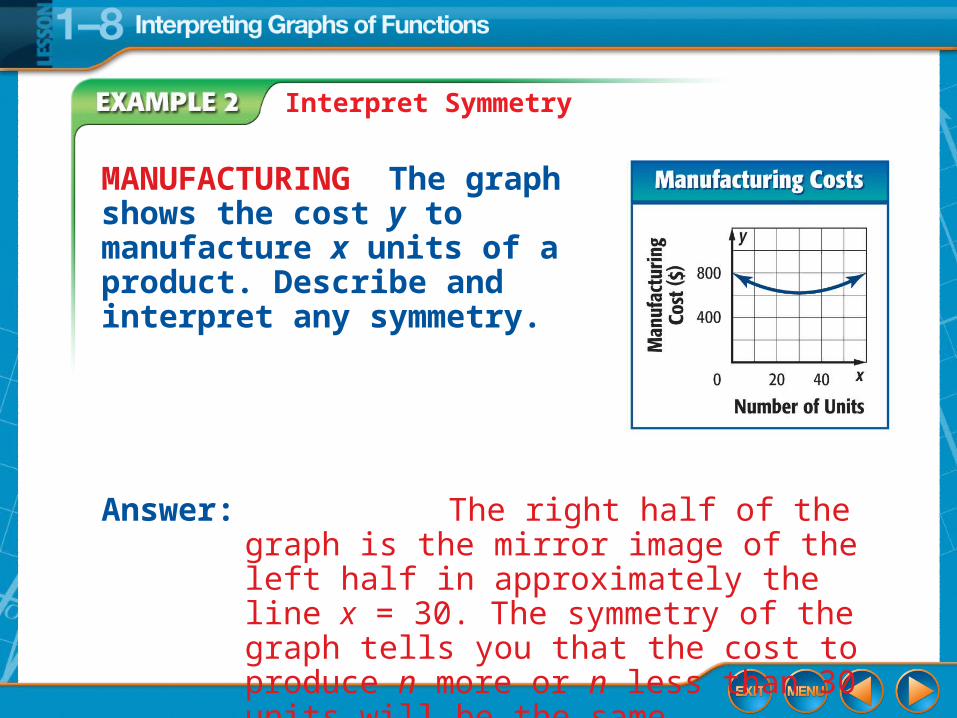
Interpret Symmetry
MANUFACTURING The graph shows the cost y to manufacture x units of a product. Describe and interpret any symmetry.
Answer: The right half of the graph is the mirror image of the left half in approximately the line x = 30. The symmetry of the graph tells you that the cost to produce n more or n less than 30 units will be the same.
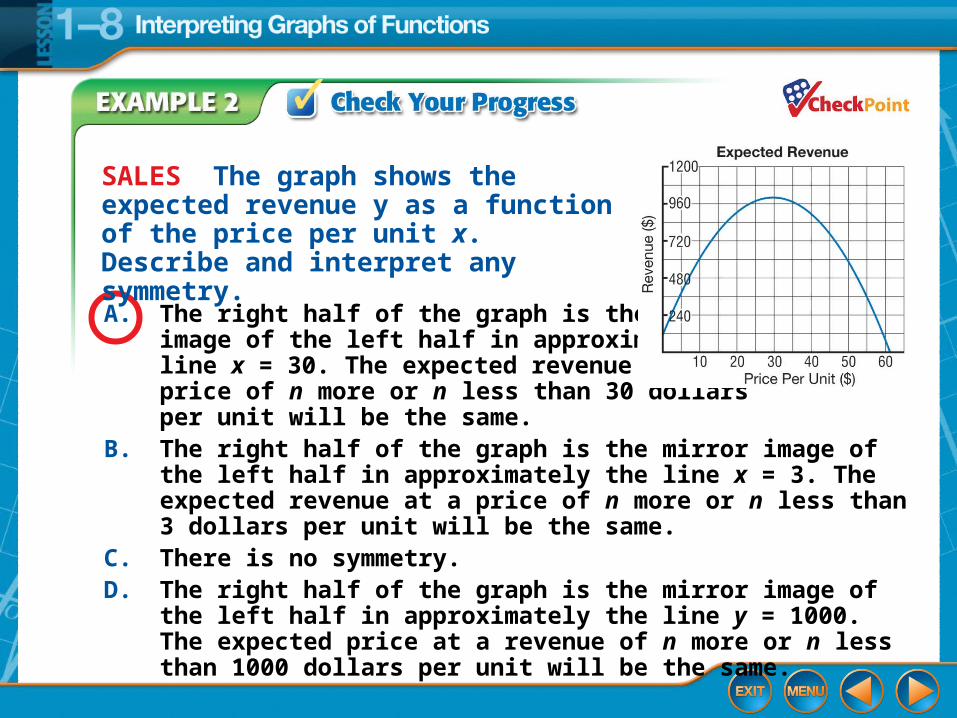
A. The right half of the graph is the mirror image of the left half in approximately the line x = 30. The expected revenue at a price of n more or n less than 30 dollars per unit will be the same.
B. The right half of the graph is the mirror image of the left half in approximately the line x = 3. The expected revenue at a price of n more or n less than 3 dollars per unit will be the same.
C. There is no symmetry.D. The right half of the graph is the mirror image of the left half in
approximately the line y = 1000. The expected price at a revenue of n more or n less than 1000 dollars per unit will be the same.
SALES The graph shows the expected revenue y as a function of the price per unit x. Describe and interpret any symmetry.
Interpret Extrema and End Behavior
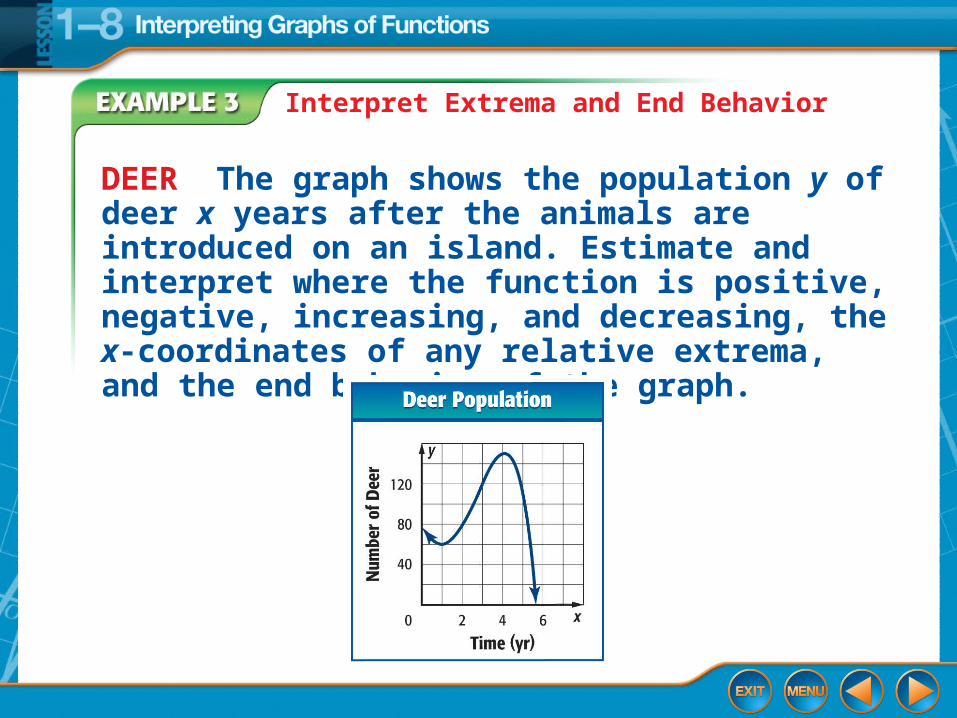
DEER The graph shows the population y of deer x years after the animals are introduced on an island. Estimate and interpret where the function is positive, negative, increasing, and decreasing, the x-coordinates of any relative extrema, and the end behavior of the graph.
Interpret Extrema and End Behavior
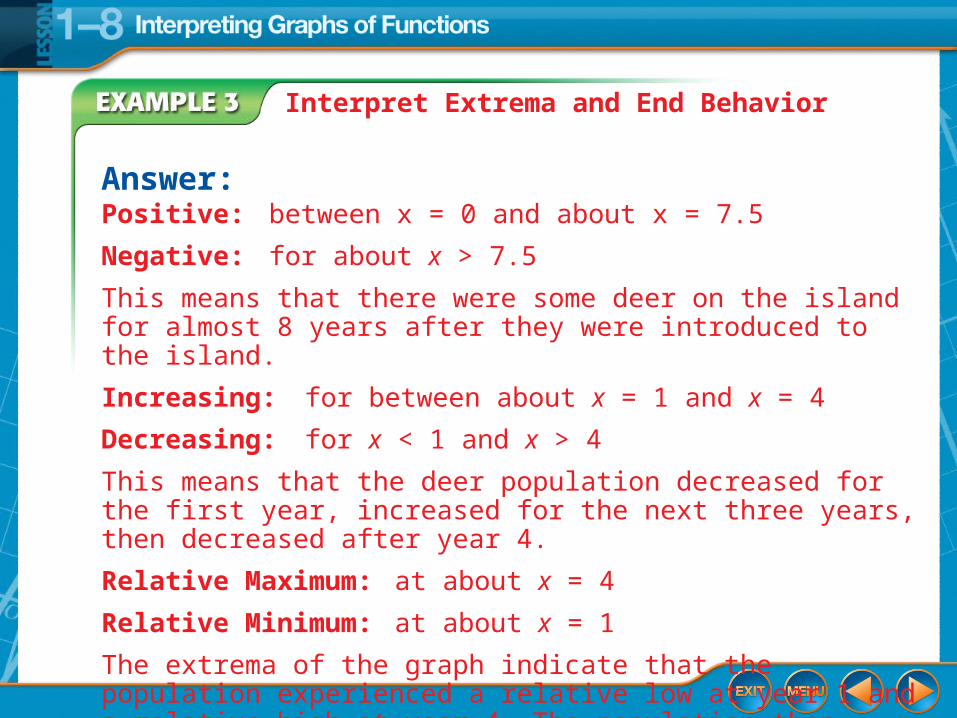
Answer:Positive: between x = 0 and about x = 7.5
Negative: for about x > 7.5
This means that there were some deer on the island for almost 8 years after they were introduced to the island.
Increasing: for between about x = 1 and x = 4
Decreasing: for x < 1 and x > 4
This means that the deer population decreased for the first year, increased for the next three years, then decreased after year 4.
Relative Maximum: at about x = 4
Relative Minimum: at about x = 1
The extrema of the graph indicate that the population experienced a relative low at year 1 and a relative high at year 4. The population then decreased to 0 after year 4.
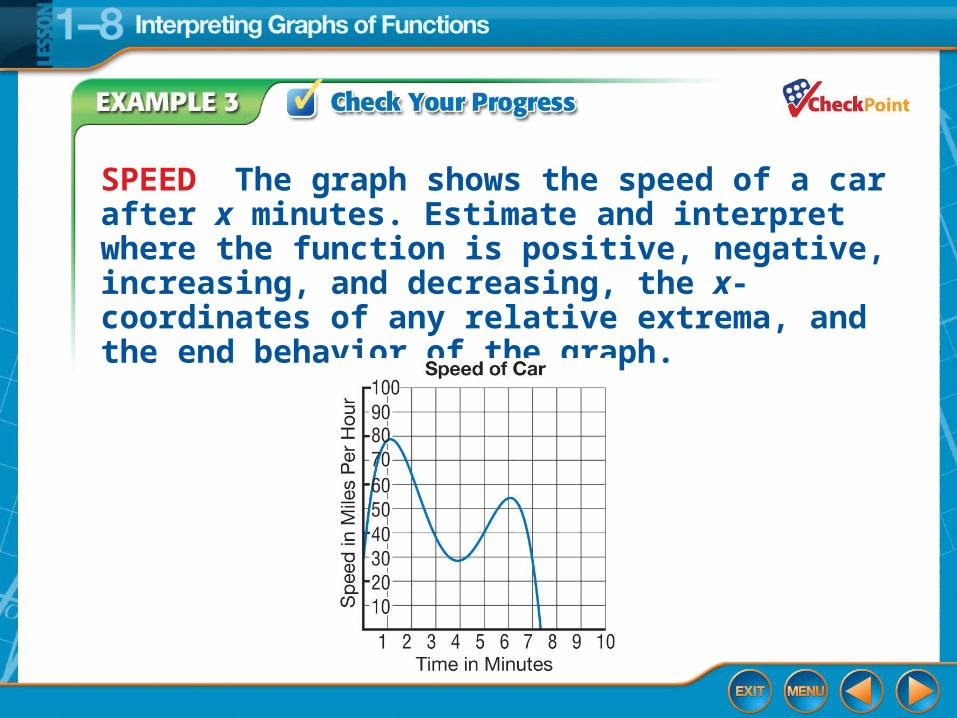
SPEED The graph shows the speed of a car after x minutes. Estimate and interpret where the function is positive, negative, increasing, and decreasing, the x-coordinates of any relative extrema, and the end behavior of the graph.
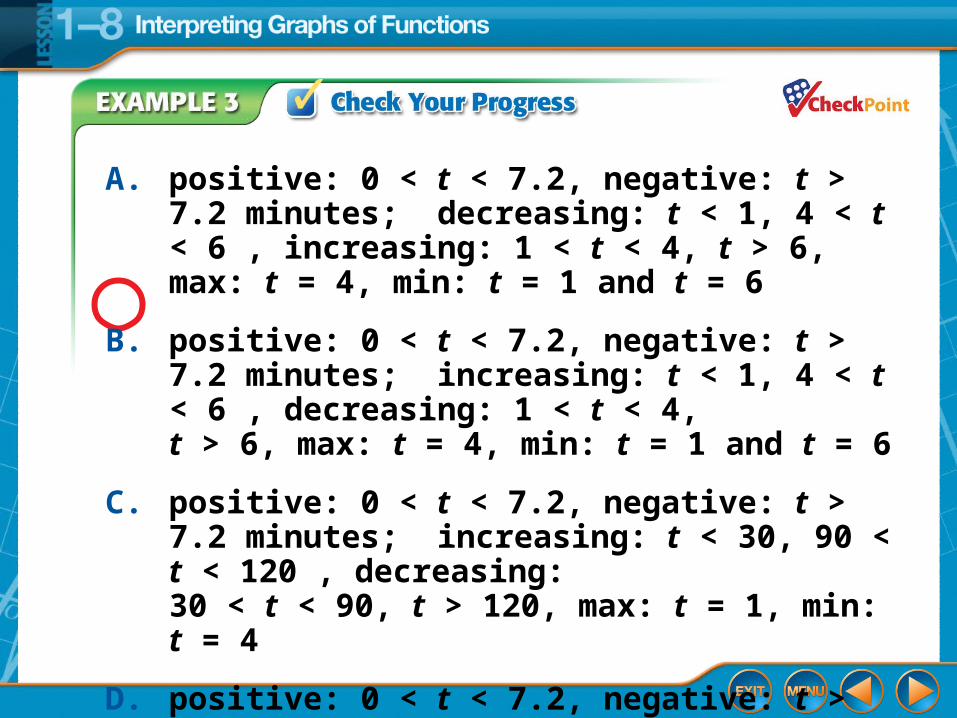
A. positive: 0 < t < 7.2, negative: t > 7.2 minutes; decreasing: t < 1, 4 < t < 6 , increasing: 1 < t < 4, t > 6, max: t = 4, min: t = 1 and t = 6
B. positive: 0 < t < 7.2, negative: t > 7.2 minutes; increasing: t < 1, 4 < t < 6 , decreasing: 1 < t < 4,
t > 6, max: t = 4, min: t = 1 and t = 6
C. positive: 0 < t < 7.2, negative: t > 7.2 minutes; increasing: t < 30, 90 < t < 120 , decreasing: 30 < t < 90, t > 120, max: t = 1, min: t = 4
D. positive: 0 < t < 7.2, negative: t > 7.2 minutes; increasing: t < 1, 4 < t < 6 , decreasing: 1 < t < 4,
t > 6, max: t = 1 and t = 6, min: t = 4
Summary
Answer the essential question in complete sentences.
What are the characteristics of a function?What are the characteristics of a function?
• STUDY QUESTIONS: Write 3-5 study questions in the left column to help study and explain the notes.