u ser n eeds and s atisfaction s urvey 2014. objectives of a user’s needs survey: for planning...
TRANSCRIPT

USER NEEDS AND SATISFACTION SURVEY 2014
OUTCOMES FROM ASEAN’S SURVEY ON USER’S NEEDS
USER NEEDS AND SATISFACTION SURVEY 2014
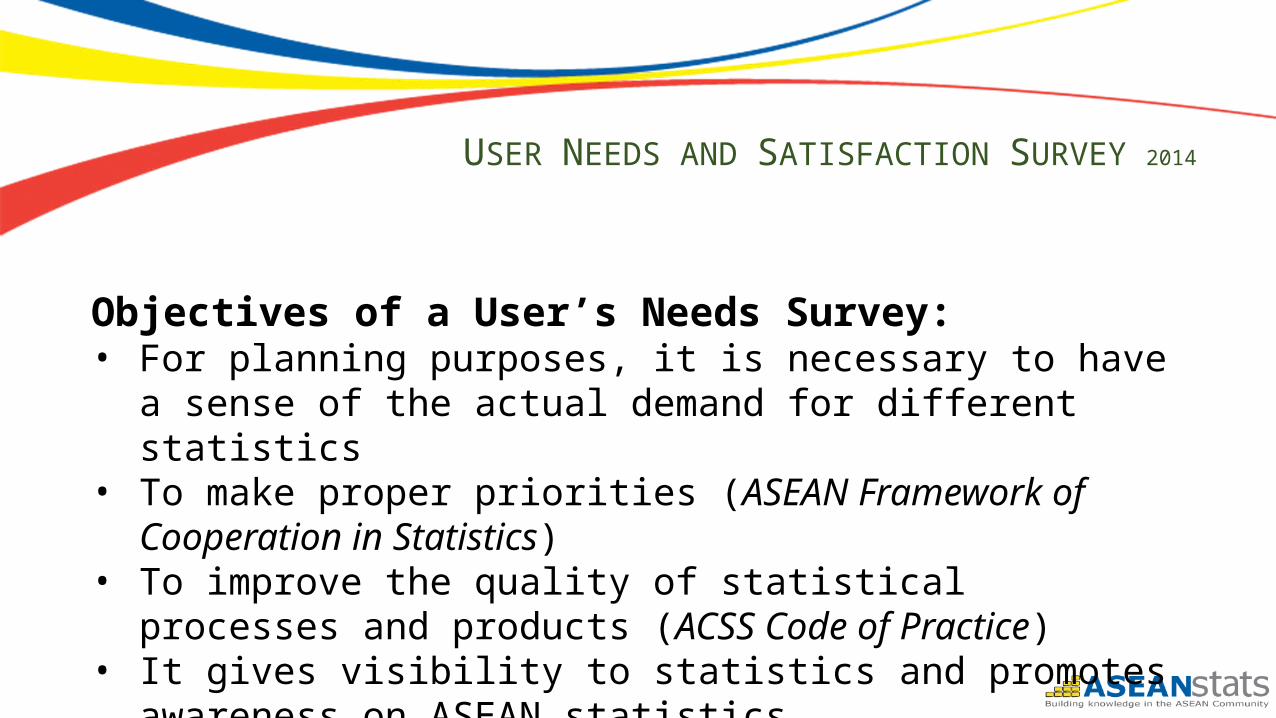
Objectives of a User’s Needs Survey:• For planning purposes, it is necessary to have a sense of the actual
demand for different statistics• To make proper priorities (ASEAN Framework of Cooperation in
Statistics)• To improve the quality of statistical processes and products (ACSS
Code of Practice)• It gives visibility to statistics and promotes awareness on ASEAN
statistics

USER NEEDS AND SATISFACTION SURVEY 2014
In 2012, the ASEANstats has conducted 2 User Needs’ Survey (pilot survey in April and July) with assistance from the EU-ASEAN Statistical Capacity Building (EASCAB) Programme.
In 2014 May, the ASEANstats conducted another User Needs’ Survey
Sent through email

USER NEEDS AND SATISFACTION SURVEY 2014
Start/End Dates Sampling Frame Number of Respondents
16 -31 March 2012 37 14
13 - 31 August 2012 184 15
16 April – 16 May 2014 232 29

USER NEEDS AND SATISFACTION SURVEY 2014
April 2012: ASEAN Secretariat Divisions• GDP and demography statistics were the most frequently used
information; with data on agriculture as the least.• Email requests from ASEANstats was the easiest way to obtain
the data, followed by publications/ASEANstats web page/ international organizations’ websites
• Inputs to meeting report/materials was the major use of the data, followed by analysis of current developments and research purposes

USER NEEDS AND SATISFACTION SURVEY 2014
April 2012: ASEAN Secretariat Divisions• GDP was the most important ASEAN statistics, followed by FDI,
population, and poverty while data on ICT was the least important.
• At national level was the most preferred level of data details • Through the website was the best means of dissemination while
press release was least used.

USER NEEDS AND SATISFACTION SURVEY 2014
April 2012: ASEAN Secretariat Divisions• Reliability received the highest marks in terms of quality
measure of ASEAN statistics while availability got the lowest marks.
• Population and IMTS topped the assessment of existing service from ASEANstats while SITS was at the bottom.

USER NEEDS AND SATISFACTION SURVEY 2014
Three Surveys in July-August 2012:• For general data users and media (there exists a list of ASEAN
bodies with actual or potential users)• For data producers (those who have participated in working
groups and task forces during the last three years ought to be included)
• At the national level there are focal persons at focal points

USER NEEDS AND SATISFACTION SURVEY 2014
Three Surveys in July-August 2012• The survey questions draw the kinds of services and products that
are expected from ASEANstats• And invite suggestions on ways that may contribute to the
strengthening of and efficient use of resources at the ASEANstats• To improve journalists’ knowledge about ASEAN statistics and
their need for statistics. Media plays an important role in the spread of information to decision makers and the public.
USER NEEDS AND SATISFACTION SURVEY 2014
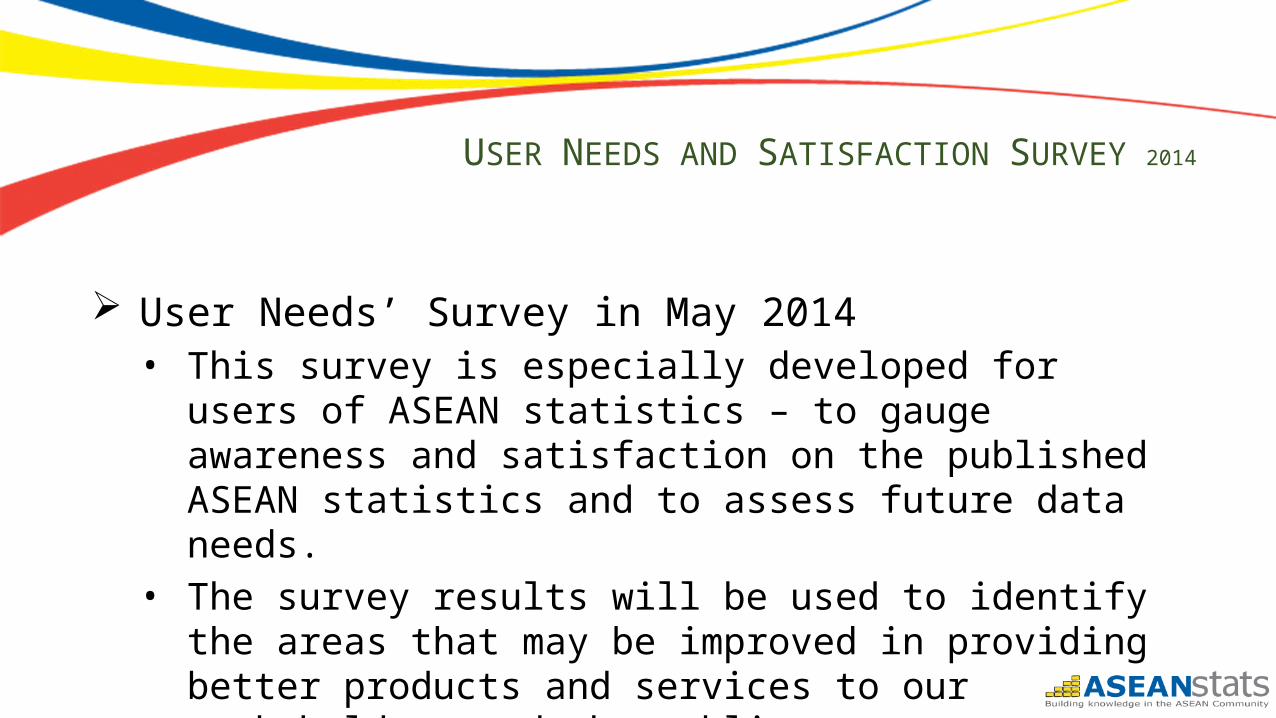
User Needs’ Survey in May 2014• This survey is especially developed for users of ASEAN statistics –
to gauge awareness and satisfaction on the published ASEAN statistics and to assess future data needs.
• The survey results will be used to identify the areas that may be improved in providing better products and services to our stakeholders and the public.
USER NEEDS AND SATISFACTION SURVEY 2014
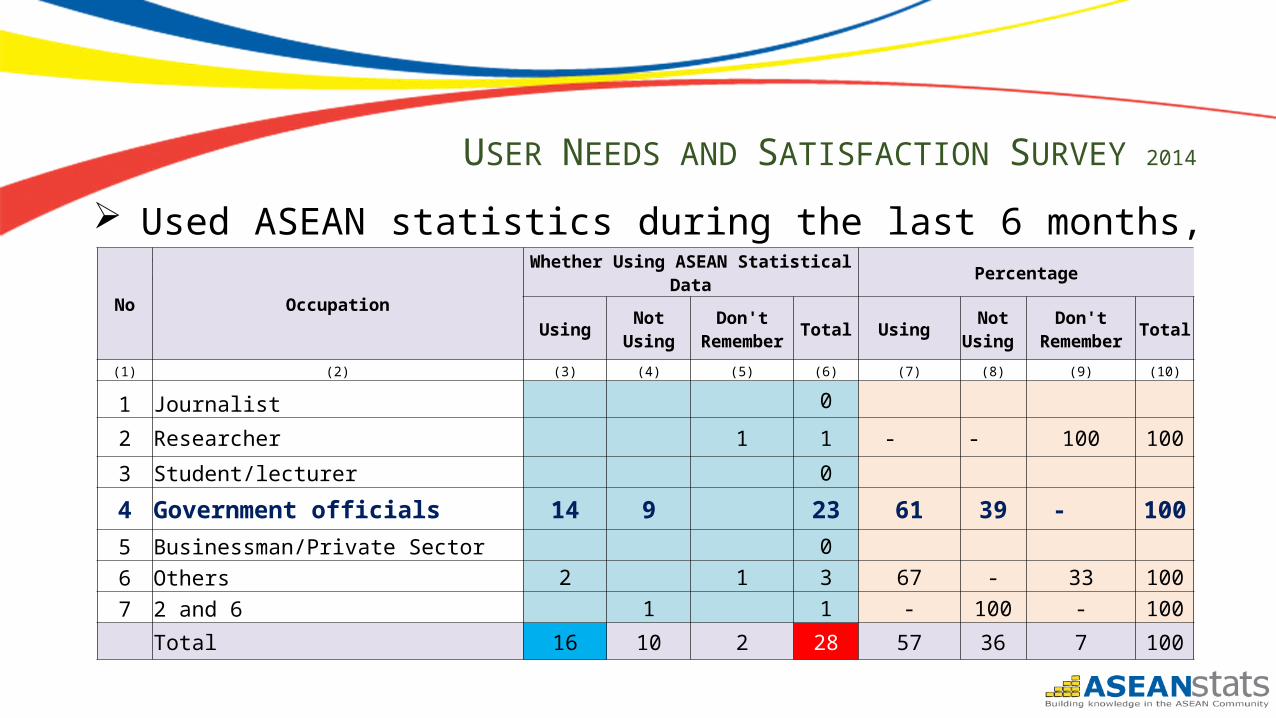
Used ASEAN statistics during the last 6 months, by occupation
No Occupation
Whether Using ASEAN Statistical Data Percentage
Using Not Using Don't Remember Total Using Not
Using Don't
Remember Total
(1) (2) (3) (4) (5) (6) (7) (8) (9) (10)
1 Journalist 0
2 Researcher 1 1 - - 100 100
3 Student/lecturer 0
4 Government officials 14 9 23 61 39 - 100
5 Businessman/Private Sector 0
6 Others 2 1 3 67 - 33 100
7 2 and 6 1 1 - 100 - 100
Total 16 10 2 28 57 36 7 100

USER NEEDS AND SATISFACTION SURVEY 2014
Using ASEAN statistics, by domainNo Fields Percentage(1) (2) (3)
1 Pop & Migration only 13
2 Pop & migration + education 25
3 Pop & migration + Labour 13
4 Pop & migration + education + Labour 13
5 Pop & migration + education + Health 13
6 Pop & migration + education + Labour + Health 25
Sub-total 1: using demographic statistics 100
7 GDP only 57
8 GDP + exchange rates 14
9 GDP + Prices 14
10 GDP + int rates + exch rates + Fin stat + Prices 14
Sub-total 2: using macro economic statistics 100
11 Manufacturing only 25
12 Tourism only 25
13 Manufacturing + Tourism 13
14 Transport + Tourism 25
15 Manufacturing + Transport + Tourism 13
Sub-total 3: Sectoral statistics 100
16 FDIS only 2517 IMTS + FDIS 17
18 SITS only 8
19 IMTS + SITS 8
20 FDIS + SITS 8
21 IMTS + FDIS + SITS 33
Sub-total 4: International Trade and BOP 100
22 At least poverty 33
23 Poverty + MDGs 67
24 Sub-total 5: Environment and multi-domain 100
No Fields Percentage(1) (2) (3)
USER NEEDS AND SATISFACTION SURVEY 2014
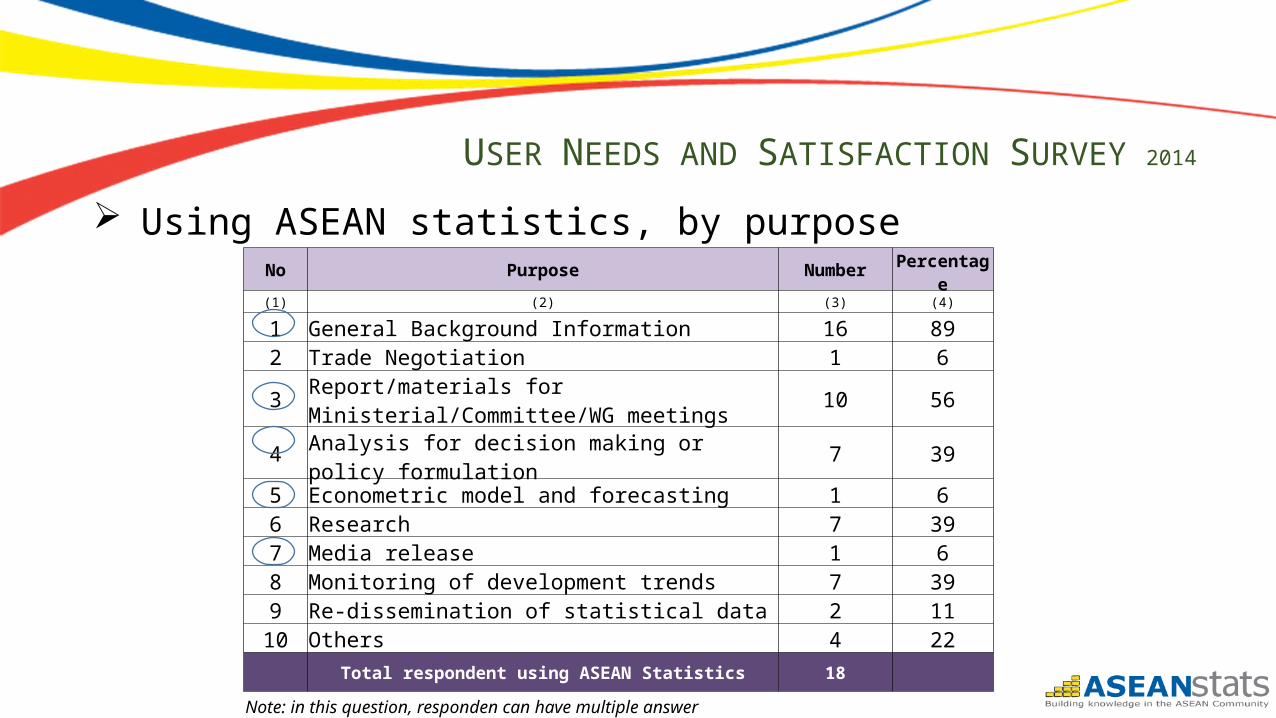
Using ASEAN statistics, by purposeNo Purpose Number Percentage
(1) (2) (3) (4)
1 General Background Information 16 892 Trade Negotiation 1 6
3 Report/materials for Ministerial/Committee/WG meetings
10 56
4 Analysis for decision making or policy formulation 7 395 Econometric model and forecasting 1 66 Research 7 397 Media release 1 68 Monitoring of development trends 7 399 Re-dissemination of statistical data 2 11
10 Others 4 22
Total respondent using ASEAN Statistics 18
Note: in this question, responden can have multiple answer

USER NEEDS AND SATISFACTION SURVEY 2014
Using ASEAN statistics, by means of disseminationNo Sources Number Percentage(1) (2) (3) (4)
1 ASEC publication 2 11.8
2 ASEC webpage 5 29.4
3 ASEC media release+ webpage 1 5.9
4 ASEC publication + webpage 5 29.4
5 ASEC media release + publication + webpage 1 5.9
6 ASEC Desk Officer only 1 5.9
7 ASEC media release+publication+webpage+Desk Officer 1 5.9
8 ASEC media release+webpage+desk officer+ others 1 5.9
Total using ASEAN statistical data 17 100

USER NEEDS AND SATISFACTION SURVEY 2014
Using ASEAN statistics, by preferred means of disseminationNo Means of data dissemination Number Percentage(1) (2) (3) (4)
1 Printed+key stat tables 3 172 interactive database 2 113 Key stat tables + interactive database 2 114 printed+key stat tables+ interactive database 3 175 Printed+press release+key stat tables+interactive database 2 116 CD-Rom 1 67 Printed+keystat tables+CD-rom 1 68 interactive database + CD-rom 1 69 Printed+press release+interactive database+CD-rom 1 6
10 Interactive database+ others 1 611 Printed+Press release+Keystat tables+Interactive database+ others 1 6
TOTAL 18 100

USER NEEDS AND SATISFACTION SURVEY 2014
No Opinion on the accessibility Number Percentage
(1) (2) (3) (4)
1 Very easy 1 5.9
2 Easy 13 76.5
3 Not Easy 3 17.6
4 Very difficult & confusing
TOTAL 17 100
Accessibility to the ASEAN statistics webpage

USER NEEDS AND SATISFACTION SURVEY 2014
Using ASEAN statistics, by the level of general satisfaction
No Level of General Satisfaction Number Percentage
(1) (2) (3) (4)
1 Fully meets the needs 3 17
2 Partially meets the needs 15 83
3 Barely meets the needs
4 Not at all meets the needs
TOTAL 18 100

USER NEEDS AND SATISFACTION SURVEY 2014
Respondents, by reasons why needs were not met
No Reasons needs are not met Number Percentage
(1) (2) (3) (4)
1 Details not enough only 8 57
2 Details not enough+ outdated 1 7
3 Details not enough+insufficient time series 1 7
4 Data gaps 1 7
5 Insufficient time series+data gaps 2 14
6 Details not enough+Outdated+Insufficient time series+data gaps
1 7
TOTAL 14 100

USER NEEDS AND SATISFACTION SURVEY 2014
Respondents, by quality ratings and fields of statistics
No. FieldsAccessibility Timelines Comparability Relevance
average1 Population and Migration 4.0 3.3 3.4 3.92 Labour 4.0 2.9 3.5 4.03 Education 4.1 2.9 3.4 3.84 Health 4.1 2.9 3.6 3.75 Macro Economic Statistics 4.4 3.6 3.7 4.06 GDP 4.0 3.4 3.7 4.17 Interest Rate 3.9 3.3 3.4 3.98 Exchange rates 4.0 3.3 3.5 4.29 Financial Statistics 3.9 3.1 3.4 3.9
10 Prices 4.0 3.3 3.5 4.011 Manufacturing 3.5 3.2 3.1 3.412 Transport 3.6 3.3 3.1 3.313 Tourism 4.4 3.4 3.9 4.114 IMTS 4.0 3.5 3.8 4.015 FDIS 4.0 3.5 3.7 4.016 SITS 3.8 3.3 3.6 3.817 Poverty 4.0 3.2 3.4 3.718 MDGS 4.0 3.3 3.2 3.9

USER NEEDS AND SATISFACTION SURVEY 2014
Respondents, by satisfaction on the level of details
No FieldsPercentage
Highly Moderately Barely Not at all TOTAL(1) (2) (3) (4) (6) (7) (8)
1 Population&migration 20.0 70.0 10.0 1002 Labour 12.5 75.0 12.5 1003 Education 11.1 77.8 11.1 1004 Health 12.5 75.0 12.5 1005 GDP 33.3 66.7 1006 Interest rates 85.7 14.3 1007 Exchange rates 85.7 14.3 1008 Financial statistics 14.3 71.4 14.3 1009 Prices 14.3 71.4 14.3 100
10 Manufacturing 12.5 87.5 10011 Transport 100 10012 Tourism 100 10013 IMTS 9.1 72.7 18.2 10014 FDIS 33.3 66.7 10015 SITS 77.8 22.2 10016 Poverty 25.0 62.5 12.5 10017 MDGs Indicators 12.5 75.0 12.5 100

USER NEEDS AND SATISFACTION SURVEY 2014
Users’ expectations of ASEAN statistics in future publications
No ASEAN Statistics in Future Publications Number Percentage
(1) (2) (3) (4)
1 Aggregates at ASEAN levels 9 50
2 National level data 8 44
3 Longer time series 8 44
4 Additional indicators 5 28
5 Most detailed level that confidentiality allows 7 39
6 Breakdown by partner country, to the extent possible 11 61
7 Breakdown by demographic characteristics, to the extent possible 5 28
8 Use of maps or spatial data analysis 7 39
9 Better presentation of graphs and tables 6 33
10 Further data interpretation/analysis/policy context 12 67
11 Improved data comparability 14 78
12 Metadata (information about concept, definition, methodology, etc) 11 61
13 Glossary 3 17
14 Format for downloading: pdf, excel, csv, etc 2 11
15 Others 2 11
Total respondents using ASEAN statistics 18

USER NEEDS AND SATISFACTION SURVEY 2014
Needs for International Standard Classifications (ISIC, SITC, HS, AHTN), and by Characteristics of Respondents
No Characteristics Need Don't need(1) (2) (3) (4)
1 Journalist 2 Researcher 13 Student/lecturer 4 Government officials 10 25 Businessman/Private Sector 6 Others 2 1
Total 12 4
USER NEEDS AND SATISFACTION SURVEY 2014
Overall Assessments• It is essential to identify gaps in national and regional statistical
processes, and inconsistencies that may exist between national and regional requirements. Hence, coordinated actions to strengthen statistical systems would be important to resolve any inconsistencies and gaps found.
• It is essential to speed up the harmonization process and develop more statistics and indicators.
• The provision of statistics should be demand driven. There are emerging areas of priority and interests in ASEAN such as on connectivity.

USER NEEDS AND SATISFACTION SURVEY 2014
Conclusions• No reliable conclusions can be drawn from this small number of
answers. However, there are some indications on the strengths and weaknesses in ASEAN statistics.
• With more and updated data on the website availability of ASEAN statistics will increase if the harmonization work is extended to more domains of statistics there will also be more of visible improvements.
• The results from this survey will to some extent be used as inputs for prioritising the resources for ASEANstats’ different activities for both short-term and long-term planning.
USER NEEDS AND SATISFACTION SURVEY 2014
Recommendations• The survey ought to be extended to cover more
government officials from NSOs of the AMSs, Central Banks and similar institutions.
• It may be a good idea to have a follow up with some of those who filled in the questionnaire and ask for suggestions for improvements.
• No big changes of the questionnaire seem to be necessary

USER NEEDS AND SATISFACTION SURVEY 2014
Recommendations• The REXDBS should be improved as the ASEAN
Secretariat’s central database platform integrating more statistical domains to allow wider accessibility by data users and public.
• Enhancement of ASEANstats webpage to include registration of visitors/number of hits, to help identify profile of major data users.

USER NEEDS AND SATISFACTION SURVEY 2014
http://www.asean.org/resources/
Thank you for your kind attention!