u niversitÀ p olitecnica delle m arche …docs.dises.univpm.it/web/quaderni/pdf/388.pdfdipartimento...
TRANSCRIPT

Dipartimento di Scienze Economiche e Sociali
UNIVERSITÀ POLITECNICA DELLE MARCHE
DISSECTING THE IMPACT OF INNOVATION ON
EXPORTING IN TURKEY
Alessia Lo Turco∗, Daniela Maggioni§
QUADERNI DI RICERCA n. 388ISSN: 2279-9575
January 2013

Comitato scientifico:
Renato BalducciMarco GallegatiAlberto NiccoliAlberto Zazzaro
Collana curata da:Massimo Tamberi

Abstract
Making use of an original firm level dataset, we explore the causal impact ofinnovation on the manufacturing firm export activity in Turkey. We modelprocess and product innovation as separately - through cost savings and prod-uct quality improvements, respectively - affecting the firm profitability and,consequently, the firm export propensity. This modeling choice highlightsheterogeneous effects across high and low income destination markets. Ina Multiple Propensity Score Matching framework, we, then, test the impactof each innovation activity and of their joint adoption. We find that only thelatter fosters the first time entry into exporting, when the destination mar-ket is high income. Nevertheless, innovation positively affects the firm exportpropensity. New product introduction is more rewarding than process inno-vation, especially for exporting to low income economies. Process innovation,though, strengthens the positive role of product innovation for exporting tomore advanced markets.
JEL Class.: O31, D22, F10, F14Keywords: export, product innovation, process innovation,
Turkey
Indirizzo: Dipartimento di Scienze Economiche e So-ciali, Università Politecnica delle Marche;[email protected]; [email protected].

Contents
1 Introduction and background 1
2 Theoretical framework 32.1 Demand . . . . . . . . . . . . . . . . . . . . . . . . . . . . . . . . 42.2 Supply . . . . . . . . . . . . . . . . . . . . . . . . . . . . . . . . . 4
3 The data 93.1 The Data Sources . . . . . . . . . . . . . . . . . . . . . . . . . . . 93.2 The sample and the descriptive evidence . . . . . . . . . . . . . 12
4 Empirical strategy 14
5 Results 17
6 Concluding Remarks 20
Appendix 25
A Additional Tables and Figures 25

Dissecting the impact of innova-tion on exporting in Turkey
Alessia Lo Turco∗, Daniela Maggioni§
∗ Corresponding Author. Università Politecnica delle Marche, Departmentof Economics and Social Sciences; Piazzale Martelli 8, 60122 Ancona - Italy.Tel.: +39-071-2207250. E-mail: [email protected].
§ Università Politecnica delle Marche, Department of Economics and So-cial Sciences; Piazzale Martelli 8, 60122 Ancona - Italy.Tel.: +39-071-2207250. E-mail: [email protected].

1 Introduction and background
The mechanisms behind firm competitiveness and international success havealways drawn the attention of a large part of economics and business litera-ture. In this respect, firm innovation activity may constitute one of the mainchannels fueling the firm entry in foreign markets. On one hand, the develop-ment of new products, better tailored for the customers’ preferences in desti-nation market, may ease the firm access to such market. On the other hand,the introduction of new production processes may importantly reduce theoperational costs and improve the firm ability to face export sunk costs andcross the national borders.
Understanding the returns to innovation in terms of the firm activity inforeign markets turns to be particularly relevant from an emerging economyperspective. Innovation, indeed, is particularly costly for developing coun-tries, due to their limited human capital and technology endowment. How-ever, for these economies the export market represents an unprecedented op-portunity, as it favours the exploitation of scale economies, technology trans-fers and new learning possibilities. As a consequence, it is fundamental toascertain whether the innovative effort undertaken by firms is fruitful in pro-moting their presence abroad. We, then, contribute to this topic by dissectingthe role of product and process innovation and of their joint adoption on themanufacturing firm export propensity in Turkey.Previous evidence is mainly focused on developed economies and has in gen-eral shown a positive causal impact of innovation on exporting.1 Before Melitz’s(2003) contribution on firm heterogeneity, empirical literature had shown apositive direct relationship between product innovation and exporting (Ku-mar and Siddharthan, 1994; Wakelin, 1998; Sterlacchini, 1999, 2001; Basile,2001; Roper and Love, 2002). Recently, instead, the widespread evidence onthe existence of important productivity differences between exporters andnon exporters in the period preceding the foreign market entry (Wagner, 2007)has stimulated a growing stream of literature aimed at analysing the sourcesof such differences. Some papers, then, are rethinking the relationship be-tween the firm innovation effort and its export performance. In this line, Cas-siman and Golovko (2011) for Spain have tested and verified the hypothesisthat product innovation has both a direct and mediate - through productivity- effect on exporting. However, other evidence on the same country showsthat productivity still matters for non-innovators, so that other channels af-fect productivity out of product innovation (Cassiman et al., 2010). Caldera
1Van Beveren and Vandenbussche (2010) constitute an exception as, on Belgian data, theyfind that innovation is actually an anticipated effect of exporting.
1

(2010) reverses this view and, building on Bustos (2011), models more pro-ductive firms as self selecting into innovation and innovators as being morelikely to become exporters, due to the marginal cost reduction effect of inno-vation. Her empirical findings confirm once again the important role of in-novation for the Spanish firm export probability. However, the heterogeneityacross product and process innovation strategies has been rather neglected inthe literature. The only noticeable exception is represented by Becker and Eg-ger (2009), who, on the German data from business and innovation surveys,show that such a distinction is rather important as they find the dominantimportance of product with respect to process innovation, which only mat-ters when adopted in conjunction of product innovation.
Within this framework, our theoretical view of the nexus between inno-vation and exporting is close to Caldera (2010), as we model more productivefirms self-selecting into innovation and, in turn, innovation enhancing the ex-port probability. Our empirical approach, instead, is similar to the one under-taken by Becker and Egger (2009): within a Multiple Propensity Score Match-ing (MPSM) framework, we treat process and product innovation as two dif-ferent strategies that, when adopted alone or in conjunction, may have differ-ent effects on the firm export probability. However, our analysis presents sev-eral original contributions. First, building on the evidence on heterogeneousdeterminants and impacts of the two innovation strategies, differently fromCaldera (2010), we model product and process innovation as affecting thefirm profitability through two different channels. Whereas product innova-tion positively affects the firm product quality, process innovation negativelyaffects its marginal costs. Our modeling strategy permits to highlight the rea-son why the two innovation activities are often undertaken together and con-stitutes the theoretical motivation for our empirical approach. Second, ourfocus is on an emergent country. It is interesting to investigate whether theimportance of firm innovative efforts for the success in the export market isdifferent in this context, compared to a developed country one. Whereas thenotion of process innovation is rather similar in the two settings, a large frac-tion of product innovations in a developing economy consist of already exist-ing products in the market that are new only to the firm. In this respect, it isfundamental to assess the relevance of such type of innovations in terms ofreturns from the export activity and to compare the findings to the existingevidence on developed economies. Third, we analyse the role of innovationfor the first time entry and for the survival in the foreign market. Fourth, dif-ferently from Becker and Egger (2009), we split the firm export status, i.e. ouroutcome of interest, according to the income level of the destination marketin order to test whether entry in heterogeneous markets with different prefer-
2

ences for quality (Hallak, 2006, 2010) and different average production costsis related to heterogeneity in the innovation strategy. Fifth, from the bulk offirm exports we neglect the so-called Carry-Along Trade (CAT) activity and fo-cus on the manufacturing firm exports of own products (Bernard et al., 2012).This choice follows the need to isolate the innovation effect on the firm’s abil-ity to sell its own products abroad, as innovation deeply affects the firm ownproduction technology. Finally, to the best of our knowledge, it is the first timethat Turkish data are used to test the causal impact of innovation on export-ing. In particular, our sample is obtained by matching several data sourcesand constitutes an original dataset never used before for the investigation ofthis topic for Turkey.
The work is structured as follows: the next section presents our theoreti-cal framework; section 3 introduces the data sources and some evidence onproduct and process innovation for Turkish manufacturing; section 4 presentsthe empirical strategy; section 5 shows the main results from our analysis andsection 6 concludes.
2 Theoretical framework
To model the impact of innovation on the export propensity of Turkish firmswe rely on a simple theoretical framework which adapts the one in Bustos(2011), so as extended by Caldera (2010). However, we depart from them ina number of ways in modeling both the demand and supply. Firstly, we sep-arately model process and product innovation and their joint adoption. Sec-ondly, while Bustos (2011) models the endogenous firm choice of technologythat follows to trade liberalisation, we aim at modeling the impact of adopt-ing an innovation on the firm export propensity. In this respect, here we offera partial equilibrium approach, so we will abstract from dealing with the in-dustry dynamics and we will assume the industry characteristics as fixed andunchanged with respect to the choice of the single firm. As in Caldera (2010),we start showing that more productive firms engage in innovation and, fromthis, we demonstrate that innovators are more likely to export. However, ourmain contribution relies in the different channels we exploit for product andprocess innovation which allow for a richer pattern of possibilities in the rela-tionship between innovation and exporting. In a standard monopolistic com-petition framework (Dixit and Stiglitz, 1977; Melitz, 2003), our main novelty isto model product and process innovation as two separate strategies whichmay also be adopted in conjunction. This, indeed, is also the starting pointof our empirical strategy that motivates the adoption of a MPSM framework.In our view, both product and process innovation positively affect variable
3

profits in face of an additional fixed cost to sustain for the adoption of theinnovation strategy. However, whereas process innovation positively affectsvariable profits through the reduction of the marginal production cost, theintroduction of a new product allows the firm to switch to the production of ahigher quality variety and to earn higher revenues and variable profits.2 Thisframework shows, in line with Caldera (2010), that larger and more productivefirms are more likely to innovate and that innovators are more likely to export.Also, from the distinction between the two different channels through whichinnovation affects profits, we will show that among innovators, those firmsundertaking both product and process innovators are more likely to export,compared to one-way innovators.
2.1 Demand
To model the impact of innovation on the firm export behaviour, we take ashypothesis that consumer’s preferences can be represented by a CES utilityfunction over different varieties ω of good X which, as in the quality laddermodel by Grossman and Helpman (1991, 1993) differ in their quality contentq. The representative consumer has income M and, given prices maximisesutility
U =
[∫ω∈Ω
q(ω)ρx(ω)ρdω
] 1ρ
(1)
From the equation, the elasticity of substitution among varieties is σ =1
(1−ρ)and the demand for the generic variety ωj is:
x(ωj) =P−σωjP 1−σM (2)
with Pωj =pωjqωj
denoting the quality adjusted price of variety ωj , p denoting
the unadjusted price and P denoting the aggregate price index.
2An extensive literature deals with the relationship between product quality and exportsat the firm level. As an example Verhoogen (2008) models the firm quality upgrading choicein a framework with quality differentiation in production and heterogenous preferences forquality in the North and the South. More recently, Crinò and Epifani (2012) analyse the inter-play between cross-firm heterogeneity in product quality and cross-country heterogeneity inquality consumption. In both settings the quality choice is endogenous and depends on ex-port market characteristics and shocks (e.g. a devaluation). Here our aim is not to model thechoice of quality, but to show how higher product quality can enhance the export probability.
4

2.2 Supply
To describe the supply side of this simple theoretical sketch, we follow Bus-tos (2011) and the adaptation provided by Caldera (2010) to model the im-pact of innovation on the firm export status. However, we depart from themin that we separately model process and product innovation and their jointadoption. As in Melitz (2003), we assume that firms differ in their productiv-ity level φi , whereas they share the same unit variable cost labeled as c. Themanufacturing industry operates in monopolistic competition so that for allvarieties the pricing strategy can be resumed by means of a markup σ
σ−1over
the marginal cost, which, then, is assumed to be cφi
.To enter the manufacturing industry a firm pays a fixed entry cost and
draws its productivity from a cumulative distribution function. After observ-ing its productivity, a firm decides whether to exit or to stay and produce. Inthe latter case, according to its productivity level the firm may:
• Produce by means of the standard technology, which requires a fixedproduction cost, f , and grants revenues
r0(φ) = [σ − 1
σ
φq(ω)
cP ]σ−1M (3)
and profits
Π0(φ) =r0(φ)
σ− f (4)
• Introduce a process innovation, which requires an additional fixed costfPc, reduces the variable unit cost to cPc < c and grants revenues
rPc(φ) = [σ − 1
σ
φq(ω)
cPcP ]σ−1M (5)
and profits
ΠPc =rPc(φ)
σ− f − fPc (6)
• Introduce a product innovation, thus switching to the production of abetter quality variety, which requires an additional fixed cost fPd andgrants revenues
rPd(φ) = [σ − 1
σ
φqPd(ω)
cP ]σ−1M with qPd(ω) > q(ω) (7)
5

and profits
ΠPd(φ) =rPd(φ)
σ− f − fPd (8)
• Introduce both a process and product innovation which, under the sim-plifying assumption that the new variable cost is the same as under pro-cess innovation only, grants revenues
rPdPc(φ) = [σ − 1
σ
φqPd(ω)
cPcP ]σ−1M with qPd(ω) > q(ω) (9)
and profits
ΠPdPc(φ) =rPdPc(φ)
σ− f − λ(fPd + fPc) with 0 < λ ≤ 1 (10)
The assumption on λ derives from the possible existence of a strong comple-mentarity between process and product innovation (Van Beveren and Van-denbussche, 2010). The majority of innovators (61% in our data) are actuallyinvolved in both activities.
The innovation decision - The firm, then, decides to introduce a processinnovation if (
1
cσ−1Pc
− 1
cσ−1
)[σ − 1
σφq(ω)P ]σ−1M > fPc (11)
a product innovation if
[qPd(ω)σ−1 − q(ω)σ−1
](σ − 1
σ
φ
cP
)σ−1
M > fPd (12)
and both a product and a process innovation if(qPd(ω)
cPc
)σ−1
−(q(ω)
c
)σ−1
[σ − 1
σφP ]σ−1M > λ(fPd + fPc) (13)
Then, the probability to engage in product innovation is driven by qualityupgrading whereas the probability to engage in process innovation is drivenby cost saving. In any case, a higher productivity level delivers a higher proba-bility to engage in innovation (Caldera, 2010). Given all this framework, an in-teresting point, that follows from our assumption on the different operationalchannels of process and product innovation, is that, under the hypothesis of
6

strong complementarity between the two types of innovation (λ sufficientlyless than 1), it is in general more likely that firms undertake them both as thelower marginal cost and the higher quality deliver variable profits higher thanin the single innovation strategy case, whereas the fixed cost of innovation isless than the summation of the two innovation fixed costs.3
The export decision - Now, after the description of the innovation choice,we may turn to the export decision. We make the usual assumption that entryin the export market is costly due to the presence of a fixed export entry cost,fexp
4, and a variable iceberg transport cost τ > 1. The decision to export ornot will be made comparing profits after the entry to profits in the domesticmarket and a firm will export if π∗ + π > π where superscript ∗ indicates thevariable corresponding to the foreign market. A non-innovator will export if
τ (1−σ∗)
σ∗r∗0(φ) > fexp (14)
Firms introducing process innovation will export if
τ (1−σ∗)
σ∗r∗Pc(φ) > fexp (15)
Firms introducing product innovation will export if
τ (1−σ∗)
σ∗r∗Pd(φ) > fexp (16)
3Taking the difference between equation 10 and 6we get:
πPdPc − πPc =rPdPc(φ)
σ− rPc(φ)
σ+ fPc(1− λ)− λfPd
while, taking the difference between 10 and 8 we obtain:
πPdPc − πPd =rPdPc(φ)
σ− rPd(φ)
σ+ fPd(1− λ)− λfPc
These expressions hint at the introduction of one innovation strategy as favouring theadoption of the other one, compared to one-way innovators.
4This cost is usually higher for the first time entry, as sunk costs need to be born whenentering foreign markets for the first time. Nevertheless, if entry costs depend on the firmdegree of market penetration it may well be the case that they increase in subsequent years,due to the firm growing cost of maintaining and expanding market shares in foreign markets(Crinò and Epifani, 2012). If this is the case, innovation might turn more relevant to survivethan to enter an export market for the first time.
7

Finally, firms introducing process and product innovation will export if
τ (1−σ∗)
σ∗r∗PdPc(φ) > fexp (17)
with r∗ representing revenues in the foreign market which depend on for-eign income M∗ and on the foreign aggregate price index P ∗. σ∗ ≥ σ, instead,represents the demand elasticity in the foreign market which is assumed to behigher under the hypothesis of tougher competition abroad than in the do-mestic market (Caldera, 2010). Comparing innovators and non-innovators,it is straightforward to see that innovators are more likely to export, and itis more so for “two-way” innovators. As a matter of fact, the differences be-tween equations 17 and 16 and between equations 17 and the 15 rest on thedifference of variable profits under alternative innovation strategies and theyalways turns to be greater than zero. On the contrary it is not easy to saywhether only product or only process innovation prevail when they are adoptedin isolation, even if they both enhance the firm export probability. The differ-ence between equations 16 and 15 is lower, equal or higher than zero whenqPd(φ)q(φ)
is lower, equal or higher than ccpc
. In other words, when the relative qual-ity improvement is higher than the cost advantage from innovation, the firmexport probability will be enhanced more by product than by process innova-tion. Furthermore, if we assume proportionality between home and foreignmarkets in relative quality and marginal cost and define average foreign qual-ity as q∗ = q(φ)
δand foreign marginal cost as c∗ = δc, with δ > 0, we have that
product innovation is superior to process innovation when
qPd(φ)
q∗− c∗
cPc> 0 (18)
and this difference increases as either q∗ or c∗ decline. This means that prod-uct innovation is more rewarding than process innovation when exporting tolow income partners which display a lower average quality and a lower pro-duction marginal cost. On the contrary, it is relatively less rewarding when ex-porting to high income destination. However, it is worth to mention that en-try costs may differ according to the export location and in particular the thedestination market income level (Arkolakis, 2010; Crinò and Epifani, 2012). Inthis respect, high income markets are tougher to penetrate due to the higheraverage productivity of firms, their higher thickness and the higher preferencefor quality of their consumers. So innovation may be rather determinant tobreak into these markets, while it may not be necessary to access low incomedestinations.
8
Resting on this theoretical model, we aim at testing the following hypoth-esis:
Hypothesis 1: Innovation positively affects the firm export propensity;
Hypothesis 2: Returns from each innovation activity may be heterogeneous,with two-way innovation dominating the single innovation strategies;
Hypothesis 3: Returns from each innovation activity may be heterogeneousaccording to the destination market income level: we expect the contri-bution of product innovation to be more relevant for exporting to low in-come destination and the contribution of process innovation to be morerelevant for exporting to high income destinations.
3 The data
3.1 The Data Sources
As mentioned in the introduction, the data for this study are provided byTurkStat and come from the merge of several sources which are listed anddescribed in the following.
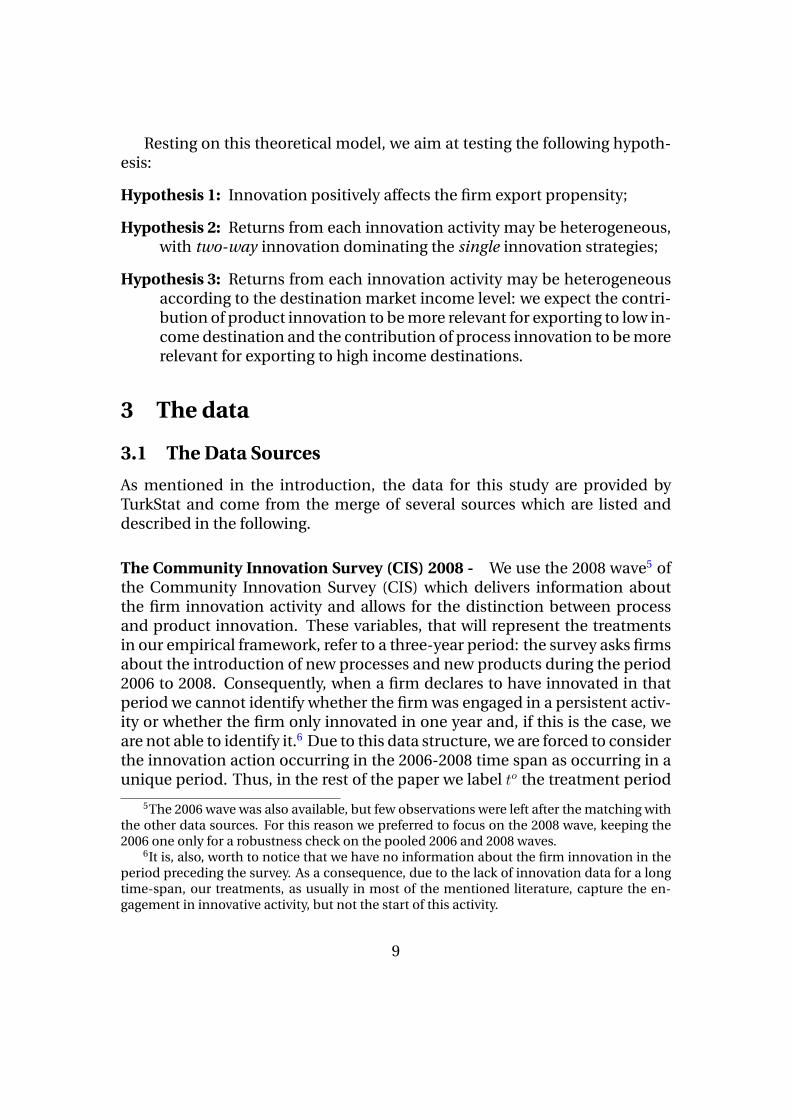
The Community Innovation Survey (CIS) 2008 - We use the 2008 wave5 ofthe Community Innovation Survey (CIS) which delivers information aboutthe firm innovation activity and allows for the distinction between processand product innovation. These variables, that will represent the treatmentsin our empirical framework, refer to a three-year period: the survey asks firmsabout the introduction of new processes and new products during the period2006 to 2008. Consequently, when a firm declares to have innovated in thatperiod we cannot identify whether the firm was engaged in a persistent activ-ity or whether the firm only innovated in one year and, if this is the case, weare not able to identify it.6 Due to this data structure, we are forced to considerthe innovation action occurring in the 2006-2008 time span as occurring in aunique period. Thus, in the rest of the paper we label to the treatment period
5The 2006 wave was also available, but few observations were left after the matching withthe other data sources. For this reason we preferred to focus on the 2008 wave, keeping the2006 one only for a robustness check on the pooled 2006 and 2008 waves.
6It is, also, worth to notice that we have no information about the firm innovation in theperiod preceding the survey. As a consequence, due to the lack of innovation data for a longtime-span, our treatments, as usually in most of the mentioned literature, capture the en-gagement in innovative activity, but not the start of this activity.
9

Figure 1: Time Line
t°
t=2008
t-1 t+1
2005 2009
CIS
2006-2007-2008
which corresponds to the time frame starting in 2006 and ending in 2008 andthe reference year for this period is the last year in the span, i.e. t = 2008.Figure 1 shows our sample time line. The data includes all firms with morethan 250 employees and a sample for firms between 10 and 250 employeesand cover both service and manufacturing firms. However, our focus is onmanufacturing firms only.
The Structural Business Statistics (SBS) - The Annual Industry and ServiceStatistics collect information on firm revenues, input costs, employment, in-vestment activity and the primary 4 digit NACE (rev 1.1) sector of activity overthe period 2003-2008. These data cover the whole population of firms withmore than 20 employees and a representative sample of firms with less than20 employees. The economic activities that are included in the survey are theones in the NACE sections from C to K, and from M to O.
The Foreign Trade Statistics (FTS) - Foreign trade flows at firm level aresourced from customs declarations and are available for the 2002-2009 timespan. The import and export flows are collected for the universe of importersand exporters of goods at 12-digit Gümrük Tarife Istatistik Pozisyonu (GTIP)classification: the first 8 digits correspond to Combined Nomenclature (CN)classification, and the last 4 digits are national. Furthermore, the informationon the origin/destination countries of trade flows is available. It is worth to
10

notice that the recorded flows concern both all trading and produced goodsa manufacturing firm sells abroad. For this reason, we exploited firm levelproduction data, described just below, in order to discern produced exportsfrom the bulk of the firm exports. We made use of a correspondence betweenthe codes of produced goods and the codes of trade flows at a high level ofdisaggregation, thus connecting 10 digit PRODTR production codes with 12digit GTIP trade codes.7 Since the matching between production and tradedata may be problematic due to some potential mistakes in the attributionof the good codes to each trade and production flow, we have also adopted amore aggregated correspondence table.8 Some recent firm level evidence forother countries seems to confirm that a large share of exports, also for man-ufacturing firms, concerns goods that are simply traded and not produced(Bernard et al., 2011, 2012). The distinction between own produced goodsand the traded ones is important from a conceptual point of view in this pa-per since we can expect innovation to have a direct impact, if significant, onthe ability of firms to penetrate foreign markets with their own products. Bothproduct and process innovation affect the firm production activity: the for-mer drives the firm to introduce improved goods, or different varieties thatforeign consumers may appreciate and would like to purchase, while the lat-ter may help the firm to reduce production costs. Thus, both types of inno-vation may stimulate and ease the export of produced goods. There is no adirect link, instead, between the firm innovative efforts and the selling activ-ity of traded goods. As a consequence, our main focus will be on the exportactivity of firm own products.
The Annual Industrial Product Statistics (AIPS) - The TurkStat Annual In-dustrial Product Statistics contain information on the type and number ofproduced goods, their volume and value of production together with the totalquantity and value of total sales from goods produced within the referenceyear or preceding years. Product data are available for the years 2005-2009and are collected at 10-digit PRODTR level9, a national product classificationwith the first 8 digits corresponding to PRODCOM classification. The pro-duction data are available for firms with more than 20 persons employed andwhose primary or secondary activity is in either C section (Mining & Quarry-
7We have harmonised the codes of trade flows across years, since the trade classificationis updated every year. On the contrary, production data were recorded according to a uniformclassification over our sample of analysis.
8More details about the harmonisation procedure of product classification and thematching between trade and production data is available in Lo Turco and Maggioni (2012).
9The PRODTR classification is the 2006 one, thus it is homogeneous across years and doesnot require any harmonisation procedure.
11

ing) or D section (Manufacturing) of NACE Rev 1.1.
3.2 The sample and the descriptive evidence
The 2008 wave of the CIS is composed of 2,822 manufacturing firms.10 Whenwe keep in the dataset only those firms for which we have information fromSBS and AIPS dataset we are left with 1,569 firms that represent our final sam-ple. This sample is biased towards the medium and large firms. The mediansize - in terms of number of employees - is 159 employees. In our view thisbias does not represent a serious concern since only a low number of smallfirms are engaged in innovation and export activity, that are the two phenom-ena investigated in this paper. However, it would be interesting to have thepossibility to disclose the effects of innovative efforts engaged by very smallfirms, when suitable data will be available.
Table 1 gives an overview of the diffusion of innovation practices acrossTurkish manufacturing firms. As above, in the rest of the paper we will labelPd the product innovation and Pc the process one. About 40% of firms in oursample is engaged in some innovative activities, and the largest part of themis introducing both new/improved products and new production processes.
Table 1: Share of Innovators by Type (%)- 2008 CIS wave
Type of Innovators Pd Pc Both Pd & Pd Only Pd Only Pc
Share (%) 39.32 36.84 28.87 10.45 7.97
Source: Own calculations on the sample obtained by merging Turkstat CIS, SBS, FTS andAIPS. Pd and Pc denote the product innovators and process innovators, respectively. Theshares refer to 2006-2008 three-year period.
When we cross the information about the innovation activities with thefirm export involvement in Table 2 some interesting insights emerge. It is clearthat firms engaged in some kind of innovative efforts are generally more likelyto penetrate foreign markets with their own products. There is not a great dif-ference in the advantage that product innovators and process innovators en-joy with respect to the population of non process innovators and non productinnovators respectively. However, when we classify firms into four mutuallyexclusive groups - including both product&process innovators, only processinnovators, only product innovators and non-innovators - it follows that the
10The total number of firms, covering both service and manufacturing sectors, is 4,891.
12

introduction of new products is a more rewarding strategy in terms of firmsuccess in the international arena. The production of improved and/or newgoods is related to a higher probability to be an exporter. In opposite, processinnovators only are engaged in international markets slightly less than non-innovators and the renewal of production processes seems to play a role justwhen it is combined with a new product introduction.Finally, turning the attention to destination countries, the Table shows thatinnovators are more likely than non-innovators to export to low income des-tinations and that although product innovators are more likely to export bothto high and low income countries11, they are slightly more likely to export tolow income countries. In addition, whereas pure process innovators are moreinvolved than non-innovators in exporting to low income countries, they areless involved in exporting to high income economies. Nevertheless, whenprocess innovation is adopted in conjunction with product innovation thefirm export probability is enhanced, regardless of the destination area incomelevel. The overall evidence from Table 2 points at some heterogeneity acrossthe innovation strategies and destination markets that should be rigorouslyaccounted for in empirical work. Resting on the above theoretical frameworkand on this evidence, the next sections are devoted to the empirical dissec-tion of the impact of product, process and product&process innovation onthe firm export propensity.
11The definition of the two groups follows the World Bank country classification.
13

Table 2: Firm Export Involvement byInnovation Activity
Exp ExpHic ExpLic
All Sample 48.37 39.32 39.13
Non-Pc 45.41 36.23 35.22Pc 53.46 44.64 45.85
Non-Pd 43.59 34.14 33.40Pd 55.75 47.33 47.97
Non-Innovator 43.77 34.22 32.89Only Pc 42.40 33.60 36.80Only Pd 53.66 46.34 46.95Both Pc & Pd 56.51 47.68 48.34
Source: Own calculations on the sample obtained bymerging Turkstat CIS, SBS, FTS and AIPS.Pd and Pc denote the product innovators and pro-cess innovators, respectively.Exp captures the general firm export status, whileExpHic and ExpLic indicate the export activity toHigh and Low Income countries, respectively.
14

4 Empirical strategy
In order to shed light on the causal effect of innovation on export activity, wemake use of the propensity score matching in a multiple treatment frame-work (Lechner, 2001, 2002).12 Building on our theoretical background, we fo-cus on both product and process innovation, that, as highlighted in section2, may differently affect the firm operations, and we consider a set of mutualexclusive treatments the firm may undergo: (0,0) is the no treatment case,no innovation activity; (Pd,0) represents the product innovation only; (0,Pc)represents the process innovation only; finally, (Pd,Pc) represents the case ofboth product and process innovation.
Our aim is to assess the Average Treatment effects on the Treated (ATT) foreach treatment a, that is the outcome a firm in the different state b wouldexperience if it underwent the treatment a. However, each participant re-ceives just one treatment and the remaining ones are potential counterfac-tuals. Then, the comparison of each state S with the other ones leads us to afull set of ATT effects
γa,b = E(Y apost|S = a)− E(Y b
post|S = a) (19)
that denote the expected (average) effect on outcome Y of treatment a,in the post-treatment period, relative to treatment b for a participant drawnrandomly from the firms undergoing the treatment a. As E(Y b
post|S = a) is notobservable, it is proxied by the outcome of the units that actually undergo thetreatment of comparison b, E(Y b
post|S = b).In particular, we can obtain different ATT effects, for each variable of in-
terest, for each of the following pairs:
• (0, P c)/(0, 0) - Process Innovators Only/Non Innovators;
• (Pd, 0)/(0, 0) - Product Innovators Only/Non Innovators;
• (Pd, Pc)/(0, 0) - Product and Process Innovators/Non Innovators;
• (Pd, Pc)/(0, P c) - Product and Process Innovators/Process InnovatorsOnly;
• (Pd, Pc)/(Pd, 0) - Product and Process Innovators/Product InnovatorsOnly;
12We have also applied simple propensity score matching retrieving the effects of innova-tion on firm export activity when process and product innovation are treated as two separate,independent and different treatments. The relative results are available from the authors.
15

• (Pd, 0)/(0, P c) - Product Innovators Only/Process Innovators Only;
• (0, P c)/(Pd, 0) - Process Innovators Only/Product Innovators Only;
where the first group of firms represents the group of treated, while thesecond group of firms builds up the control group.
In order to find the control units to be matched with the treated units weestimate a multinomial logit model from which we recover the propensityscores for each of the four states above defined. The multinomial logit depen-dent variable is the probability to introduce a process/product/process&productinnovation in t, that is in the period 2006-2008, and we include the value of thefollowing variables retrieved by the FTS and the SBS in t− 1, i.e. in 2005:
• the log of the number of employees, l;
• the log of labour productivity (value added per employee), lp13;
• the log of the unit wage (total wage bill divided by the number of em-ployees), w;
• the share of R&D workers in total firm employment, EmpRD;
• dummy variables for the previous experience in the Low and High in-come import, ImpLic and ImpHic, and export markets,ExpLic andExpHic;
• a dummy variable for multi-plant firms, multi;
• a dummy variable for firms subcontracting part of their production, outs;
• a dummy variable for the status of subcontractor, subcont.
Finally, we include two digit Nace Rev. 1.1 sector fixed effects. Table A.1 ofthe Appendix displays the results of the logit for the selection of the controlunits. It is worth to highlight that, apart from firm size that positively affectsthe probability to innovate, regardless of the type of innovation activity, fromthe Table it emerges that the drivers of process and product innovations arerather different. On the one hand, the former is positively related to firm wageand negatively related to firm import activity from low income economies.The cost saving nature of such innovations suggests that importing inputsfrom low income economies reduces the need to introduce cost saving pro-cess innovations, so as an increase in the firm average wage may push thefirm to adopt cost saving process innovations to compensate the higher unit
13The lack of data about the firm tangible assets prevents us from computing a Total FactorProductivity measure.
16

labour cost. On the other hand, the probability to introduce a new productis positively and significantly related to the share of R&D workers in the firm.This is rather consistent with the idea of product innovation being related tosome new invention which stems from the firm research effort. The firm sizeand share of R&D workers are also positively and significantly related to theprobability to introduce product and process innovation at the same time.Nevertheless, this complex activity appears to be also driven by the firm pro-ductivity and the firm status as an outsourcer. In this respect, process innova-tion could be essentially directed to the introduction of the new product: thefirm outsources the less R&D intensive production processes, while retainingthe more knowledge intensive phases of production which are directed to thenew product invention. Finally, as far as productivity is concerned, strangelyenough it only affects the joint adoption of product and process innovation.This result however might depend on the use of labour productivity which ishighly related to the firm capital labour ratio and could not properly proxy forthe firm Total Factor Productivity.14
In conclusion, the multinomial logit results confirm that the three strategiesare heterogeneous and highlight the need to tackle them in isolation the onefrom each other. Our MPSM empirical framework, then, can be consideredparticularly suitable for this task.
Making use of the propensity scores resulting from the multinomial logitestimates, we apply the Kernel matching and in Table A.2 in the Appendix weshow some tests revealing the quality of the matching. The latter significantlyreduces the median standardized bias, that is the distance in marginal dis-tributions of the covariates between treated and control units. Also, only alow number of treated firms lay out of the common support. Finally, FigureA.1 shows that the distribution of the propensity score for matched controlsoverlaps the one of treated firms after the matching procedure for all the treat-ments. Even if the goodness of our strategy is slightly worse when the controlgroup is composed of process innovators only, (0,Pc), or product innovatorsonly, (Pd,0), because of the small size of these two groups, the evidence con-firms the general validity of the matching. One of the advantages of kernelmatching when compared to other matching algorithms, especially NearestNeighbour matching, is the exploitation of as much information as possiblefrom the control group and this is important in our context due to the gen-eral low number of firms in all the four groups described above.15 The Radius
14Unfortunately the lack of any information on the firm capital stock together with theshort time span at our disposal which is not suitable for the use of the perpetual inventorymethod, prevented us from calculating such a productivity measure.
15As a matter of fact, when we have tried to apply the Nearest Neighbour matching thetests, we just presented for the kernel matching, for the quality of matching failed to confirm
17

Matching is another possible alternative that we present in our robustnesschecks.
5 Results
Table 3 shows the ATT effects for our outcomes of interest: the firm first timeexport entry, ExpStart, and the export status, Exp, at time t and t+1, that isin 2008 and 2009. We define an export starter a firm that exports in t (t + 1)and did not export in t-1, i.e. a firm that exports in 2008(2009) and was notexporting in 2005. We define an exporter any exporting firm, regardless of theprevious export activity. It is worth to remind here that the latter is properlyaccounted for in the matching procedure, when we consider the firm previ-ous export activity in high and low income economies in the logit model forthe innovation treatment. This trick avoids any potential innovation impacton exporting to be driven by previous activity in international markets. Whilethe export entry allows us to capture the role of innovation in the overcom-ing of the national barriers and penetrate foreign markets for the first time,the export status may inform us about the importance of the firm innovativeefforts in preserving their position on the foreign market.
In the Table, analytic, A.s.e., and bootstrapped, B.s.e., standard errors areshown below the ATT estimates (Lechner, 2001; Caliendo and Kopeinig, 2008).From the latter it emerges that process innovation alone does not seem toimportantly stimulate the firm export activity, with a relevant role on the ex-port status only at time t+1. Product innovation, instead, allows the firm topreserve its competitiveness and market shares in foreign countries. Further-more, the joint involvement in product and process innovation directly affectsthe export status, but no impact is disclosed for the firm ability to cross theborders and enter foreign markets for the first time. From these results, wecan infer that innovation may help the firm to stay, preserve and strengthenits position in the international arena, but it is not the main determinant forthe export market first time entry.16 In general, overall returns from the jointadoption of both strategies are rather similar to the ones stemming from theonly introduction of product innovation and both sets of ATTs are higher thanthe ones estimated for the pure introduction of process innovation. However,when the impact of process innovation is active in t + 1 the joint innovation
the validity of our procedure.16This evidence is confirmed even when we estimate ATTs for starting to export only on
the sample of firms which were not exporting in t-1. By excluding firms exporting in t − 1from the control group, we avoid the possibility that non significant ATTs may be driven bythe presence of previous exporters in the sample.
18

strategies are superior than the single ones, as discussed in our theoreticalframework.
When we allow for heterogeneous effects across destination market, someinteresting findings emerge. Although the results on the export propensitymimic the previous ones, it turns out that complex innovative strategies mayhave an immediate role in enhancing the firm probability to start exportingto high income economies. We find, indeed, a significant ATT effect at timet, that turns non significant at time t+1. Thus, the joint adoption of prod-uct and process innovation efforts may allow firms to face competition inhigh income markets. In addition, it is worth to notice that, whereas prod-uct innovators are less likely to penetrate such markets, switching from beinga product innovator to being a two-way innovator increases the firm proba-bility to start exporting to these destinations both in t and t+ 1. As previouslymentioned in our theoretical framework, this evidence suggests that prod-uct innovation per se is not a sufficient strategy to penetrate such markets forthe first time and needs to be complemented by the adoption of new pro-duction processes. The marked preference for quality in developed countriesgoes with a higher production of quality goods in these economies. Theselatter tend to specialise in higher quality good exports and to intensively ex-change among them (Schott, 2004; Hallak, 2006, 2010). It follows a higherthickness of the market for quality, as more quality goods are traded in theseeconomies. This requires the firm willing to start exporting to those desti-nations to engage in a remarkable quality improvement effort in order to becompetitive. For a middle income country’s manufacturing firm, then, pureproduct innovation might not be enough to break into a developed economyand needs to be sustained by an improvement of the firm cost advantage. Analternative explanation of the importance of the joint adoption of the two in-novation strategies for the entry in developed countries could follow from therecent increase of offshoring practices led by the latter (Feenstra, 1998). Oneof their consequences is the relocation of whole production processes in lowand middle income economies. Here, the product is only new to the firm thatstarts to produce it, nevertheless, it is already existing in the foreign market,as many other firms are already producing similar varieties there. The middleincome economy firm, then, succeeds in entering the foreign market for thegood thanks to the adoption of the new production process which deliversimportant cost savings, compared to the high income market process. Thisinterpretation highlights that the joint involvement in product and processinnovation of middle income economies’firms may actually stem from costsaving process innovations by high income economies’ firms.
Turning to the export activity towards low income destinations, in line
19

with our theoretical sketch, product innovation proves rather relevant to ex-port to such destinations. Reduction in costs driven by process innovationcould not be enough in order to compete in low labour cost markets. Onthe contrary, the introduction of new varieties and new products, more thanthe cost reduction, may be the way for Turkish firms to survive and competewithin economies characterised by similar technologies and costs.
Summing up, innovation, namely two-way innovation, stimulates the ex-port start to high income economies only. As mentioned above in our theo-retical framework, local entry costs may differ across destinations with low in-come markets being characterised by lower costs than the high income ones.This may explain why the joint adoption of new products and processes isneeded to start to export to the latter markets. On the contrary, the first timeentry in low income markets may not require a particular innovative effortand may be simply driven by firm productivity level and size. However, prod-uct innovation appears as a key activity to successfully survive in export mar-kets, regardless of the income level. In general, product innovation allows forincreased product differentiation, higher mark up and revenues and variableprofits. On the one hand, this turns relevant when consumers value quality, asin high income economies. On the other hand, quality upgrading turns to befundamental when competitors may easily imitate exporters’ technology forlow quality goods, as in low income economies. Finally, although we modeledtwo-way innovation as superior compared to each single innovation strategy,comparable returns seem to stem from product and product&process inno-vation strategies in high income markets. Nevertheless, when the impact ofprocess innovation is significant and positive, i.e. in t + 1, the joint adoptionof product&process innovation is more rewarding than each single innova-tion strategy, as predicted by our theoretical framework. On the contrary, thehighest coefficient displayed for product innovation in low income destina-tions could stem from a higher variable cost associated to the introductionof the new process directed to the production of higher quality products.17
As a matter of fact, higher variable costs may damp the positive effect of newproduct introduction, so as lower quality could damp the cost advantage fromprocess innovation.
In conclusion, our results support our Hypothesis 1, as we find that firminnovative efforts in an emergent country positively affect the firm exportpropensity. However, the predicted sorting of innovation strategies summarised
17Although our theoretical framework rests on the simplifying assumption of a lowermarginal cost related to process innovation, both when adopted alone and in conjunctionwith product innovation, the production of a higher quality good may require a higher vari-able cost (Crinò and Epifani, 2012). If this is the case, variable profits may even be lower thanthose earned under the pure product innovation strategy.
20

in Hypothesis 2 is only confirmed for exporting to high income countries. Onthe contrary, two-way innovation is not definitely superior to product inno-vation in preserving the firm position in foreign low income markets. Finally,Hypothesis 3 is corroborated by our data: process innovation plays a role inhigh income economies more than in the low income ones and the reverseholds for product innovation.
Robustness Checks In order to prove the robustness of our results we haveimplemented some checks. These estimations, in general, confirm all theabove findings and are reported in Table A.3 in the Appendix. First, we makeuse of Radius matching instead of Kernel algorithm allowing a caliper of 1%.Second, we expand the sample including observations from the 2006 CIS wave.This test does not allow to compute the ATT effects for the probability ofstarting exporting because for firms in the 2006 wave we do not have at ourdisposal the export activity of own produced goods for the year t-1 (that is2003).18 Third, we report the ATT effects computed when we exploit the ex-port status of own produced goods built making use of a matching betweentrade and production data implemented according to a correspondence ta-ble at a more aggregated level, i.e. between 6 digit Haromised System (HS)trade codes and 6 digit Classification of Products by Activity (CPA) productioncodes. A final check, not reported for the sake of brevity, consisted in includ-ing the growth rate of labour productivity in the logit specification, in order toaccount for different growth paths between innovators and non-innovators inthe pre-innovation period for the control group selection.
6 Concluding Remarks
With this paper we have contributed to the debate about the causal nexusbetween firm innovation activity and export performance. In particular, forthe first time we have provided evidence on this topic in the context of anemergent economy, Turkey. With respect to previous work, our theoreticalframework has pointed at process and product innovation as affecting firmprofitability through different channels. As a consequence, our empirical ap-proach, based on a MPSM framework, has isolated the impact of each strategyand of their joint adoption on the firm export propensity. Our evidence, firstof all, has corroborated our assumption on the different channels throughwhich product and process innovation operate, thus confirming the need for
18In order to build the status of exporter of own produced goods, we need information forproduction data that, unluckilly are not available before 2005.
21

Tab
le3:
ATT
effe
cts
All
Co
un
trie
sH
igh
Inco
me
Co
un
trie
sLo
wIn
com
eC
ou
ntr
ies
Exp
ExpStart
Exp
ExpStart
Exp
ExpStart
tt+
1t
t+1
tt+
1t
t+1
tt+
1t
t+1
(0,P
c)/(
0,0)
ATT
0.02
70.
083
0.00
50.
020
0.03
30.
082
0.00
90.
023
0.06
20.
086
-0.0
42-0
.016
A.s
.e[0
.049
][0
.050
]*[0
.031
][0
.035
][0
.047
][0
.049
]*[0
.029
][0
.033
][0
.048
][0
.048
]*[0
.029
][0
.032
]B
.s.e
[0.0
51]
[0.0
50]*
[0.0
34]
[0.0
36]
[0.0
48]
[0.0
45]*
[0.0
30]
[0.0
31]
[0.0
45]
[0.0
45]*
[0.0
32]
[0.0
35]
Trea
ted
/Co
ntr
ols
:120
/827
(Pd
,0)/
(0,0
)
ATT
0.09
00.
088
-0.0
17-0
.042
0.11
90.
067
-0.0
01-0
.042
0.12
50.
146
-0.0
13-0
.008
A.s
.e[0
.044
]**
[0.0
44]*
*[0
.025
][0
.026
][0
.044
]***
[0.0
43]
[0.0
24]
[0.0
23]*
[0.0
44]*
**[0
.044
]***
[0.0
29]
[0.0
30]
B.s
.e[0
.037
]**
[0.0
40]*
*[0
.026
][0
.028
][0
.036
]***
[0.0
40]*
[0.0
24]
[0.0
24]*
[0.0
39]*
**[0
.039
]***
[0.0
28]
[0.0
31]
Trea
ted
/Co
ntr
ols
:162
/827
(Pd
,Pc)
/(0,
0)
ATT
0.07
30.
094
0.02
7-0
.002
0.08
40.
097
0.04
10.
016
0.08
00.
085
-0.0
13-0
.014
A.s
.e[0
.036
]**
[0.0
36]*
**[0
.023
][0
.024
][0
.035
]**
[0.0
35]*
**[0
.022
]*[0
.023
][0
.035
]**
[0.0
35]*
*[0
.023
][0
.024
]B
.s.e
[0.0
33]*
*[0
.033
]***
[0.0
20]
[0.0
24]
[0.0
32]*
**[0
.032
]***
[0.0
20]*
*[0
.022
][0
.033
]**
[0.0
34]*
*[0
.023
][0
.023
]Tr
eate
d/C
on
tro
ls:4
43/8
27
(Pd
,Pc)
/(0,
Pc)
ATT
0.01
40.
019
0.00
90.
004
0.02
1-0
.006
0.01
6-0
.019
-0.0
210.
033
0.00
40.
023
A.s
.e[0
.058
][0
.059
][0
.037
][0
.041
][0
.056
][0
.058
][0
.034
][0
.038
][0
.057
][0
.057
][0
.033
][0
.037
]B
.s.e
[0.0
58]
[0.0
58]
[0.0
40]
[0.0
39]
[0.0
57]
[0.0
58]
[0.0
40]
[0.0
44]
[0.0
58]
[0.0
62]
[0.0
38]
[0.0
34]
Trea
ted
/Co
ntr
ols
:437
/125
(Pd
,Pc)
/(P
d,0
)
ATT
-0.0
140.
041
0.04
90.
047
-0.0
240.
071
0.04
80.
060
-0.0
17-0
.014
-0.0
04-0
.006
A.s
.e[0
.050
][0
.050
][0
.029
]*[0
.030
][0
.050
][0
.050
][0
.029
]*[0
.026
]**
[0.0
50]
[0.0
50]
[0.0
32]
[0.0
33]
B.s
.e[0
.045
][0
.048
][0
.027
]*[0
.029
][0
.046
][0
.049
][0
.025
]*[0
.026
]**
[0.0
46]
[0.0
47]
[0.0
31]
[0.0
31]
Trea
ted
/Co
ntr
ols
:441
/164
(0,P
c)/(
Pd
,0)
ATT
-0.0
850.
006
0.01
50.
061
-0.1
030.
022
0.00
20.
078
-0.0
70-0
.047
-0.0
31-0
.009
A.s
.e[0
.062
][0
.062
][0
.036
][0
.040
][0
.060
]*[0
.061
][0
.034
][0
.037
]**
[0.0
61]
[0.0
61]
[0.0
36]
[0.0
40]
B.s
.e[0
.060
][0
.065
][0
.039
][0
.043
][0
.057
]*[0
.060
][0
.038
][0
.034
]**
[0.0
59]
[0.0
58]
[0.0
38]
[0.0
43]
Trea
ted
/Co
ntr
ols
:119
/164
(Pd
,0)/
(0,P
c)
ATT
0.08
10.
019
-0.0
18-0
.047
0.10
80.
015
-0.0
13-0
.056
0.07
70.
075
0.03
40.
027
A.s
.e[0
.062
][0
.063
][0
.038
][0
.041
][0
.061
]*[0
.062
][0
.035
][0
.037
][0
.062
][0
.062
][0
.037
][0
.041
]B
.s.e
[0.0
64]
[0.0
63]
[0.0
41]
[0.0
44]
[0.0
60]*
[0.0
61]
[0.0
40]
[0.0
38]
[0.0
64]
[0.0
64]
[0.0
40]
[0.0
45]
Trea
ted
/Co
ntr
ols
:162
/125
*Si
gnifi
can
tat
10%
leve
l;**
sign
ifica
nt
at5%
leve
l;**
*si
gnifi
can
tat
1%le
vel.
(0,Pc)
,(Pd,0
),(Pd,Pc)
and
(0,0
)d
eno
teth
est
atu
so
fpro
cess
on
ly,
pro
du
cto
nly
,bo
thp
roce
ssan
dp
rod
uct
inn
ovat
or
and
no
n-i
nn
ovat
or,
resp
ecti
vely
.A.s.e
andB.s.e
stan
dfo
ran
alyt
ican
db
oo
tstr
app
edst
and
ard
erro
rs,r
esp
ecti
vely
.
22

a separate treatment of the two activities. As a matter of fact, while pro-cess innovation is more likely to occur when labour costs are higher and im-ports from low income economies lower, product innovation is highly proba-ble when firms are intensively engaged in R&D. Furthermore, differently fromother empirical papers on the topic, our work has distinguished between theimpact of innovation on the export propensity and first time entry into ex-porting. Results, indeed, have shown that product and process innovationonly facilitate the latter activity, when they are jointly undertaken and foreignmarkets are the developed ones. Nevertheless, in general, innovation strate-gies have emerged as important to preserve the firm position in export mar-kets. Also, product innovation has appeared as more rewarding in terms ofexport performance than process innovation, especially for exporting to lowincome economies, while it is the joint involvement in both activities that hasdisplayed the largest significant impact on the firm export propensity to highincome economies.
In conclusion, some policy implications naturally spring from our work.Policy makers in emerging economies, indeed, should sustain the firm inno-vative efforts in order to preserve its competitiveness in international marketsand, especially, to ease its access to advanced countries. However, as from ourwork innovation alone has not emerged as the only driver of the firm interna-tionalisation, further work should be devoted to shed light on the existenceand working of other channels which usually foster the export activity - suchas access to financial markets and the expansion of firm size - in the emergenteconomies’ context.
AcknowledgmentsThe data used in this work are from the Community Innovation Survey, the
Foreign Trada Data, the Annual Business Statistics, and the Production Sur-veys provided by Turkish Statistical Office (TurkStat). All elaborations havebeen conducted at the Microdata Research Centre of TurkStat under the re-spect of the law on the statistic secret and the personal data protection. Theresults and the opinions expressed in this article are exclusive responsibility ofthe Authors and, by no means, represent official statistics. We are grateful toBülent Tungul, Mahamut Ozgur, Kenan Orhan and Erdal Yildirim from Turk-Stat for their help with foreign trade data. We also thank Vedat Metin, UlkuUnsal and Oguzhan Turkoglu from dissemination department. Finally, theAuthors are extremely grateful to the Marco Cucculelli, Fabio Fiorillo, StefanoStaffolani and Sandro Sterlacchini for their useful comments and suggestions.
23

ReferencesArkolakis, C., 2010. Market penetration costs and the new consumers margin in international
trade. Journal of Political Economy 118, 1151 – 1199.
Basile, R., 2001. Export behaviour of Italian manufacturing firms over the nineties: the role ofinnovation. Research Policy 30, 1185–1201.
Becker, S., Egger, P., 2009. Endogenous product versus process innovation and a firm’spropensity to export. Empirical Economics , 1–26.
Bernard, A., van Beveren, I., Vandenbussche, H., 2011. Multi-product Exporters, Carry-alongTrade and the Margins of Trade. Working Paper Research 203. National Bank of Belgium.
Bernard, A., Blanchard, E., van Beveren, I., Vandenbussche, H., 2012. Carry-along Trade.Working Paper 18246. NBER.
Bustos, P., 2011. Trade liberalization, exports, and technology upgrading: Evidence on theimpact of MERCOSUR on Argentinian firms. American Economic Review 101, 304–340.
Caldera, A., 2010. Innovation and exporting: evidence from spanish manufacturing firms.Review of World Economics (Weltwirtschaftliches Archiv) 146, 657–689.
Caliendo, M., Kopeinig, S., 2008. Some practical guidance for the implementation of propen-sity score matching. Journal of Economic Surveys 22, 31–72.
Cassiman, B., Golovko, E., 2011. Innovation and internationalization through exports. Journalof International Business Studies 42, 56–75.
Cassiman, B., Golovko, E., Martínez-Ros, E., 2010. Innovation, exports and productivity. In-ternational Journal of Industrial Organization 28, 372 – 376.
Crinò, R., Epifani, P., 2012. Productivity, quality and export behaviour. The Economic JournalDOI: 10.1111/j.1468-0297.2012.02529.x.
Dixit, A., Stiglitz, J., 1977. Monopolistic competition and optimum product diversity. Ameri-can Economic Review 67, 297–08.
Feenstra, R.C., 1998. Integration of trade and disintegration of production in the global econ-omy. Journal of Economic Perspectives 12, 31–50.
Grossman, G.M., Helpman, E., 1991. Quality ladders in the theory of growth. Review of Eco-nomic Studies 58, 43–61.
Grossman, G.M., Helpman, E., 1993. Innovation and Growth in the Global Economy. volume 1of MIT Press Books. The MIT Press.
Hallak, J.C., 2006. Product quality and the direction of trade. Journal of International Eco-nomics 68, 238–265.
Hallak, J.C., 2010. A product-quality view of the Linder hypothesis. The Review of Economicsand Statistics 92, 453–466.
24

Kumar, N., Siddharthan, N., 1994. Technology, firm size and export behaviour in developingcountries: The case of Indian enterprises. Journal of Development Studies 31, 289–309.
Lechner, M., 2001. Identification and estimation of causal effects of multiple treatments un-der the conditional independence assumption, in: Lechner, M., Pfeiffer, F. (Eds.), Econo-metric evaluation of labor market policies. ZEW Econ Stud. volume 13, pp. 43 – 58.
Lechner, M., 2002. Some practical issues in the evaluation of heterogeneous labour marketprogrammes by matching methods. Journal Of The Royal Statistical Society Series A 165,59–82.
Lo Turco, A., Maggioni, D., 2012. Imports, exports and the firm product scope: evidence fromTurkey. DISES Working Paper Series 384. Università Politecnica delle Marche.
Melitz, M.J., 2003. The impact of trade on intra-industry reallocations and aggregate industryproductivity. Econometrica 71, 1695–1725.
Roper, S., Love, J.H., 2002. Innovation and export performance: evidence from the UK andGerman manufacturing plants. Research Policy 31, 1087–1102.
Schott, P.K., 2004. Across-product versus within-product specialization in international trade.Quarterly Journal of Economics 119, 646–677.
Sterlacchini, A., 1999. Do innovative activities matter to small firms in non-R&D-intensiveindustries? An application to export performance. Research Policy 28, 819–832.
Sterlacchini, A., 2001. The determinants of export performance: A firm-level study of Italianmanufacturing. Review of World Economics (Weltwirtschaftliches Archiv) 137, 450–472.
Van Beveren, I., Vandenbussche, H., 2010. Product and process innovation and firms’ deci-sion to export. Journal of Economic Policy Reform 13, 3–24.
Verhoogen, E.A., 2008. Trade, quality upgrading, and wage inequality in the Mexican manu-facturing sector. The Quarterly Journal of Economics 123, 489–530.
Wagner, J., 2007. Exports and productivity: A survey of the evidence from firm-level data. TheWorld Economy 30, 60–82.
Wakelin, K., 1998. Innovation and export behaviour at the firm level. Research Policy 26,829–841.
25

Appendix
A Additional Tables and Figures
Table A.1: Multinomial Logit Esti-mates
(0, Pc) (Pd, 0) (Pd, Pc)
lt−1 0.261** 0.231** 0.222***[0.112] [0.099] [0.072]
lpt−1 0.034 -0.076 0.262***[0.143] [0.122] [0.095]
wt−1 0.604** 0.205 -0.044[0.235] [0.210] [0.153]
ImpLic t−1 -0.595** -0.217 0.15[0.262] [0.236] [0.170]
ImpHic t−1 -0.136 0.054 0.11[0.299] [0.284] [0.210]
EmpRDt−1 0.047 0.089** 0.114***[0.051] [0.035] [0.028]
multit−1 -0.224 -0.003 0.148[0.220] [0.192] [0.136]
ExpHic t−1 -0.055 -0.008 -0.127[0.265] [0.242] [0.178]
ExpLic t−1 -0.114 0.117 0.235[0.242] [0.220] [0.160]
subcontt−1 0.255 0.176 -0.24[0.332] [0.302] [0.238]
outst−1 -0.035 -0.046 0.522***[0.221] [0.198] [0.150]
Cons -26.945 -20.607 -4.887***[0.000] [0.000] [1.362]
Obs 1,569 1,569 1,569Pseudo-R2 0.091 0.091 0.091Wald Chi2 322.081 322.081 322.081Log-Likelihood -1617.93 -1617.93 -1617.93
* Significant at 10% level; ** significant at 5% level;*** significant at 1% level. (0, P c), (Pd, 0) and(Pd, Pc) denotes the status of process only, prod-uct only and both process and product innovator,respectively.While the dependent variable concerns the firm in-novation activity over the span 2006-2008, labeledas period t, regressors refer to t-1, which is year2005. Two digit sector dummies are included, butnot shown for brevity.
26

Table A.2: Balancing Tests
Treated Control % Treated Firms Median Bias % DropFirms Firms Out of Support Before After Bias
(pd,pc)/(0,0) 453 827 2.21 14.49 2.90 79.99(pd,0)/(0,0) 164 827 1.22 11.07 6.28 43.26(0,pc)/(0,0) 125 827 4.00 10.29 6.57 36.16(pd,pc)/(pd,0) 453 164 2.65 11.72 3.79 67.62(pd,pc)/(0,pc) 453 125 3.53 14.49 7.75 46.56(pd,0)/(0,pc) 164 125 1.22 12.70 10.49 17.37(0,pc)/(pd,0) 125 164 4.80 12.70 6.57 48.28
(0, P c), (Pd, 0), (Pd, Pc) and (0, 0) denote the status of process only, product only,both process and product innovator and non-innovator, respectively. Treatedfirms are in the common support if their propensity score is lower than the max-imum and higher than the minimum score of the control units. In the fifth andsixth column we display the median bias across all the covariates included in themultinomial logit estimation before and after the matching for.
27

Tab
leA
.3:R
ob
ust
nes
sC
hec
ks
All
Co
un
trie
sH
igh
Inco
me
Co
un
trie
sLo
wIn
com
eC
ou
ntr
ies
Exp
ExpStart
Exp
ExpStart
Exp
ExpStart
tt+
1t
t+1
tt+
1t
t+1
tt+
1t
t+1
Rad
ius
Mat
chin
g,C
alip
er1%
(0,P
c)/(
0,0)
0.03
50.
085*
0.01
10.
025
0.03
80.
083*
0.00
60.
020
0.06
40.
089*
-0.0
39-0
.012
(Pd
,0)/
(0,0
)0.
091*
*0.
091*
*-0
.014
-0.0
380.
118*
**0.
067
0.00
2-0
.039
0.13
2***
0.15
1***
-0.0
12-0
.009
(Pd
,Pc)
/(0,
0)0.
082*
*0.
095*
*0.
026
-0.0
010.
089*
*0.
094*
*0.
040*
0.01
80.
086*
*0.
088*
*-0
.009
-0.0
12(P
d,P
c)/(
0,P
c)0.
043
0.03
50.
029
0.00
50.
036
0.00
50.
038
-0.0
040.
003
0.05
10.
023
0.04
5(P
d,P
c)/(
Pd
,0)
-0.0
150.
016
0.05
5*0.
055*
-0.0
320.
029
0.05
0*0.
066*
*-0
.033
-0.0
440.
002
0.00
1(0
,Pc)
/(P
d,0
)-0
.095
0.02
80.
003
0.06
0-0
.105
*0.
042
-0.0
070.
080*
*-0
.072
-0.0
28-0
.046
-0.0
11(P
d,0
)/(0
,Pc)
0.09
8-0
.001
-0.0
12-0
.036
0.15
6**
0.05
90.
002
-0.0
490.
088
0.04
00.
036
0.03
2
Poo
led
,2W
aves
(0,P
c)/(
0,0)
0.03
10.
091*
*-
-0.
041
0.09
2**
--
0.06
50.
086*
*-
-(P
d,0
)/(0
,0)
0.07
9**
0.07
5*-
-0.
106*
**0.
059
--
0.11
1***
0.12
9***
--
(Pd
,Pc)
/(0,
0)0.
069*
*0.
091*
*-
-0.
079*
*0.
089*
**-
-0.
071*
*0.
080*
*-
-(P
d,P
c)/(
0,P
c)0.
025
0.02
7-
-0.
026
-0.0
08-
--0
.015
0.02
9-
-(P
d,P
c)/(
Pd
,0)
0.01
00.
049
--
-0.0
110.
056
--
0.00
20.
002
--
(0,P
c)/(
Pd
,0)
-0.0
540.
039
--
-0.0
710.
052
--
-0.0
48-0
.028
--
(Pd
,0)/
(0,P
c)0.
078
0.01
4-
-0.
095*
0.00
2-
-0.
074
0.06
7-
-
Pro
du
ced
Go
od
s,6d
igit
Mat
chin
g
(0,P
c)/(
0,0)
-0.0
390.
039
-0.0
160.
025
-0.0
230.
044
0.00
10.
032
0.01
80.
079
-0.0
500.
004
(Pd
,0)/
(0,0
)0.
090*
*0.
062
0.00
6-0
.024
0.09
8**
0.06
6-0
.009
-0.0
270.
130*
**0.
155*
**0.
004
0.01
3(P
d,P
c)/(
0,0)
0.08
5**
0.08
6**
0.05
8***
0.02
70.
084*
*0.
085*
*0.
053*
*0.
027
0.09
9***
0.09
4***
0.02
90.
022
(Pd
,Pc)
/(0,
Pc)
0.09
7*0.
065
0.03
90.
011
0.09
00.
029
0.02
6-0
.019
0.04
20.
040
0.02
40.
013
(Pd
,Pc)
/(P
d,0
)0.
003
0.05
60.
055*
0.04
60.
006
0.07
00.
065*
*0.
053*
-0.0
03-0
.013
0.01
3-0
.006
(0,P
c)/(
Pd
,0)
-0.1
60**
*-0
.019
-0.0
300.
054
-0.1
49**
-0.0
17-0
.001
0.07
1*-0
.129
**-0
.070
-0.0
63*
-0.0
05(P
d,0
)/(0
,Pc)
0.16
0**
0.05
30.
012
-0.0
420.
170*
**0.
075
-0.0
16-0
.054
0.13
1**
0.09
80.
037
0.00
6
*Si
gnifi
can
tat
10%
leve
l;**
sign
ifica
nt
at5%
leve
l;**
*si
gnifi
can
tat
1%le
vel.
Sign
ifica
nce
leve
lsre
sto
nb
oo
tstr
app
edst
and
ard
erro
rs.
(0,Pc)
,(Pd,0
),(Pd,Pc)
and
(0,0
)d
eno
tes
the
stat
us
ofp
roce
sso
nly
,pro
du
cto
nly
,bo
thp
roce
ssan
dp
rod
uct
inn
ovat
or
and
no
n-i
nn
ovat
or,
resp
ecti
vely
.
28

(a) (Pd,Pc)/(0,0)
(b) (0,Pc)/(0,0)
(c) (Pd,0)/(0,0)
(d) (Pd,Pc)/(Pd,0)
(e) (Pd,Pc)/(0,Pc)
(f) (Pd,0)/(0,Pc)
(g) (0,Pc)/(Pd,0)
Figure A.1: Propensity score densities for the treated, matched and un-matched controls
29