two years with extreme and little snowfall: effects on energy
TRANSCRIPT
The Cryosphere 10 1395ndash1413 2016wwwthe-cryospherenet1013952016doi105194tc-10-1395-2016copy Author(s) 2016 CC Attribution 30 License
Two years with extreme and little snowfall effects onenergy partitioning and surface energy exchange in ahigh-Arctic tundra ecosystemChristian Stiegler1 Magnus Lund12 Torben Roslashjle Christensen12 Mikhail Mastepanov12 and Anders Lindroth1
1Department of Physical Geography and Ecosystem Science Lund University Lund Soumllvegatan 12 223 62 Lund Sweden2Arctic Research Centre Department of Bioscience Aarhus University Roskilde Frederiksborgvej 3994000 Roskilde Denmark
Correspondence to Christian Stiegler (christianstieglernatekoluse)
Received 12 January 2016 ndash Published in The Cryosphere Discuss 25 February 2016Revised 8 June 2016 ndash Accepted 17 June 2016 ndash Published 8 July 2016
Abstract Snow cover is one of the key factors controllingArctic ecosystem functioning and productivity In this studywe assess the impact of strong variability in snow accumu-lation during 2 subsequent years (2013ndash2014) on the landndashatmosphere interactions and surface energy exchange in twohigh-Arctic tundra ecosystems (wet fen and dry heath) inZackenberg Northeast Greenland We observed that record-low snow cover during the winter 20122013 resulted in astrong response of the heath ecosystem towards low evap-orative capacity and substantial surface heat loss by sensi-ble heat fluxes (H) during the subsequent snowmelt periodand growing season Above-average snow accumulation dur-ing the winter 20132014 promoted summertime ground heatfluxes (G) and latent heat fluxes (LE) at the cost of H Atthe fen ecosystem a more muted response of LE H and Gwas observed in response to the variability in snow accumu-lation Overall the differences in flux partitioning and in thelength of the snowmelt periods and growing seasons duringthe 2 years had a strong impact on the total accumulation ofthe surface energy balance components We suggest that in achanging climate with higher temperature and more precip-itation the surface energy balance of this high-Arctic tundraecosystem may experience a further increase in the variabil-ity of energy accumulation partitioning and redistribution
1 Introduction
The presence or absence of snow has a strong impact on thelandndashatmosphere interactions and on the exchange of energyand mass The high albedo of snow (Warren 1982) reducesthe amount of absorbed short-wave radiation at the surfacewhich generally leads to a smaller magnitude of the surfaceenergy balance components The influence of the snow onthe energy balance is most pronounced during spring whenthe commonly patchy distribution of snow causes strong spa-tial variations in surface temperature and surface energy bal-ance components (Chernov 1988) The meltwater in Arcticsoils contributes a considerable proportion of plant-availablewater during summertime and as such end-of-winter snowdepth constitutes an important control of the summertime en-ergy partitioning into sensible (H ) and latent heat (LE) fluxes(Langer et al 2011)
Since the end of the Little Ice Age the climate in the Arc-tic has undergone a substantial warming to the highest tem-peratures in 400 years (Overpeck et al 1997) Warming hasfurther accelerated during the second half of the 20th centuryand was almost twice as strong as the global average (Stockeret al 2013) Between the years 1966 and 2003 temperaturesin the Arctic increased by 04 C per decade with most pro-nounced warming during the cold seasons (McBean et al2005) A reanalysis of meteorological observations over theperiod 1989ndash2008 shows that near-surface warming is 16 Cduring autumn and winter and 09 and 05 C during springand summer (Screen and Simmonds 2010) It is suggestedthat diminishing sea ice snowndashalbedo and icendashalbedo feed-
Published by Copernicus Publications on behalf of the European Geosciences Union
1396 C Stiegler et al Two years with extreme and little snowfall effects on energy partitioning
backs and atmospheric energy transport into the Arctic gov-ern Arctic temperature amplification (Graversen et al 2008Screen and Simmonds 2010 Bintanja and van der Linden2013)
Precipitation in the Arctic is generally low however forthe period from 1900 to 2003 precipitation increased by14 per decade (McBean et al 2005) with a pronouncedincrease mostly during winter (Becker et al 2013) Theobserved contribution of snow precipitation to total annualprecipitation has declined (Hartman et al 2013) Extremeevents such as extremely high temperatures and heavy pre-cipitation have increased while extremely low temperatureshave decreased over most parts of the Arctic (Hartman et al2013) During the 21st century the ongoing changes in thetemperature and precipitation regime are expected to con-tinue By the end of the century models based on the Repre-sentative Concentration Pathway (RCP) 45 scenario predictan average warming of 39 C over Arctic land areas (Stockeret al 2013) and an increase in precipitation of more than50 mostly during autumn and winter (Bintanja and Sel-ten 2014) However due to the increase in air temperatureand rain-on-snow events the maximum amount of snow ac-cumulation on the ground is projected to increase by only0ndash30 and snow cover duration might decrease by 10ndash20 over most of the Arctic regions (Callaghan et al 2011a)
At our study region in Zackenberg Northeast Greenlandmean July air temperatures during the period 2000ndash2010 in-creased by 018 C yrminus1 and the active layer thickened by15 cm yrminus1 (Lund et al 2014) Based on the IPCC SRESA1B scenario (Nakicenovic et al 2000) local climate mod-elling for the region predicts an increase in mean annualair temperature by 41 C for the period 2051ndash2080 com-pared to 1961ndash1990 with the highest increase during win-ter (66 C) and spring (74 C) while precipitation over east-ern Greenland is projected to increase by 60 (Stendel et al2007)
Arctic ecosystems are highly adapted to extreme sea-sonal variability in solar radiation temperature snow coverand precipitation However studies have shown that winterwarming events and interannual snow cover variability affectecosystem functioning in various adverse ways and these ex-tremes are expected to occur more frequently in the future(Callaghan et al 2005 Kattsov et al 2005 Stocker et al2013) Hence there is an urgent need to assess their impacton Arctic ecosystems Several studies have focused on theeffect of extreme temperatures on plant productivity and car-bon sequestration (Chapin III et al 1995 Marchand et al2005 Euskirchen et al 2006 Bokhorst et al 2008 2011)but the direct impact of successive snow cover variability onthe landndashatmosphere interactions and surface energy balancecomponents is largely unknown
Here we examine the impact of strong variability insnow accumulation by studying the landndashatmosphere inter-actions and surface energy balance components in a high-Arctic tundra heath and fen environment during 2 subse-
quent years (2013ndash2014) with distinct differences in end-of-winter snow depth Our study area is located in Zackenbergin Northeast Greenland where record-low snow accumula-tion was observed during the winter 20122013 (Mylius etal 2014) followed by snow-rich conditions during the win-ter 20132014 This sequence of strong variability in snowaccumulation forms the following objectives of our study(1) to assess the magnitude of the energy balance compo-nents and moisture exchange during the snowmelt periodsand growing seasons in 2013 and 2014 and (2) to quantifyand evaluate the driving factors of surface energy partition-ing during the observation period at our high-Arctic fen andheath site
2 Materials and methods
21 Study sites
The study sites are located in the valley Zackenbergdalen inNortheast Greenland near the Zackenberg Research Station(7430prime N 2030primeW) (Fig 1a) The valley is surrounded bymountains to the west north and east while Young Soundand Tyrolerfjord form the valley boundary to the south Veg-etation is sparse and mainly found in the valley bottom andon the lower parts of the slopes Cassiope heaths Salix arc-tica snow beds grasslands and fens with sedges and grassesdominate in the lowlands while open Dryas sp heaths andgrasslands form the main plant communities on the slopes(Bay 1998)
We conducted measurements of surface energy balancecomponents and meteorological variables in a wet fen andin a tundra heath with a distance of sim 600 m between thetwo measurement towers The fen area can be divided intoa continuous fen with flat areas dominated by Eriophorumscheuchzeri Carex stans and Duponita psilosantha and ahummocky fen dominated by E triste S arctica and An-dromeda latifolia (Bay 1998 Elberling et al 2008) Thetundra heath site is characterized by Cassiope tetragonaD integrifolia Vaccinium uliginosum and patches of mossesE scheuchzeri and S arctica (Lund et al 2012)
Since August 1995 meteorological and environmentalmonitoring activities have been conducted by the Zack-enberg Ecological Research Operations (ZERO) a part ofthe Greenland Ecosystem Monitoring (GEM) programmeMean annual air temperature in Zackenberg (1996ndash2013) isminus90 C with an average span from minus193 C in January to+63 C in July (Mylius et al 2014) Annual precipitation islow (211 mm) (Mylius et al 2014) and sim 85 consists ofsnow precipitation (Hansen et al 2008) Snow cover is un-evenly distributed in the valley with large deposits on south-facing slopes as winds from the north (offshore) dominateduring the winter (Soegaard et al 2001) During the growingseason winds from the south-east (onshore) dominate (El-berling et al 2008) The area is located within the zone of
The Cryosphere 10 1395ndash1413 2016 wwwthe-cryospherenet1013952016
C Stiegler et al Two years with extreme and little snowfall effects on energy partitioning 1397
Figure 1 (a) Location of the study sites in Zackenberg Northeast Greenland (base map provided by NunaGIS) (b) Characteristics of thestudy sites during the beginning of the snowmelt periods and during the growing seasons in 2013 and 2014
continuous permafrost and active layer thickness at the endof the summer reaches between 04 and 08 m within the val-ley (Christiansen 2004 Pedersen et al 2012)
22 Measurements
Fluxes of H and LE at the wet fen and the dry heath weremeasured by two eddy covariance systems Standard fluxcommunity instrumentation and processing schemes wereused to ensure reliable data quality For example the eddycovariance system at the wet fen uses well-accepted mea-surement standards of ICOS (Integrated Carbon ObservationSystem) At the wet fen a 3 m tower was equipped with a LI-7200 (LI-COR Inc USA) enclosed-path gas analyser anda Gill HS (Gill Instruments Ltd UK) 3-D wind anemometerAir was drawn at a rate of 15 L minminus1 through a 1 m long tube(9 mm inner diameter) Data from both sensors were sampledat a rate of 20 Hz and fluxes were calculated using EddyProsoftware (LI-COR Inc USA) Air temperature (Ta) relativehumidity (RH) and air pressure measured by external sen-sors was used in flux calculations The gas analyser was cal-ibrated based on manual calibrations using air with knownCO2 concentration and based on estimated H2O concentra-tion from TaRH measurements Post-processing and qualitychecks follow standard procedures (Aubinet et al 2012)
At the dry heath a 3 m tower was equipped with a Gill R3(Gill Instruments Ltd UK) sonic anemometer and a LI-7000(LI-COR Inc USA) gas analyser Air was drawn through62 m of tubing (inner diameter 18primeprime) at a rate of 55 L minminus1
to the sensor To ensure that the eddy covariance measure-ments capture all scales of mixed-layer turbulence cospec-tral analysis (Wyngaard and Cote 1972) between the verti-cal wind velocity and turbulent energy flux was performedat both study locations Data processing for both study lo-cations is further summarized in Soegaard et al (2001) andLund et al (2012 2014)
At both locations snow depth measurements (SR50ACampbell Scientific USA) were used to dynamically esti-mate sonic height above the snow layer and soil temper-ature (T107 Campbell Scientific USA) at a depth of 210 20 40 50 and 60 cm soil heat flux (HFP01 HuksefluxThe Netherlands) at a depth of 4 cm net radiation (CNR4Kipp amp Zonen The Netherlands) at a height of 3 m and snowpack temperature at 10 20 40 60 90 and 120 cm above thesoil surface were measured At the dry heath soil moisture(SM 300 Delta-T Devices UK) was measured at a depthof 5 10 30 and 50 cm
Ancillary meteorological parameters such as air temper-ature and humidity (HMP 45D Vaisala Finland) radia-tion components (CNR1 Kipp amp Zonen the Netherlands)and precipitation (52203 RM Young Company USA) are
wwwthe-cryospherenet1013952016 The Cryosphere 10 1395ndash1413 2016
1398 C Stiegler et al Two years with extreme and little snowfall effects on energy partitioning
Table 1 List of parameters and symbols
Name Unit Explanation Location
RSdarr W mminus2 Incoming short-wave radiation Wet fen dry heath Asiaq towerRSuarr W mminus2 Outgoing short-wave radiation Wet fen dry heath Asiaq towerRLdarr W mminus2 Downwelling long-wave radiation Wet fen dry heath Asiaq towerRLuarr W mminus2 Upwelling long-wave radiation Wet fen dry heath Asiaq towerRSnet W mminus2 Net solar radiation (Eq 2) Wet fen dry heath Asiaq towerRLnet W mminus2 Net long-wave radiation (Eq 2) Wet fen dry heath Asiaq towerRnet W mminus2 Net radiation (Eq 2) Wet fen dry heath Asiaq towerAlbedo Surface albedo Wet fen dry heath Asiaq towerTa
C Air temperature Wet fen dry heath Asiaq towerTsurf
C Snow surface temperature Wet fen dry heath Asiaq towerTs
C Soil temperature at 2 and 10 cm depth Wet fen dry heathH W mminus2 Sensible heat flux Wet fen dry heathLE W mminus2 Latent heat flux Wet fen dry heathG W mminus2 Ground heat flux Wet fen dry heathH LE Bowen ratio Wet fen dry heathSnow depth m Snow depth Wet fen dry heath Asiaq towerSoil moisture Soil moisture content Wet fen dry heathMixing ratio g kgminus1 Atmospheric mixing ratio Wet fen dry heathRH Relative humidity Wet fen dry heath Asiaq towerVPD hPa Atmospheric vapour pressure deficit Wet fen dry heath Asiaq towerET mm dayminus1 Evapotranspiration Wet fen dry heathPrecip mm Precipitation Asiaq towerα PriestleyndashTaylor coefficient (Eq 8) Wet fen dry heathu m sminus1 Wind speed Wet fen dry heathulowast m sminus1 Friction velocity Wet fen dry heathra s mminus1 Aerodynamic resistance (Eq 5) Wet fen dry heathrs s mminus1 Surface resistance (Eq 6) Wet fen dry heath McNaughton and Jarvis omega value (Eq 7) Wet fen dry heathNDVI Normalized Difference Vegetation Index Wet fen
provided from a nearby meteorological station operated byAsiaq ndash Greenland Survey This station is located at the sameheath sim 150 m away from the heath eddy covariance towerNormalized Difference Vegetation Index (NDVI) was mea-sured at the wet fen site (SKR 1800 Skye Instruments LtdUK) Power supply for all stations was provided by dieselgenerators from the nearby Zackenberg Research Station(May to October) and by solar panels and a windmill (Su-perwind 350 superwind GmbH Germany) during the periodwhen the research station was closed
23 Data analysis and derived parameters
The surface energy balance of the wet fen and the dry heathis described by
Rnet =H +LE+G+Emelt (1)
where Rnet is the net radiation H is the sensible heat fluxLE is the latent heat flux G is the ground heat flux at thesoil or snow surface and Emelt is the energy flux used forsnowmelt (Table 1) During the snow-free season Emelt iszero When directed away from the surface H LE and G
are positive and Rnet is negative Bowen ratio (H LE) andratios of H Rnet LE Rnet and G Rnet are used to charac-terize relative magnitude of the heat transfer from the surface
The net radiation balance (Rnet) was defined as
Rnet = RS darr +RL darr minus(RS uarr +RL uarr) (2)
where RSdarr and RSuarr are incoming and outgoing short-waveradiation and RLdarr and RLuarr are upwelling and downwellinglong-wave radiation respectively When directed away fromthe surface all radiative components are negative Surfacealbedo was calculated as the quotient between RSdarr and RSuarrMissing values from radiative components at the dry heathsite were filled with measurements from the nearby Asiaqmeteorological tower
Ground heat flux (G) at the soil or snow surface was cal-culated by adding the storage flux in the layer above the heatflux plate (S) to the measured flux
S = Cs1Ts
1td (3)
where 1Ts1t is the change in soil or snow pack temper-ature (K) over time t (s) d is the heat flux plate installa-
The Cryosphere 10 1395ndash1413 2016 wwwthe-cryospherenet1013952016
C Stiegler et al Two years with extreme and little snowfall effects on energy partitioning 1399Ta
ble
2Su
mm
ary
ofpo
larn
ight
and
pre-
mel
tsea
son
Lis
tofm
ean
daily
radi
atio
nco
mpo
nent
san
den
viro
nmen
talc
hara
cter
istic
sdu
ring
the
pola
rnig
htse
ason
san
dpr
e-m
elts
easo
nsin
2012
201
3an
d20
132
014
Pola
rnig
htPr
e-m
elts
easo
n
2012
201
320
132
014
2013
2014
Dur
atio
n10
Nov
ndash4Fe
b10
Nov
ndash4Fe
b5
Febndash
12M
ay5
Febndash
5M
ay
Ave
rage
Ran
geA
vera
geR
ange
Ave
rage
Ran
geA
vera
geR
ange
(sta
ndar
d(s
tand
ard
(sta
ndar
d(s
tand
ard
erro
r)er
ror)
erro
r)er
ror)
RSdarr
(Wmminus
2 )0
00
099
2(8
6)
0ndash58
69
870
(83
)0ndash
577
0R
Suarr(W
mminus
2 )0
00
0minus
819
(68
)0ndashminus
449
5minus
764
(70
)0ndashminus
480
0R
Ldarr
(Wmminus
2 )19
32
(39
)13
34ndash
293
921
31
(47
)14
07ndash
305
718
83
(31
)14
21ndash
269
819
46
(33
)14
13ndash
280
5R
Luarr
(Wmminus
2 )minus
219
2(2
3)minus
176
9ndashminus
295
1minus
237
1(3
1)minus
190
4ndashminus
307
7minus
224
1(2
6)minus
175
5ndashminus
276
5minus
225
7(2
5)minus
173
3ndashminus
285
8R
S net
(Wmminus
2 )0
00
017
1(1
9)
0ndash65
811
0(1
4)
0ndash50
7R
Lne
t(W
mminus
2 )minus
270
(18
)minus
548
ndash10
3minus
241
(21
)minus
696
ndash77
minus35
4(2
1)minus
674
ndash17
5minus
311
(19
)minus
627
ndash14
2R
net
(Wmminus
2 )minus
270
(18
)minus
548
ndash10
3minus
241
(21
)69
6ndash7
7minus
180
(18
)minus
440
ndash37
3minus
205
(17
)minus
482
ndash15
3T
a(
C)
minus19
2(0
6)minus
287
ndashminus
48
minus15
2(0
7)minus
278
ndashminus
08
minus18
1(0
7)minus
235
ndashminus
65
minus17
6(0
6)minus
294
ndashminus
385
Tsu
rf
(C
)minus
241
(06
)minus
368
ndashminus
46
minus19
2(0
8)minus
324
ndashminus
17
minus22
8(0
7)minus
373
ndashminus
90
minus22
3(0
7)minus
380
ndashminus
67
Air
pres
sure
(hPa
)10
100
(11
)98
31ndash
1030
610
035
(12
)95
69ndash
1021
310
191
(12
)99
91ndash
1050
010
070
(11
)97
55ndash
1030
4
tion depth (m) and Cs is the soil or snow pack heat capacity(J mminus3 Kminus1) defined as
Cs = ρbCd+ θvρwCw (4)
where ρb is the bulk density Cd is the dry soil heat capac-ity of 840 J kgminus1 Kminus1 (Hanks and Ashcroft 1980) or theheat capacity of ice (2102 J kgminus1 Kminus1) θv is the volumet-ric soil or snow pack water content (m3 mminus3) ρw is the wa-ter density (1000 kg mminus3) and Cw is the water heat capacity(4186 J kgminus1 Kminus1) For ρb a value of 900 kg mminus3 at the heathand 600 kg mminus3 at the fen (Elberling et al 2008) was usedduring the growing season while during the snowmelt pe-riod in 2014 the density of the snow pack was derived fromin situ measurements Since no snow density measurementswere performed during the snowmelt period in 2013 and thesoil surface was not completely snow covered during that pe-riod G in 2013 was not corrected for heat storage within thesnow pack
The aerodynamic resistance (ra s mminus1) determines the tur-bulent heat transfer from the surface and was defined as(Monteith and Unsworth 2013)
ra =u
u2lowast
+ 62uminus067lowast (5)
where u is the wind speed (m sminus1) and ulowast is the friction ve-locity (m sminus1)
Surface resistance (rs s mminus1) as a measure to quantify thestomatal control in the canopy on the turbulent fluxes wascalculated as (Shuttleworth 2007)
rs =
(1
γβ minus 1
)ra+ (1+β)
ρcp
γ
D
A (6)
where 1 is the slope of the saturated vapour pressure curve(Pa Kminus1) γ is the psychrometric constant (Pa Kminus1) β is theBowen ratio ρ is the air density (kg mminus3) cp is the spe-cific heat capacity of air at constant pressure (J kgminus1 Kminus1)D is the atmospheric vapour pressure deficit (Pa) and A isthe available energy for evaporation (RnetminusG W mminus2)
The decoupling coefficient () (Jarvis and McNaughton1986) expresses the degree of interaction between ra and rs
=
(1+
1
1+ γ
rs
ra
)minus1
(7)
The decoupling coefficient varies from 0 to 1 where closeto 0 indicates a strong coupling between the vegetation andthe atmosphere with vapour pressure deficit (VPD) being themain driver of LE whereas close to 1 suggest a decouplingof LE and VPD with Rnet being the main driver for LE
PriestleyndashTaylor coefficient (α) (Priestley and Taylor1972) was calculated as
α =1+ γ
1(1+β) (8)
wwwthe-cryospherenet1013952016 The Cryosphere 10 1395ndash1413 2016
1400 C Stiegler et al Two years with extreme and little snowfall effects on energy partitioning
Over ocean and saturated land surfaces the dimensionless αequals 126 but fluctuates depending on surface structure andmeteorological conditions
To assess the full impact of differences in snow accumu-lation on the surface energy exchange the presented resultsfocus on four major subperiods ie polar night pre-melt sea-son snowmelt period and growing season which we definedas follows Polar night is the time period when the sun isbelow the free horizon In Zackenberg the polar night lastsfrom 10 November to 4 February (86 days) The subsequentpre-melt season marks the time period between the polarnight and the first day of snowmelt In spring a steady andconstant decrease in daily average albedo and snow coverthickness until snow cover diminished was defined as thesnowmelt period The beginning of the subsequent grow-ing season was defined as the time when albedo was lowerthan 02 Positive daily average air temperature and top-soillayer temperature (2 cm depth) net radiationgt 0 W mminus2 andalbedo lower than 02 define the growing season
Gap filling of the eddy covariance data was performedbased on a look-up table approach (Falge et al 2002 Re-ichstein et al 2005 Eddy covariance gap-filling amp flux-partitioning tool 2015) using the REddyProcWeb online tool(Max Planck Institute for Biogeochemistry) Due to verylimited data availability at both locations during the secondsnowmelt period in 2014 no gap filling ofH and LE was ap-plied and turbulent fluxes of H and LE were excluded fromthe analysis during that period
3 Results
31 Energy balance closure
The observed slopes of the regressions between availableenergy at the surface (RnetminusG) and the sum of the turbu-lent heat fluxes (H +LE) serve as an indicator for the en-ergy balance closure Figure 2 shows the comparison be-tween mean daily RnetminusG and mean daily H +LE for thetwo study sites The observed slopes at the wet fen are 068during both 2013 and 2014 For the dry heath the slopesare 081 (2013) and 082 (2014) Possible reasons for theobserved energy imbalance at both sites are discussed inSect 41
32 Polar night and pre-melt season
The pattern of snow accumulation during the polar night andpre-melt season differed strongly between the two winters(Fig 1b) There was no distinct development of a closedsnow cover or major events of snow accumulation duringthe first winter (20122013) and by the end of the pre-melt season as little as 009 m of snow pack at the wet fenand 014 m at the dry heath was present The second win-ter (20132014) showed a similar trend in the beginning ofthe winter with snow pack thickness of less than 01 m until
Figure 2 Energy balance closure mean daily available energy(RnetminusG) and turbulent heat fluxes (H +LE) at the wet fen (up-per panels) and the dry heath (lower panels) during the observationperiods in 2013 and 2014
mid-December 2013 After that a snow pack of 08 m de-veloped during two major events of snowfall (17ndash25 Decem-ber 2013 and 21ndash27 January 2014) and by the end of thesecond winter the snow pack reached a thickness of 104 mat the wet fen and 098 m at the dry heath (Fig 3)
In the absence of solar radiation during the polar nightthermal radiation (RLnet) (Table 2) is the sole driver ofthe surface energy balance (Fig 3) Daily average down-welling long-wave radiation (RLdarr) was 193 W mminus2 duringthe first polar winter (20122013) and 213 W mminus2 during thesecond polar winter (20132014) The corresponding valuesfor the upwelling long-wave radiation (RLuarr) were 219 and237 W mminus2 for the two polar winter periods The differencesin long-wave radiation corresponded well with the differ-ences in air and snow surface temperatures The average airtemperature wasminus192 andminus152 C for the two consecutivepolar winter periods and the snow surface temperature wasminus241 andminus192 C respectively Overall average RLnet wasminus27 W mminus2 in 20122013 and minus24 W mminus2 in 20132014The lowest air temperatures (minus337 andminus337 C) and snowsurface temperatures (minus398 and minus399 C) for both polarwinters however were reached shortly after the onset of thepre-melt seasons In 2013 this coldest period was followedby a foehn event with air temperatures just below minus1 C on7 March Incoming solar radiation (RSdarr) showed a continu-ous increase over the pre-melt season with higher values ob-
The Cryosphere 10 1395ndash1413 2016 wwwthe-cryospherenet1013952016
C Stiegler et al Two years with extreme and little snowfall effects on energy partitioning 1401
Figure 3 Polar night and pre-melt seasons of the winters 20122013and 20132014 Characteristics of snow cover development air tem-perature net long-wave radiation (RLnet) and net short-wave radia-tion (SWnet) during the polar night periods and subsequent pre-meltseasons of the winters 20122013 and 20132014 (Asiaq-station)
served during the winter 20122013 compared to 20132014mainly driven by differences in surface albedo
33 Snowmelt season
At the beginning of the snowmelt period in 2013 the veg-etation on both sites was not completely snow coveredSnowmelt started on 13 May and lasted until 29 May(17 days) at the wet fen and until 30 May (18 days) at the dryheath Snow ablation in 2014 however started 7 days earliercompared to 2013 (6 May) but lasted 28 days longer at thedry heath site (27 June) and 25 days longer at the wet fen site(23 June) Daily average air temperatures remained below0 C for most of the snowmelt periods with average values ofminus18 C in 2013 and minus13 C in 2014 (Fig 4) High rates ofsnow ablation after 6 June 2014 coincided with daily averageair temperaturesgt 0 C which peaked on 16 June 2014 with96 C
During the snowmelt period in 2013 albedo decreasedgradually from about 076 in the beginning of the pe-riod down to 015 for the wet fen and 010 for the dryheath (Fig 4) The decrease in albedo happened simulta-neously with a continuous increase in net radiation (Rnet)(Fig 4) However while daily average Rnet remained neg-
ative for most of the first half of the snowmelt period in 2014(Fig 4) positive values dominated the entire snowmelt pe-riod in 2013 Substantial differences in albedo cause thesevariations especially in the beginning of the snowmelt sea-sons when daily average albedo was gt 060 During that pe-riod average albedo at both sites was 071 in 2013 and 079in 2014 These differences in the surface characteristics re-duced average Rnet in 2014 by 41 W mminus2 although incom-ing solar radiation (RSdarr) was 870 W mminus2 higher comparedto 2013 By the end of the snowmelt period in 2013 Rnetaccumulated 761 MJ mminus2 at the dry heath and 943 MJ mminus2
at the wet fen The corresponding values for 2014 were1745 and 2029 MJ mminus2 respectively Due to the loweralbedo during the first snowmelt season the soil experi-enced a faster spring warming compared to 2014 Top-soil layer temperatures (Tsurf) at the dry heath increased by041 C dayminus1 in 2013 and 028 C dayminus1 in 2014 At the wetfen the warming of the soil was 035 C dayminus1 in 2013 and028 C dayminus1 in 2014
Daily average H was small and negative (minus41 W mminus2)during the first 10 days of the snowmelt period in 2013 at thewet fen while it showed slightly positive values (43 W mminus2)at the dry heath (Fig 4) LE increased gradually up to about18 W mminus2 at the wet fen and up to 23 W mminus2 at the dry heath(Fig 4) During this initial period the net radiation increasedgradually up to about 58 W mminus2 at the wet fen and 43 W mminus2
at the dry heath Over the entire snowmelt period H domi-nated over LE at the dry heath (Bowen ratio 17) with meandaily average H and LE of 250 and 149 W mminus2 respec-tively while at the wet fen LE dominated over H (Bowenratio 05) with average H and LE of 76 and 156 W mminus2
(Table 3) By the end of the snowmelt periodH accumulated325 MJ mminus2 at the dry heath and 35 MJ mminus2 at the wet fenThe corresponding values for LE were 227 and 211 MJ mminus2
respectively This corresponds to accumulated evaporation of93 and 86 mm of evaporated water during the entire springsnowmelt at the dry heath and the wet fen
During both years G at the wet fen and the dry heathused sim 10ndash15 of the total energy supplied by Rnet Theprolonged snowmelt period during the second year had noimpact on the magnitude of G However the total amountof energy supplied to the ground was larger in 2014 thanin 2013 At the dry heath average G of 51 W mminus2 in 2013and 51 W mminus2 in 2014 resulted in a total energy consump-tion of 80 MJ mminus2 in the first year and 205 MJ mminus2 inthe second year Similar behaviour was observed at the wetfen where average G of 84 W mminus2 in 2013 and 72 W mminus2
in 2014 added up to a total energy consumption of 102 and286 MJ mminus2 The average latent heat content of snow coverduring the snowmelt period in 2014 was 31 MJ mminus2 whichequals 18 of Rnet at the dry heath and 15 of Rnet at thewet fen
wwwthe-cryospherenet1013952016 The Cryosphere 10 1395ndash1413 2016
1402 C Stiegler et al Two years with extreme and little snowfall effects on energy partitioning
Table3Sum
mary
ofsnowm
eltperiodlistofmean
dailysurface
energybalance
andenvironm
entalcharacteristicsduring
thesnow
meltperiod
in2013
and2014
atthew
etfenand
dryheath
site
Wetfen2013
Wetfen2014
Dry
heath2013D
ryheath2014
Duration
13ndash29M
ay6
Mayndash23
June13ndash30
May
6M
ayndash27June
Average
Range
Average
Range
Average
Range
Average
Range
(standard(standard
(standard(standard
error)error)
error)error)
RSdarr
(Wmminus
2)2603
(193)1110ndash3559
2924(96)
1057ndash38792527
(176)1134ndash3406
2905(87)
1087ndash3805R
Suarr
(Wmminus
2)minus
1347(94)
minus689ndash
minus2046
minus2057
(112)minus
144ndashminus
2735minus
1468(111)
minus442ndash
minus2130
minus2132
(101)minus
271ndashminus
2764R
Ldarr
(Wmminus
2)2729
(56)2375ndash3146
2753(48)
2096ndash33332511
(63)2137ndash2956
2769(47)
2081ndash3336R
Luarr
(Wmminus
2)minus
3203(23)
minus3095ndash
minus3433
minus3141
(31)minus
2643ndashminus
3434minus
3029(23)
minus2935ndash
minus3285
minus3161
(31)minus
2635ndashminus
3632R
Snet (W
mminus
2)1255
(185)297ndash2838
867(78)
186ndash24891059
(159)245ndash2590
773(79)
151ndash3215R
Lnet (W
mminus
2)minus
474(64)
minus833ndash
minus66
minus388
(26)minus
696ndashminus
29minus
517(70)
minus974ndash
minus73
minus392
(28)minus
802ndashminus
19R
net (Wmminus
2)781
(130)186ndash2005
479(82)
minus81ndash1926
542(101)
128ndash1682381
(77)minus
143ndash2414A
lbedo057
(003)031ndash078
068(002)
0026ndash090063
(004)017ndash080
073(001)
047ndash092H
(Wmminus
2)76
(43)minus
91ndash528ndash
ndash250
(65)minus
48ndash995ndash
ndashL
E(W
mminus
2)156
(22)33ndash402
ndashndash
149(18)
35ndash302ndash
ndashG
(Wmminus
2)84
(12)40ndash230
72(12)
minus23ndash383
51(04)
17ndash8551
(11)minus
18ndash371T
a(C
)minus
16(04)
minus37ndash30
minus14
(07)minus
107ndash96minus
16(04)
minus37ndash30
minus12
(06)minus
107ndash96T
s(C
)lowast
minus68
(06)minus
105ndashminus
03minus
63(06)
minus118ndash17
minus24
(05)minus
77ndash03minus
48(07)
minus114ndash35
Airpressure
(hPa)10170
(10)10113ndash10253
10149(09)
10004ndash1028010170
(10)10113ndash10253
10145(09)
10004ndash10280E
T051
(008)012ndash141
ndashndash
052(007)
013ndash106ndash
ndash
lowastM
easuredat2
cmdepth
The Cryosphere 10 1395ndash1413 2016 wwwthe-cryospherenet1013952016
C Stiegler et al Two years with extreme and little snowfall effects on energy partitioning 1403
Figure 4 Snowmelt periods 2013 and 2014 Development of mean daily snow cover thickness albedo net radiation (Rnet) sensible heatfluxes (H ) latent heat fluxes (LE) and ground heat fluxes (G) at the wet fen (left panels) and dry heath (right panels) during the snowmeltperiod in 2013 and 2014 and first 5 days of the growing season in 2013 and 2014
34 Growing season
341 Season length and meteorological conditions
The growing season in 2013 lasted 101 days at the wetfen (30 Mayndash8 September) and 100 days at the dry heath(31 Mayndash8 September) Compared to 2013 the seasonin 2014 was 30 days shorter on the wet fen (24 Junendash4 September) and 31 days shorter at the dry heath (28 Junendash4 September) The length of the growing season in the firstyear clearly exceeds the average 2000ndash2010 length (78 days)while the second year shows below-average length of thegrowing season (Lund et al 2014) Mean JulyndashAugust airtemperatures (Ta) were similar in both years reaching 65 Cin the first year and 63 C in the second year mean Ta overthe entire growing seasons were lower in 2013 (53 C) com-pared to 2014 (61 C) (Fig 5) Growing season air tem-perature in 2013 was slightly below the 2000ndash2010 average(55 C) (Lund et al 2014) and above average in 2014 Totalamount of precipitation during both years clearly exceed the2000ndash2010 average of 272 mm (Lund et al 2014) reaching80 mm in 2013 and 655 mm in 2014 In 2013 pronouncedevents of rainfall (gt 5 mm dayminus1) occurred at the end of thegrowing season while in the second year precipitation mainlyfell shortly after snowmelt and in late August (Fig 5)
342 Radiation balance
During the growing season in 2013 mean daily Rnet wasslightly higher at the wet fen (1142 W mminus2) compared to
the dry heath (1114 W mminus2) (Table 4) while during JulyndashAugust both sites showed similar Rnet (sim 93 W mminus2) Com-pared to 2013 mean daily Rnet was slightly higher dur-ing JulyndashAugust 2014 with 943 W mminus2 at the wet fen and986 W mminus2 at the dry heath but lower over the entire grow-ing season with 1002 and 989 W mminus2 respectively (Table 4Fig 6) By the end of the season in 2013 accumulated Rnetwas 10066 MJ mminus2 at the wet fen and 9674 MJ mminus2 at thedry heath compared to 6322 and 5895 MJ mminus2 in 2014 Thisincrease of accumulated Rnet by 59 (fen) and 64 (heath)in 2013 relates to the earlier onset of the growing seasonBy 24 June 2013 accumulated Rnet at the wet fen reached406 MJ mminus2 during the first 25 days of the growing seasonwhile in 2014 the growing season started on 24 June and thesurface was thus still snow covered until that date Similarvalues were observed at the dry heath (423 MJ mminus2)
In 2013 mean surface albedo at both sites increased grad-ually during the growing season and reached its maximumtowards the end of the season Over the entire growing sea-son albedo was higher at the wet fen (020) compared to thedry heath (016) During a snowfall event on 30 August 2013albedo increased up to 032 Similar trends in albedo wereobserved in 2014 but mean surface albedo over the entiregrowing season was lower compared to 2013 with 017 at thewet fen and 013 at the dry heath The differences betweenthe 2 years are more pronounced during the period JulyndashAugust when mean albedo was 020 (2013) and 016 (2014)at the wet fen and 016 (2013) and 012 (2014) at the dryheath The pronounced visible differences in greenness dur-
wwwthe-cryospherenet1013952016 The Cryosphere 10 1395ndash1413 2016
1404 C Stiegler et al Two years with extreme and little snowfall effects on energy partitioning
Table4Sum
mary
ofgrowing
seasonListofm
eandaily
surfaceenergy
balanceand
environmentalcharacteristics
duringthe
growing
seasonsin
2013and
2014atthe
wetfen
anddry
heathsite
Wetfen
Dry
heath
20132014
20132014
Duration
30M
ayndash8Sep
24Junndash4
Sep31
Mayndash8
Sep28
Junndash4Sep
Average
Range
Average
Range
Average
Range
Average
Range
(standard(standard
(standard(standard
error)error)
error)error)
RSdarr
(Wmminus
2)2115
(109)177ndash3693
1790(108)
174ndash37512104
(109)157ndash3696
1712(107)
157ndash3706R
Luarr
(Wmminus
2)minus
3617(14)
minus3292ndash
minus3906
minus3644
(16)minus
3401ndashminus
3982minus
3560(15)
minus3194ndash
minus3817
minus3662
(18)minus
3403ndashminus
3999R
Ldarr
(Wmminus
2)3051
(22)2574ndash3509
3140(25)
2608ndash35702915
(28)2265ndash3486
3136(26)
2614ndash3565R
Suarr
(Wmminus
2)minus
411(22)
minus21ndashminus
831minus
283(18)
minus21ndashminus
569minus
407(22)
minus21ndashminus
749minus
197(13)
minus07ndashminus
439R
Snet (W
mminus
2)1704
(87)157ndash2983
1507(91)
153ndash32221697
(88)136ndash2983
1515(94)
150ndash3364R
Lnet (W
mminus
2)minus
566(28)
minus984ndash
minus24
minus505
(31)minus
984ndashminus
45minus
714(35)
minus1119ndash
minus44
minus526
(34)minus
1048ndashminus
45R
net (Wmminus
2)1142
(64)52ndash2083
1002(71)
minus20ndash2319
1114(61)
63ndash2013989
(70)03ndash2468
Albedo
020(0003)
013ndash031017
(0005)007ndash028
016(0004)
008ndash032013
(0006)006ndash026
H(W
mminus
2)415
(34)minus
238ndash1017266
(29)minus
295ndash851626
(46)minus
259ndash1495369
(38)minus
296ndash1077L
E(W
mminus
2)252
(15)18ndash572
233(20)
minus59ndash657
160(06)
36ndash391293
(18)59ndash690
G(W
mminus
2)108
(09)minus
39ndash565152
(13)minus
21ndash47556
(03)minus
15ndash169101
(09)minus
04ndash373H
LE
16(01)
016ndash4311
(01)028ndash309
43(02)
003ndash8316
(01)028ndash309
HR
net036
(001)003ndash057
027(001)
001ndash040054
(002)011ndash088
038(001)
005ndash056L
ER
net022
(001)004ndash061
023(001)
001ndash035018
(001)008ndash056
033(001)
012ndash070G
Rnet
012(001)
004ndash061017
(001)001ndash035
005(0003)
007ndash056010
(001)012ndash070
Ta
(C
)53
(03)04ndash119
58(03)
05ndash12953
(03)04ndash119
61(03)
21ndash129T
s(C
)lowast
40(03)
minus20ndash83
50(02)
minus06ndash96
ndashndash
33(02)
minus05ndash65
Soilmoisture
()
ndashndash
ndashndash
190(04)
131ndash322336
(02)314ndash383
Airpressure
(hPa)10044
(07)9894ndash10183
10099(06)
9996ndash1019310043
(07)9894ndash10183
10099(06)
9996ndash10193M
ixingratio
(gkgminus
1)66
(02)41ndash109
65(02)
42ndash11266
(02)41ndash109
66(02)
46ndash112R
H(
)711
(16)339ndash972
765(18)
424ndash986712
(16)339ndash971
755(19)
424ndash986V
PD(hPa)
24(02)
03ndash6720
(02)01ndash65
24(02)
03ndash6722
(02)01ndash65
ET
(mm
dayminus
1)089
(005)006ndash20
082(007)
minus021ndash231
056(002)
013ndash138103
(006)021ndash243
α060
(002)006ndash105
069(003)
022ndash114044
(002)006ndash116
074(002)
015ndash104u
(msminus
1)27
(01)14ndash110
24(02)
10ndash9928
(02)14ndash124
25(02)
10ndash103ulowast
(msminus
1)025
(001)012ndash091
022(002)
009ndash095024
(002)009ndash112
020(001)
009ndash080ra
(smminus
1)742
(05)48ndash1596
815(07)
52ndash15941074
(10)44ndash3373
1197(13)
72ndash3367rs
(smminus
1)2177
(70)655ndash4550
1654(84)
525ndash44155557
(219)932ndash9229
2467(108)
642ndash4281
038(001)
002ndash071048
(002)001ndash074
030(001)
014ndash063052
(001)036ndash076
ND
VI
045(0004)
001ndash068049
(0006)003ndash074)
ndashndash
ndashndash
lowastM
easuredat10
cmdepth
The Cryosphere 10 1395ndash1413 2016 wwwthe-cryospherenet1013952016
C Stiegler et al Two years with extreme and little snowfall effects on energy partitioning 1405
Figure 5 Growing seasons 2013 and 2014 Development of meandaily air temperature precipitation incoming solar radiation (RSdarr)and vapour pressure deficit (VPD) during the growing seasonsin 2013 and 2014 (Asiaq-station)
ing the two growing seasons (Fig 1b) was also reflected inaverage NDVI with higher values observed in 2014 (049)compared to 2013 (045) (Table 4)
343 Turbulent heat fluxes
The magnitude of the turbulent heat fluxes and the totalamount of accumulated energy by H and LE revealed re-markable differences between the 2 years (Figs 6 and 7)Over the entire growing season in 2013 average fluxes ofH and LE used 56 (626 W mminus2) and 14 (160 W mminus2)respectively of Rnet at the dry heath The correspondingvalues for the wet fen were 37 (415 W mminus2) and 30 (252 W mminus2) respectively (Table 4) This clear dominanceof H over LE at both locations is also reflected in the av-erage Bowen ratio (H LE) which reached a maximum of39 at the dry heath and 16 at the wet fen
During 2014 LE at the dry heath used 26 (293 W mminus2)of Rnet (Table 4) This corresponds to an almost doubling ofLE compared to 2013 Mean fluxes of H at the dry heathwere 366 W mminus2 and H used 37 of Rnet Average Bowenratio reached 13 which indicates a growing importance ofLE at the dry heath compared to 2013 At the wet fen mean
daily LE was 233 W mminus2 and LE used 25 ofRnet The cor-responding value forH was 266 W mminus2 andH used 29 ofRnet Average Bowen ratio reached 11
From the first day after snowmelt until the last day of thegrowing season in 2013 accumulated H was 5462 MJ mminus2
at the dry heath and 3657 MJ mminus2 at the wet fen whileaccumulated LE was 1399 and 2220 MJ mminus2 respectively(Fig 7) By the end of the growing season in 2014 how-ever accumulated H was 2202 MJ mminus2 at the dry heath and1678 MJ mminus2 at the wet fen The corresponding values forLE were 1747 and 1469 MJ mminus2 respectively (Fig 7) Theobserved values of accumulated H at the dry heath dur-ing 2014 correspond to a decrease in accumulated H by60 and an increase in accumulated LE by 24 comparedto 2013 At the wet fen accumulated H and LE in 2014 cor-respond to a decrease by 44 and 33 respectively comparedto 2013
The total accumulated evapotranspiration (ET) differedsignificantly between the seasons (Fig 8) At the wet fentotal ET reached 91 mm during the growing season in 2013and 48 mm in 2014 These values correspond to sim 114 andsim 73 of the total precipitation during the growing sea-sons within the corresponding years However total ET atthe dry heath remained below the growing season precipi-tation during the first growing season (57 mm sim 71 ) andexceeded precipitation in the second growing season (80 mmsim 122 )
344 Controls of evapotranspiration
During both growing seasons lower wind velocity at the dryheath compared to the wet fen resulted in slightly larger aero-dynamic resistances (ra) at the latter site Daily average rashowed no clear difference between the 2 years ranging be-tween 75 and 82 s mminus1 in both years at the wet fen The cor-responding values at the dry heath were between 107 and120 s mminus1 with slightly larger variability compared to the wetfen (Fig 9) No significant changes during the course of bothgrowing seasons indicate that ra appeared to be independentof RSdarr and Rnet and therefore mainly driven by atmosphericconditions
The surface resistance (rs) during both growing seasonshowever was characterized by large differences between thewet fen and the dry heath and high daily fluctuations at thelatter site (Fig 9) Daily average rs at the dry heath rangedfrom 93 to 923 s mminus1 in 2013 and from 64 to 428 s mminus1
in 2014 with higher mean rs in 2013 (556 s mminus1) com-pared to 2014 (247 s mminus1) During the first growing sea-son rs showed a general increase with increasing air tem-perature (Ta) ranging from sim 455 s mminus1 when Talt 0 C tosim 804 s mminus1 when Tagt 12 C During the second growingseason rs decreased from sim 297 s mminus1 when Talt 0 C tosim 210 s mminus1 when Ta was between 3 and 6 C followed bya slight increase to 250 s mminus1 when Tagt 12 C However nosuch trend was observed at the wet fen and the surface resis-
wwwthe-cryospherenet1013952016 The Cryosphere 10 1395ndash1413 2016
1406 C Stiegler et al Two years with extreme and little snowfall effects on energy partitioning
Figure 6 Growing season energy fluxes Mean daily net radiation (Rnet) sensible heat flux (H ) latent heat flux (LE) and ground heatflux (G) at the wet fen and dry heath during the growing seasons in 2013 (left panels) and 2014 (right panels)
Figure 7 Development of internal energy Accumulated ground heat (G) latent heat (LE) and sensible heat (H ) at the wet fen (left panels)and the dry heath (right panels) during the growing seasons in 2013 and 2014
Figure 8 Development of soil moisture conditions (10 cm depth)and evapotranspiration (ET) Mean daily soil moisture content atthe dry heath (left panel) and cumulative ET at the wet fen and dryheath during the growing season in 2013 and 2014 (right panel)
tance had no pronounced daily fluctuations with daily aver-ages ranging between 53 and 455 s mminus1
The McNaughton and Jarvis decoupling factor () ex-presses the degree of aerodynamic and radiative coupling be-tween the vegetation and the atmosphere The wet fen andthe dry heath were characterized by mean daily below orclose to 05 during both growing seasons which indicates arelatively high contribution of VPD on the control of ET (Ta-ble 4 Fig 9) However mean daily during the first grow-ing season was lower at the dry heath (030) compared to the
wet fen (038) but showed a reverse trend during the secondyear with 052 compared to 048 The general decrease in over the course of the first season at the dry heath terminatedaround mid-August and started to increase for the rest ofthe season Similar behaviour for was observed at the wetfen where started to increase around late August The sec-ond growing season showed a general decrease in at bothsites During both growing seasons gradually decreasedas rs increased The PriestleyndashTaylor coefficient (α) showedlarge day-to-day variations particularly at the wet fen rang-ing between 005 and 106 in 2013 and 021 and 113 in 2014The seasonal mean of α was 060 and 069 with a standarderror of 002 and 003 for the respective seasons The day-to-day variation was less pronounced at the dry heath withseasonal means of 044 and 074 and standard error of 002for both years (Table 4 Fig 9)
345 Ground heat flux and soil properties
G was the smallest flux in both ecosystems but due to thestrong heat sink of permafrost G is a vital component ofthe surface energy budget in this high-latitude environment
The Cryosphere 10 1395ndash1413 2016 wwwthe-cryospherenet1013952016
C Stiegler et al Two years with extreme and little snowfall effects on energy partitioning 1407
Figure 9 Omega alpha aerodynamic resistance and surface resistance Mean daily (empty circles) and 5-day running mean (solid line)of McNaughton and Jarvis decoupling factor (omega) Priestley and Taylor alpha value (alpha) aerodynamic resistance (ra) and surfaceresistance (rs) at the wet fen (left panels) and dry heath (right panels) during the growing seasons in 2013 and 2014
The differences in snow cover between the 2 years causeddistinct differences in the soil water content during the twogrowing seasons with strong impact on the partitioning ofRnet into G at the dry heath Average soil moisture con-tent at the dry heath of 19 in 2013 and 34 in 2014 re-strained thermal conductivity more during 2013 than dur-ing 2014 Consequently only 5 of Rnet (56 W mminus2) waspartitioned intoG in 2013 while during 2014G used 10 ofRnet (101 W mminus2) At the wet fen mean daily G used 12 of Rnet (108 W mminus2) in 2013 while in 2014 G used 17 ofRnet (152 W mminus2)
During the course of the two growing seasons G reachedits maximum shortly after snowmelt due to the strong ther-mal gradient between the soil surface and the underlying per-mafrost (Fig 6) However the low soil moisture content atthe dry heath during the first growing season weakened theG signal after the snowmelt No clear seasonal trend in thedevelopment of G to Rnet was observed for both growingseasons and locations By the end of the first growing sea-son accumulated G was 487 MJ mminus2 at the dry heath and947 MJ mminus2 at the wet fen (Fig 7) Increased thermal con-ductivity due to higher soil moisture content in 2014 com-pared to 2013 amplified the total amount of accumulated Gat the dry heath in the latter year although prolonged snowcover reduced the length of the second growing season Bythe end of the second growing season accumulated G was601 MJ mminus2 at the dry heath (+23 compared to 2013)
while at the wet fen no clear difference in accumulated Gwas observed (956 MJ mminus2)
35 Total surface energy balance of the snowmeltseason and growing season
From the first day of the beginning of the snowmelt perioduntil the last day of the growing season in 2013 Rnet accu-mulated 10435 MJ mminus2 at the dry heath and 11009 MJ mminus2
at the wet fen The corresponding values for 2014 were7640 and 8351 MJ mminus2 respectively Accumulated groundheat flux for the same time period was 567 MJ mminus2 at thedry heath and 1038 MJ mminus2 at the wet fen in 2013 and832 and 1253 MJ mminus2 in 2014 respectively These valuescorrespond to a total amount of accumulated available en-ergy at the surface (RnetminusG) of 9868 MJ mminus2 at the dryheath and 9971 MJ mminus2 at the wet fen in 2013 In 2014RnetminusG was 6834 MJ mminus2 at the dry heath and 7118 MJmminus2 at the wet fen which compared to 2013 relates to a de-crease in available energy at the surface by minus31 and minus29 respectively
In 2013 the amount of total H loss was 5787 MJ mminus2 atthe dry heath and 3692 MJ mminus2 at the wet fen while total LEloss was 1626 and 2431 MJ mminus2 respectively These valuesadd up to a total energy consumption ofH and LE (H +LE)of 7413 MJ mminus2 at the dry heath and 6123 MJ mminus2 at thewet fen
wwwthe-cryospherenet1013952016 The Cryosphere 10 1395ndash1413 2016
1408 C Stiegler et al Two years with extreme and little snowfall effects on energy partitioning
4 Discussion
41 Energy balance closure and system performance
The observed values of energy balance closure lie in therange of other energy balance closure terms reported fromvarious field studies in Arctic environments (Westerman etal 2009 Langer et al 2011 Liljedahl et al 2011) and are ingood agreement with earlier long-term observations from thedry heath (Lund et al 2014) Studies on the closure problemof eddy covariance measurements highlight the landscapeheterogeneity as a driving factor for the lack of closure (Stoyet al 2013) but also stress the importance of measurementscales (Foken 2008) Due to the striking small-scale hetero-geneity of soil moisture availability and vegetation cover inArctic landscapes measurements of point-scaleG and radia-tive components may not represent the large source area ofeddy covarianceH and LE However at our sites a flux foot-print analysis at the dry heath revealed that fluxes of H andLE on average originate from the Cassiope heath (Lund etal 2012) while the highest contribution of fluxes at the wetfen originates from the continuous fen area (Tagesson et al2012) Large variability in soil heat capacity due to spatialvariation in soil moisture may account for underrepresenta-tion of the stored energy between the heat flux plates and thesoil surface within the eddy covariance flux footprint area(Leuning et al 2012) Additional uncertainty in the assess-ment of G arises from small-scale variation in active layerdepth and soil thermal gradients
Previous studies have shown large high-frequency flux at-tenuation of traditional closed-path gas analysers (Haslwan-ter et al 2009) such as used in this study at the dry heathsite caused by tube walls and tube age (Su et al 2004Massman and Ibrom 2008) and tube length (Novik et al2013) Enclosed-path systems however reduce flux atten-uation compared to traditional closed-path systems due toshorter tube length (Burba et al 2010 Novick et al 2013)Sample screening of cospectra at our two study sites (datanot shown) showed that frequency losses for water vapourand sensible heat flux were more pronounced at the wet fen(enclosed-path system) compared to the dry heath (closed-path system) At both locations the attenuation is generallygreater for water vapour flux than for sensible heat flux andat higher frequencies (ngt 01) normalized cospectra for wa-ter vapour flux was lower at the wet fen compared to the dryheath Interannual comparison of cospectra for both wet fenand dry heath showed similar behaviour of water vapour andsensible heat flux Thus we conclude that besides the het-erogeneity of the tundra surfaces high-frequency losses ofboth water vapour and sensible heat fluxes contribute to theobserved surface energy imbalance However since surfaceenergy imbalance is consistent over the 2 study years we areconfident that the measured surface energy balance compo-nents are adequately represented for the purpose of this study
42 Snow cover and surface energy budget
The disappearance of the snow cover and the onset of thegrowing season coincide with the time period when incom-ing solar radiation (RSdarr) is at its annual peak and the sur-face (soil or snow) receives high irradiance from RSdarr Dur-ing the snowmelt period most of Rnet is used for warmingand melting of the snow pack and therefore not available foratmospheric warming through sensible heat fluxes This pat-tern was reflected in the average air temperature of the twosnowmelt periods which showed only small differences be-tween 2013 and 2014 although the snowmelt period in 2014was much longer compared to 2013 The combination ofsnow layer thickness snow physical properties such as den-sity or grain size (Warren 1982) the fraction of exposed darkunderlying surface and type of vegetation (Sturm and Dou-glas 2005) controls the snow and soil surface albedo withdirect impact on Rnet Our results showed that low and partlyabsent snow cover in the winter 20122013 resulted in a shortsnowmelt period dominated by low albedo of the snowndashsoilsurface and increased average Rnet Simultaneously sensibleheat fluxes dominated at the dry heath while latent heat fluxesdominated at the wet fen Relatively thick snow cover and aprolonged snowmelt period in 2014 increased surface albedoand limited average Rnet Further the total energy accumu-lated by Rnet during the snowmelt period was higher in 2014compared to 2013
During the snowmelt period only a small fraction ofRnet can be used by plants for growth and development asthe snow reflects most of the incoming solar radiation andsustains relatively low surface temperatures (Walker et al2001) Consequently a prolonged period of snow cover andsnowmelt at our study sites in 2014 delayed the onset of thegrowing season and limited the amount of totalRnet availablefor plant metabolism In coherence with that the magnitudeof the surface energy balance components and the partition-ing of Rnet into H LE and G continued to be influencedby the presence of the snow An earlier disappearance of thesnow in 2013 however was related to an earlier increase inthe magnitude of Rnet at the surface which facilitated earlierplant development and growth soil warming and permafrostactive layer development through G evapotranspirative heatloss through LE and atmospheric warming through H
The disappearance of the snow and related increase in sur-face heating mark the transition into a convective summer-type precipitation regime (Callaghan et al 2011b) whichinitiates a rapid and distinct change in both plant metabolismand surface energy balance Ongoing and predicted climatechange however promotes an increase in atmospheric mois-ture winter snowfall over land areas (Rawlins et al 2010)and variability in the amount of snowfall (Callaghan et al2005 Kattsov et al 2005 Stocker et al 2013) while highertemperatures stimulate an earlier snowmelt and transition toconvective precipitation patterns (Groisman et al 1994) Weobserved that the impact of this variability in snow cover and
The Cryosphere 10 1395ndash1413 2016 wwwthe-cryospherenet1013952016
C Stiegler et al Two years with extreme and little snowfall effects on energy partitioning 1409
snowmelt on the seasonal surface energy budget is stronglyconnected to the storage of meltwater in the soil and its evap-oration and transpiration over the subsequent growing sea-son A higher proportion of soil moisture combined with ahigh atmospheric moisture demand generally stimulates ETIn our study the impact of the availability of soil moisturefrom snowmelt and its loss through ET on the surface en-ergy budget was most pronounced at the heath Here we ob-served that low soil moisture content and lack of summer-time precipitation in 2013 amplified H at the cost of LE andG while increased soil moisture in 2014 and a pronouncedrainfall event in the middle of the growing season favouredLE and G at the cost of H Further the Bowen ratio of theheath during the same year showed that energy partitioninginto H and LE was similar to the wet fen In contrast thewet fen showed attenuated behaviour of LE ET H and G tothe variability in snow meltwater as the fen receives its mois-ture supply mostly from minerotrophic water supply whichremained relatively stable over the 2 study years Growingseason variability in the partitioning of the surface energybalance components was also observed at a polygonal tundrasite in Siberia (Boike et al 2008) However the observeddifferences were mainly driven by variability in summertimeprecipitation
Negative water balances during the growing season withET exceeding precipitation are common in high-latitudeecosystems (Woo et al 1992) Depending on the type of wa-ter supply tundra ecosystems may therefore experience dif-ferential responses to climate variability and climate change(Rouse 2000 Boike et al 2008) At the wet fen our obser-vations showed negative water balances during the growingseason 2013 but the loss of water through ET was compen-sated by moisture supply from soil moisture Consequentlythe partitioning of Rnet into LE showed only small differ-ences between the two growing seasons At the dry heath thegrowing season in 2013 ended with a positive water balanceHowever this was related to both pronounced precipitationat the end of the season and low rates of ET due to decliningRnet During most of the season snow meltwater was the onlysupplier of soil moisture and the small amount of snow melt-water was evaporated relatively soon after snowmelt Conse-quently for most parts of the remaining season the soil wasnot able to supply moisture for ET This resulted in low LErelatively low soil thermal conductivity and G and a cleardominance ofH During the growing season in 2014 the wa-ter balance of the heath was negative over the entire seasonbut the soil experienced greater saturation from snow melt-water storage which was reflected in the partitioning of thesurface energy balance towards a greater share of LE and Gon Rnet
The effects of VPD soil moisture and air temperature onplant stomata and the impact of rs on ET and LE have beendocumented for a large number of species and ecosystems(Losch and Tenhunen 1983 Lafleur and Rouse 1988 Ka-surinen et al 2014) At the dry heath the observed val-
ues of rs suggest strong vegetation response to the differentregimes of snow and surface wetness in the 2 study yearscompared to previous studies (Soegaard et al 2001 Lund etal 2014) while at the wet fen attenuated behaviour of rswas observed Arctic ecosystems are generally characterizedby a high proportion of free water and mosses which un-like vascular plants limit moisture transfer during high VPDHowever the concept of surface resistance neglects this con-tribution of free water and non-vascular plants (Kasurinen etal 2014) and therefore the application of rs and is diffi-cult in Arctic environments The seasonal differences in rs atthe dry heath may also be explained by the characteristics ofthe growing season precipitation regimes and water contentof the mossndashsoil layer (McFadden et al 2003) Bowen ratiors and were closely coupled to precipitation resulting in adecrease in Bowen ratio rs and during periods of rainfallwhile longer periods without precipitation resulted in highvalues of Bowen ratio rs and This behaviour for all pa-rameters was more pronounced in 2013 compared to 2014In 2013 the combined effects of low soil moisture lack ofprecipitation during the period with relatively high RSdarr andhigh VPD may be responsible for the observed magnitudes
Variability of snow cover and length of the growing seasonis not only reflected in the partitioning of the surface energybalance components More important total accumulatedRnetincreases with increased length of the snow-free period Fur-ther any increase in the length of the snow-free season orin summer temperatures is manifested in a general increasein ET resulting in negative water balances over the snow-free season when precipitation shows no increase (Eugsteret al 2000) Our results showed that with the onset of thesnowmelt period and growing season during the part of theyear when incoming solar radiation is at its peak an earlieronset of the growing season of approx 4 weeks resulted indramatic differences in accumulated energy fluxes at the endof the growing season Summarizing the increased amountof accumulatedRnet contributed to increased ET and surficialheat loss from LE soil and permafrost warming through Gand atmospheric warming through H
5 Conclusions and outlook
In this study we documented the effects of variability in snowaccumulation on the surface energy balance of a high-Arctictundra ecosystem in Northeast Greenland during 2 subse-quent years (2013ndash2014) The most important findings in-clude the following
ndash low snow cover during the winter 20122013 promotedlow surface albedo and positive daily average Rnet overthe snowmelt period in 2013 while extensive snow coverduring the winter 20132014 resulted in high albedo andreduced Rnet during the snowmelt period in 2014
wwwthe-cryospherenet1013952016 The Cryosphere 10 1395ndash1413 2016
1410 C Stiegler et al Two years with extreme and little snowfall effects on energy partitioning
ndash the heathrsquos energy budget was strongly affected by thevariability in snow cover resulting in substantial heatloss byH at the cost of LE andG in 2013 while in 2014LE and G showed a strong increase at the cost of H Incontrast the wet fen showed attenuated response to thevariability in snow cover due to differences in the localhydrological settings
ndash at both sites the variation in the length of the snowmeltperiods and growing seasons was manifested in substan-tial differences in the total amount of accumulated en-ergy balance components
Among the research community mean values of the climaticsite conditions surface energy and carbon exchange havebeen regarded as powerful indicators for ecosystem produc-tivity and model evaluation is widely based on these param-eters However the frequency and magnitude of weather ex-tremes and the pace of ongoing climate change are majorchallenges for ecosystems all over the planet In the Arcticand subarctic the closely coupled hydrological biologicaland soil thermal regimes respond nonlinearly to a myriad ofcontrolling factors (Liljedahl et al 2011) It is therefore es-sential to further incorporate such data of weather extremesinto research and modelling tools (Jentsch et al 2007) espe-cially in the Arctic and subarctic where the lack of observa-tional studies results in a blur picture of high-latitude ecosys-tem response and contribution to climate change The resultsof this study may be a valuable contribution for modellingtools as it is to our knowledge the first study that evaluatesthe impact of successive snow cover variability on the landndashatmosphere interactions and surface energy balance compo-nents in Greenlandic tundra ecosystems
Author contributions The original idea for the paper was sug-gested by C Stiegler M Lund and A Lindroth and discussed anddeveloped by all authors M Lund and C Stiegler performed thedata analysis C Stiegler prepared the manuscript with contribu-tions from all co-authors
Acknowledgements We thank GeoBasis programme for runningand maintaining the flux measurement systems Asiaq ndash Green-land Survey GEM and ClimateBasis programme for providingmeteorological observations and Zackenberg Ecological ResearchOperations for facilitating logistics This work forms part of theNordic Centres of Excellence DEFROST and eSTICC and theEU FP7 project INTERACT
Edited by M van den Broeke
References
Aubinet M Vesala T and Papale D Eddy Covariance A Practi-cal Guide to Measurement and Data Analysis Springer Nether-lands Dordrecht 438 pp 2012
Bay C Vegetation mapping of Zackenberg valley NortheastGreenland Polar Center amp Botanical Museum Copenhagen1998
Becker A Finger P Meyer-Christoffer A Rudolf B SchammK Schnieder U and Ziese M A description of the globalland-surface precipitation data products of the Global Precipita-tion Climatology Centre with sample applications including cen-tennial (trend) analysis from 1901ndashpresent Earth Syst Sci Data5 71ndash99 doi105194essd-5-71-2013 2013
Bintanja R and Selten F M Future increases in Arctic precipita-tion linked to local evaporation and sea-ice retreat Nature 509479ndash482 doi101038nature13259 2014
Bintanja R and van der Linden E C The changing seasonal cli-mate in the Arctic Scient Rep 3 1556 doi101038srep015562013
Boike J Wille C and Abnizova A Climatology and sum-mer energy and water balance of polygonal tundra in theLena River Delta Siberia J Geophys Res 113 G03025doi1010292007JG000540 2008
Bokhorst S Bjerke J W Bowles F W Melillo J M CallaghanT V and Phoenix G K Impacts of extreme winter warming inthe sub-Arctic growing season responses of dwarf shrub heath-land Global Change Biol 14 2603ndash2612 doi101111j1365-2486200801689x 2008
Bokhorst S Bjerke J W Street I E Callaghan T V andPhoenix G K Impacts of multiple extreme winter warm-ing events on sub-Arctic heathland Phenology reproductiongrowth and CO2 flux responses Global Change Biol 17 2817ndash2830 doi101111j1365-2486201102424x 2011
Burba G G McDermitt D K Anderson D J Furtaw M Dand Eckles R D Novel design of an enclosed CO2H2O gasanalyser for eddy covariance flux measurements Tellus B 62743ndash748 doi101111j1600-0889201000468x 2010
Callaghan T V Bjoumlrn L O Chapin III F S Chernov YI Christensen T R Huntley B Ims R Johansson MRiedlinger D J Jonasson S Matveyeva N Oechel WPanikov N and Shaver G Chapter 7 Arctic tundra and polardesert ecosystems in Arctic Climate Impact Assessment Cam-bridge University Press Cambridge 243ndash352 2005
Callaghan T V Johansson M Anisimov O Christiansen H HInstanes A Romanovsky V and Smith S Chapter 4 Chang-ing snow cover and its impacts in Snow Water Ice and Per-mafrost in the Arctic (SWIPA) Arcitc Monitoring and Assess-ment Programme (AMAP) Oslo 1ndash58 2011a
Callaghan T V Johansson M Brown R D Groisman P YLabba N Radionov V Bradley R Blangy S Bulygina ON Christensen T R Colman J E Essery R L H ForbesB C Forchhammer M C Golubev V N Honrath R E Ju-day G P Meshcherskaya A V Phoenix G K Pomeroy JRautio A Robinson D A Schmidt N M Serreze M CShevchenko V P Shiklomanov A I Shmakin A B Skoumlld PSturm M Woo M and Wood E F Multiple effects of changesin arctic snow cover Ambio 40 32ndash45 doi101007s13280-011-0213-x 2011b
The Cryosphere 10 1395ndash1413 2016 wwwthe-cryospherenet1013952016
C Stiegler et al Two years with extreme and little snowfall effects on energy partitioning 1411
Chapin III F S Shaver G Giblin A E Nadelhoffer K J andLaundre J A Response of arctic tundra to experimental andobserved changes in climate Ecology 76 694ndash711 1995
Chernov Y I The Living Tundra Cambridge University PressCambridge 228 pp 1988
Christiansen H H Meteorological control on interannual spa-tial and temporal variations in snow cover and ground thaw-ing in two Northeast Greenlandic Circumpolar-Active-Layer-Monitoring (CALM) sites Permafrost Periglac Process 15155ndash169 doi101002ppp489 2004
Eddy covariance gap-filling amp flux-partitioning tool httpwwwbgc-jenampgde~MDIworkeddyproc last access 30 Novem-ber 2015
Elberling B Tamstorf M P Michelsen A Arndal M F Sigs-gaard C Illeris L Bay C Hansen B Christensen T RHansen E S Jakobsen B H and Beyens L Soil and plantcommunity-characteristics and dynamics at Zackenberg AdvEcol Res 40 223ndash248 doi101016S0065-2504(07)00010-42008
Eugster W Rouse W R Pielke R A McFadden J P Baldoc-chi D D Kittel T G F Chapin F S Liston G E VidaleP L Vaganov E and Chambers S Land-atmosphere energyexchange in Arctic tundra and boreal forest available data andfeedbacks to climate Global Change Biol 6 84ndash115 2000
Euskirchen E S McGuire A D Kicklighter D W Zhuang QClein J S Dargaville R J Dye D G Kimball J S Mc-Donald K C Melillo J M Romanovsky V and Smith N VImportance of recent shifts in soil thermal dynamics on grow-ing season length productivity and carbon sequestration in ter-restrial high-latitude ecosystems Global Change Biol 12 731ndash750 doi101111j1365-2486200601113x 2006
Falge E Baldocchi D Tenhunen J Aubinet M Bakwin PBerbigier P Bernhofer C Burba G Clement R Davis KJ Elbers J A Goldstein A H Grelle A Granier A Gund-mundsson J Hollinger D Kowalski A S Katul G Law BE Malhi Y Meyers T Monson R K Munger J W OechelW Tha Paw U K Pilegaard K Rannik U Rebmann CSuyker A E Valentini R Wilson K and Wofsy S Season-ality of ecosystem respiration and gross primary production asderived from FLUXNET measurements Agr Forest Meteorol113 53ndash74 2002
Foken T The energy balance closure problem an overview EcolAppl 18 1351ndash1367 2008
Graversen R G Mauritsen T Tjernstroumlm M Kaumllleacuten E andSvensson G Vertical structure of recent Arctic warming Na-ture 541 53ndash56 doi101038nature06502 2008
Groisman P Y Karl T R and Knight R W Changes of snowcover temperature and radiative heat balance over the North-ern Hemisphere J Climate 7 1633ndash1656 doi1011751520-0442(1994)007lt1633COSCTAgt20CO2 1994
Hanks J R and Ashcroft G L Applied soil physics Soil wa-ter and temperature applications Springer New York 159 pp1980
Hansen B Sigsgaard C Rasmussen L H Cappelen J HinklerJ Mernild S H Petersen D Tamstorf M P Rasch M andHasholt B Present-day climate at Zackenberg Adv Ecol Res40 111ndash149 2008
Hartman D L Klein Tank A M G Rusticucci M AlexanderL V Broumlnnimann S Charabi Y Dentener F J Dlugokencky
E J Easterling D R Kaplan A Soden B J Thorne P WWild M and Zhai P M Observations Atmosphere and Sur-face in Climate Change 2013 The Physical Science Basis inContribution of Working Group I to the Fifth Assessment Reportof the Intergovernmental Panel on Climate Change CambridgeUniversity Press Cambridge 159ndash254 2013
Haslwanter A Hammerle A and Wohlfahrt G Open-pathvs closed-path eddy covariance measurements of the netecosystem carbon dioxide and water vapour exchange Along-term perspective Agr Forest Meteorol 149 291ndash302doi101016jagrformet200808011 2009
Jarvis P G and McNaughton K G Stomatal control on transpi-ration scaling up from leaf to region Adv Ecol Res 15 1ndash491986
Jentsch A Kreyling J and Beierkuhnlein C A new gen-eration of climate change experiments events not trendsFront Ecol Environ 5 365ndash374 doi1018901540-9295(2007)5[365ANGOCE]20CO2 2007
Kasurinen V Alfredsen K Kolari P Mammarella I Aleksey-chik P Rinne J Vesala T Bernier P Boike J Langer MBelelli Marchesini L van Huissteden K Dolman H SachsT Ohta T Varlagin A Rocha A Arain A Oechel WLund M Grelle A Lindroth A Black A Aurela M Lau-rila T Lohila A and Berninger F Latent heat exchange in theboreal and arctic biomes Global Change Biol 20 3439ndash3456doi101111gcb12640 2014
Kattsov V M Kaumllleacuten E Cattle H Christensen J Drange HHanssen-Bauer I Joacutehannesen T Karol I Raumlisaumlnen J Svens-son G and Vavulin S Chapter 7 Arctic tundra and polar desertecosystems in Arctic Climate Impact Assessment CambridgeUniversity Press Cambridge 99ndash150 2005
Lafleur M P and Rouse W R The influence of surface coverand cliate on energy partitioning and evaporation in a subarcticwetland Bound-Lay Meteorol 44 327ndash347 1988
Langer M Westerman S Piel K and Boike J The sur-face energy balance of a polygonal tundra site in northernSiberia ndash Part 1 Spring to fall The Cryosphere 5 151ndash171doi105194tc-5-151-2011 2011
Leuning R van Gorsel E Massman W J and Isaac P R Re-flections on the surface energy imbalance problem Agr For-est Meteorol 156 65ndash74 doi101016jagrformet2011120022012
Liljedahl A K Hinzman L D Harazona Y Zona D TweedieC E Hollister R D Engstrom R and Oechel W Nonlinearcontrols on evapotranspiration in arctic coastal wetlands Biogeo-sciences 8 3375ndash3389 doi105194bg-8-3375-2011 2011
Losch R and Tenhunen J D Stomatal responses to humid-ity ndash Phenomenon and mechanisms in Water deficits andplant growth Cambridge University Press Cambridge 131ndash1611983
Lund M Falk J M Friborg T Mbufong H N Sigsgaard CSoegaard H and Tamstorf M P Trends in CO2 exchange ina high Arctic tundra heath 2000ndash2010 J Geophys Res 117G02001 doi1010292011JG001901 2012
Lund M Hansen B Pedersen S H Stiegler C and Tam-storf M P Characteristics of summer-time energy exchangein a high Arctic tundra heath 2000ndash2010 Tellus B 66 21631doi103402tellusbv6621631 2014
wwwthe-cryospherenet1013952016 The Cryosphere 10 1395ndash1413 2016
1412 C Stiegler et al Two years with extreme and little snowfall effects on energy partitioning
Marchand F L Kockelbergh F van de Vijver B Beyens L andNijs I Are heat and cold resistance of arctic species affected bysuccessive extreme temperature events New Phytol 170 291ndash300 doi101111j1469-8137200601659x 2005
Massman W J and Ibrom A Attenuation of concentration fluc-tuations of water vapor and other trace gases in turbulent tubeflow Atmos Chem Phys 8 6245ndash6259 doi105194acp-8-6245-2008 2008
McBean G Alexseev G Chen D Foslashrland E Fyfe J Grois-man P Y King R Melling H Vose R and Whitfield P HArctic climate past and present in Arctic Climate Impact As-sessment ndash Scientific Report Cambridge University Press Cam-bridge 21ndash60 2005
McFadden J P Eugster W and Chapin III F S A regional studyof the controls on water vapor and CO2 exchange in Arctic tun-dra Ecology 84 2762ndash2776 2003
Monteith J L and Unsworth M H Principles of environmentalphysics Plants animals and the atmosphere Academic PressOxford 422 pp 2013
Mylius M R Christensen T R Hangaard P Hansen B Pe-tersen D Tamstorf M P Mastepanov M Soslashrensen M WPetersen L G Rasmussen L H Sigsgaard C Skov K Aber-mann J and Lund M Zackenberg Basic The Climate Basisand GeoBasis programmes Danish Centre for Environment andEnergy Roskilde p 130 2014
Nakicenovic N Alcamo J Davis G de Vries B FenhannJ Gaffin S Gregory K Gruumlbler A Jung T Y Kram TLa Rovere E L Michaelis L Mori S Morita T PepperW Pitcher H Price L Raihi K Roehrl A Rogner H HSankovski A Schlesinger M Shukla P Smith S Swart Rvan Rooijen S Victor N and Dadi Z IPCC special reporton emissions scenarios Cambridge University Press Cambridge2000
Novik K A Walker J Chan W S Schmidt A Sobek C andVose J M Eddy covariance measurements with a new fast-response enclosed-path analyzer Spectral characteristics andcross-system comparisons Agr Forest Meteorol 181 17ndash32doi101016jagrformet201306020 2013
Overpeck J Hughen K Hardy D Bradley R Case R Dou-glas M Finney B Gajewski K Jacoby G Jennings ALamoureux S Lasca A MacDonald G Moore J RetelleM Smith S Wolfe A and Zielinski G Arctic environmen-tal change for the last four centuries Science 278 1251ndash1256doi101126science27853411251 1997
Pedersen M R Christensen T R Hangaard P Hansen BJackowicz-Korczynski M Larsen M Lund M MastepanovM Petersen D Hoslashjlund Pedersen S Pedersen L G Ras-mussen L H Sigsgaard C Skov K Stiegler C Thorsoslashe Kand Tamstorf M P Zackenberg Basic The ClimateBasis andGeoBasis programme Danish Centre for Environment and En-ergy Roskilde 13ndash29 2012
Priestley C H B and Taylor R J On the assessment of surfaceheat flux and evaporation using large-scale parameters MonWeather Rev 100 81ndash92 1972
Rawlins M A Steele M Holland M M Adam J C CherryJ E Francis J A Groisman P Y Hinzman L D Hunting-ton T G Kane D L Kimball J S Kwok R Lammers RB Lee C M Lettenmaier D P McDonald K C Podest EPundsack J W Rudels B Serreze M C Shiklomanov A
I Skagseth Oslash Troy T J Voumlroumlsmarty C J Wensnahan MWood E F Woodgate R Yang D Zhang K and Zhang TAnalysis of the Arctic system for freshwater cycle intensifica-tion Observations and expectations J Climate 23 5715ndash5737doi1011752010JCLI34211 2010
Reichstein M Falge E Baldocchi D Papale D AubinetM Berbigier P bernhofer C Buchmann N Gilmanov TGranier A Gruumlnwald T Havraacutenkovaacute K Ilvesniemi HJanous D Knohl A Laurila T Lohila A Loustau D Mat-teucci G Meyers T Miglietta F Ourcival J M PumpanenJ Rambal S Rotenberg E Sanz M Tenhunen J Seufert GVaccari F Vesala T Yakir D and Valentini R On the sep-aration of net ecosystem exchange into assimilation and ecosys-tem respiration review and improved algorithm Global ChangeBiol 11 1424ndash1439 2005
Rouse W R The energy and water balance of high-latitude wet-lands controls and extrapolation Global Change Biol 6 59ndash682000
Screen J A and Simmonds I The central role of diminishingsea ice in recent Arctic temperature amplification Nature 4641334ndash1337 doi101038nature09051 2010
Shuttleworth W J Putting the ldquovaprdquo into evaporation HydrolEarth Syst Sci 11 210ndash244 doi105194hess-11-210-20072007
Soegaard H Hasholt B and Nordstroem C Surface energy- andwater balance in a high-arctic environment in NE GreenlandTheor Appl Climatol 70 35ndash51 2001
Stendel M Hesselbjerg Christiensen J Aethalgeirsdoacutettir GKliem N and Drews M Regional climate change for Green-land and surrounding seas Danish Climate Centre ReportCopenhagen 26 pp 2007
Stocker T F Qin D Plattner G K Tinor M Allen S KBoschung J Nauels A Xia Y Bex V and Midgley P MClimate Change 2013 The Physical Science Basis in Contribu-tion of Working Group I to the Fifth Assessment Report of theIntergovernmental Panel on Climate Change Cambridge Univer-sity Press Cambridge 1552 pp 2013
Stoy P Mauder M Foken T Marcolla B Boegh E IbromA Altaf Arain M Arneth A Aurela M Bernhofer CCescatti A Dellwik E Duce P Gianelle D van GorselE Kiely G Knohl A Margolis H McGaughey H Mer-bold L Montagnani L Papale D Reichstein M SaundersM Serrano-Ortiz P Sottocornola M Spano D Vaccari Fand Varlagin A A data-driven analysis of energy balance clo-sure across FLUXNET research sites The role of landscapescale heterogeneity Agr Forest Meteorol 171ndash172 137ndash152doi101016jagrformet201211004 2013
Sturm M and Douglas T Changing snow and shrub conditionsaffect albedo with global implications J Geophys Res 110G01004 doi1010292005JG000013 2005
Su H-B Schmid H P Grimmond C S B Vogel C S andOliphant A J Spectral characteristics and correction of long-term eddy-covariance measurements over two mixed hardwoodforests in non-flat terrain Bound-Lay Meteorol 110 213ndash2532004
Tagesson T Moumllder M Mastepanov M Sigsgaard C Tam-storf M P Lund M Falk J M Lindroth A Christensen TR and Stroumlm L Land-atmosphere exchange of methane fromsoil thawing to soil freezing in a high-Arctic wet tundra ecosys-
The Cryosphere 10 1395ndash1413 2016 wwwthe-cryospherenet1013952016
C Stiegler et al Two years with extreme and little snowfall effects on energy partitioning 1413
tem Global Change Biol 18 1928ndash1940 doi101111j1365-2486201202647x 2012
Walker D A Billings W D and De Molenaar J G Snow-vegetation interactions in tundra environments in Snow Ecol-ogy an interdisciplinary examination of snow-covered ecosys-tems edited by Jones H G Pomeroy J Walker D A andHoham R W Cambridge University Press Cambridge 266ndash324 2001
Warren S G Optical properties of snow Rev Geophys SpacePhys 20 67ndash89 1982
Westermann S Luumlers J Langer M Piel K and Boike J Theannual surface energy budget of a high-arctic permafrost site onSvalbard Norway The Cryosphere 3 245ndash263 doi105194tc-3-245-2009 2009
Woo M K Lewkowicz A G and Rouse W R Response ofthe Canadian permafrost environment to climatic change PhysGeogr 134 287ndash317 1992
Wyngaard J C and Cote O R Cospectral similarity in atmo-spheric surface-layer Q J Roy Meteorol Soc 98 590ndash6031972
wwwthe-cryospherenet1013952016 The Cryosphere 10 1395ndash1413 2016
- Abstract
- Introduction
- Materials and methods
-
- Study sites
- Measurements
- Data analysis and derived parameters
-
- Results
-
- Energy balance closure
- Polar night and pre-melt season
- Snowmelt season
- Growing season
-
- Season length and meteorological conditions
- Radiation balance
- Turbulent heat fluxes
- Controls of evapotranspiration
- Ground heat flux and soil properties
-
- Total surface energy balance of the snowmelt season and growing season
-
- Discussion
-
- Energy balance closure and system performance
- Snow cover and surface energy budget
-
- Conclusions and outlook
- Author contributions
- Acknowledgements
- References
-
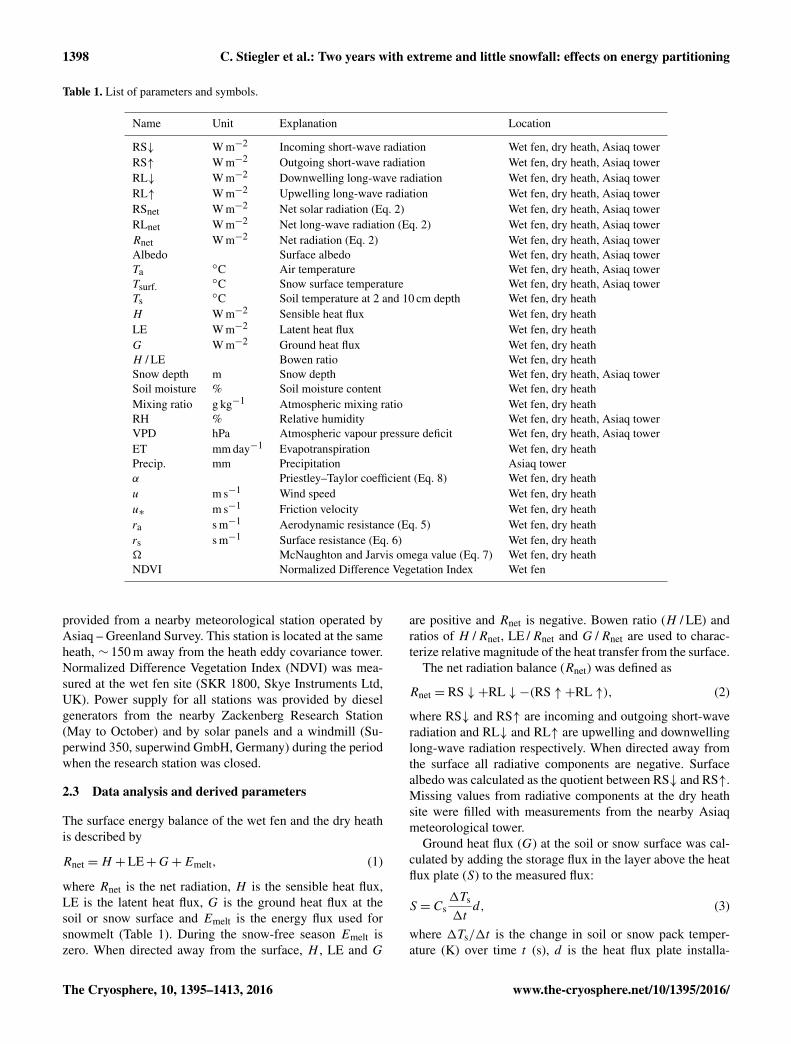
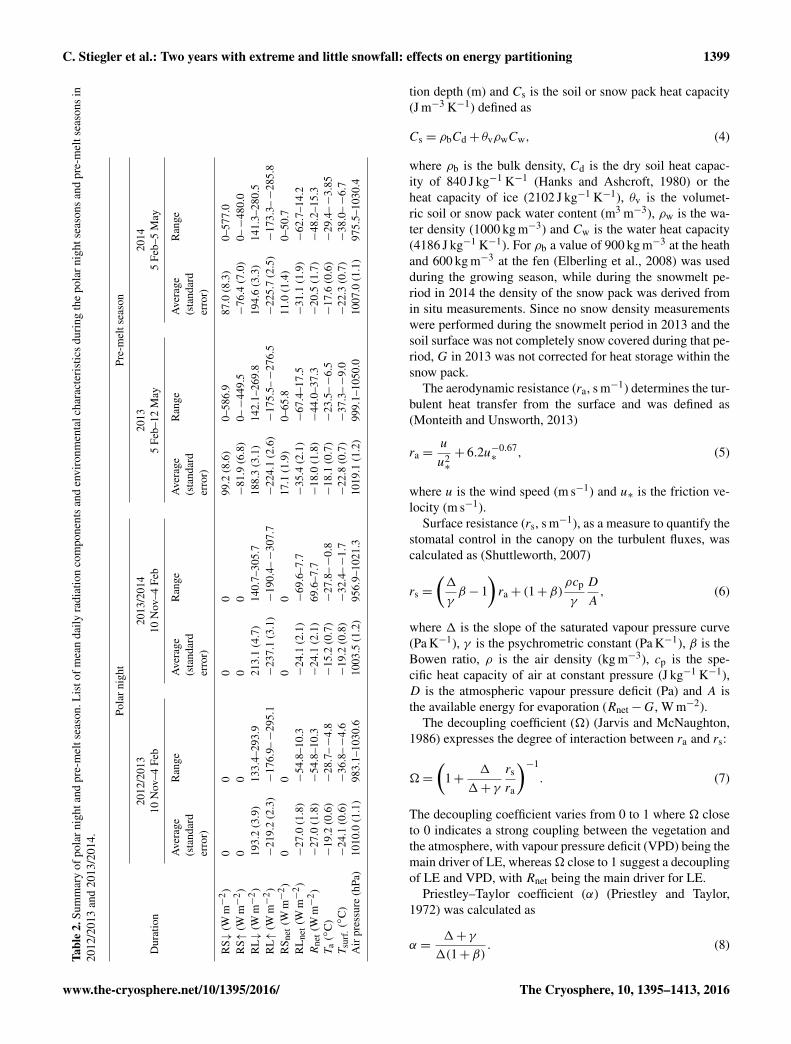
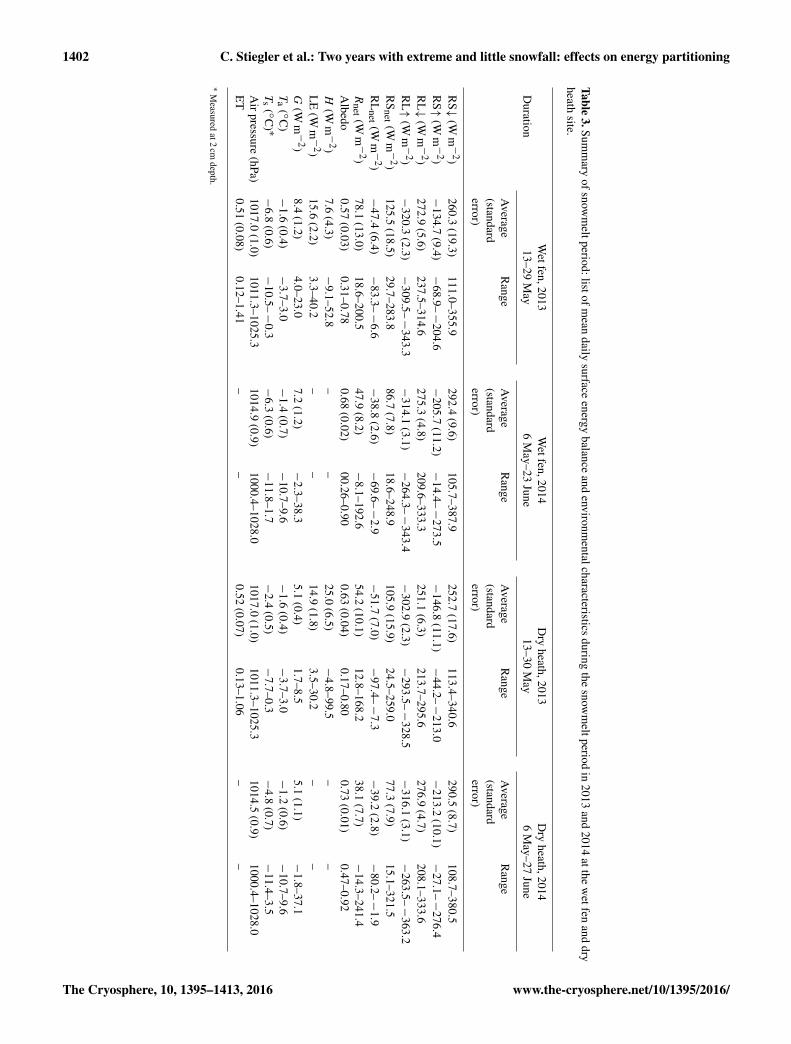
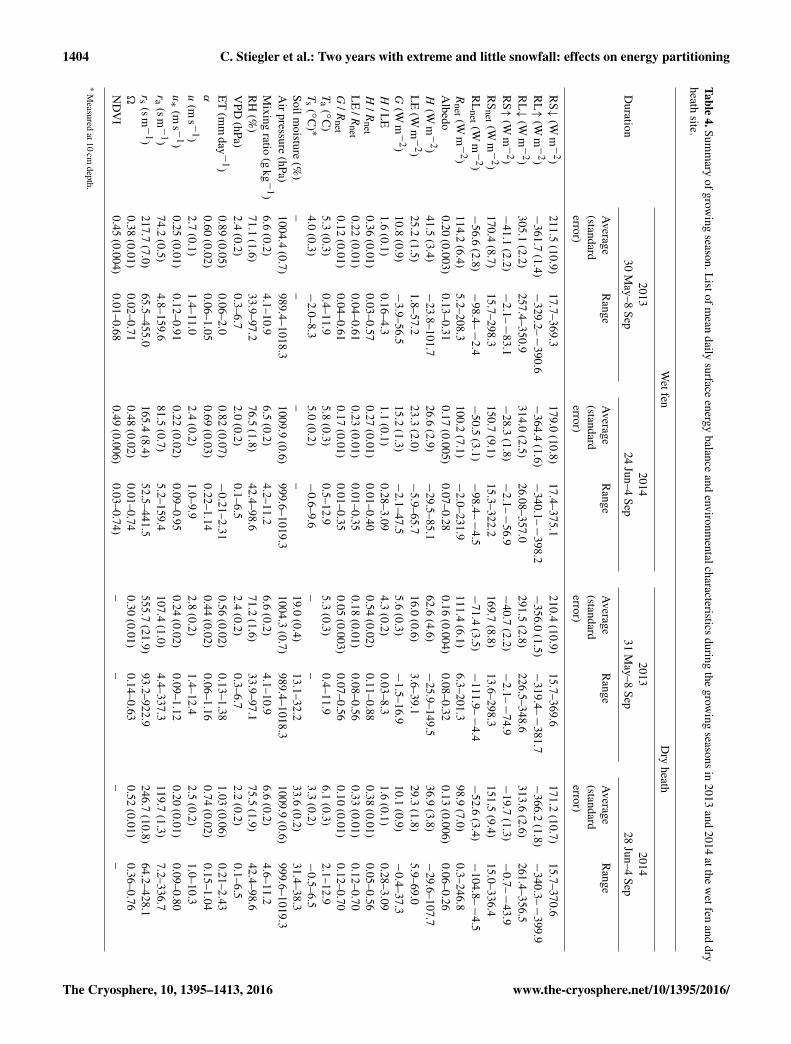