two years of solar observation with proba2/lyra: an overview
DESCRIPTION
Two years of solar observation with PROBA2/LYRA: An overview I. E. Dammasch , M. Dominique, M. Kretzschmar (ROB/SIDC),. XII th Hvar Astrophysical Colloquium Hvar, Croatia, 03-07 Sep 2012. Contents. Introduction What is PROBA2 ? What is LYRA ? What data products are delivered ? - PowerPoint PPT PresentationTRANSCRIPT

Two years of solar observationTwo years of solar observationwith PROBA2/LYRA: An overviewwith PROBA2/LYRA: An overview
I. E. Dammasch, M. Dominique, M. Kretzschmar (ROB/SIDC),I. E. Dammasch, M. Dominique, M. Kretzschmar (ROB/SIDC),
XIIth Hvar Astrophysical ColloquiumHvar, Croatia, 03-07 Sep 2012
LYRAthe Large-Yield Radiometer onboard PROBA2

Contents
Introduction • What is PROBA2 ? • What is LYRA ? • What data products are delivered ?
Results (selected examples)• Quasi-periodic pulsations in flares • Lyman-alpha signatures of flares • Degradation, and what to do about it• Long-term irradiance development • Thermal evolution of flares

PROBA2
ESA’s “PRoject for On-Board Autonomy”
Belgian microsatellite in Sun-synchronous orbit
725 km altitude Launched 02 Nov 2009 Nominal operations since March 2010 Technology and science mission 4 innovative instruments and
17 technological experiments for in-orbit demonstration
Among them the EUV imager SWAP and the radiometer LYRA

LYRA
Large-Yield RAdiometer 3 instrument units (redundancy) 4 spectral channels per head 3 types of detectors, Silicon + 2 types of diamond detectors (MSM, PIN): - radiation resistant - insensitive to visible light compared to Si detectors High cadence up to 100 Hz

• Royal Observatory of Belgium (Brussels, B)Principal Investigator, overall design, onboard software specification, science operations
• PMOD/WRC (Davos, CH)Lead Co-Investigator, overall design and manufacturing
• Centre Spatial de Liège (B)Lead institute, project management, filters
• IMOMEC (Hasselt, B)Diamond detectors
• Max-Planck-Institut für Sonnensystemforschung (Lindau, D)calibration
• science Co-Is: BISA (Brussels, B), LPC2E (Orléans, F)…
LYRA design

LYRA filter-detector combinations
Spectral channels covering a wide emission temperature range
Redundancy with different types of detectors Rad-hard, solar-blind diamond UV sensors (PIN and MSM) AXUV Si photodiodes
2 calibration LEDs per detector (λ = 465 nm and 390 nm) Quasi-continuous acquisition during mission lifetime
Ly (120-123nm)
Hz(190-222nm)
Al (17-80nm + <5nm)
Zr (6-20nm + <2nm)
Unit1 (spare) MSM PIN MSM Si
Unit2 (nominal) MSM PIN MSM MSM
Unit3 (campaigns) Si PIN Si Si

SWAP and LYRA spectral intervalsfor solar flares, space weather, and aeronomy
LYRA channel 1: the H I 121.6 nm Lyman-alpha line (120-123 nm)LYRA channel 2: the 200-220 nm Herzberg continuum range (now 190-222 nm)LYRA channel 3: the 17-80 nm Aluminium filter range incl the He II 30.4 nm line (+ <5nm X-ray)LYRA channel 4: the 6-20 nm Zirconium filter range with highest solar variablility (+ <2nm X-ray)SWAP: the range around 17.4 nm including coronal lines like Fe IX and Fe X
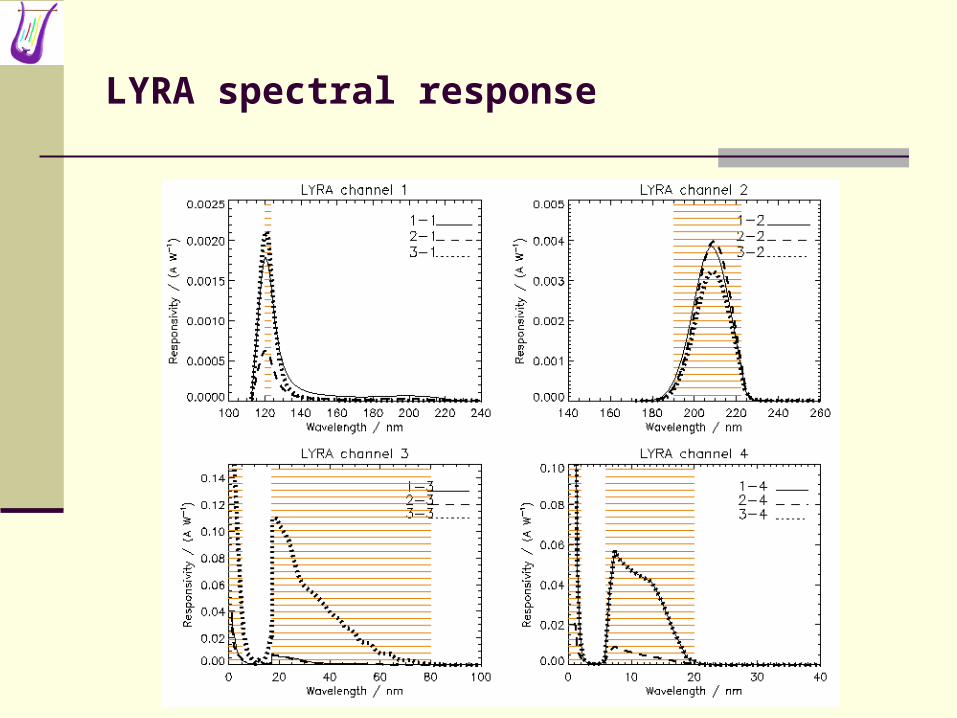
LYRA spectral response

LYRA data products
Daily FITS file (uncalibrated, full resolution): “Lev1” Daily FITS file (calibrated, full resolution): “Lev2” Daily FITS file (calibrated, 1-minute averages): “Lev3” Daily overview graphic Daily flare list Daily GOES proxy 3-day overview graphic Monthly overview graphic SSA service (“Space Situational Awareness”, with SWAP) … all updated several times per day, after downlink
http://proba2.sidc.be

LYRA data products: Monthly overview
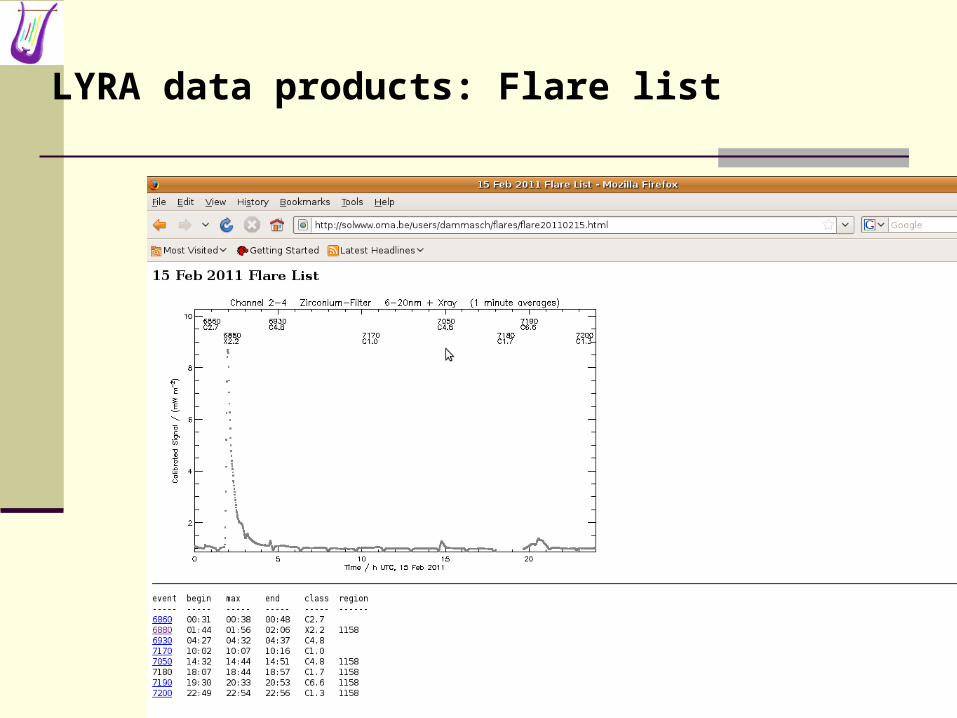
LYRA data products: Flare List
LYRA data products: Flare list

Example
X2.2 flare15 Feb 201101:56 UTC

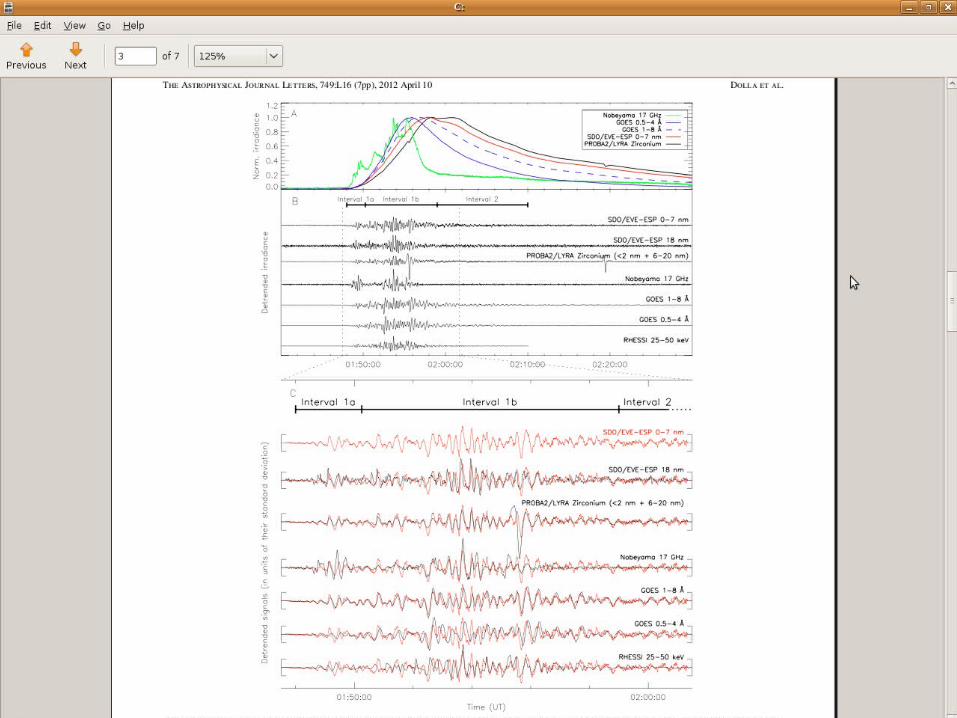
Results (1)
L. Dolla et al.: “Time delays in quasi-periodic pulsations observed during the X2.2 solar flare on 2011 February 15”Astrophysical Journal Letters 749:L16 (2012)
QPP observed simultaneously in several wavebandsFocus on fluctuations on timescale 1-30 sDifferent time lags between different wavebandsDuring impulsive phase approx 9 s between first and last (RHESSI, Nobeyama, SDO/ESP, LYRA, GOES)Possible emission mechanisms discussed

LYRA data products: Daily list. Flare list

Results (2)
M. Kretzschmar et al.: “Sun-as-a-star observation of flares in Lyman-alpha by the PROBA2/LYRA radiometer”Solar Physics (subm.)
Flare signatures in H I 121.5nm9 in early phase (before degradation), 2 later (spare unit campaign)Flux increases approx 0.6%Profile peak compared in different wavelengths (PROBA2, GOES, SOHO/SEM, Suzaku, Kanzelhoehe, GONG)


LYRA degradation
Temporal response loss of (nominal) unit 2, and estimation of future trends

Results (3)
A. BenMoussa et al.: “Lessons learned from on-orbit degradation of solar instruments” (in prep)
ROB workshop to start discussion about degradationSun-observing instruments exposed to space environmentExamples from SOHO, Hinode, STEREO, ISS, PROBA2, SDO, PICARDRecommendations to reduce or correct degradation, for future and ongoing missionsCleanliness control, calibration stability, redundancy concepts, necessary technical developments
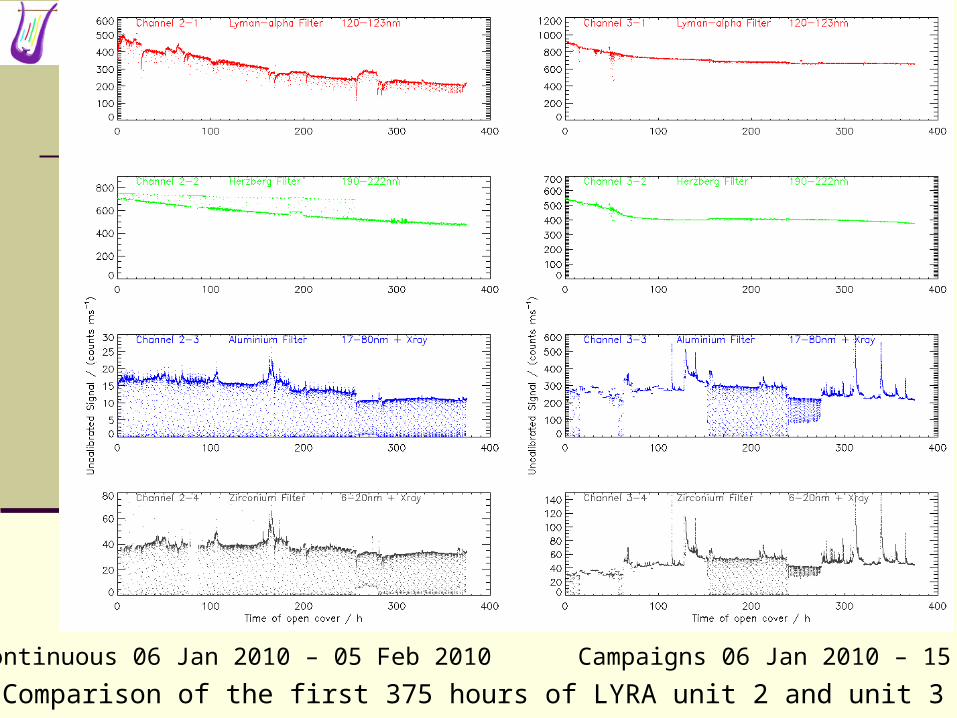
Comparison of the first 375 hours of LYRA unit 2 and unit 3Quasi-continuous 06 Jan 2010 – 05 Feb 2010 Campaigns 06 Jan 2010 – 15 Mar 2012
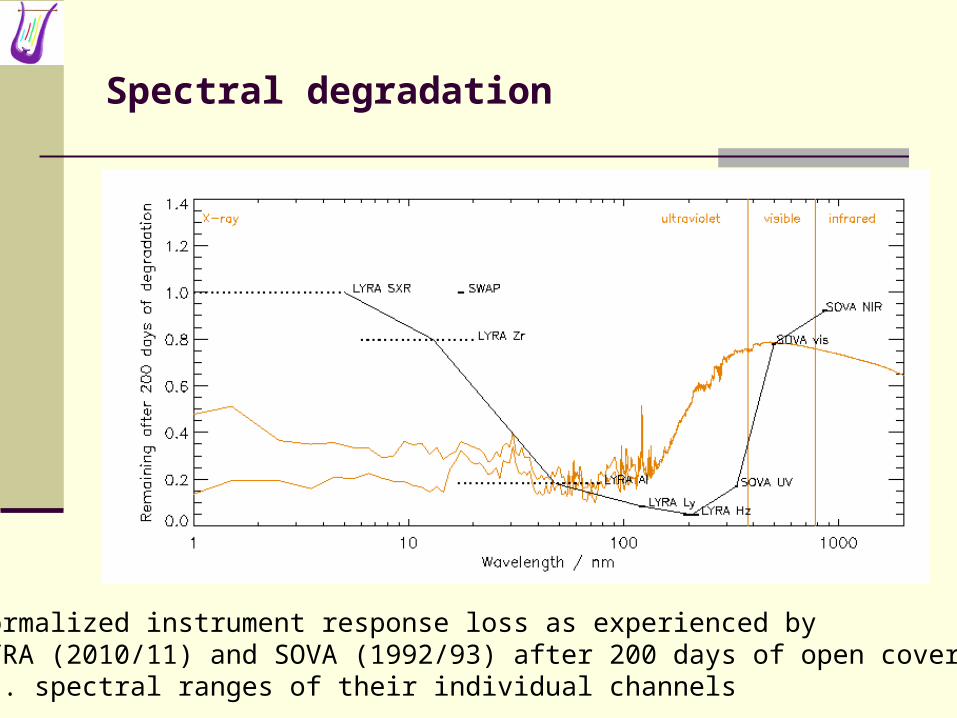
Spectral degradation
Normalized instrument response loss as experienced by LYRA (2010/11) and SOVA (1992/93) after 200 days of open covers, vs. spectral ranges of their individual channels

LYRA data products: Long-term irradiance
Development of daily minimum, i.e. without flares, Sep 2011 – Aug 2012

Results (4)
M. Kretzschmar et al.: “Extreme ultraviolet solar irradiance during the rising phase of solar cycle 24 observed by PROBA2/LYRA”Journal of Space Weather an Space Climate 2, A14 (2012)
LYRA channels 3 (Al) and 4 (Zr) in good agreement with TIMED/SEE and SDO/EVEChannel 3 with reduced variability due to degradation above 19nm, which can be correctedChannel 3 (corrected) and channel 4 irradiance increased approx. by a factor 2 between Feb 2010 and Nov 2011

LYRA data products: GOES vs. LYRA proxies
Results (5)
“Thermal evolution of flares”
Using LYRA and GOES curves, flare profiles can be separated into componentsThese components correspond to different temperature domainsThey can be compared to SDO/EVE spectral dataShapes look similar, radiometric calibration still TBDConsequences for Earth atmosphere ?Consequences for instrument design ?

Flare components ch2-3 = SXR+EUV
• “SXR”: emission with log(T)>7• “EUV residual”: emission with 6<log(T)<7• “little bump”: emission with log(T)<6
Compare with SDO/EVE:

Thermal evolution plot
based on:•solar spectra observed by SDO/EVE•contribution functions from the CHIANTI atomic database(Chamberlin, Milligan & Woods, Solar Physics 279, 23-42, 2012)
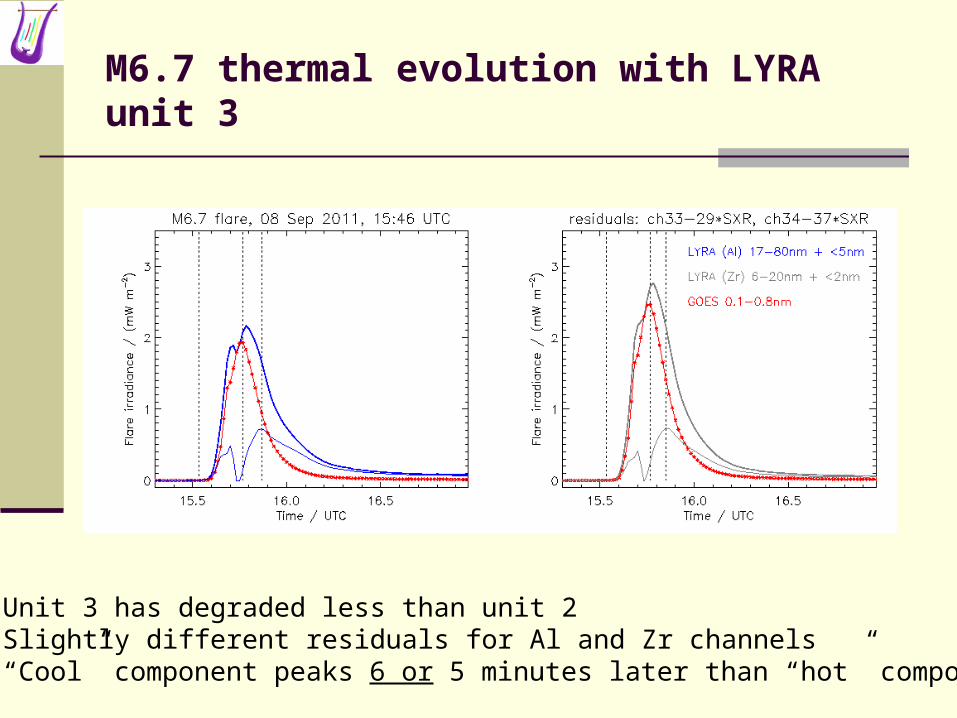
M6.7 thermal evolution with LYRA unit 3
• Unit 3 has degraded less than unit 2• Slightly different residuals for Al and Zr channels• “Cool” component peaks 6 or 5 minutes later than “hot” component
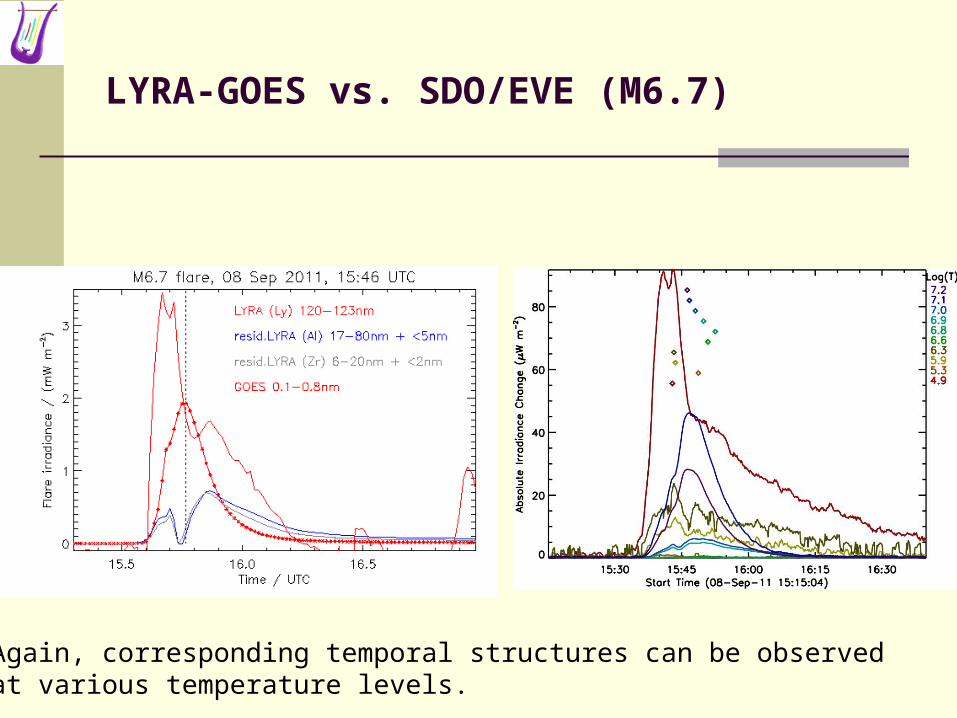
LYRA-GOES vs. SDO/EVE (M6.7)
Again, corresponding temporal structures can be observedat various temperature levels.

Thank you for your attention !
Each year SWAP and LYRA offer a “Guest Investigator Program”
More info, a PROBA2 publication list, and all data products can be found here:
http://proba2.sidc.be

Example:M1.1 flare, 28 Feb 2011
start to rise at same time parallel in impulsive phase GOES peaks earlier LYRA decreases slower linear factor in pure flare irradiance

Lyman-alpha signal
LYRA in early 2010 signal peaks in rising phase log(T)<6

0.03 MK
0.7 MK
1.4 MK
3.7 MK
7.7 MK
SOHO/SUMER

Problem: LYRA degradationnominal unit 2 (days), spare unit 3 (hours)

Spectral degradation after 200 days in space
Experience from SOVA (1992/93) and LYRA (2010/11) combined(“molecular contamination on the first optical surface … caused by UV-induced polymerization”)

C8.7 thermal evolution with LYRA unit 2
• Unit 2 has degraded more than unit 3• Identical residuals for Al and Zr channels• “Cool” component peaks 19 minutes later than “hot” component
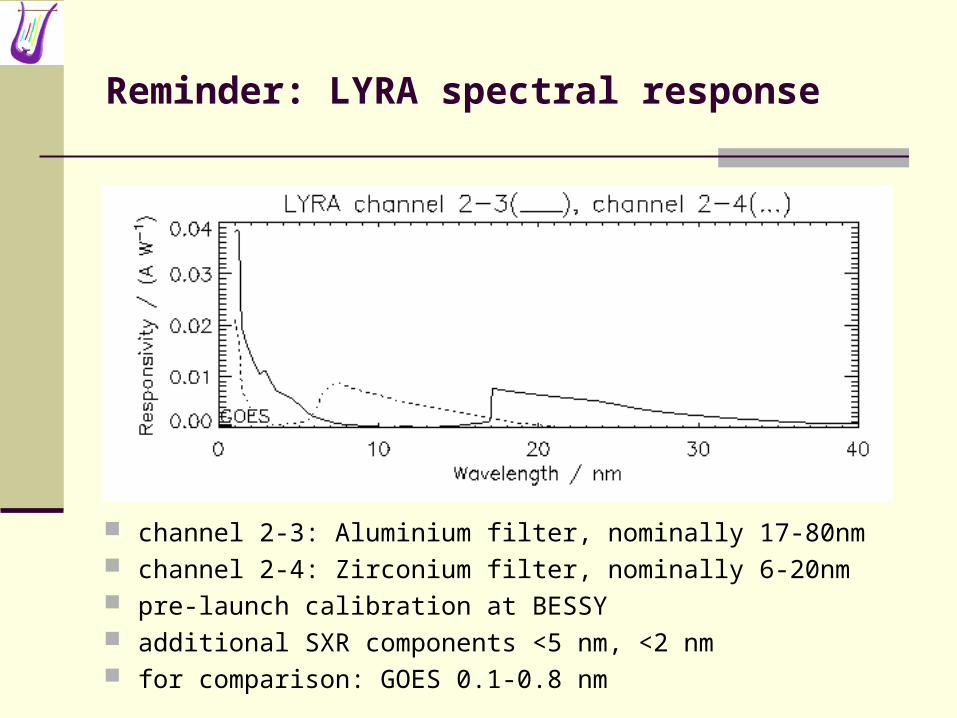
Reminder: LYRA spectral response
channel 2-3: Aluminium filter, nominally 17-80nm channel 2-4: Zirconium filter, nominally 6-20nm pre-launch calibration at BESSY additional SXR components <5 nm, <2 nm for comparison: GOES 0.1-0.8 nm

C8.7 thermal evolution with LYRA unit 3
• Unit 3 has degraded less than unit 2• Slightly different residuals for Al and Zr channels• “Cool” component peaks 22 or 19 minutes later than “hot” component

LYRA-GOES vs. SDO/EVE (C8.7)
Corresponding temporal structures can be observed at various temperature levels..

M6.7 thermal evolution with LYRA unit 2
• Unit 2 has degraded more than unit 3• Identical residuals for Al and Zr channels• “Cool” component peaks 5 minutes later than “hot” component

Conclusions
Not the right person to tell you what this means as consequences for the thermosphere, the ionosphere, the geosphere.
Eventually, LYRA and GOES together may be able to tell you something about the thermal evolution of flares…
… with high temporal resolution, and without being full-blown spectrographs.
Or, for future missions: How to get max information with min suitable components?
Of course, we are still working on the radiometric calibration, together with our colleagues from SDO/EVE.
So far, the shapes look similar, but we still have to attach the correct mW/m² to the curves.
See you next time around