two total maximum daily loads for phosphorus in the north
TRANSCRIPT

printed onrecycled paper
P r e p a r e d b y :T h e S t r a t e g i c A s s e s s m e n t D i v i s i o n , T N R C C
T E X A S N A T U R A L R E S O U R C E C O N S E R V A T I O N C O M M I S S I O N
Adopted by TNRCC: February 2001Approved by EPA: December 2001
Two Total Maximum Daily Loadsfor Phosphorus in the North Bosque River
For Segments 1226 and 1255

ii

1Texas Natural Resource Conservation Commission, Adopted February 2001
Two Total Maximum Daily Loads forPhosphorus in the North Bosque River
IntroductionSection 303(d) of the Clean Water Act requires all states to identify waters that do notmeet, or are not expected to meet, applicable water quality standards. For each listedwater body that does not meet a standard, states must develop a total maximum daily load(TMDL) for each pollutant that has been identified as contributing to the impairment ofwater quality in that water body. The Texas Natural Resource Conservation Commission(TNRCC) is responsible for ensuring that TMDLs are developed for impaired surfacewaters in Texas.
In simple terms, a TMDL is a quantitative plan that determines the amount of a particularpollutant that a water body can receive and still meet its applicable water qualitystandards. In other words, TMDLs are the best possible estimates of the assimilativecapacity of the water body for a pollutant under consideration. A TMDL is commonlyexpressed as a load, with units of mass per time period, but may be expressed in otherways also. TMDLs must also estimate how much the pollutant load needs to be reducedfrom current levels in order to achieve water quality standards. The Total Maximum Daily Load Program, a major component of Texas’ statewidewatershed management approach, addresses impaired or threatened streams, reservoirs,lakes, bays, and estuaries (water bodies) in or bordering the state of Texas. The primaryobjective of the TMDL Program is to restore and maintain the beneficial uses (such asdrinking water, recreation, support of aquatic life, or fishing) of impaired or threatenedwater bodies.
These TMDLs are meant to achieve significant reductions in the annual-average concen-tration and total-annual loading of soluble phosphorus in the North Bosque River.
Section 303(d) of the Clean Water Act and the U.S. Environmental Protection Agency’s(EPA) implementing regulations (40 Code of Federal Regulations, Part 130) describe thestatutory and regulatory requirements for acceptable TMDLs. The TNRCC guidancedocument, Developing Total Maximum Daily Load Projects in Texas (GI-250), furtherrefines the process for Texas. Following these guidelines, this TMDL document de-scribes six elements which are summarized in the following sections:
• Problem Definition• Endpoint Identification• Source Analysis• Linkage Between Sources and Receiving Waters• Margin of Safety• Pollutant Load Allocation
These TMDLs were prepared by:

2 Texas Natural Resource Conservation Commission, Adopted February 2001
• the TMDL Team in the Strategic Assessment Division of the Office of Envi-ronmental Policy, Analysis, and Assessment of the Texas Natural ResourceConservation Commission.
Significant assistance was provided by:
• the Texas Institute for Applied Environmental Research (TIAER) at TarletonState University in Stephenville, Texas
• the Bosque River Advisory Committee (BRAC)• the Texas State Soil and Water Conservation Board (TSSWCB)• the Blackland Research and Extension Center (Blackland)
The two TMDLs described in this document were adopted by the Texas Natural ResourceConservation Commission on February 9, 2001. Upon adoption, the TMDLs became partof the Texas Water Quality Management Plan. The Texas Natural Resource ConservationCommission will use this document and the Texas Water Quality Management Plan inreviewing and making determinations on applications for wastewater discharge permitsand in its nonpoint source pollution abatement programs.
Background InformationThe North Bosque River (Segments 1226 and 1255) was included in the 1998 TexasCWA § 303(d) List and deemed impaired under narrative water quality standards relatedto nutrients and aquatic plant growth. Recent studies have indicated that under mostconditions phosphorus is the limiting nutrient in the North Bosque River basin (Kieslinget. al., draft), and that dairy waste application fields and municipal wastewater treatmentplants are the major controllable sources of phosphorus (McFarland and Hauck 1995,1997, 1998, 1999a, 1999b). Watershed modeling for the North Bosque River TMDLassessed source categories of urban stormwater runoff, municipal wastewater treatmentplants, wood/range land, pasture, row crops, non-row crops, and dairy waste applicationfields (Santhi et al 2000a, 2000b). The wood/range land use approximates the naturalbackground condition of the watershed prior to development.
Evaluation of water quality conditions in the North Bosque River cannot be expressedexclusively in quantitative terms because the bases for including these segments on theimpaired water body list are not related to violations of specific numeric criteria, butrather to narrative standards concerning nutrients and excessive algal growth. The TexasSurface Water Quality Standards [30 TAC, Chapter 307.4 (e)] say:
“Nutrients from permitted discharges or other controllable sources shallnot cause excessive growth of aquatic vegetation which impairs anexisting, attainable, or designated use. Site-specific nutrient criteria,nutrient permit limitations, and/or separate rules to control nutrients inindividual watersheds will be established where appropriate after noticeand opportunity for public participation and proper hearing.”
While there is little debate that nutrients in excessive amounts can create a situationconducive to the proliferation of algae and other aquatic plants, the quantification of what

3Texas Natural Resource Conservation Commission, Adopted February 2001
constitutes excessive algal and aquatic plant growth and the most effective means tocontrol that growth is more elusive. Determination that a narrative standard has beenviolated is inherently a subjective exercise, so determination of desired endpoints andallowable loading is also largely subjective. Objective science may establish linkagesbetween nutrient loading and water body trophic status, but subjective human values thendetermine or influence selection of the desired trophic level for a particular water body. Natural waters exhibit a range of trophic levels, that may vary geographically at anymoment or may vary through time at any location. Natural sources often providesufficient nutrients to support algal communities or blooms when other environmentalconditions are favorable. The algae and aquatic plant growth supported by nutrientsconstitute the basal level of the aquatic food chain, so entirely depleting a water body orsystem of nutrients would undermine its ecology. Selection of appropriate nutrientendpoints must balance consideration of what is ecologically and technologically feasibleagainst the subjective conditions favored by humans at any particular site.
When nutrients are the primary limiting factor for aquatic plants in a flowing stream, themost controllable nutrient is usually phosphorus. In the case of the North Bosque Riversegments, instream algal growth potential evaluations provided strong evidence thatphosphorus is a controlling factor in the growth of aquatic plants (Matlock et. al. 1999a,1999b). Evaluation of in-stream water quality data provided an estimate of the annual-average soluble phosphorus concentrations that are likely to limit the growth of aquaticplants in portions of the river ( Kiesling et. al., draft). However, it must be noted that anumber of other factors such as temperature, stream flow, light availability, and seasonalvariations influence and may control the growth of aquatic plants in a river system. Theecologic interplay of the numerous limiting factors, combined with the subjective natureof nutrient standards or goals, makes determination of precise nutrient limits verydifficult.
Local stakeholder participation in TMDL development was coordinated through theBosque River Advisory Committee (BRAC), which was initially formed in 1996 toaddress some of the social and political issues associated with delineation and mitigationof regional water quality issues. The committee membership included elected officials(state senator and representatives, county judges and commissioners, city mayors),watershed residents representing dairies (large and small), row crop farmers, non-agricultural industry, and citizens with general interest in water quality. Representativesof several agencies involved in local TMDL or Concentrated Animal Feeding Operation(CAFO) issues served as resources to support the stakeholder process. Advisors and stafffor the committee members also participated. The stakeholder committee was alsosupported by a Technical Work Group consisting of professionals from universities,institutes, and state and federal agencies. The Technical Work Group provided peerreview of and consultation for the technical analyses performed for the TMDL.
The endpoint for this TMDL is a significant reduction in soluble reactive phosphorus(SRP) average total-annual loading and annual-average concentrations, as measured inthe river at various sites. The goal is expressed as a “percent reduction” relative to theinitial (i.e. current or existing) condition at the respective sites. The numeric statement ofthe goal of these North Bosque River TMDLs is to reduce average total-annual loading of

4 Texas Natural Resource Conservation Commission, Adopted February 2001
SRP by approximately 50% for the entire North Bosque River watershed. That ispredicted to reduce annual-average SRP concentrations in the river by approximately47%, as a long-term watershed average and with some local variation that reflectslocation within the watershed and along the river.
Problem DefinitionThe Bosque River is located in north central Texas, northwest of the City of Waco, and is a tributary of the Brazos River. The Bosque River is impounded at Waco, near itsconfluence with the Brazos River, to form Waco Lake (Segment 1225), which provideswater for approximately 150,000 people. The North Bosque River is the longest arm ofthe Bosque system, draining approximately 75% of the Waco Lake watershed, while the Middle and South Bosque Rivers and Hog Creek drain most of the remaining area(Figure 1).
Topographically and historically, the Bosque River watershed is representative of theheart of Texas. The upper watershed has medium-sized hills, carved into a limestoneplateau, with relatively shallow, rocky soils and areas of moderate to steep slope. Theupper watershed has long been utilized for ranching, dairies, and other animal productionagriculture. The lower watershed, drained by the Middle and South Bosque Rivers, hasrolling blackland prairie with deep soils, and row crop production is the predominantform of agriculture. The distribution of these and other land uses within the watershed isdepicted on Figure 2.
The North Bosque River is administratively divided between two designated waterquality segments (see Figure 1):
• Segment 1226, North Bosque River – extends from a point 100 meters upstream ofFM Road 185 in McLennan County to a point immediately upstream of the conflu-ence of Indian Creek in Erath County
• Segment 1255, Upper North Bosque River – extends from a point immediatelyupstream of the confluence of Indian Creek in Erath County to the confluence of theNorth Fork and South Fork of the North Bosque River in Erath County
Designated uses for both segments of the North Bosque River are established in the Texas Surface Water Quality Standards (30 TAC Chapter 307). The 1998 Texas 303(d)List identified the North Bosque River segments as “impaired” by high levels of nutri-ents, based on exceedance of screening criteria used to assess support of narrativestandards. These total maximum daily load (TMDL) allocations were developed toaddress nutrient loading and algal growth, and to support plans for attaining and main-taining water quality standards in the North Bosque River. Actions that reduce nutrientloading in the North Bosque River watershed will also improve or protect water qualityin downstream water bodies.
Recent studies have indicated that phosphorus is the limiting nutrient in the watershedunder most conditions (Matlock et. al. 1999a, 1999b). Studies also indicated that solublephosphorus, which was analytically measured as soluble reactive phosphorus (or ortho-

5Texas Natural Resource Conservation Commission, Adopted February 2001
phosphate phosphorus), was a major form of phosphorus in the North Bosque River andstatiscally better correlated to algal levels than total phosphorus (Kiesling et. al., draft).These TMDLs focus on controlling soluble phosphorus loading and stream concentra-tions to attain and protect designated uses.
Endpoint IdentificationThe water quality standard that was the basis for including the North Bosque Riversegments on the 303(d) List is narrative in nature. There are currently no establishednumeric criteria for nutrients in Texas.
Studies in the North Bosque River watershed to support development of these TMDLsincluded biological experiments and chemical analyses to estimate critical nutrientspecies and concentrations for the local streams. Instream periphytometers were used toassess algal productivity (measured as periphytic chlorophyll-α production) relative tonitrogen and phosphorus concentrations, which led to the determination that phosphorusis the limiting nutrient under most conditions (Matlock et. al. 1999). Analyses of streamnutrient and chlorophyll-α data then supported estimation of an annual-average solublephosphorus concentration likely to exert some limitation on algal growth potential(Kiesling et. al., draft ). Scientific techniques and statistical approaches used to developpreliminary phosphorus targets were discussed extensively by the Technical WorkGroup. The conclusion was that annual-average soluble reactive phosphorus (SRP)concentrations of 50 micrograms per liter (µg/L) or less would have a limiting effect onstream algal communities. As a lower bound for a target range of annual-averagephosphorus concentrations, data from the least-disturbed reference stream in the water-shed (Neils Creek) were assessed. That assessment indicated that an annual-average SRPconcentration of 15 µg/L approximates least-disturbed natural conditions. Thus, biologi-cal and chemical data established that achieving annual-average phosphorus concentra-tions between 15 and 50 µg/L would probably have a significant limiting effect on algalgrowth. A “preliminary target” concentration within that range, i.e. 30 µg/L, wasestimated for a monitoring station immediately upstream of Meridian, and related to amonitored mid-1990s average concentration at the same site of 60 µg/L. As a grossestimate, a 50% reduction in loading was presumed needed to attain a 50% reduction inaverage concentration in the vicinity of Meridian.
Parts of the upper reaches of the North Bosque River (i.e. Segment 1255 and the upperpart of Segment 1226, or generally upstream from Iredell), and many tributary streams inthat area, are intermittent in natural flow. In a section of the Upper North Bosque(Segment 1255), some dry weather flow is maintained primarily by wastewater treatmentplant (WWTP) discharge from the City of Stephenville – but the length of that sectionvaries due to the effect of weather conditions. As a result, there is effectively a techno-logical lower limit on feasibly attainable nutrient concentrations within the zone affectedby the Stephenville discharge. The upper-reach nutrient concentrations vary widely overtime because storm runoff provides most flow other than the WWTP discharge, withrelatively little baseflow from groundwater to buffer or limit the variability. Intermittentsections of stream channels, whether in tributaries or in the main stem river, typicallycontain terrestrial or wetland plant growth that can provide natural nutrient loading

6 Texas Natural Resource Conservation Commission, Adopted February 2001
sufficient to support algal growth during wet periods. Consequently, algal growth in theupper reaches is probably more likely to be limited by light and/or water availability thanby nutrient availability or temperature (i.e. when water and light are available, algae cangrow; temperature and nutrients would seldom be limiting factors). For these reasons,nutrient concentration targets to assure control of aquatic plants are even more difficult toestablish for intermittent stream reaches, and less certain to be ecologically meaningful.
The North Bosque River TMDLs are meant to achieve significant reductions in the total-annual loading and annual-average concentration of soluble phosphorus in the NorthBosque River. Compared to existing conditions, the TMDLs are recommending averagetotal-annual load reductions ranging from about 39% to about 62%, depending on the sitemonitored, with an average overall reduction of approximately 50% in soluble phospho-rus average total-annual loading. Those load reductions are expected to reduce theaverage annual-average concentrations of soluble phosphorus by about 33% to 60%,depending on the site monitored. Because of the inherent natural variability of nutrientloading, “average” conditions or targets will be exceeded on occasion. Post-TMDLmonitoring of soluble phosphorus concentrations in the North Bosque River will utilizeprobability curves developed from model analyses to determine if the long-term responseof the system meets expectations.
Soluble phosphorus reductions of that magnitude (i.e. around 40% to 60%, loading orconcentration) will reduce the potential for problematic algae growth in the North BosqueRiver and downstream waters, and should reduce the actual occurrence of algal blooms. Model simulations predict that the annual-average soluble phosphorus concentration inthe North Bosque River at Valley Mills will be low enough to limit algal growth during90 to 95% of the years following implementation (see Figure 4). Algal growth potentialwill also be significantly reduced at the upstream stations, although to a lesser degreethan at Valley Mills (Figures 5 through 8). However, algae and nutrient interactions areextremely dynamic, and very much influenced by weather conditions and other environ-mental factors. Human efforts to control nutrient loading can reduce or limit theoccurrence of algal blooms, but cannot totally prevent them in living water bodies. Themodel analyses predict, as shown in Figures 4-8, that these TMDLs will improve waterquality conditions (i.e. reduce nutrient loads and concentrations) every year, but thatsome years will still exceed the most desirable range of annual-average soluble phospho-rus concentrations.
Source AnalysisDuring the 1980s, the dairy industry expanded very rapidly in the North Bosque Riverand adjacent watersheds, to the extent that Erath County became the leading county formilk production in the state. The total number of milk cows in the watershed grewtremendously, with the current total in the neighborhood of 41,000 head. In keeping withcurrent trends in the dairy industry, operations in this watershed also shifted fromrelatively small dairies dispersed over the landscape, to large dairies that tend to clustertogether for economic and cooperative reasons. At the time data were collected to supportthis evaluation, 104 of the 105 dairies operating in the Bosque River Basin were locatedin the watershed of Segments 1226 and 1255 of the North Bosque River. The majority of

7Texas Natural Resource Conservation Commission, Adopted February 2001
those 104 dairies are in the upper half of the North Bosque River watershed, with theprimary concentration within Erath County. Portions of Erath County that are not in theBosque River watershed (see Figure 1) also contain numerous dairy operations, such thatErath County alone contains more dairy cattle than the entire Bosque River watershed.
Extensive data collection and scientific studies were performed during the 1990s,primarily in the Upper North Bosque River watershed, to assess the water quality effectsof dairy practices. Those studies characterized nutrient loading from sources categorizedas urban stormwater runoff, municipal wastewater discharges, wood/range land, pasture,non-row crops, row crops, and dairy waste application fields (McFarland and Hauck1998, 1999a, 1999b). The percentage of gross annual loading provided by each of thesesources depends on the location at which loading is summarized, since land uses andwastewater discharge are not evenly distributed across all subwatersheds (see Figures 2and 3; McFarland and Hauck 1999a). Citizen stakeholders and technical experts involvedin development of the North Bosque River TMDL agreed that the data indicate the majorcontrollable sources of nutrients in the North Bosque River basin to be municipalwastewater treatment plants (WWTPs) and dairy waste application fields (WAFs). Ofthe other sources, only urban stormwater is controllable via an existing regulatoryprogram. Loading contributed by urban stormwater is relatively small compared to otherstorm-event-driven loading within the watershed. However, if needed later to achieve thegoals of these TMDLs, urban stormwater management to reduce phosphorus loadingcould be required by stormwater permits.
WWTPs are classic point sources, long regulated by state and federal permitting pro-grams. WWTP discharges have been analyzed (modeled) as distinct point sources, andwill be controlled as needed via the existing permit programs. Urban stormwater is alsolegally defined as a point source subject to permit requirements, but the hydrologicoccurrence of urban runoff and geographic distribution of discharge points are moresimilar to nonpoint sources from a modeling perspective. The areas in which cattle arefed or confined at dairy operations are subject to Concentrated Animal Feeding Operation(CAFO) permits because they are legally considered point sources. Runoff from areassuch as lots, feed lanes, and milking areas is regulated as point source, but runoff fromdairy WAFs is not covered by CAFO permits and is treated as a nonpoint source. Thereare also dairies that are small enough to not require CAFO permits, but are considered tobe small Animal Feeding Operations (AFO) and required to operate in compliance withTexas State Soil and Water Conservation Board (TSSWCB) guidance or TNRCC rules.Small AFOs are considered to be nonpoint sources, and regulated as such. Measures tocontrol nutrient loading from WAFs may include a combination of CAFO permitconditions regulating land application of CAFO wastes, watershed rules that affect allAFO operations, and voluntary programs.
The source categories of urban stormwater, wood/range land, pasture, non-row crops,row crops, and dairy waste application fields (WAFs) were analyzed (modeled) asnonpoint sources. Of these, only the urban stormwater and WAFs are associated withactivities that may require permits. Among these nonpoint categories, the largest sourcesof phosphorus loading in the North Bosque River basin are wood/range land and WAFs(Figure 3). The wood/range land use is considered to be the background condition of the

8 Texas Natural Resource Conservation Commission, Adopted February 2001
watershed, because those areas are relatively natural in character and contribute a largepercentile to the loading summary only because that land use occupies a large amount ofthe watershed area. On the other hand, the WAFs occupy a relatively small area of thewatershed, but contribute a disproportionately large share of the nutrient loading.
Figure 2 illustrates the distribution of land use within the Bosque River watershed.Municipalities with permitted WWTP discharges are listed in Table 1.
Table 1. Municipal WWTP Flows (daily average in Million Gallons per Day – MGD)
City Permitted Flow Recent Flow Estimated Yr 2020Flow **
Clifton (old) 0.400 0.303 NA
Clifton (new) 0.650 NA 0.372
Hico 0.200 0.086 0.089
Iredell 0.050 0.024 0.033
Meridian 0.450 0.157 0.251
Stephenville 3.000 1.939 2.629
Valley Mills 0.360 0.101 0.103
Total * 4.710 2.610 3.477(* Total permitted flow uses new Clifton facility) (** from Easterling 2000)
Population projections for 20 years in the future for each of the municipalities withpermitted WWTPs were prepared for assessing future growth conditions (Table 2;Easterling 2000).
There are 104 dairies operating or authorized within the North Bosque River watershed.Of those, 66 are CAFOs operating under individual or general permits, while 38 areAFOs that are not required to obtain permits but must operate such that they do not causewater quality problems.

9Texas Natural Resource Conservation Commission, Adopted February 2001
Table 2. Estimated Urban Population Growth within the North Bosque RiverWatershed
City Year 2000 Year 2020
Clifton 3,557 4,268
Hico 1,380 1,417
Iredell 433 581
Meridian 1,504 1,791
Stephenville 16,060 21,103
Valley Mills 1,090 1,118
Total 24,024 30,278
The existing gross annual loadings above (upstream of) each of the five North BosqueRiver index stations were estimated using water quality analyses and land use informa-tion (McFarland and Hauck 1999a). This served to establish approximate percentilecontributions to the gross loading by each source or land use type. Those gross annualloads, and the percent contributions by source type, are shown in Figure 3. The percentcontributions by source category are also shown in Table 3.
Table 3. Estimated Percent of Total Gross Annual Load by Source Type
Source AboveStephenville
BelowStephenville
Above Meridian
Clifton Valley Mills
urban runoff 2 % 6 % 6 % 6 % 6 %
row crop 0 % 0 % 2 % 4 % 5 %
non-row crop 2 % 2 % 2 % 1 % 1 %
pasture 9 % 5 % 7 % 8 % 9 %
wood/range 7 % 5 % 18 % 22 % 24 %
WWTP 0 % 28 % 10 % 9 % 10 %
WAF 80 % 54 % 55 % 50 % 45 %
Column totals(%)
100 % 100 % 100 % 100 % 100 %
Linkage Between Sources and Receiving WaterData collected during the 1990s were used to develop and calibrate a watershed model ofthe Bosque River basin. The model program used was the Soil and Water AssessmentTool, or SWAT (Arnold et al 1998; Arnold et al 1999; USDA-ARS 1999), which is

10 Texas Natural Resource Conservation Commission, Adopted February 2001
designed for assessing large-scale agricultural management and water quality issues, andis supported by the U.S. Department of Agriculture - Agriculture Research Service.Preparation of a Bosque River application of SWAT was a joint effort by the TexasInstitute for Applied Environmental Research (TIAER) and the Blackland Research andExtension Center (Blackland), with TIAER providing some of the input data andBlackland staff operating the model (Santhi et al 2000). The Bosque River application ofSWAT is the primary technical tool for linking watershed sources, land use, and manage-ment practices to receiving water responses.
The SWAT model is dynamic, or time-variable, using a one-day time step and capable ofsimulating periods ranging from a few weeks to many years. Model inputs definesubwatersheds within which management measures (i.e. crops, timing of irrigation orfertilizer applications, etc.), soil types and topography, and weather conditions can bestipulated. For each day of simulation, the model uses the weather input, subwatershedcharacteristics and management practices, crop growth effects, and other physicalprocesses approximated by the model algorithms, to calculate the amount of water andassociated constituents leaving the subwatershed outlet. Constituents simulated mayinclude sediment, particulate and soluble forms of nutrients, and pesticides. A flowrouting component of the model transports flow and loading from each subwatershedacross the subsequent subwatersheds while accumulating the subwatershed contributions.First-order decay kinetics were calibrated to allow the flow routing component of SWATto also account for assimilation of soluble phosphorus (i.e. via conversion to biomass oradsorbtion to soil particles).
Initial steps towards the Bosque River application of SWAT involved definition andcharacterization of the modeled watershed. Land use, soils and topographic informationwere used to determine subwatersheds and their individual characteristics. Precipitationand temperature data were collected and formatted to drive model simulations of recenthistorical periods.
Water quality data were collected and analyzed to characterize the river response duringa monitoring period in the mid-1990s. Then, the model was calibrated by simulating aperiod of time during which input factors (i.e. rainfall, land uses and management, etc.)and output factors (i.e. water quality, nutrient concentrations in stream) were known, andadjusting model kinetics or input parameters until the observed (i.e. real life) conditionswere reproduced as closely as possible by the model output. Once calibrated, the modelwas ready for use in TMDL analyses (Santhi et. al. 2000a, 2000b).
In order that the model simulations should account for the variability in nutrient concen-trations or loading that occur due to normal variations in weather, the SWAT runssimulated a 39-year period using actual records of daily rainfall and temperature for theyears 1960 through 1998. For predictive purposes, those years are assumed to representthe usual range of weather conditions that are likely to occur – although future weathercannot be expected to occur in precisely the same sequence.
If plotted directly, the raw model output produces a time series of SRP concentrationsthat reflect temporal variability, which appears erratic and very difficult to interpret. So,

11Texas Natural Resource Conservation Commission, Adopted February 2001
review of model output focused on predicted annual-average SRP concentrations, whichwas justified because of both model calibration and TMDL implementation consider-ations. In calibration, model-predicted monthly-average and annual-average SRPconcentrations compared well to observed concentrations, but predicted daily concentra-tions compared less well. Other nutrient TMDLs have used long-term averages as targetsrather than daily concentrations. These considerations supported defining annual-averageSRP concentration as an appropriate parameter for post-TMDL monitoring.
In order to enhance model output interpretation and target evaluation, the SWAT-predicted annual-average SRP concentrations for the 39 simulated years were developedinto exceedance probability graphs by ranking the annual results from highest to lowestand plotting exceedance probabilities for each annual value. The SWAT simulations keptland uses and management measures constant while weather conditions were dynami-cally simulated for a representative 39-yr period, so the resulting variation in the modeloutput represents the effect of hydrologic variability. The resulting figures (see Figs. 4through 9) can thus be read as indicating the probability that a particular annual-averageconcentration (or total-annual load) will be equaled or exceeded during any random year,or as the frequency at which a particular annual-average concentration will be equaled orexceeded during any group of years. For instance, in Figure 4, looking at the linerepresenting the “TMDL-e” case in the concentration-based graphs, above the 0.2exceedance probability marker, one reads the figure as predicting that the annual-averageconcentration would be greater than or equal to (approximately) 29 parts per billion (ppb)in 20% of future years, and less than or equal to 29 ppb in 80% of future years. For thepurposes of these TMDL analyses and discussions, parts per billion (ppb) and micro-grams per liter (µg/L) are considered to be equivalent units, and are used interchange-ably.
Numerous predictive model scenarios were simulated to provide insights concerning thelinkage between watershed conditions, management practices, and instream waterquality. Scenarios represented in this report include:
Existing – represents conditions extant during the mid-1990s; uses actualflows and concentrations of WWTPs, actual dairy cow numbers(40,450) and WAF areas, etc., as measured during the monitor-ing/calibration period
Future – represents “full permitted” conditions for WWTPs and dairies,and projected urban populations and areas 20 years in the future;uses maximum number of dairy cows (66,930) allowable underexisting permits with corresponding WAF area, and maximumpermitted WWTP flows with phosphorus concentrations asmeasured during monitoring period; includes hypothetical 0.6million gallons per day (MGD) discharge to represent new pointsources
TMDL-e – incorporates management measures for WAFs and WWTPs,using populations, WWTP flows, dairy cow numbers and WAF

12 Texas Natural Resource Conservation Commission, Adopted February 2001
area corresponding to mid-1990s monitoring period; representsanticipated effect of TMDL under “existing conditions”
TMDL-f – incorporates management measures for WAFs and WWTPs,using populations, WWTP flows, dairy cow numbers and WAFarea corresponding to 20 years growth and full permitted limits;represents anticipated effect of TMDL under “future growth”conditions; includes hypothetical 0.6 million gallons per day(MGD) discharge to represent new point sources
Nonpoint only – same as TMDL cases except that WWTPs remain at “existing”conditions; provides a way to estimate how much load or con-centration reduction at the river index sites was due to nonpointsource management practices on WAFs only, which also pro-vides estimates for the amount of reduction due to WWTP mea-sures.
The “existing condition” model scenario provides the initial or reference values forcalculating percent reductions, and the “TMDL-e” model scenario defines the amount ofreduction possible if a hypothetical suite of management measures is imposed on existingconditions. Similarly, the “future growth” model scenario provides the reference values,and the “TMDL-f” scenario estimates the amount of reduction, for calculating percentreductions that would occur under full-permitted and 20-year growth conditions.
Discussion of percent reduction targets are based on long-term averages derived from themodel results. Each model run produced 39 total-annual loads and 39 annual-averageconcentrations representing each year included in the simulation. Plotting those sets of 39values produced the model output figures shown in Figures 4-9. The long-term averagesused for target discussions were determined by calculating the arithmetic mean for eachset of 39 values. The calculated long-term averages are depicted as horizontal linescrossing the “existing” and “TMDL-e” plots for concentration and load in Figures 4-8.
Results from the model runs, as illustrated in Figures 4 through 8, indicate that themanagement measures simulated can significantly reduce total-annual loading andannual-average concentration of SRP throughout the North Bosque River watershed, andthus in downstream water bodies as well. The model results also indicate that lowersoluble phosphorus loads and concentrations will occur every year, although the naturalvariation caused by weather and other environmental conditions will cause some years tostill exceed the most desirable levels. Stated another way, “better conditions” will occurevery year at all locations, “desirable conditions” will occur more often and at morelocations, and “undesirable conditions” will occur less often at fewer locations. Inparticular, annual-average concentrations in the lower river reaches (i.e. at Clifton andValley Mills) are predicted to be less than the 50 µg/L biological limitation concentrationderived from periphytometer studies and in-stream water quality data analyses, in mostyears.

13Texas Natural Resource Conservation Commission, Adopted February 2001
Model results from “Above Stephenville” (Fig. 8) characterize a subwatershed thatcontains no permitted WWTP discharges, but does contain numerous dairy operationsand WAFs. Annual load and concentration reductions predicted for that subwatershedarea are considered to be representative of how the simulated management measureswould affect phosphorus loading and water quality in other dairy-dominated subwater-sheds. This result demonstrates that the simulated suite of management measures wouldalso cause significant improvement to water quality conditions in unclassified tributarystreams that have no point source discharges and contain dairy operations.
By performing an intermediate model run that incorporated only the nonpoint source (i.e.WAF) management measures, leaving WWTPs at their “existing” condition, andcomparing that to the “TMDL-e” model run, it is possible to estimate the “Nonpointonly” portion of reductions in annual-average concentration and total-annual loading.Figure 9 shows model output profiles that depict this process for two river stations, andalso shows the net percent reductions then calculated as being achieved by the WWTPand WAF sources upstream from the stations.
Figure 9 also illustrates an important but sometimes confusing relationship betweenloading and instream concentrations. When concentration output is reviewed, pointsource reduction causes the most change. When loading output is reviewed, nonpointsource reduction causes the most change. For the purposes of this TMDL, the mostimportant point to be gained from Figure 9 is that both point (WWTP) and nonpoint(WAF) sources are significant contributors.
Margin of SafetyThis TMDL includes an implicit margin of safety that is significant but not specificallyquantifiable. The margin of safety is embodied in two major aspects of the technicalanalyses and modeling performed to develop the TMDL.
First, a very large amount of data and information concerning nutrient sources andconditions in the North Bosque River watershed has been collected and assessed. Fewwatersheds in the United States have been studied as extensively with regard to nutrientissues and agricultural management practices. The data were thoroughly analyzed andpeer-reviewed by experienced professionals at TIAER and in the technical work groupthat assisted in the project. Because of these factors, uncertainty associated with the studyconclusions is minimized, and should be significantly less than the uncertainty associatedwith nutrient loading analyses in general.
Second, the SWAT model used for assessing alternatives is generally conservative. Thisis evident by comparing the “existing” model scenario output (exceedance probabilitycurves) to the monitored phosphorus data from corresponding stations. Most notably inthe lower river stations (i.e. Clifton and Valley Mills), the “existing” model scenariooutput tends to predict higher annual-average phosphorus concentrations than wererecorded during the mid- to late-1990s. The model was calibrated to data from a periodthat included two major flood events, which probably maximized watershed nonpointsource loading and stream transport of phosphorus to the lower watershed. Since the

14 Texas Natural Resource Conservation Commission, Adopted February 2001
calibration period, severe drought conditions have occurred, with minimal watershedloading and more loss of stream flow to evaporation or bank storage than the modelcalibration conditions. So, recently observed river concentrations have been significantlylower than the model predicts would occur. Calibration to maximal loading conditionsmeans that the model tends to overpredict loading and transport under more average orlow-flow conditions, and is thus environmentally conservative. Basically, this means thatmanagement measures are likely to be more effective, in the long-term average context ofTMDL targets, than the model results predict.
Pollutant Load AllocationsTMDLs establish the allowable pollutant loading for each water body, distributed amongthe source categories that contribute the pollutant. The TMDLs described in this sectionwill result in compliance with water quality standards. Implementation plans to achievethe recommended reductions may select a phased approach that achieves initial loadingreductions from a subset of the source categories. A phased approach would allow fordevelopment or refinement of technologies that enhance the effectiveness of certainmanagement measures. Periodic and repeated evaluations of the effectiveness ofimplementation measures will assure that progress is occurring, and may show that theoriginal distribution of loading among sources can be modified to increase efficiency,while maintaining the objective of compliance with water quality standards.
The phosphorus sources addressed by these TMDLs include urban stormwater runoff,municipal wastewater discharges, wood/range land, pasture, non-row crops, row crops,and dairy waste application fields. Estimates of the existing (circa 1997) gross solublephosphorus loading from each of those source types were derived from land use data,water quality data, phosphorus export coefficients (McFarland and Hauck 1998), andpermit records (for municipal wastewater discharges), at several index stations along theNorth Bosque River (McFarland and Hauck 1999a). Those estimates are presented in Fig.3, which shows both the percent contribution by each source type, and the total accumu-lated load during the 29-month monitoring period, by source type.
Those estimates are not directly comparable to the model output values or figures. Thegross loading estimates predict how much phosphorus leaves a relatively small site (i.e.per acre) during an average year, and do not account for any loss or assimilation betweenthe source site and the water quality site some distance downstream. Thus the estimatesrepresent the gross average movement of phosphorus within a subwatershed, but streamdata would measure the net unassimilated loading that passes the monitoring site (whichmust always be less than the gross export). However, the percent contributions by sourcetype derived from these estimates can be assumed to be reasonably consistent andapplicable to net soluble phosphorus loading. The percentile contributions, together withland use area information, can then be used to determine which subcategories of pointand nonpoint sources should be targeted for reduction efforts.
Management measures ultimately implemented as a result of these TMDLs should lead toreducing average total-annual net SRP load by approximately 50%, and average annual-average SRP concentrations by approximately 47%. Stated another way, following

15Texas Natural Resource Conservation Commission, Adopted February 2001
implementation of management practices to meet the recommended reductions, theamount of soluble phosphorus that passes Meridian each year should be approximatelyhalf as much as would have passed there under similar environmental conditions beforeTMDL implementation.
Model scenarios represented existing conditions prior to TMDL implementation andpredicted future conditions following TMDL implementation. Table 4 summarizes beforeand after model results, from the “Existing” and “TMDL-e” scenarios respectively,showing predicted average total-annual loading for each of the river index stations. Thesevalues represent net loading predicted to pass each site, which is different from (lessthan) the gross loading generated by sources upstream from the sites.
Table 4. Predicted Net Average Total-Annual Soluble Phosphorus Loading
Loading is expressedin units of kilograms
per year, kg/yrAbove
StephenvilleBelow
StephenvilleAbove
Meridian Clifton Valley Mills
Predicted averagetotal-annual load from‘Existing’ scenario
4,061 10,068 22,117 26,990 28,832
Predicted averagetotal-annual load from‘TMDL-e’ scenario
1,556 4,173 10,479 15,498 17,625
Both point and nonpoint sources are expected to reduce their aggregate (i.e. sum of allindividual sources) loading by approximately 50% compared to their respective existingaggregate loading. Table 5 presents estimates of the percent reductions needed aboveeach river index station.
Similar comparison of model simulations indicates that average annual-average SRPconcentrations will also be significantly reduced. Table 6 illustrates that overall annual-average concentration reductions ranging from 33% to 61% are predicted by the model,as the average response over multi-year periods, depending on where in the watershed thereductions are calculated. Most of the reduction in annual-average concentration isexpected to occur in the middle watershed.
The “preliminary target” established from biological data and analyses was to reducesoluble phosphorus loading above Meridian approximately 50%, in order to attain asimilar reduction in annual-average concentration. Tables 4 and 6 show that averagetotal-annual load and average annual-average concentration can both be reduced byapproximately 50% at the model output station “Above Meridian,” which is the nearest

16 Texas Natural Resource Conservation Commission, Adopted February 2001
Table 5. Estimated Gross Loading Reductions Needed To Achieve Target Percentages below are calculated relative to existing gross loading, and estimate the anticipated average
% reductions within watersheds where gross loading originates.
AboveStephenville
BelowStephenville
Above Meridian Clifton Valley Mills
Estimated % reductionof nonpoint sourceloading
61.68 % 55.31 % 51.50 % 41.10 % 37.54 %
Estimated % reductionof point source load-ing
0.00 % 66.90 % 62.70 % 57.50 % 50.80 %
The decimal places shown in this table are artifacts of the estimation process, and should not beconsidered significant.
Table 6. Average Annual-Average Soluble Phosphorus Concentration
AboveStephenville
BelowStephenville
Above Meridian Clifton
ValleyMills
From ‘Existing’ sce-nario (ppb)
203.3 1,143.2 117.0 52.2 41.3
From ‘TMDL-e’ sce-nario (ppb)
114.2 448.1 54.5 30.3 27.5
% reduction 43.83 % 60.80 % 53.42 % 41.95 % 33.41 %
The decimal places shown in this table are artifacts of the estimation process, and should not beconsidered significant.
to the original monitoring station for which preliminary targets were discussed. Thismeans that the amount of soluble phosphorus that passes Meridian each year after TMDLimplementation should be approximately half as much as would have passed there undersimilar environmental conditions before TMDL implementation.
Some allowance for future growth (AFG) is embodied in these TMDLs. The “futuregrowth” model scenarios incorporated full permitted discharge from WWTPs, themaximum number of dairy cows allowable under current permits and rules with corre-sponding WAF area, and included a hypothetical 0.6 million gallons per day (MGD) ofwastewater discharge to represent potential new industry or municipal growth beyond thecapacity of current permits. In addition, the “future” scenarios used human populationprojections to estimate urban areas 20 years in the future and adjusted urban runoffaccordingly. As shown in Figures 4 through 8, TMDL implementation is expected toachieve annual-average SRP concentrations and total-annual net SRP loading that aresignificantly less than the existing condition, with 20 years of growth and full permitteddischarges included.

Erath
Coryell
Bosque
McLennan
Hamilton
SomervellStephenville
Dublin
Hico
Iredell
Meridian
CliftonCranfills Gap
Waco
Valley Mills
Crawford
McGregor
WQ Segment watersheds1226 - North Bosque1255 - Upper North Bosque
0 5 10 15 Miles
N
EW
S
Figure 1 - North Bosque River Watershed
17

Bosque Land UsesCroplandDairy Waste FieldsForestPastureRangeUrbanWWTPWater
Figure 2 - Bosque River Land Uses
18

1
WAFRow CropNon-Row CropPastureWood/RangeWWTPUrban
Figure 3 - Estimates of Gross Existing Loadingsat Selected North Bosque River Stations
Load estimates were derived from export coefficients for each land use in each subwatershed.
Estimated loads represent the grossamount of PO4-P generated over/by theland surface from November 1995 throughMarch 1998. Due to loss or assimilation ofPO4-P between points of origin and streammonitoring locations, the net load measured (or predicted) is less than the gross load generated by watershed.
0
15000
30000
45000
60000
75000
90000
PO4 LOADINGS (kg) Nov 95 - Mar 98
7%
9%
2%
2%
80%
0
15000
30000
45000
60000
75000
90000
PO4 LOADINGS (kg) Nov 95 - Mar 98
54%
6%
2%5%
5%
28%
0
15000
30000
45000
60000
75000
90000
PO4 LOADINGS (kg) Nov 95 - Mar 98
18%
10%
6%
55%
2%2%
7%
0
15000
30000
45000
60000
75000
90000
PO4 LOADINGS (kg) Nov 95 - Mar 98
45%
24%
10%6%
9%1% 5%19
0
15000
30000
45000
60000
75000
90000
PO4 LOADINGS (kg) Nov 95 - Mar 98
50%22%
9%
6%
1% 4%8%

Figure 4 - SWAT Model results at Valley Mills
PO4 Concentrations @ Valley Mills - Future
0
20
40
60
80
100
120
0 0.1 0.2 0.3 0.4 0.5 0.6 0.7 0.8 0.9 1
Exceedance Probability
Sol P
con
cent
ratio
n in
ppb
Future Existing TMDL-f
PO4 Loadings @ Valley Mills - Future
0
20000
40000
60000
80000
100000
120000
140000
160000
0 0.1 0.2 0.3 0.4 0.5 0.6 0.7 0.8 0.9 1
Exceedance Probability
Ann
ual S
ol P
Loa
d in
kg
Future Existing TMDL-f
PO4 Loadings @ Valley Mills - Existing
0
10000
20000
30000
40000
50000
60000
70000
80000
90000
100000
110000
120000
0 0.1 0.2 0.3 0.4 0.5 0.6 0.7 0.8 0.9 1
Exceedance Probability
Ann
ual S
ol P
Loa
d in
kg
Existing TMDL-e
PO4 Concentrations @ Valley Mills - Existing
0
10
20
30
40
50
60
70
80
0 0.1 0.2 0.3 0.4 0.5 0.6 0.7 0.8 0.9 1
Exceedance Probability
Sol P
con
cent
ratio
n in
ppb
Existing TMDL-e
20

Figure 5 - SWAT Model results at Clifton
PO4 Concentrations @ Clifton - Future
0
20
40
60
80
100
120
140
160
0 0.1 0.2 0.3 0.4 0.5 0.6 0.7 0.8 0.9 1
Exceedance Probability
Sol P
con
cent
ratio
n in
ppb
Future Existing TMDL-f
PO4 Loadings @ Clifton - Future
0
20000
40000
60000
80000
100000
120000
140000
160000
0 0.1 0.2 0.3 0.4 0.5 0.6 0.7 0.8 0.9 1
Exceedance Probability
Ann
ual S
ol P
Loa
d in
kg
Future Existing TMDL-f
PO4 Loadings @ Clifton - Existing
0
10000
20000
30000
40000
50000
60000
70000
80000
90000
100000
110000
0 0.1 0.2 0.3 0.4 0.5 0.6 0.7 0.8 0.9 1
Exceedance Probability
Ann
ual S
ol P
Loa
d in
kg
Existing TMDL-e
PO4 Concentrations @ Clifton - Existing
0
10
20
30
40
50
60
70
80
90
100
0 0.1 0.2 0.3 0.4 0.5 0.6 0.7 0.8 0.9 1
Exceedance Probability
Sol P
con
cent
ratio
n in
ppb
Existing TMDL-e
21

Figure 6 - SWAT Model results Above Meridian
PO4 Concentrations Above Meridian - Future
0
50
100
150
200
250
300
0 0.1 0.2 0.3 0.4 0.5 0.6 0.7 0.8 0.9 1
Exceedance Probability
Sol P
con
cent
ratio
n in
ppb
Future Existing TMDL-f
PO4 Loadings Above Meridian - Future
0
20000
40000
60000
80000
100000
120000
140000
0 0.1 0.2 0.3 0.4 0.5 0.6 0.7 0.8 0.9 1
Exceedance Probability
Ann
ual S
ol P
Loa
ds in
kg
Future Existing TMDL-f
PO4 Concentrations Above Meridian - Existing
0
20
40
60
80
100
120
140
160
180
0 0.1 0.2 0.3 0.4 0.5 0.6 0.7 0.8 0.9 1
Exceedance Probability
Sol P
con
cent
ratio
ns In
ppb
Existing TMDL-e
PO4 Loadings Above Meridian - Existing
0
10000
20000
30000
40000
50000
60000
70000
80000
90000
0 0.1 0.2 0.3 0.4 0.5 0.6 0.7 0.8 0.9 1
Exceedance Probability
Ann
ual S
ol P
Loa
ds in
kg
Existing TMDL-e
22

Figure 7 - SWAT Model results Below Stephenville
PO4 Concentrations Below Stephenville - Future
0
200
400
600
800
1000
1200
1400
1600
1800
2000
0 0.1 0.2 0.3 0.4 0.5 0.6 0.7 0.8 0.9 1Exceedance Probability
Sol P
con
cent
ratio
n in
ppb
Future Existing TMDL-f
PO4 Loadings Below Stephenville - Future
0
4000
8000
12000
16000
20000
24000
28000
32000
36000
40000
0 0.1 0.2 0.3 0.4 0.5 0.6 0.7 0.8 0.9 1
Exceedance Probability
Ann
ual S
ol P
Loa
ds in
kg
Future Existing TMDL-f
PO4 Concentrations Below Stephenville - Existing
0
200
400
600
800
1000
1200
1400
1600
0 0.1 0.2 0.3 0.4 0.5 0.6 0.7 0.8 0.9 1Exceedance Probability
Sol P
con
cent
ratio
n in
ppb
Existing TMDL-e
PO4 Loadings Below Stephenville - Existing
0
4000
8000
12000
16000
20000
24000
28000
32000
0 0.1 0.2 0.3 0.4 0.5 0.6 0.7 0.8 0.9 1Exceedance Probability
Ann
ual S
ol P
Loa
ds in
kg
Existing TMDL-e
23

Figure 8 - SWAT Model results Above Stephenville
PO4 Concentrations Above Stephenville - Future
0
100
200
300
400
500
600
700
800
900
0 0.1 0.2 0.3 0.4 0.5 0.6 0.7 0.8 0.9 1
Exceedance Probability
Sol P
con
cent
ratio
n in
ppb
Future Existing TMDL-f
PO4 Loadings Above Stephenville - Future
0
4000
8000
12000
16000
20000
24000
28000
0 0.1 0.2 0.3 0.4 0.5 0.6 0.7 0.8 0.9 1Exceedance Probability
Ann
ual S
ol P
Loa
d in
kg
Future Existing TMDL-f
PO4 Loadings Above Stephenville - Existing
0
4000
8000
12000
16000
20000
24000
0 0.1 0.2 0.3 0.4 0.5 0.6 0.7 0.8 0.9 1Exceedance Probability
Ann
ual S
ol P
Loa
d in
kg
Existing TMDL-e
PO4 Concentrations Above Stephenville - Existing
0
100
200
300
400
500
600
0 0.1 0.2 0.3 0.4 0.5 0.6 0.7 0.8 0.9 1Exceedance Probability
Sol P
con
cent
ratio
n in
ppb
Existing TMDL-e
24
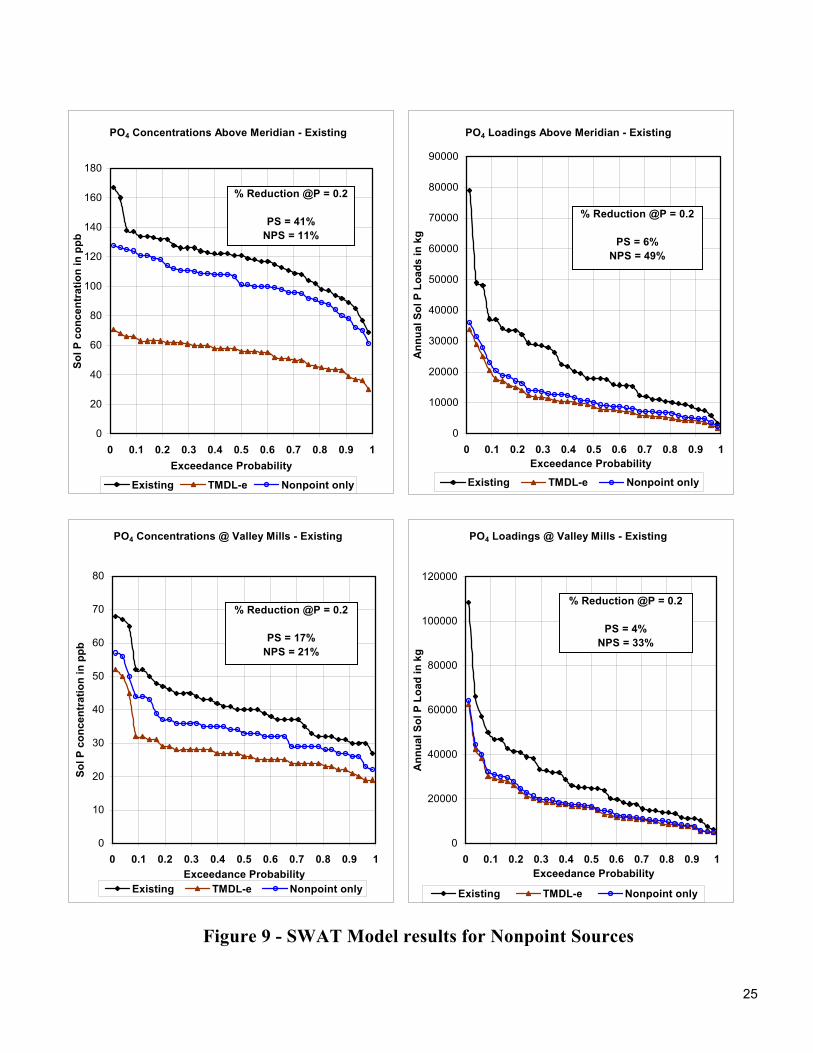
Figure 9 - SWAT Model results for Nonpoint Sources
PO4 Concentrations Above Meridian - Existing
0
20
40
60
80
100
120
140
160
180
0 0.1 0.2 0.3 0.4 0.5 0.6 0.7 0.8 0.9 1Exceedance Probability
Sol P
con
cent
ratio
n in
ppb
Existing TMDL-e Nonpoint only
% Reduction @P = 0.2
PS = 41%NPS = 11%
PO4 Loadings Above Meridian - Existing
0
10000
20000
30000
40000
50000
60000
70000
80000
90000
0 0.1 0.2 0.3 0.4 0.5 0.6 0.7 0.8 0.9 1Exceedance Probability
Ann
ual S
ol P
Loa
ds in
kg
Existing TMDL-e Nonpoint only
% Reduction @P = 0.2
PS = 6%NPS = 49%
PO4 Concentrations @ Valley Mills - Existing
0
10
20
30
40
50
60
70
80
0 0.1 0.2 0.3 0.4 0.5 0.6 0.7 0.8 0.9 1Exceedance Probability
Sol P
con
cent
ratio
n in
ppb
Existing TMDL-e Nonpoint only
% Reduction @P = 0.2
PS = 17%NPS = 21%
PO4 Loadings @ Valley Mills - Existing
0
20000
40000
60000
80000
100000
120000
0 0.1 0.2 0.3 0.4 0.5 0.6 0.7 0.8 0.9 1Exceedance Probability
Ann
ual S
ol P
Loa
d in
kg
Existing TMDL-e Nonpoint only
% Reduction @P = 0.2
PS = 4%NPS = 33%
25

26 Texas Natural Resource Conservation Commission, Adopted February 2001
ReferencesAdams, T., and McFarland, A. 2000. Semi-Annual Water Quality Report for the Bosque
River Watershed (Monitoring Period: January 1, 1998 - December 31, 1999). TIAERReport # S.1.2-99. Stephenville, TX: Texas Institute for Applied EnvironmentalResearch.
Arnold, J. G., Srinivasan, R., Muttiah, R. S., and Allen, P. M. 1999. Continental scalesimulation of the hydrologic balance. J. American Water Resources Association.35(5): 1037-1051.
Arnold, J.G., Srinivasan, R., Muttiah, R.S., and Williams, J.R. 1998. Large area hydrolo-gic modeling and assessment part I: model development. J. American Water Re-sources Association 34(1):7389.
Easterling, N. 2000. Future Growth Projections for the Lake Waco / Bosque RiverWatershed. TIAER Report # WP0005. Stephenville, TX: Texas Institute for AppliedEnvironmental Research, Tarleton State University.
Kiesling, R., Pearson, C., and McFarland, A. (In draft). Nutrient Targets in the BosqueRiver Watershed: Developing Ecosystem Restoration Criteria for a EutrophicWatershed. Stephenville, TX: Texas Institute for Applied Environmental Research,Tarleton State University.
Matlock, M. D., and Rodriguez, A. D. 1999. Preliminary Report of Findings: Periphyto-meter Study on Streams in the Lake Waco / Bosque River Watershed. Unpublished:prepared for the Texas Institute for Applied Environmental Research, Tarleton StateUniversity, Stephenville, TX.
Matlock, M. D., Storm, D. E., Smolen, M. D., Matlock, M. E., McFarland, A., andHauck, L. 1999. Development and Application of a Lotic Ecosystem Trophic StatusIndex. Transactions of the American Society of Agricultural Engineers (SW3302).42(3):651-656.
McFarland, A, and Hauck, L.. 1995. Livestock and the environment: Scientific underpin-nings for policy analysis. TIAER Report # PR95-01. Stephenville, TX: TexasInstitute for Applied Environmental Research.
McFarland, A., and Hauck, L. 1997. Livestock and the environment: A national pilotproject. TIAER Report # PR97-02. Stephenville, TX: Texas Institute for AppliedEnvironmental Research.
McFarland, A., and Hauck, L. 1998. Determining Nutrient Contribution by Land Use forthe Upper North Bosque River Watershed. TIAER Report # PR98-01. Stephenville,TX: Texas Institute for Applied Environmental Research, Tarleton State University.

27Texas Natural Resource Conservation Commission, Adopted February 2001
McFarland, A., and Hauck, L. 1999a. Existing Nutrient Sources and Contributions to theBosque River Watershed. TIAER Report # PR99-11. Stephenville, TX: TexasInstitute for Applied Environmental Research, Tarleton State University.
McFarland, A., and Hauck, L. 1999b. Relating agricultural land uses to in-streamstormwater quality. J. of Environmental Quality. 28: 836-844.
Pearson, C., and McFarland, A. 1999. Semi-Annual Water Quality Report for the BosqueRiver Watershed (Monitoring Period: January 1, 1997 - December 31, 1998). TIAERReport # WP 99-06. Stephenville, TX: Texas Institute for Applied EnvironmentalResearch.
USDA-ARS. 1999. Soil and Water Assessment Tool - Model Documentation,http://www.brc.tamus.edu/swat/manual.
Santhi, C, J.G. Arnold, J.R. Williams, W.A. Dugas, and L.M. Hauck. 2000a. Applicationof a watershed model in TMDL-BMP analysis. (In Preparation).
Santhi, C, J.G. Arnold, J.R. Williams, W.A. Dugas, and L.M. Hauck. 2000b. Validationof the SWAT model on a large river basin with point and nonpoint sources. J. Amer.Water Resourc. Res. (In Press).
Texas Natural Resource Conservation Commission. 1998. State of Texas 1998 CleanWater Act Section 303(d) List and Schedule for Development of Total MaximumDaily Loads. SFR-58. Austin, TX: TNRCC.
Texas Natural Resource Conservation Commission. 1999. Developing Total MaximumDaily Load Projects in Texas: A Guide for Lead Organizations. GI-250. Austin, TX:TNRCC. http://www.tnrcc.state.tx.us/water/quality/tmdl.