two-dimensional correlation spectroscopy in polymer … · noda developed two-dimensional...
TRANSCRIPT
REVIEWpublished: 11 March 2015
doi: 10.3389/fchem.2015.00014
Frontiers in Chemistry | www.frontiersin.org 1 March 2015 | Volume 3 | Article 14
Edited by:
Shigeaki Morita,
Osaka Electro-Communication
University, Japan
Reviewed by:
Michele Galizia,
University of Texas at Austin, USA
Yusuke Hattori,
Musashino University, Japan
*Correspondence:
Young Mee Jung,
Department of Chemistry,
Kangwon National University,
1 Kangwondaehak-gil,
Chunchon 200-701, South Korea
Specialty section:
This article was submitted to Polymer
Chemistry, a section of the journal
Frontiers in Chemistry
Received: 27 December 2014
Accepted: 17 February 2015
Published: 11 March 2015
Citation:
Park Y, Noda I and Jung YM (2015)
Two-dimensional correlation
spectroscopy in polymer study.
Front. Chem. 3:14.
doi: 10.3389/fchem.2015.00014
Two-dimensional correlationspectroscopy in polymer studyYeonju Park 1, Isao Noda 2 and Young Mee Jung 1*
1Department of Chemistry, Kangwon National University, Chunchon, South Korea, 2Department of Materials Science and
Engineering, University of Delaware, Newark, DE, USA
This review outlines the recent works of two-dimensional correlation spectroscopy
(2DCOS) in polymer study. 2DCOS is a powerful technique applicable to the in-depth
analysis of various spectral data of polymers obtained under some type of perturbation.
The powerful utility of 2DCOS combined with various analytical techniques in polymer
studies and noteworthy developments of 2DCOS used in this field are also highlighted.
Keywords: two-dimensional correlation spectroscopy, 2DCOS, polymer, hetero-spectral correlation, projection
2D, PCA 2DCOS, eigenvalue manipulating transformation, self-modeling curve resolution
Introduction
Noda developed two-dimensional correlation spectroscopy (2DCOS) for analyzing the small-amplitude dynamic strain-dependent time-resolved IR linear dichroism spectra of a polymer film(Noda, 1986). Since the concept of 2DCOS was expanded to the various spectroscopic applicationsin 1993 (Noda, 1993), the generalized 2DCOS has become a very powerful analytical technique inmany fields of spectroscopic studies, especially in polymer study.
The generalized 2DCOS can elucidate information in spectral variations, e.g., IR (Kim et al.,2006b; Cerdà-Costa et al., 2009; Huang et al., 2009; Unger et al., 2009, 2011; Del Río et al., 2010;Huang and Kuo, 2010; Jelèic et al., 2010; Jia et al., 2010; Lee et al., 2010, 2012; Peng et al., 2010;Popescu and Vasile, 2010, 2011; Zheng et al., 2010; Cheng et al., 2011; Jin et al., 2011; Kuo andLiu, 2011; Musto et al., 2011; Quaroni et al., 2011; Wang and Wu, 2011; Zhang et al., 2011;Ando et al., 2012; Qu et al., 2012; Su et al., 2012; Wu et al., 2012; Chai et al., 2013; Lai andWu, 2013; Park et al., 2013; Shinzawa et al., 2013; Wang et al., 2013, 2014; Galizia et al., 2014;Hou et al., 2014; Noda, 2014c; Seo et al., 2014), Raman (Radice et al., 2010; Tang et al., 2010; Maet al., 2011; Ji et al., 2012; Pazderka and Kopecký Jr, 2012; Brewster et al., 2013; Grzeszczuk et al.,2013; Noda, 2014d), terahertz (THz) (Hoshina et al., 2012, 2014), X-ray (Guo et al., 2011), UV-Vis (Hong et al., 2005; Jiang and Wu, 2008; Sikirzhytski et al., 2012; Zhong et al., 2012), NMR(Oh et al., 2009; Li et al., 2013), fluorescence (Hur et al., 2011; Zhang et al., 2013), and evenchromatography (Izawa et al., 2001), under various external perturbations, such as thermal, elec-trical, optical, magnetic, and chemical perturbations (Noda, 1986, 1993; Hong et al., 2005; Kimet al., 2006b; Jiang and Wu, 2008; Cerdà-Costa et al., 2009; Huang et al., 2009; Oh et al., 2009;Unger et al., 2009; Del Río et al., 2010; Huang and Kuo, 2010; Jelèic et al., 2010; Jia et al., 2010;Lee et al., 2010, 2012; Peng et al., 2010; Popescu and Vasile, 2010, 2011; Radice et al., 2010; Tanget al., 2010; Zheng et al., 2010; Zhang et al., 2011; Cheng et al., 2011; Guo et al., 2011; Jin et al.,2011; Kuo and Liu, 2011; Ma et al., 2011; Quaroni et al., 2011; Unger et al., 2011; Wang andWu, 2011; Ando et al., 2012; Hoshina et al., 2012, 2014; Ji et al., 2012; Pazderka and KopeckýJr, 2012; Qu et al., 2012; Sikirzhytski et al., 2012; Su et al., 2012; Wu et al., 2012; Zhong et al.,2012; Brewster et al., 2013; Chai et al., 2013; Grzeszczuk et al., 2013; Lai and Wu, 2013; Li et al.,2013; Park et al., 2013; Shinzawa et al., 2013; Wang et al., 2013, 2014; Hou et al., 2014; Noda,2014c,d; Seo et al., 2014). IR spectroscopy is the most common analytical probes used in 2DCOS
Park et al. 2DCOS in polymer study
(Kim et al., 2006b; Cerdà-Costa et al., 2009; Huang et al., 2009;Unger et al., 2009, 2011; Del Río et al., 2010; Huang and Kuo,2010; Jelèic et al., 2010; Jia et al., 2010; Lee et al., 2010, 2012; Penget al., 2010; Popescu and Vasile, 2010, 2011; Zheng et al., 2010;Cheng et al., 2011; Jin et al., 2011; Kuo and Liu, 2011; Mustoet al., 2011; Quaroni et al., 2011; Wang and Wu, 2011; Zhanget al., 2011; Ando et al., 2012; Qu et al., 2012; Su et al., 2012;Wu et al., 2012; Chai et al., 2013; Lai and Wu, 2013; Park et al.,2013; Shinzawa et al., 2013; Wang et al., 2013, 2014; Galizia et al.,2014; Hou et al., 2014; Noda, 2014c; Seo et al., 2014). The mostpopularly applied external perturbation in 2DCOS is temperature(Kim et al., 2006b; Unger et al., 2009, 2011; Jia et al., 2010; Penget al., 2010; Popescu and Vasile, 2010; Tang et al., 2010; Zhenget al., 2010; Cheng et al., 2011; Wang and Wu, 2011; Pazderkaand Kopecký Jr, 2012; Chai et al., 2013; Li et al., 2013;Wang et al.,2013, 2014; Hoshina et al., 2014; Hou et al., 2014; Seo et al., 2014).Applications of 2DCOS in investigations of intriguing proper-ties of polymer system measured by different types of analyticalprobes has been substantially increased (Izawa et al., 2001; Honget al., 2005; Kim et al., 2006b; Jiang and Wu, 2008; Huang et al.,2009; Oh et al., 2009; Unger et al., 2009, 2011; Del Río et al., 2010;Huang and Kuo, 2010; Jelèic et al., 2010; Jia et al., 2010; Lee et al.,2010, 2012; Peng et al., 2010; Popescu and Vasile, 2010, 2011;Radice et al., 2010; Tang et al., 2010; Zheng et al., 2010; Chenget al., 2011; Guo et al., 2011; Jin et al., 2011; Kuo and Liu, 2011;Maet al., 2011; Wang and Wu, 2011; Zhang et al., 2011; Ando et al.,2012; Hoshina et al., 2012, 2014; Qu et al., 2012; Su et al., 2012;Wu et al., 2012; Zhong et al., 2012; Chai et al., 2013; Grzeszczuket al., 2013; Lai and Wu, 2013; Park et al., 2013; Shinzawa et al.,2013; Wang et al., 2013, 2014; Hou et al., 2014; Noda, 2014c,d;Seo et al., 2014). Generalized 2D correlation spectra has notableadvantages: examination of inter- or intra-molecular interactionsand determination of the sequential order of events, which ishardly depicted in conventional spectroscopy.
In this review, the background of the generalized 2DCOS isbriefly discussed, and the powerful applications of 2DCOS inthe studies of polymers are presented. Illustrative examples of2DOCS in polymer research describing the improved informa-tion gained with noteworthy developments of 2DCOS are alsoprovided.
Background
Generalized 2D Correlation SpectroscopyThe detailed background of the generalized 2DCOS is well intro-duced in books and book chapters (Noda, 2002, 2009; Ozaki,2002; Noda and Ozaki, 2004; Ozaki and Šašic, 2005; Ozaki andNoda, 2006; Noda and Lindsey, 2010; Czarnik-Matusewicz andJung, 2014; Jung and Noda, 2014) and review articles (Noda et al.,1993, 2000; Noda, 2000, 2004, 2006, 2007, 2008, 2014a,b; Jungand Noda, 2014). Here, we briefly describe the basic concept of2DCOS.
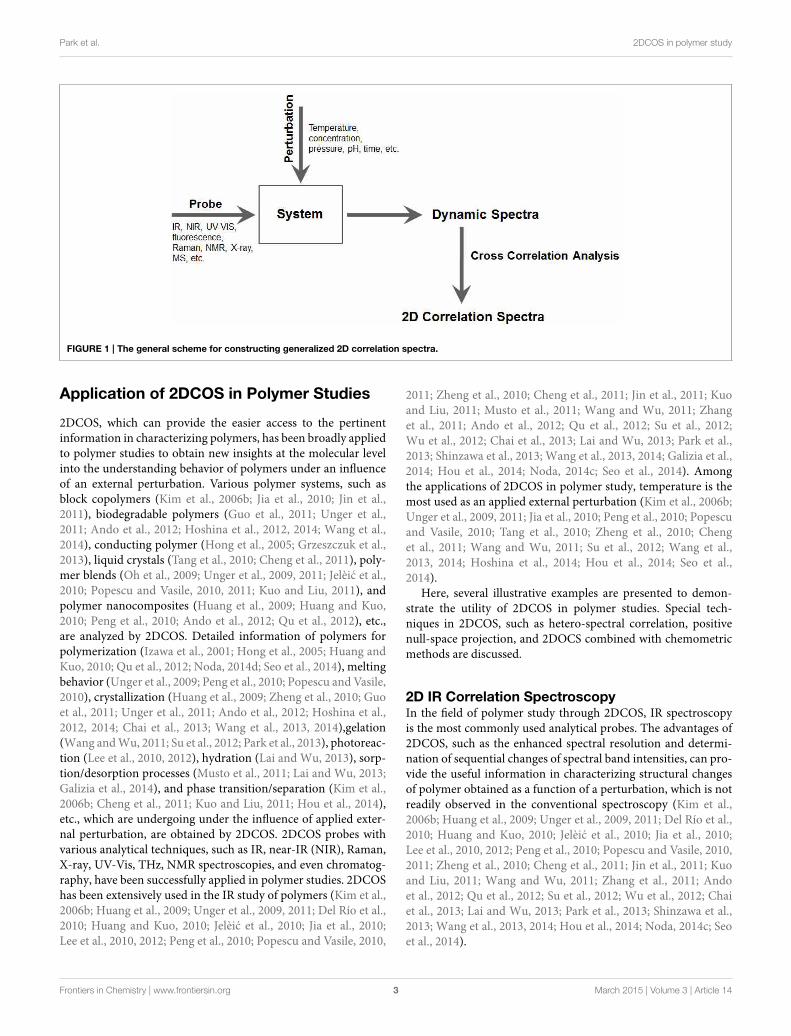
In 2DCOS, a set of spectra A(νj, ti) is obtained as a functionof the spectral variable νj with j = 1, 2, . . . n and some per-turbation variable ti with i = 1, 2, . . .m during a well-definedobservation interval between t1 and tm. A series of perturbation-induced dynamic spectra collected in a systematic manner are
transformed into a set of 2D correlation spectra by a simple crosscorrelation analysis as shown in Figure 1.
The dynamic spectrum A(
νj, ti)
of a system induced by theapplication of an external perturbation is defined formally withinthe observation interval between t1 and tm as
A(
νj, ti)
= A(
νj, ti)
− A(
vj)
(1)
whereA(
vj)
is the reference spectrum of the system. The referencespectrum is mostly selected as the stationary or averaged spectrumgiven by
A(
νj)
=1
m
m∑
i=1
A(
νj, ti)
(2)
Synchronous 8(ν1, ν2) and asynchronous 9(ν1, ν2) correlationspectra are given by
8(ν1, ν2)=1
m− 1
m∑
i= 1
A (ν1, ti) · A (ν2, ti) (3)
9(ν1, ν2)=1
m− 1
m∑
i= 1
A (ν1, ti) ·
m∑
k= 1
Nik A (ν2, tk) (4)
where,Nik is the elements of so-called Hilbert–Noda transforma-tion matrix given by
Nik =
{
0 if i = k1
π(k−i) otherwise(5)
2D Correlation SpectraThe simultaneous or coincidental changes of spectral intensi-ties at ν1 and ν2 are represented in the synchronous 2D corre-lation spectrum. Positive correlation peaks on the diagonal insynchronous 2D correlation spectrum correspond to the auto-correlation functions of spectral intensity variations, which arecalled autopeaks. Cross peaks, which are located at off-diagonalin synchronous 2D correlation spectrum, represent the coinci-dental or simultaneous changes of spectral intensities observed attwo different spectral variables. The positive cross peaks depictthat the intensities at corresponding spectral variables increaseor decrease together. On the other hand, the negative cross peaksdepict that one of the spectral intensities is increasing while theother is decreasing.
In contrast, the sequential, or unsynchronized, changesof spectral intensities at ν1 and ν2 are represented in theasynchronous 2D correlation spectrum. Asynchronous 2D corre-lation spectrum consists of only cross peaks, which shows an anti-symmetric cross peaks with respect to the main diagonal. Fromthe sign of cross peaks in 2D correlation spectra, the sequentialchanges in spectral intensities observed under the external per-turbation can be determined. The same signs of synchronous andasynchronous cross peaks represent that the intensity change atν1 occurs before ν2. While the different signs of synchronous andasynchronous cross peaks represent that the intensity change atν2 occurs before ν1. This rule to determine sequential order ofintensity variations is named Noda’s rule.
Frontiers in Chemistry | www.frontiersin.org 2 March 2015 | Volume 3 | Article 14
Park et al. 2DCOS in polymer study
FIGURE 1 | The general scheme for constructing generalized 2D correlation spectra.
Application of 2DCOS in Polymer Studies
2DCOS, which can provide the easier access to the pertinentinformation in characterizing polymers, has been broadly appliedto polymer studies to obtain new insights at the molecular levelinto the understanding behavior of polymers under an influenceof an external perturbation. Various polymer systems, such asblock copolymers (Kim et al., 2006b; Jia et al., 2010; Jin et al.,2011), biodegradable polymers (Guo et al., 2011; Unger et al.,2011; Ando et al., 2012; Hoshina et al., 2012, 2014; Wang et al.,2014), conducting polymer (Hong et al., 2005; Grzeszczuk et al.,2013), liquid crystals (Tang et al., 2010; Cheng et al., 2011), poly-mer blends (Oh et al., 2009; Unger et al., 2009, 2011; Jelèic et al.,2010; Popescu and Vasile, 2010, 2011; Kuo and Liu, 2011), andpolymer nanocomposites (Huang et al., 2009; Huang and Kuo,2010; Peng et al., 2010; Ando et al., 2012; Qu et al., 2012), etc.,are analyzed by 2DCOS. Detailed information of polymers forpolymerization (Izawa et al., 2001; Hong et al., 2005; Huang andKuo, 2010; Qu et al., 2012; Noda, 2014d; Seo et al., 2014), meltingbehavior (Unger et al., 2009; Peng et al., 2010; Popescu and Vasile,2010), crystallization (Huang et al., 2009; Zheng et al., 2010; Guoet al., 2011; Unger et al., 2011; Ando et al., 2012; Hoshina et al.,2012, 2014; Chai et al., 2013; Wang et al., 2013, 2014),gelation(Wang andWu, 2011; Su et al., 2012; Park et al., 2013), photoreac-tion (Lee et al., 2010, 2012), hydration (Lai and Wu, 2013), sorp-tion/desorption processes (Musto et al., 2011; Lai and Wu, 2013;Galizia et al., 2014), and phase transition/separation (Kim et al.,2006b; Cheng et al., 2011; Kuo and Liu, 2011; Hou et al., 2014),etc., which are undergoing under the influence of applied exter-nal perturbation, are obtained by 2DCOS. 2DCOS probes withvarious analytical techniques, such as IR, near-IR (NIR), Raman,X-ray, UV-Vis, THz, NMR spectroscopies, and even chromatog-raphy, have been successfully applied in polymer studies. 2DCOShas been extensively used in the IR study of polymers (Kim et al.,2006b; Huang et al., 2009; Unger et al., 2009, 2011; Del Río et al.,2010; Huang and Kuo, 2010; Jelèic et al., 2010; Jia et al., 2010;Lee et al., 2010, 2012; Peng et al., 2010; Popescu and Vasile, 2010,
2011; Zheng et al., 2010; Cheng et al., 2011; Jin et al., 2011; Kuoand Liu, 2011; Musto et al., 2011; Wang and Wu, 2011; Zhanget al., 2011; Ando et al., 2012; Qu et al., 2012; Su et al., 2012;Wu et al., 2012; Chai et al., 2013; Lai and Wu, 2013; Park et al.,2013; Shinzawa et al., 2013; Wang et al., 2013, 2014; Galizia et al.,2014; Hou et al., 2014; Noda, 2014c; Seo et al., 2014). Amongthe applications of 2DCOS in polymer study, temperature is themost used as an applied external perturbation (Kim et al., 2006b;Unger et al., 2009, 2011; Jia et al., 2010; Peng et al., 2010; Popescuand Vasile, 2010; Tang et al., 2010; Zheng et al., 2010; Chenget al., 2011; Wang and Wu, 2011; Su et al., 2012; Wang et al.,2013, 2014; Hoshina et al., 2014; Hou et al., 2014; Seo et al.,2014).
Here, several illustrative examples are presented to demon-strate the utility of 2DCOS in polymer studies. Special tech-niques in 2DCOS, such as hetero-spectral correlation, positivenull-space projection, and 2DOCS combined with chemometricmethods are discussed.
2D IR Correlation SpectroscopyIn the field of polymer study through 2DCOS, IR spectroscopyis the most commonly used analytical probes. The advantages of2DCOS, such as the enhanced spectral resolution and determi-nation of sequential changes of spectral band intensities, can pro-vide the useful information in characterizing structural changesof polymer obtained as a function of a perturbation, which is notreadily observed in the conventional spectroscopy (Kim et al.,2006b; Huang et al., 2009; Unger et al., 2009, 2011; Del Río et al.,2010; Huang and Kuo, 2010; Jelèic et al., 2010; Jia et al., 2010;Lee et al., 2010, 2012; Peng et al., 2010; Popescu and Vasile, 2010,2011; Zheng et al., 2010; Cheng et al., 2011; Jin et al., 2011; Kuoand Liu, 2011; Wang and Wu, 2011; Zhang et al., 2011; Andoet al., 2012; Qu et al., 2012; Su et al., 2012; Wu et al., 2012; Chaiet al., 2013; Lai and Wu, 2013; Park et al., 2013; Shinzawa et al.,2013; Wang et al., 2013, 2014; Hou et al., 2014; Noda, 2014c; Seoet al., 2014).
Frontiers in Chemistry | www.frontiersin.org 3 March 2015 | Volume 3 | Article 14
Park et al. 2DCOS in polymer study
Popular perturbations in polymer studies are temperature(Kim et al., 2006b; Unger et al., 2009, 2011; Jia et al., 2010; Penget al., 2010; Popescu and Vasile, 2010; Tang et al., 2010; Zhenget al., 2010; Cheng et al., 2011; Wang and Wu, 2011; Su et al.,2012; Wang et al., 2013, 2014; Hoshina et al., 2014; Hou et al.,2014; Seo et al., 2014), concentration (Huang et al., 2009; Jelèicet al., 2010; Kuo and Liu, 2011; Popescu and Vasile, 2011; Wuet al., 2012; Grzeszczuk et al., 2013), time (Huang and Kuo, 2010;Jin et al., 2011; Ando et al., 2012; Lee et al., 2012; Qu et al.,2012; Su et al., 2012; Lai and Wu, 2013; Park et al., 2013; Noda,2014c), and pressure (Zhang et al., 2011; Shinzawa et al., 2013),etc. Especially, temperature is the most commonly used becauseordinary changes in density, which give rise to nonspecific spec-tral changes, usually are accompanied by structural changes inpolymer upon heating or cooling.
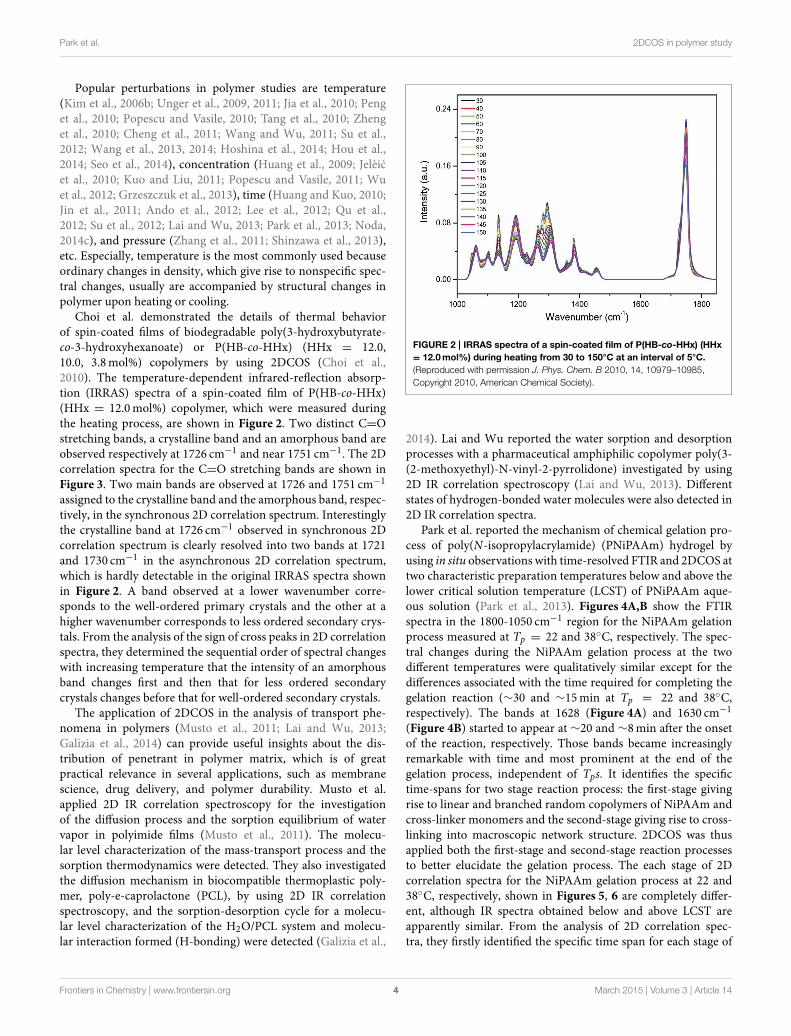
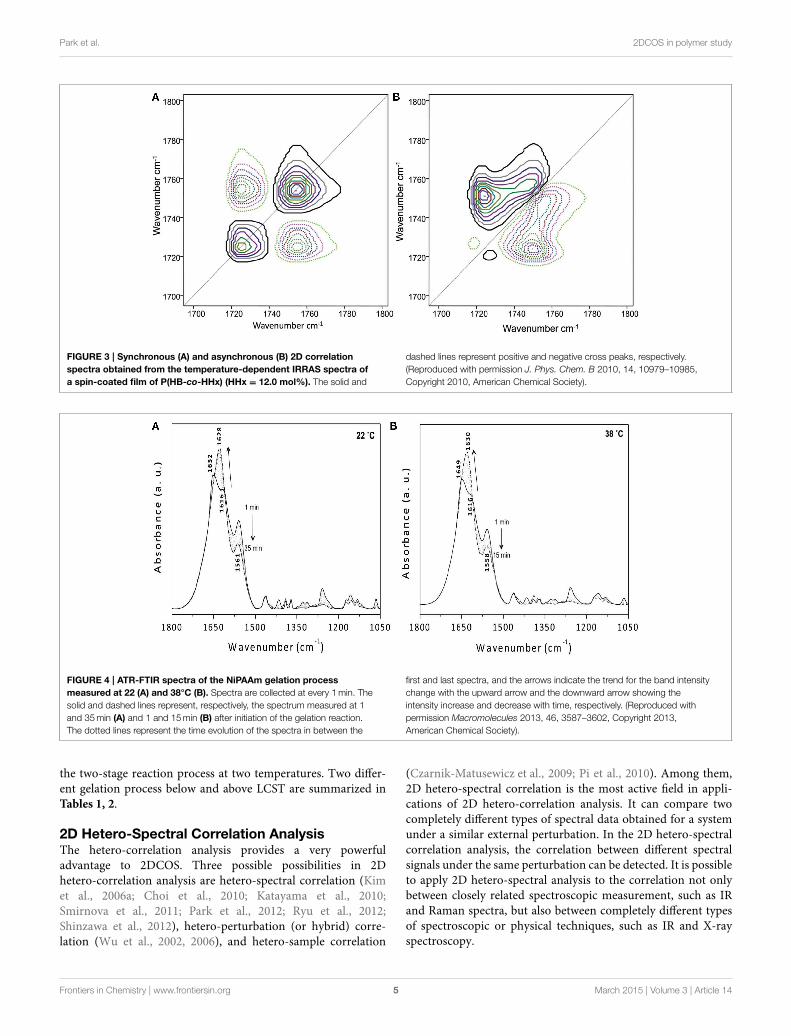
Choi et al. demonstrated the details of thermal behaviorof spin-coated films of biodegradable poly(3-hydroxybutyrate-co-3-hydroxyhexanoate) or P(HB-co-HHx) (HHx = 12.0,10.0, 3.8mol%) copolymers by using 2DCOS (Choi et al.,2010). The temperature-dependent infrared-reflection absorp-tion (IRRAS) spectra of a spin-coated film of P(HB-co-HHx)(HHx = 12.0mol%) copolymer, which were measured duringthe heating process, are shown in Figure 2. Two distinct C=Ostretching bands, a crystalline band and an amorphous band areobserved respectively at 1726 cm−1 and near 1751 cm−1. The 2Dcorrelation spectra for the C=O stretching bands are shown inFigure 3. Two main bands are observed at 1726 and 1751 cm−1
assigned to the crystalline band and the amorphous band, respec-tively, in the synchronous 2D correlation spectrum. Interestinglythe crystalline band at 1726 cm−1 observed in synchronous 2Dcorrelation spectrum is clearly resolved into two bands at 1721and 1730 cm−1 in the asynchronous 2D correlation spectrum,which is hardly detectable in the original IRRAS spectra shownin Figure 2. A band observed at a lower wavenumber corre-sponds to the well-ordered primary crystals and the other at ahigher wavenumber corresponds to less ordered secondary crys-tals. From the analysis of the sign of cross peaks in 2D correlationspectra, they determined the sequential order of spectral changeswith increasing temperature that the intensity of an amorphousband changes first and then that for less ordered secondarycrystals changes before that for well-ordered secondary crystals.
The application of 2DCOS in the analysis of transport phe-nomena in polymers (Musto et al., 2011; Lai and Wu, 2013;Galizia et al., 2014) can provide useful insights about the dis-tribution of penetrant in polymer matrix, which is of greatpractical relevance in several applications, such as membranescience, drug delivery, and polymer durability. Musto et al.applied 2D IR correlation spectroscopy for the investigationof the diffusion process and the sorption equilibrium of watervapor in polyimide films (Musto et al., 2011). The molecu-lar level characterization of the mass-transport process and thesorption thermodynamics were detected. They also investigatedthe diffusion mechanism in biocompatible thermoplastic poly-mer, poly-e-caprolactone (PCL), by using 2D IR correlationspectroscopy, and the sorption-desorption cycle for a molecu-lar level characterization of the H2O/PCL system and molecu-lar interaction formed (H-bonding) were detected (Galizia et al.,
FIGURE 2 | IRRAS spectra of a spin-coated film of P(HB-co-HHx) (HHx
= 12.0mol%) during heating from 30 to 150°C at an interval of 5°C.
(Reproduced with permission J. Phys. Chem. B 2010, 14, 10979–10985,
Copyright 2010, American Chemical Society).
2014). Lai and Wu reported the water sorption and desorptionprocesses with a pharmaceutical amphiphilic copolymer poly(3-(2-methoxyethyl)-N-vinyl-2-pyrrolidone) investigated by using2D IR correlation spectroscopy (Lai and Wu, 2013). Differentstates of hydrogen-bonded water molecules were also detected in2D IR correlation spectra.
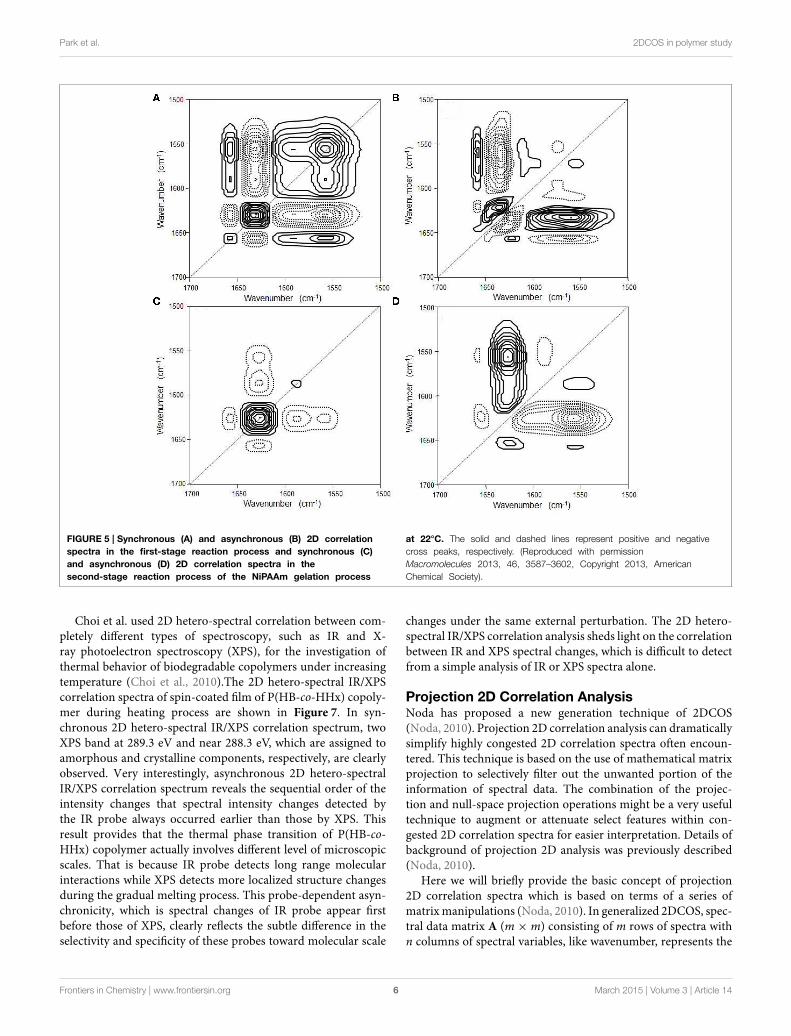
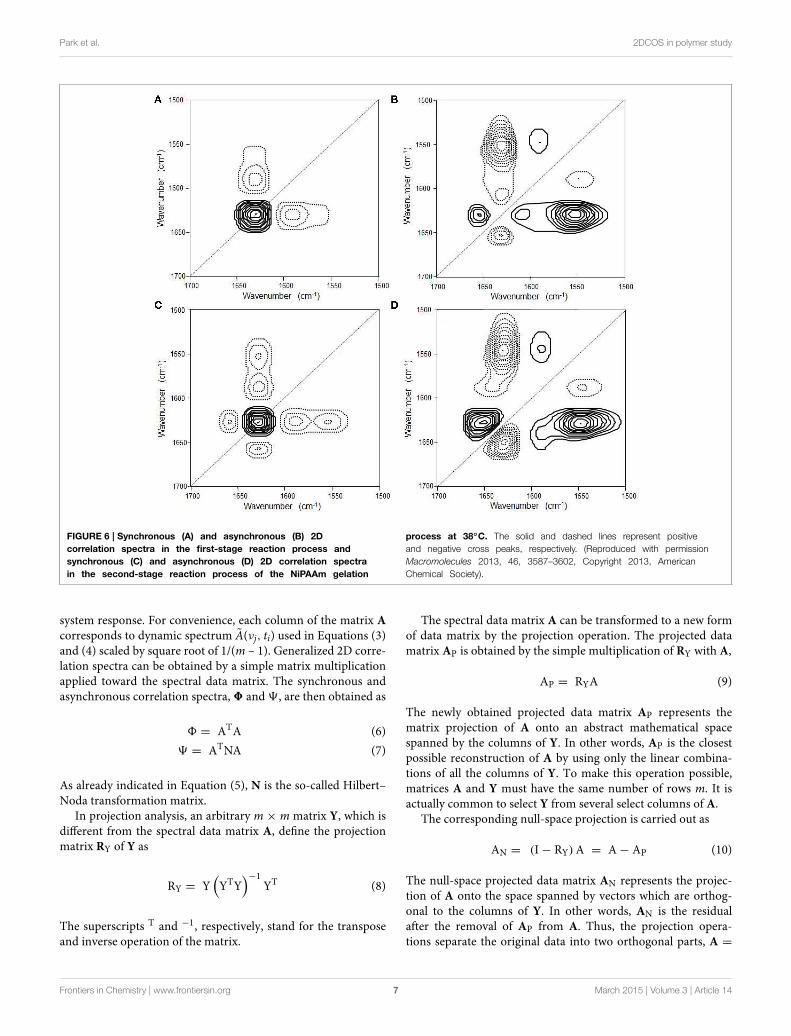
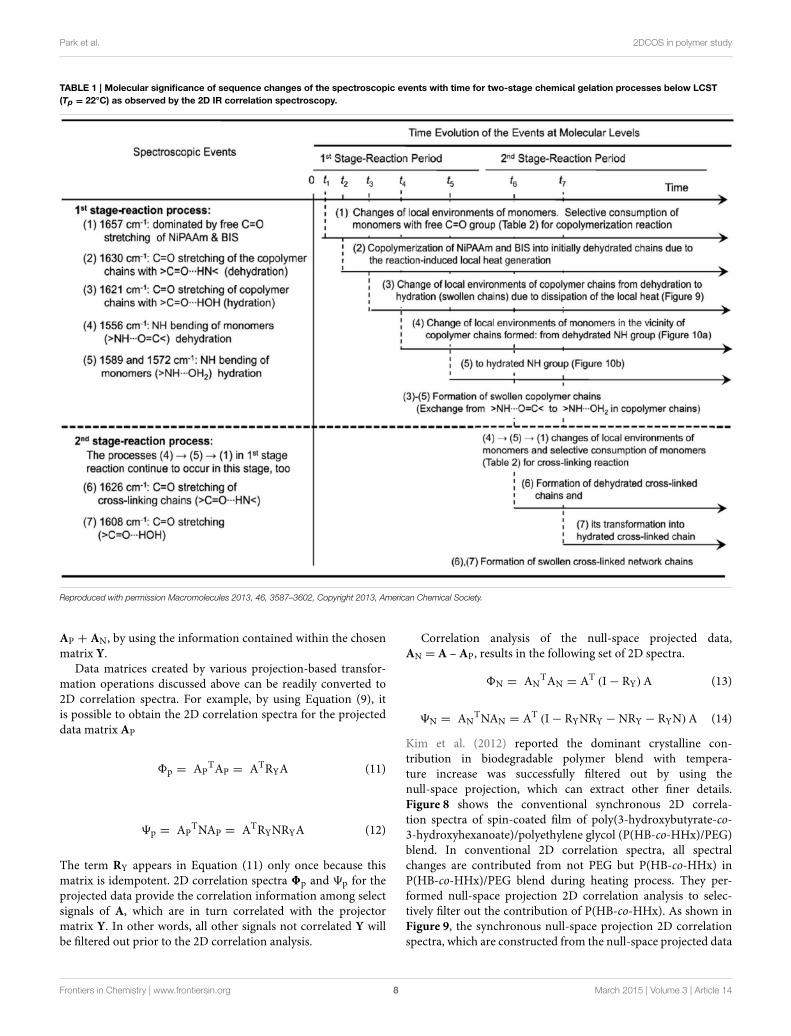
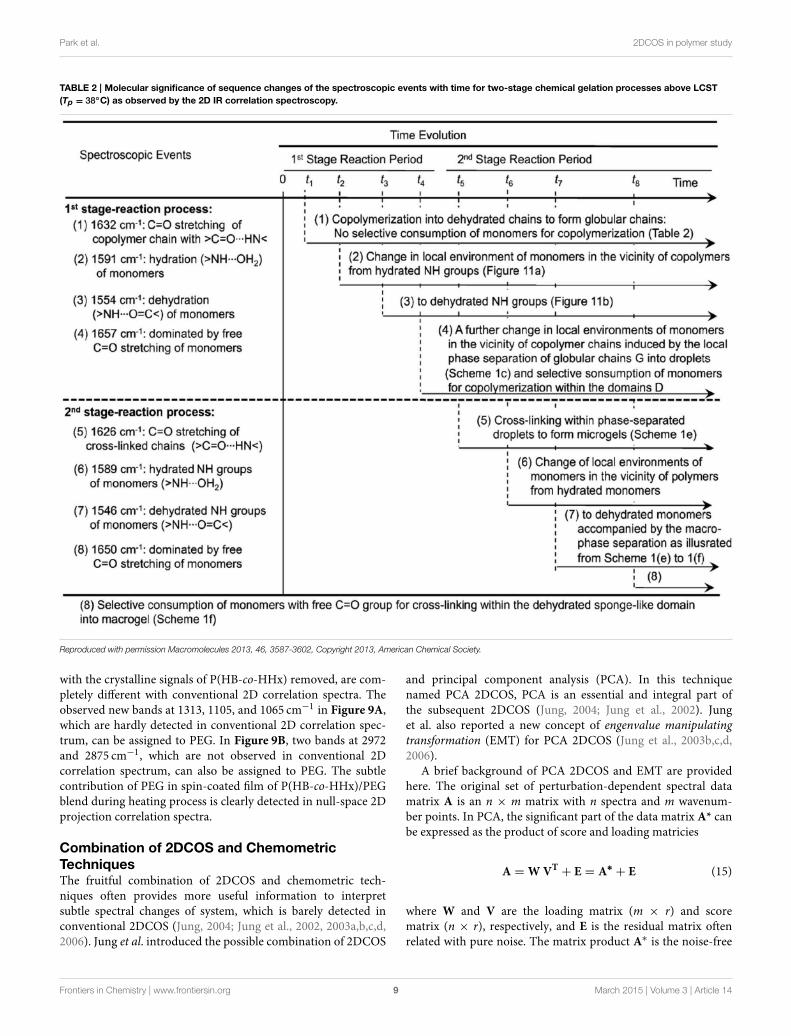
Park et al. reported the mechanism of chemical gelation pro-cess of poly(N-isopropylacrylamide) (PNiPAAm) hydrogel byusing in situ observations with time-resolved FTIR and 2DCOS attwo characteristic preparation temperatures below and above thelower critical solution temperature (LCST) of PNiPAAm aque-ous solution (Park et al., 2013). Figures 4A,B show the FTIRspectra in the 1800-1050 cm−1 region for the NiPAAm gelationprocess measured at Tp = 22 and 38◦C, respectively. The spec-tral changes during the NiPAAm gelation process at the twodifferent temperatures were qualitatively similar except for thedifferences associated with the time required for completing thegelation reaction (∼30 and ∼15min at Tp = 22 and 38◦C,respectively). The bands at 1628 (Figure 4A) and 1630 cm−1
(Figure 4B) started to appear at ∼20 and ∼8min after the onsetof the reaction, respectively. Those bands became increasinglyremarkable with time and most prominent at the end of thegelation process, independent of Tps. It identifies the specifictime-spans for two stage reaction process: the first-stage givingrise to linear and branched random copolymers of NiPAAm andcross-linker monomers and the second-stage giving rise to cross-linking into macroscopic network structure. 2DCOS was thusapplied both the first-stage and second-stage reaction processesto better elucidate the gelation process. The each stage of 2Dcorrelation spectra for the NiPAAm gelation process at 22 and38◦C, respectively, shown in Figures 5, 6 are completely differ-ent, although IR spectra obtained below and above LCST areapparently similar. From the analysis of 2D correlation spec-tra, they firstly identified the specific time span for each stage of
Frontiers in Chemistry | www.frontiersin.org 4 March 2015 | Volume 3 | Article 14
Park et al. 2DCOS in polymer study
FIGURE 3 | Synchronous (A) and asynchronous (B) 2D correlation
spectra obtained from the temperature-dependent IRRAS spectra of
a spin-coated film of P(HB-co-HHx) (HHx = 12.0 mol%). The solid and
dashed lines represent positive and negative cross peaks, respectively.
(Reproduced with permission J. Phys. Chem. B 2010, 14, 10979–10985,
Copyright 2010, American Chemical Society).
FIGURE 4 | ATR-FTIR spectra of the NiPAAm gelation process
measured at 22 (A) and 38°C (B). Spectra are collected at every 1min. The
solid and dashed lines represent, respectively, the spectrum measured at 1
and 35min (A) and 1 and 15min (B) after initiation of the gelation reaction.
The dotted lines represent the time evolution of the spectra in between the
first and last spectra, and the arrows indicate the trend for the band intensity
change with the upward arrow and the downward arrow showing the
intensity increase and decrease with time, respectively. (Reproduced with
permission Macromolecules 2013, 46, 3587–3602, Copyright 2013,
American Chemical Society).
the two-stage reaction process at two temperatures. Two differ-ent gelation process below and above LCST are summarized inTables 1, 2.
2D Hetero-Spectral Correlation AnalysisThe hetero-correlation analysis provides a very powerfuladvantage to 2DCOS. Three possible possibilities in 2Dhetero-correlation analysis are hetero-spectral correlation (Kimet al., 2006a; Choi et al., 2010; Katayama et al., 2010;Smirnova et al., 2011; Park et al., 2012; Ryu et al., 2012;Shinzawa et al., 2012), hetero-perturbation (or hybrid) corre-lation (Wu et al., 2002, 2006), and hetero-sample correlation
(Czarnik-Matusewicz et al., 2009; Pi et al., 2010). Among them,2D hetero-spectral correlation is the most active field in appli-cations of 2D hetero-correlation analysis. It can compare twocompletely different types of spectral data obtained for a systemunder a similar external perturbation. In the 2D hetero-spectralcorrelation analysis, the correlation between different spectralsignals under the same perturbation can be detected. It is possibleto apply 2D hetero-spectral analysis to the correlation not onlybetween closely related spectroscopic measurement, such as IRand Raman spectra, but also between completely different typesof spectroscopic or physical techniques, such as IR and X-rayspectroscopy.
Frontiers in Chemistry | www.frontiersin.org 5 March 2015 | Volume 3 | Article 14
Park et al. 2DCOS in polymer study
FIGURE 5 | Synchronous (A) and asynchronous (B) 2D correlation
spectra in the first-stage reaction process and synchronous (C)
and asynchronous (D) 2D correlation spectra in the
second-stage reaction process of the NiPAAm gelation process
at 22°C. The solid and dashed lines represent positive and negative
cross peaks, respectively. (Reproduced with permission
Macromolecules 2013, 46, 3587–3602, Copyright 2013, American
Chemical Society).
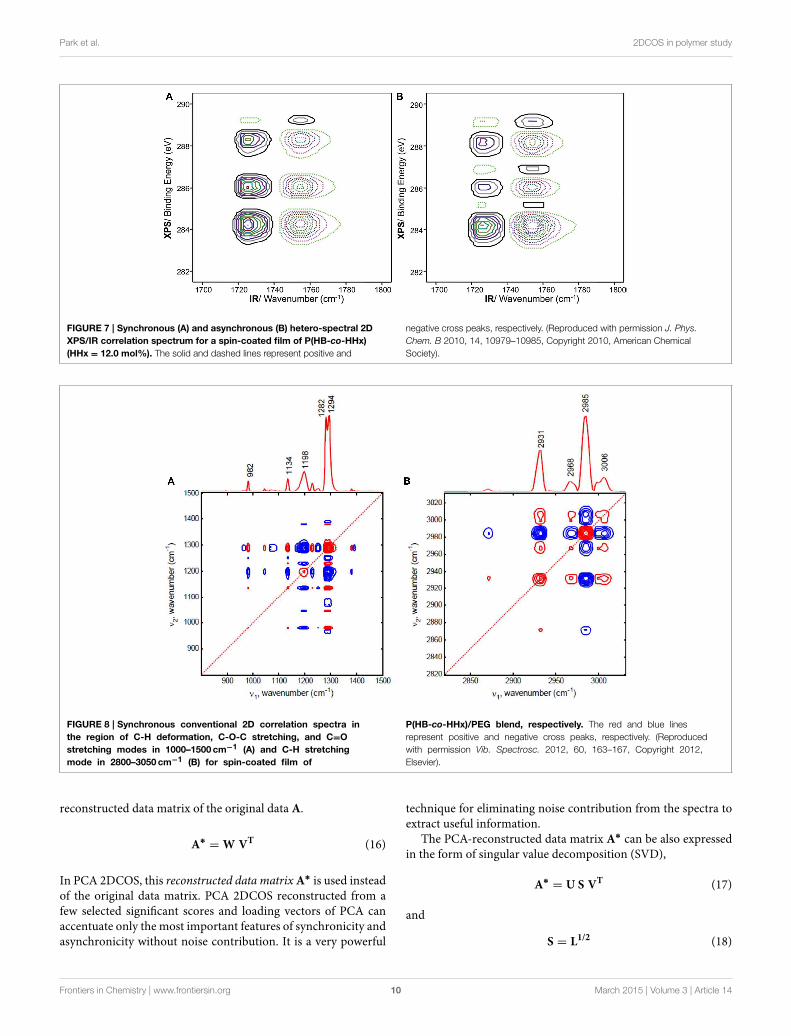
Choi et al. used 2D hetero-spectral correlation between com-pletely different types of spectroscopy, such as IR and X-ray photoelectron spectroscopy (XPS), for the investigation ofthermal behavior of biodegradable copolymers under increasingtemperature (Choi et al., 2010).The 2D hetero-spectral IR/XPScorrelation spectra of spin-coated film of P(HB-co-HHx) copoly-mer during heating process are shown in Figure 7. In syn-chronous 2D hetero-spectral IR/XPS correlation spectrum, twoXPS band at 289.3 eV and near 288.3 eV, which are assigned toamorphous and crystalline components, respectively, are clearlyobserved. Very interestingly, asynchronous 2D hetero-spectralIR/XPS correlation spectrum reveals the sequential order of theintensity changes that spectral intensity changes detected bythe IR probe always occurred earlier than those by XPS. Thisresult provides that the thermal phase transition of P(HB-co-HHx) copolymer actually involves different level of microscopicscales. That is because IR probe detects long range molecularinteractions while XPS detects more localized structure changesduring the gradual melting process. This probe-dependent asyn-chronicity, which is spectral changes of IR probe appear firstbefore those of XPS, clearly reflects the subtle difference in theselectivity and specificity of these probes toward molecular scale
changes under the same external perturbation. The 2D hetero-spectral IR/XPS correlation analysis sheds light on the correlationbetween IR and XPS spectral changes, which is difficult to detectfrom a simple analysis of IR or XPS spectra alone.
Projection 2D Correlation AnalysisNoda has proposed a new generation technique of 2DCOS(Noda, 2010). Projection 2D correlation analysis can dramaticallysimplify highly congested 2D correlation spectra often encoun-tered. This technique is based on the use of mathematical matrixprojection to selectively filter out the unwanted portion of theinformation of spectral data. The combination of the projec-tion and null-space projection operations might be a very usefultechnique to augment or attenuate select features within con-gested 2D correlation spectra for easier interpretation. Details ofbackground of projection 2D analysis was previously described(Noda, 2010).
Here we will briefly provide the basic concept of projection2D correlation spectra which is based on terms of a series ofmatrixmanipulations (Noda, 2010). In generalized 2DCOS, spec-tral data matrix A (m × m) consisting of m rows of spectra withn columns of spectral variables, like wavenumber, represents the
Frontiers in Chemistry | www.frontiersin.org 6 March 2015 | Volume 3 | Article 14
Park et al. 2DCOS in polymer study
FIGURE 6 | Synchronous (A) and asynchronous (B) 2D
correlation spectra in the first-stage reaction process and
synchronous (C) and asynchronous (D) 2D correlation spectra
in the second-stage reaction process of the NiPAAm gelation
process at 38◦C. The solid and dashed lines represent positive
and negative cross peaks, respectively. (Reproduced with permission
Macromolecules 2013, 46, 3587–3602, Copyright 2013, American
Chemical Society).
system response. For convenience, each column of the matrix Acorresponds to dynamic spectrum A(νj, ti) used in Equations (3)and (4) scaled by square root of 1/(m – 1). Generalized 2D corre-lation spectra can be obtained by a simple matrix multiplicationapplied toward the spectral data matrix. The synchronous andasynchronous correlation spectra, 8 and 9 , are then obtained as
8 = ATA (6)
9 = ATNA (7)
As already indicated in Equation (5), N is the so-called Hilbert–Noda transformation matrix.
In projection analysis, an arbitrary m × m matrix Y, which isdifferent from the spectral data matrix A, define the projectionmatrix RY of Y as
RY = Y(
YTY)−1
YT (8)
The superscripts T and −1, respectively, stand for the transposeand inverse operation of the matrix.
The spectral data matrix A can be transformed to a new formof data matrix by the projection operation. The projected datamatrix AP is obtained by the simple multiplication of RY with A,
AP = RYA (9)
The newly obtained projected data matrix AP represents thematrix projection of A onto an abstract mathematical spacespanned by the columns of Y. In other words, AP is the closestpossible reconstruction of A by using only the linear combina-tions of all the columns of Y. To make this operation possible,matrices A and Y must have the same number of rows m. It isactually common to select Y from several select columns of A.
The corresponding null-space projection is carried out as
AN = (I− RY)A = A− AP (10)
The null-space projected data matrix AN represents the projec-tion of A onto the space spanned by vectors which are orthog-onal to the columns of Y. In other words, AN is the residualafter the removal of AP from A. Thus, the projection opera-tions separate the original data into two orthogonal parts, A =
Frontiers in Chemistry | www.frontiersin.org 7 March 2015 | Volume 3 | Article 14
Park et al. 2DCOS in polymer study
TABLE 1 | Molecular significance of sequence changes of the spectroscopic events with time for two-stage chemical gelation processes below LCST
(Tp = 22°C) as observed by the 2D IR correlation spectroscopy.
Reproduced with permission Macromolecules 2013, 46, 3587–3602, Copyright 2013, American Chemical Society.
AP + AN, by using the information contained within the chosenmatrix Y.
Data matrices created by various projection-based transfor-mation operations discussed above can be readily converted to2D correlation spectra. For example, by using Equation (9), itis possible to obtain the 2D correlation spectra for the projecteddata matrix AP
8p = APTAP = ATRYA (11)
9p = APTNAP = ATRYNRYA (12)
The term RY appears in Equation (11) only once because thismatrix is idempotent. 2D correlation spectra 8p and 9p for theprojected data provide the correlation information among selectsignals of A, which are in turn correlated with the projectormatrix Y. In other words, all other signals not correlated Y willbe filtered out prior to the 2D correlation analysis.
Correlation analysis of the null-space projected data,AN = A – AP, results in the following set of 2D spectra.
8N = ANTAN = AT (I− RY)A (13)
9N = ANTNAN = AT (I− RYNRY −NRY − RYN)A (14)
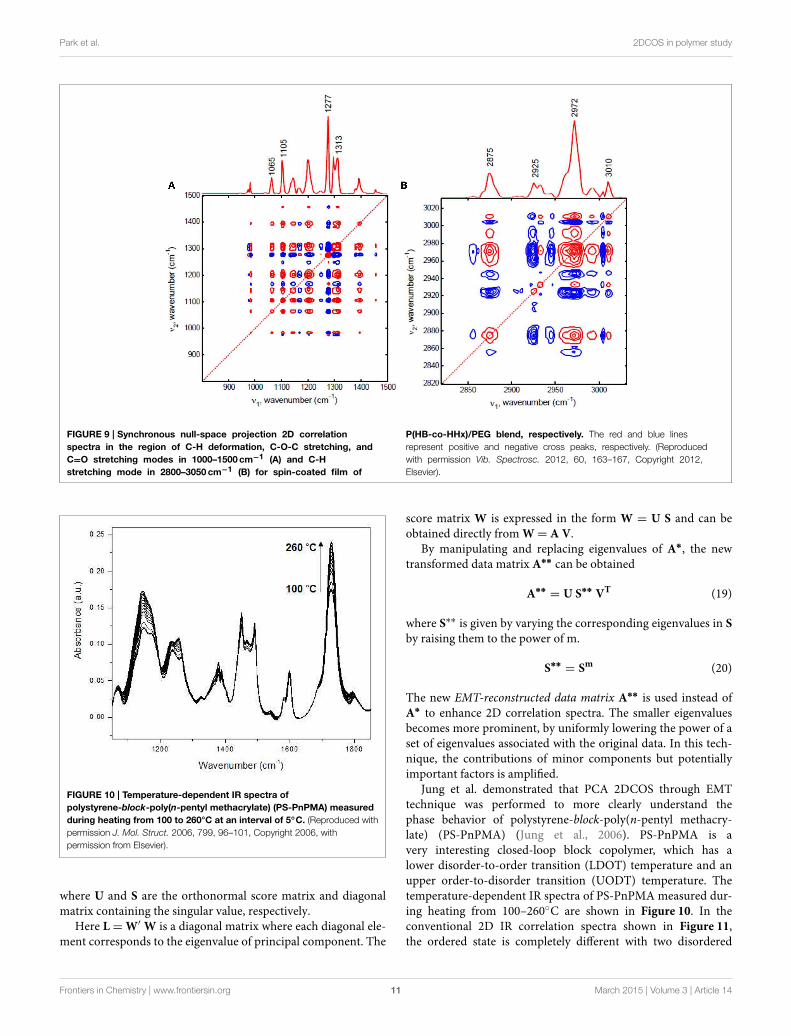
Kim et al. (2012) reported the dominant crystalline con-tribution in biodegradable polymer blend with tempera-ture increase was successfully filtered out by using thenull-space projection, which can extract other finer details.Figure 8 shows the conventional synchronous 2D correla-tion spectra of spin-coated film of poly(3-hydroxybutyrate-co-3-hydroxyhexanoate)/polyethylene glycol (P(HB-co-HHx)/PEG)blend. In conventional 2D correlation spectra, all spectralchanges are contributed from not PEG but P(HB-co-HHx) inP(HB-co-HHx)/PEG blend during heating process. They per-formed null-space projection 2D correlation analysis to selec-tively filter out the contribution of P(HB-co-HHx). As shown inFigure 9, the synchronous null-space projection 2D correlationspectra, which are constructed from the null-space projected data
Frontiers in Chemistry | www.frontiersin.org 8 March 2015 | Volume 3 | Article 14
Park et al. 2DCOS in polymer study
TABLE 2 | Molecular significance of sequence changes of the spectroscopic events with time for two-stage chemical gelation processes above LCST
(Tp = 38◦C) as observed by the 2D IR correlation spectroscopy.
Reproduced with permission Macromolecules 2013, 46, 3587-3602, Copyright 2013, American Chemical Society.
with the crystalline signals of P(HB-co-HHx) removed, are com-pletely different with conventional 2D correlation spectra. Theobserved new bands at 1313, 1105, and 1065 cm−1 in Figure 9A,which are hardly detected in conventional 2D correlation spec-trum, can be assigned to PEG. In Figure 9B, two bands at 2972and 2875 cm−1, which are not observed in conventional 2Dcorrelation spectrum, can also be assigned to PEG. The subtlecontribution of PEG in spin-coated film of P(HB-co-HHx)/PEGblend during heating process is clearly detected in null-space 2Dprojection correlation spectra.
Combination of 2DCOS and ChemometricTechniquesThe fruitful combination of 2DCOS and chemometric tech-niques often provides more useful information to interpretsubtle spectral changes of system, which is barely detected inconventional 2DCOS (Jung, 2004; Jung et al., 2002, 2003a,b,c,d,2006). Jung et al. introduced the possible combination of 2DCOS
and principal component analysis (PCA). In this techniquenamed PCA 2DCOS, PCA is an essential and integral part ofthe subsequent 2DCOS (Jung, 2004; Jung et al., 2002). Junget al. also reported a new concept of engenvalue manipulatingtransformation (EMT) for PCA 2DCOS (Jung et al., 2003b,c,d,2006).
A brief background of PCA 2DCOS and EMT are providedhere. The original set of perturbation-dependent spectral datamatrix A is an n × m matrix with n spectra and m wavenum-ber points. In PCA, the significant part of the data matrix A* canbe expressed as the product of score and loading matricies
A = WVT+ E = A∗
+ E (15)
where W and V are the loading matrix (m × r) and scorematrix (n × r), respectively, and E is the residual matrix oftenrelated with pure noise. The matrix product A∗ is the noise-free
Frontiers in Chemistry | www.frontiersin.org 9 March 2015 | Volume 3 | Article 14
Park et al. 2DCOS in polymer study
FIGURE 7 | Synchronous (A) and asynchronous (B) hetero-spectral 2D
XPS/IR correlation spectrum for a spin-coated film of P(HB-co-HHx)
(HHx = 12.0 mol%). The solid and dashed lines represent positive and
negative cross peaks, respectively. (Reproduced with permission J. Phys.
Chem. B 2010, 14, 10979–10985, Copyright 2010, American Chemical
Society).
FIGURE 8 | Synchronous conventional 2D correlation spectra in
the region of C-H deformation, C-O-C stretching, and C=O
stretching modes in 1000–1500cm−1 (A) and C-H stretching
mode in 2800–3050cm−1 (B) for spin-coated film of
P(HB-co-HHx)/PEG blend, respectively. The red and blue lines
represent positive and negative cross peaks, respectively. (Reproduced
with permission Vib. Spectrosc. 2012, 60, 163–167, Copyright 2012,
Elsevier).
reconstructed data matrix of the original data A.
A∗= W VT (16)
In PCA 2DCOS, this reconstructed data matrixA∗ is used insteadof the original data matrix. PCA 2DCOS reconstructed from afew selected significant scores and loading vectors of PCA canaccentuate only the most important features of synchronicity andasynchronicity without noise contribution. It is a very powerful
technique for eliminating noise contribution from the spectra toextract useful information.
The PCA-reconstructed data matrix A∗ can be also expressedin the form of singular value decomposition (SVD),
A∗= U S VT (17)
and
S = L1/2 (18)
Frontiers in Chemistry | www.frontiersin.org 10 March 2015 | Volume 3 | Article 14
Park et al. 2DCOS in polymer study
FIGURE 9 | Synchronous null-space projection 2D correlation
spectra in the region of C-H deformation, C-O-C stretching, and
C=O stretching modes in 1000–1500cm−1 (A) and C-H
stretching mode in 2800–3050cm−1 (B) for spin-coated film of
P(HB-co-HHx)/PEG blend, respectively. The red and blue lines
represent positive and negative cross peaks, respectively. (Reproduced
with permission Vib. Spectrosc. 2012, 60, 163–167, Copyright 2012,
Elsevier).
FIGURE 10 | Temperature-dependent IR spectra of
polystyrene-block-poly(n-pentyl methacrylate) (PS-PnPMA) measured
during heating from 100 to 260°C at an interval of 5◦C. (Reproduced with
permission J. Mol. Struct. 2006, 799, 96–101, Copyright 2006, with
permission from Elsevier).
where U and S are the orthonormal score matrix and diagonalmatrix containing the singular value, respectively.
Here L =W′ W is a diagonal matrix where each diagonal ele-ment corresponds to the eigenvalue of principal component. The
score matrix W is expressed in the form W = U S and can beobtained directly fromW= A V.
By manipulating and replacing eigenvalues of A∗, the newtransformed data matrix A∗∗ can be obtained
A∗∗= U S∗∗ VT (19)
where S∗∗ is given by varying the corresponding eigenvalues in S
by raising them to the power of m.
S∗∗= Sm (20)
The new EMT-reconstructed data matrix A∗∗ is used instead ofA∗ to enhance 2D correlation spectra. The smaller eigenvaluesbecomes more prominent, by uniformly lowering the power of aset of eigenvalues associated with the original data. In this tech-nique, the contributions of minor components but potentiallyimportant factors is amplified.
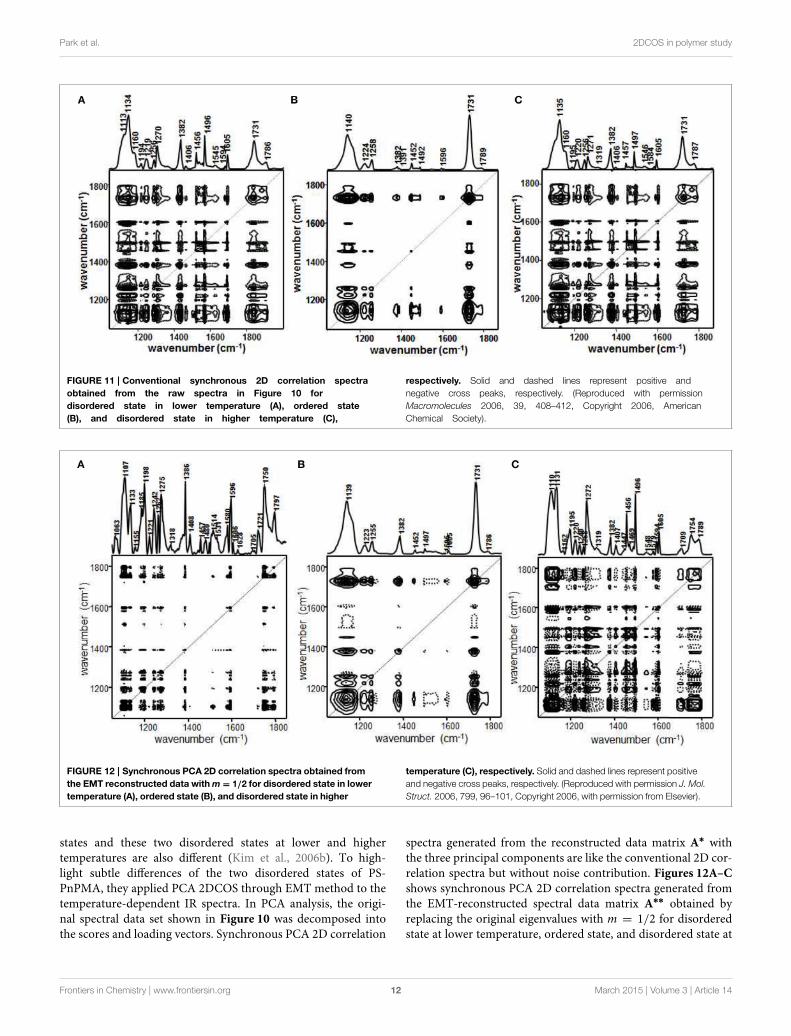
Jung et al. demonstrated that PCA 2DCOS through EMTtechnique was performed to more clearly understand thephase behavior of polystyrene-block-poly(n-pentyl methacry-late) (PS-PnPMA) (Jung et al., 2006). PS-PnPMA is avery interesting closed-loop block copolymer, which has alower disorder-to-order transition (LDOT) temperature and anupper order-to-disorder transition (UODT) temperature. Thetemperature-dependent IR spectra of PS-PnPMA measured dur-ing heating from 100–260◦C are shown in Figure 10. In theconventional 2D IR correlation spectra shown in Figure 11,the ordered state is completely different with two disordered
Frontiers in Chemistry | www.frontiersin.org 11 March 2015 | Volume 3 | Article 14
Park et al. 2DCOS in polymer study
FIGURE 11 | Conventional synchronous 2D correlation spectra
obtained from the raw spectra in Figure 10 for
disordered state in lower temperature (A), ordered state
(B), and disordered state in higher temperature (C),
respectively. Solid and dashed lines represent positive and
negative cross peaks, respectively. (Reproduced with permission
Macromolecules 2006, 39, 408–412, Copyright 2006, American
Chemical Society).
FIGURE 12 | Synchronous PCA 2D correlation spectra obtained from
the EMT reconstructed data withm = 1/2 for disordered state in lower
temperature (A), ordered state (B), and disordered state in higher
temperature (C), respectively. Solid and dashed lines represent positive
and negative cross peaks, respectively. (Reproduced with permission J. Mol.
Struct. 2006, 799, 96–101, Copyright 2006, with permission from Elsevier).
states and these two disordered states at lower and highertemperatures are also different (Kim et al., 2006b). To high-light subtle differences of the two disordered states of PS-PnPMA, they applied PCA 2DCOS through EMT method to thetemperature-dependent IR spectra. In PCA analysis, the origi-nal spectral data set shown in Figure 10 was decomposed intothe scores and loading vectors. Synchronous PCA 2D correlation
spectra generated from the reconstructed data matrix A∗ withthe three principal components are like the conventional 2D cor-relation spectra but without noise contribution. Figures 12A–Cshows synchronous PCA 2D correlation spectra generated fromthe EMT-reconstructed spectral data matrix A∗∗ obtained byreplacing the original eigenvalues with m = 1/2 for disorderedstate at lower temperature, ordered state, and disordered state at
Frontiers in Chemistry | www.frontiersin.org 12 March 2015 | Volume 3 | Article 14
Park et al. 2DCOS in polymer study
higher temperature, respectively. By lowering the power of a setof eigenvalues associated with the original data, hidden propertyof phase transition from the contribution ofminor but potentiallyinteresting is much more greatly accentuated than conventional2D correlation spectra. As shown in Figure 12, synchronousspectrum generated from the EMT-reconstructed spectral datamatrix of the ordered state is completely different from thosein the two disordered states and the clear difference betweentwo disordered states is also observed. In the power spectrum,extracted along the diagonal line of the synchronous 2D correla-tion spectrum, in the top of Figures 12A,C, intensities of bandsfrom C-C-O stretching, C-H deformation, and C=O stretchingof PnPMA change greatly at lower temperature while those fromphenyl group in PS change greatly at higher temperature. Thedistinct difference in two disordered states in the cross correla-tions of the bands from phenyl group in PS with that fromC-C-Ogroup in PnPMA reveals that the conformation of PS-PnPMAand the weak interaction between phenyl group of PS and theside chain of PnPMA in the two disordered states are different.The EMT technique clearly distinguish the very subtle differencesof spectra which are not observed in conventional 2D correlationspectra.
Jung et al. also demonstrated the use of 2DCOS in con-junction with alternating least squares (ALS) based self-modeling curve resolution (SMCR) analysis of spectral datasets (Jung et al., 2003a). In this iterative regression tech-nique, asynchronous 2D correlation peaks for the identifica-tion of pure variables were used as the initial estimates inthe ALS process. Choosing the most distinct bands via thepositions of asynchronous 2D peaks is a viable starting pointfor ALS iteration (Jung et al., 2003a; Hong et al., 2005).Once the pure variables are selected, ALS regression can be
used to obtain the concentration profiles and pure componentspectra.
Hong et al. studied the electrochemical polymerization ofaniline by using real-time spectroelectrochemical experimentsconducted concurrently with potentiodynamic scans (Honget al., 2005). They performed 2DCOS and subsequent extractionof pure component spectra as well as their relative concentrationprofiles from complex spectroelectrochemical data employingthe ALS-based SMCR method. All of the spectra of intermediatespecies proposed in the literature are identified. The concentra-tions of intermediate species varying as a function of the scannedpotential are also determined. It was the first complete analysisof the complex spectra of aniline oxidation, which provides fullunderstanding of the aniline polymerization reaction.
Summary
2DCOS has become a very popular tool in the field of poly-mer study. It can be utilized with a number of spectroscopicand other analytical probes for a very broad range of polymersystems by employing different types of external perturbationsto induce spectral variations. This review covers the basic con-cept of generalized 2DCOS and noteworthy progress in 2DCOSand their applications in polymer study. New developments in2DCOS provide a powerful analytical technique applicable tothe in-depth analysis of various spectral data. Active and steadyprogress in 2DCOS would open a way for studying polymers inmany applications.
Acknowledgments
This work was supported by Kangwon National University.
References
Ando, Y., Sato, H., Shinzawa, H., Okamoto, M., Noda, I., and Ozaki, Y. (2012).Isothermal melt crystallization behavior of neat poly(l-lactide) (PLLA) andPLLA/organically modified layered silicate (OMLS) nanocomposite studied bytwo-dimensional (2D) correlation spectroscopy. Vibrat. Spec. 60, 158–162. doi:10.1016/j.vibspec.2012.01.021
Brewster, V. L., Ashton, L., and Goodacre, R. (2013). Monitoring guanidinium-induced structural changes in ribonuclease proteins using raman spec-troscopy and 2D correlation analysis. Anal. Chem. 85, 3570–3575. doi:10.1021/ac303265q
Cerdà-Costa, N., De La Arada, I., Avilés, F. X., Arrondo, J. L. R., and Vil-legas, S. (2009). Influence of aggregation propensity and stability on amy-loid fibril formation as studied by fourier transform infrared spectroscopyand two-dimensional COS analysis. Biochemistry 48, 10582–10590. doi:10.1021/bi900960s
Chai, F., Chen, Y., You, Z., Xia, Z., Ge, S., Sun, Y., et al. (2013).Two Keggin-type heteropolytungstates with transition metal as a cen-tral atom: crystal structure and magnetic study with 2D-IR correlationspectroscopy. J. Solid State Chem. 202, 161–167. doi: 10.1016/j.jssc.2013.03.051
Cheng, Y.-H., Chen, W.-P., Shen, Z., Fan, X.-H., Zhu, M.-F., and Zhou, Q.-F. (2011). Influences of hydrogen bonding and peripheral chain lengthon mesophase structures of mesogen-jacketed liquid crystalline poly-mers with amide side-chain linkages. Macromolecules 44, 1429–1437. doi:10.1021/ma102444t
Choi, H. C., Ryu, S. R., Ji, H., Kim, S. B., Noda, I., and Jung, Y. M. (2010).Two-dimensional heterospectral correlation analysis of X-ray photoelectronspectra and infrared spectra for spin-coated films of biodegradable Poly(3-hydroxybutyrate-co-3-hydroxyhexanoate) copolymers. J. Phys. Chem. B 114,10979–10985. doi: 10.1021/jp103288x
Czarnik-Matusewicz, B., and Jung, Y. M. (2014). “Two-Dimensional Mid-InfraredCorrelation Spectroscopy in Protein Research,” in Optical Spectroscopy and
Computational Methods in Biology and Medicine, ed M. Baranska (Berlin:Springer), 213–250.
Czarnik-Matusewicz, B., Kim, S. B., and Jung, Y. M. (2009). A study of urea-dependent denaturation of β-lactoglobulin by principal component analysisand two-dimensional correlation spectroscopy. J. Phys. Chem. B 113, 559–566.doi: 10.1021/jp808396g
Del Río, V., Spegazzini, N., Callao, M., and Larrechi, M. (2010). Spectroscopic andquantitative chemometric analysis of the epoxidised oil/amine system. J. NearInfrared Spec. 18, 281–290. doi: 10.1255/jnirs.880
Galizia, M., La Manna, P., Mensitieri, G., Pannico, M., and Musto, P.(2014). Diffusion in polymers as investigated by two-dimensional correla-tion spectroscopy: the H2O/PCL system. J. Mol. Struct. 1069, 290–298. doi:10.1016/j.molstruc.2014.02.045
Grzeszczuk, M., Grañska, A., and Szostak, R. (2013). Raman spec-troelectrochemistry of polyaniline synthesized using different elec-trolytic regimes -multivariate analysis. Int. J. Electrochem. Sci. 8,8951–8965.
Guo, L., Spegazzini, N., Sato, H., Hashimoto, T., Masunaga, H., Sasaki, S., et al.(2011). Multistep crystallization process involving sequential formations of
Frontiers in Chemistry | www.frontiersin.org 13 March 2015 | Volume 3 | Article 14

Park et al. 2DCOS in polymer study
density fluctuations, “intermediate structures,” and lamellar crystallites: poly(3-hydroxybutyrate) as investigated by time-resolved synchrotron SAXS andWAXD.Macromolecules 45, 313–328. doi: 10.1021/ma201475t
Hong, S.-Y., Jung, Y. M., Kim, S. B., and Park, S.-M. (2005). Electrochemistryof conductive polymers. 34. two-dimensional correlation analysis of real-timespectroelectrochemical data for aniline polymerization. J. Phys. Chem. B 109,3844–3850. doi: 10.1021/jp046218f
Hoshina, H., Ishii, S., Morisawa, Y., Sato, H., Noda, I., Ozaki, Y., et al. (2012).Isothermal crystallization of poly(3-hydroxybutyrate) studied by terahertz two-dimensional correlation spectroscopy. Appl. Phys. Lett. 100, 011907(011901–011903). doi: 10.1063/1.3673847
Hoshina, H., Ishii, S., and Otani, C. (2014). Separation of overlapping vibrationalpeaks in terahertz spectra using two-dimensional correlation spectroscopy.J. Mol. Struct. 1069, 152–156. doi: 10.1016/j.molstruc.2014.02.058
Hou, L., Ma, K., An, Z., and Wu, P. (2014). Exploring the volume phase transitionbehavior of POEGA- and PNIPAM-based core–shell nanogels from infrared-spectral insights.Macromolecules 47, 1144–1154. doi: 10.1021/ma4021906
Huang, K.-W., and Kuo, S.-W. (2010). High-performance polybenzoxazinenanocomposites containing multifunctional POSS cores presenting vinyl-terminated benzoxazine groups. Macromol. Chem. Phys. 211, 2301–2311. doi:10.1002/macp.201000362
Huang, K.-W., Tsai, L.-W., and Kuo, S.-W. (2009). Influence of octakis-functionalized polyhedral oligomeric silsesquioxanes on the physical prop-erties of their polymer nanocomposites. Polymer 50, 4876–4887. doi:10.1016/j.polymer.2009.08.026
Hur, J., Jung, K.-Y., and Jung, Y. M. (2011). Characterization of spectral responsesof humic substances upon UV irradiation using two-dimensional correlationspectroscopy.Water Res. 45, 2965–2974. doi: 10.1016/j.watres.2011.03.013
Izawa, K., Ogasawara, T., Masuda, H., Okabayashi, H., and Noda, I. (2001).Two-dimensional correlation gel permeation chromatography study of octyl-triethoxysilane sol-gel polymerization process. Macromolecules 35, 92–96. doi:10.1021/ma010760+
Jelèic, Ž., Vranješ, N., and Rek, V. (2010). Long-range processing correlation andmorphological fractality of compatibilized blends of PS/ HDPE/ SEBS blockcopolymer.Macromol. Symp. 290, 1–14. doi: 10.1002/masy.201050401
Ji, W., Spegazzini, N., Kitahama, Y., Chen, Y., Zhao, B., and Ozaki, Y. (2012). pH-response mechanism of p-aminobenzenethiol on ag nanoparticles revealed bytwo-dimensional correlation surface-enhanced raman scattering spectroscopy.J. Phys. Chem. Lett. 3, 3204–3209. doi: 10.1021/jz301428e
Jia, L., Guo, C., Yang, L., Xiang, J., Tang, Y., Liu, C., et al. (2010). Mecha-nism of PEO–PPO–PEO micellization in aqueous solutions studied by two-dimensional correlation FTIR spectroscopy. J. Colloid Interface Sci. 345,332–337. doi: 10.1016/j.jcis.2010.01.060
Jiang, Y., andWu, P. (2008). Fabrication and elimination of PTAA/P4VP layer-by-layer films. Appl. Spec. 62, 207–212. doi: 10.1366/000370208783575555
Jin, Y., Wang, W., and Su, Z. (2011). Spectroscopic study on water diffusion inpoly(l-lactide)-poly(ethylene glycol) diblock copolymer film. Macromolecules
44, 2132–2139. doi: 10.1021/ma200062tJung, Y. M. (2004). Principal component analysis based two-dimensional cor-
relation spectroscopy for noise filtering effect. Vib. Spec. 36, 267–270. doi:10.1016/j.vibspec.2003.11.019
Jung, Y. M., Kim, H. J., Ryu, D. Y., Kim, S. B., and Kim, J. K. (2006). Appli-cation of principal component analysis-based two-dimensional correlationspectroscopy to characterization of order–disorder transition of polystyrene-block-poly(n-pentyl methacrylate) copolymer. J. Mol. Struct. 799, 96–101. doi:10.1016/j.molstruc.2006.03.021
Jung, Y. M., Kim, S. B., and Noda, I. (2003a). Application of two-dimensional correlation spectroscopy to chemometrics: self-modeling curveresolution analysis of spectral data sets. Appl. Spec. 57, 1376–1380. doi:10.1366/000370203322554536
Jung, Y. M., Kim, S. B., and Noda, I. (2003b). New approach to general-ized two-dimensional correlation spectroscopy. II: eigenvalue manipulationtransformation (EMT) for noise suppression. Appl. Spec. 57, 557–563. doi:10.1366/000370203321666597
Jung, Y. M., Kim, S. B., and Noda, I. (2003c). New approach to generalized two-dimensional correlation spectroscopy. III: eigenvalue manipulation transfor-mation (EMT) for spectral selectivity enhancement. Appl. Spec. 57, 564–570.doi: 10.1366/000370203321666605
Jung, Y. M., Kim, S. B., and Noda, I. (2003d). New approach to generalizedtwo-dimensional correlation spectroscopy. IV: eigenvalue manipulation trans-formation (EMT) for partial attenuation of dominant factors. Appl. Spec. 57,850–857. doi: 10.1366/000370203322102951
Jung, Y. M., and Noda, I. (2014). “Two-dimensional correlation spectroscopy: newdevelopments and applications,” in Encyclopedia of Analytical Chemistry, ed R.A. Meyers (John Wiley & Sons, Ltd), 1–22.
Jung, Y. M., Shin, H. S., Kim, S. B., and Noda, I. (2002). New approach to gener-alized two-dimensional correlation spectroscopy. 1: combination of principalcomponent analysis and two-dimensional correlation spectroscopy. Appl. Spec.56, 1562–1567. doi: 10.1366/000370202321116020
Katayama, N., Kondo, M., and Miyazawa, M. (2010). Study on molecular struc-ture and hydration mechanism of Domyoji-ko starch by IR and NIR hetero 2Danalysis. J. Mol. Struct. 974, 179–182. doi: 10.1016/j.molstruc.2010.02.074
Kim, H. J., Kim, S. B., Kim, J. K., and Jung, Y. M. (2006a). Two-dimensionalheterospectral correlation analysis of wide-angle X-ray scattering and infraredspectroscopy for specific chemical interactions in weakly interacting blockcopolymers. J. Phys. Chem. B 110, 23123–23129. doi: 10.1021/jp0638282
Kim, H. J., Kim, S. B., Kim, J. K., Jung, Y. M., Ryu, D. Y., Lavery, K. A.,et al. (2006b). Phase behavior of a weakly interacting block copolymer bytemperature-dependent FTIR spectroscopy. Macromolecules 39, 408–412. doi:10.1021/ma052259d
Kim, M. K., Ryu, S. R., Noda, I., and Jung, Y. M. (2012). Projec-tion 2D correlation analysis of spin-coated film of biodegradable P(HB-co-HHx)/PEG blend. Vib. Spec. 60, 163–167. doi: 10.1016/j.vibspec.2012.02.008
Kuo, S.-W., and Liu, W.-C. (2011). Miscibility enhancement through hydrogenbonding interaction of biodegradable poly(3-hydroxybutyrate) blending withpoly(styrene-co-vinyl phenol) copolymer. J. Appl. Polymer Sci. 119, 300–310.doi: 10.1002/app.32528
Lai, H., and Wu, P. (2013). Hydration capabilities and structures of carbonyl andether groups in poly(3-(2-methoxyethyl)-N-vinyl-2-pyrrolidone) film. Polym.
Chem. 4, 3323–3332. doi: 10.1039/c3py00239jLee, C. O., Chae, B., Kim, S. B., Jung, Y. M., and Lee, S. W. (2012).
Two-dimensional correlation analysis study of the photo-degradationof poly(ethylene terephthalate) film. Vib. Spec. 60, 142–145. doi:10.1016/j.vibspec.2011.10.013
Lee, S. H., Chae, B., Kim, H.-C., Kim, S. B., Jung, Y. M., and Lee, S.W. (2010). Photoreaction and molecular reorientation studies of ultra-violet light irradiated azobenzene containing polymer films using two-dimensional correlation infrared spectroscopy. J. Mol. Struct. 974, 35–39. doi:10.1016/j.molstruc.2009.10.008
Li, X., Shen, Q., Zhang, D., Mei, X., Ran,W., Xu, Y., et al. (2013). Functional groupsdetermine biochar properties (pH and EC) as Studied by two-dimensionalC NMR correlation spectroscopy. PLoS ONE 8:e65949. doi: 10.1371/jour-nal.pone.0065949
Ma, L., Ahmed, Z., and Asher, S. A. (2011). Ultraviolet resonance raman study ofside chain electrostatic control of poly-l-lysine conformation. J. Phys. Chem. B
115, 4251–4258. doi: 10.1021/jp2005343Musto, P., Mensitieri, G., Lavorgna, M., Scarinzi, G., and Scherillo, G. (2011).
Combining gravimetric and vibrational spectroscopy measurements to quan-tify first- and second-shell hydration layers in polyimides with differentmolecular architectures. J. Phys. Chem. B 116, 1209–1220. doi: 10.1021/jp2056943
Noda, I. (1986). Two-dimensional infrared (2D IR) spectroscopy of synthetic andbiopolymers. Bull. Am. Phys. Soc. 31:520.
Noda, I. (1993). Generalized two-dimensional correlation method applicable toinfrared, raman, and other types of spectroscopy. Appl. Spec. 47, 1329–1336.doi: 10.1366/0003702934067694
Noda, I. (2000). Progress in 2D correlation spectroscopy.AIP Conf. Proc. 503, 3–17.doi: 10.1063/1.1302843
Noda, I. (2002). “General theory of two-dimensional (2D) analysis,” in Handbook
of Vibrational Spectroscopy, eds J. M. Chalmers, and P. R. Griffiths (Chichester:John Wiley & Sons, Ltd), 2123–2134.
Noda, I. (2004). Advances in two-dimensional correlation spectroscopy. Vib. Spec.36, 143–165. doi: 10.1016/j.vibspec.2003.12.016
Noda, I. (2006). Progress in two-dimensional (2D) correlation spectroscopy. J. Mol.
Struct. 799, 2–15. doi: 10.1016/j.molstruc.2006.03.053
Frontiers in Chemistry | www.frontiersin.org 14 March 2015 | Volume 3 | Article 14
Park et al. 2DCOS in polymer study
Noda, I. (2007). Two-dimensional correlation analysis useful for spectroscopy,chromatography, and other analytical measurements. Anal. Sci. 23, 139–146.doi: 10.2116/analsci.23.139
Noda, I. (2008). Recent advancement in the field of two-dimensional correlationspectroscopy. J. Mol. Struct. 883–884, 2–26. doi: 10.1016/j.molstruc.2007.11.038
Noda, I. (2009). “Chapter 13 - generalized two-dimensional correlation spec-troscopy,” in Frontiers of Molecular Spectroscopy, ed J. Laane (Amsterdam:Elsevier), 367–381.
Noda, I. (2010). Projection two-dimensional correlation analysis. J. Mol. Struct.
974, 116–126. doi: 10.1016/j.molstruc.2009.11.047Noda, I. (2014a). Frontiers of two-dimensional correlation spectroscopy. part 1.
New concepts and noteworthy developments. J. Mol. Struct. 1069, 3–22. doi:10.1016/j.molstruc.2014.01.025
Noda, I. (2014b). Frontiers of two-dimensional correlation spectroscopy. Part 2.Perturbation methods, fields of applications, and types of analytical probes.J. Mol. Struct. 1069, 23–49. doi: 10.1016/j.molstruc.2014.01.016
Noda, I. (2014c). Two-dimensional correlation spectroscopy study of polystyrene.Macromol. Symp. 339, 17–23. doi: 10.1002/masy.201300129
Noda, I. (2014d). Vibrational spectroscopy in the development of sur-face hydrophilic elastomer latex (SHEL). Vib. Spec. 71, 70–75. doi:10.1016/j.vibspec.2014.01.009
Noda, I., Dowrey, A. E., Marcoli, C., Story, G. M., and Ozaki, Y. (2000). Gener-alized two-dimensional correlation spectroscopy. Appl. Spec. 54, 236A–248A.doi: 10.1366/0003702001950454
Noda, I., Dowrey, A. E., and Marcott, C. (1993). Recent developments intwo-dimensional infrared (2D IR) correlation spectroscopy. Appl. Spec. 47,1317–1323. doi: 10.1366/0003702934067513
Noda, I., and Lindsey, S. B. (2010). “Plastics from Bacteria: natural functions andapplications,” inMicrobiologyMonographs, ed G. G.-Q. Chen (Berlin: Springer),237–256.
Noda, I., and Ozaki, Y. (2004). Two-Dimensional Correlation Spectroscopy: Appli-
cations in Vibrational and Optical Spectroscopy. Chichester: John Wiley & SonsLtd. doi: 10.1002/0470012404
Oh, T.-J., Nam, J.-H., and Jung, Y. M. (2009). Molecular miscible blendof poly(2-cyano-1,4-phenyleneterephthalamide) and polyvinylpyrrolidonecharacterized by two-dimensional correlation FTIR and solid state 13CNMR spectroscopy. Vib. Spec. 51, 15–21. doi: 10.1016/j.vibspec.2008.09.017
Ozaki, Y. (2002). “2D correlation spectroscopy in vibrational spectroscopy,” inHandbook of Vibrational Spectroscopy, eds J. M. Chalmers, and P. R. Griffiths(John Wiley & Sons, Ltd), 2135–2172.
Ozaki, Y., and Šašic, S. (2005). “Two-dimensional correlation spectroscopy of bio-logical and polymeric materials,” in Vibrational Spectroscopy of Biological and
Polymeric Materials, eds V. G. Gregoriou and M. S. Braiman (New York, NY:CRC Press), 163–214.
Ozaki, Y., and Noda, I. (2006). “Two-dimensional vibrational correlation spec-troscopy in biomedical sciences,” in Encyclopedia of Analytical Chemistry, edR. A. Meyers (John Wiley & Sons, Ltd), 1–18.
Park, Y., Hashimoto, C., Hashimoto, T., Hirokawa, Y., Jung, Y. M., and Ozaki,Y. (2013). Reaction-induced self-assembly of gel structure: a new insightinto chemical gelation process of N-isopropylacrylamide as studied by two-dimensional infrared correlation spectroscopy.Macromolecules 46, 3587–3602.doi: 10.1021/ma400457e
Park, Y., Kim, N. H., Choi, H. C., Lee, S. M., Hwang, H., Jeong, Y. U., et al.(2012). Two-dimensional hetero-spectral Raman/XAS correlation analysis ofLi[Ni0.45Co0.18Mn0.25Al0.12]O2 cathode in the overcharged state. Vib. Spec.60, 226–230. doi: 10.1016/j.vibspec.2012.03.004
Pazderka, T., and Kopecký Jr, V. (2012). Two-dimensional correlation analysis ofRaman optical activity – Basic rules and data treatment. Vib. Spec. 60, 193–199.doi: 10.1016/j.vibspec.2011.10.002
Peng, H., Han, Y., Liu, T., Tjiu, W. C., and He, C. (2010). Morphologyand thermal degradation behavior of highly exfoliated CoAl-layered dou-ble hydroxide/polycaprolactone nanocomposites prepared by simple solu-tion intercalation. Thermochim. Acta 502, 1–7. doi: 10.1016/j.tca.2010.01.009
Pi, F., Shinzawa, H., Czarnecki, M. A., Iwahashi, M., Suzuki, M., andOzaki, Y. (2010). Self-assembling of oleic acid (cis-9-octadecenoic acid)and linoleic acid (cis-9, cis-12-octadecadienoic acid) in ethanol studied by
time-dependent attenuated total reflectance (ATR) infrared (IR) and two-dimensional (2D) correlation spectroscopy. J. Mol. Struct. 974, 40–45. doi:10.1016/j.molstruc.2009.11.060
Popescu, M. C., and Vasile, C. (2011). Two-dimensional infrared correlation spec-troscopic studies of polymer blends—Specific interactions in polyethylene adi-pate/cholesteryl palmitate blends. Spectrochim. Acta A Mol. Biomol. Spectrosc.
79, 45–50. doi: 10.1016/j.saa.2011.01.042Popescu, M.-C., and Vasile, C. (2010). Melting behavior of polytetra hydro-
furan/cholesteryl palmitate blends investigated by two-dimensionalinfrared correlation spectroscopy. Soft Mater. 8, 386–406. doi:10.1080/1539445X.2010.525168
Qu, Y., Huang, G., Wang, X., and Li, J. (2012). Study on the mechanism ofthe formation of polyhedral oligomeric silsesquioxanes by the 2D corre-lation infrared spectral. J. Appl. Polym. Sci. 125, 3658–3665. doi: 10.1002/app.36489
Quaroni, L., Zlateva, T., and Normand, E. (2011). Detection of weak absorp-tion changes from molecular events in time-resolved FT-IR spectromicroscopymeasurements of single functional cells. Anal. Chem. 83, 7371–7380. doi:10.1021/ac201318z
Radice, S., Tommasini, M., and Castiglioni, C. (2010). Two dimensional corre-lation Raman spectroscopy of perfluoropolyethers: effect of peroxide groups.J. Mol. Struct. 974, 73–79. doi: 10.1016/j.molstruc.2009.11.063
Ryu, S. R., Bae,W.M., Hong,W. J., Ihn, K. J., and Jung, Y. M. (2012). Characteriza-tion of chain transfer reaction during radical polymerization of silver nanocom-posite polyvinylpyrrolidone by using 2D hetero-spectral IR/NMR correlationspectroscopy. Vib. Spec. 60, 168–172. doi: 10.1016/j.vibspec.2011.12.009
Seo, H., Chae, B., Im, J. H., Jung, Y. M., and Lee, S. W. (2014). Imidizationinduced structural changes of 6FDA-ODA poly(amic acid) by two-dimensional(2D) infrared correlation spectroscopy. J. Mol. Struct. 1069, 196–199. doi:10.1016/j.molstruc.2014.02.012
Shinzawa, H., Awa, K., Noda, I., and Ozaki, Y. (2013). Pressure-induced variationof cellulose tablet studied by two-dimensional (2D) near-infrared (NIR) corre-lation spectroscopy in conjunction with projection pretreatment. Vib. Spec. 65,28–35. doi: 10.1016/j.vibspec.2012.11.009
Shinzawa, H., Awa, K., and Ozaki, Y. (2012). Compression effect on sustained-release and water absorption properties of cellulose tablets studied by het-erospectral two-dimensional (2D) correlation analysis. Anal. Methods 4,1530–1537. doi: 10.1039/c1ay05392b
Sikirzhytski, V., Topilina, N. I., Takor, G. A., Higashiya, S., Welch, J. T., Uversky,V. N., et al. (2012). Fibrillation mechanism of a model intrinsically disorderedprotein revealed by 2D correlation deep UV resonance raman spectroscopy.Biomacromolecules 13, 1503–1509. doi: 10.1021/bm300193f
Smirnova, D. S., Kornfield, J. A., and Lohse, D. J. (2011). Morphology develop-ment in model polyethylene via two-dimensional correlation analysis. Macro-
molecules 44, 6836–6848. doi: 10.1021/ma200774uSu, Z., Jiang, Z., Huang, G., Li, L., andWang, X. (2012). Mechanism of formation of
partially crosslinked polyacrylamide complexes. J. Macromol. Sci. B 52, 22–35.doi: 10.1080/00222348.2012.687330
Tang, H., Sun, S., Wu, J., Wu, P., and Wan, X. (2010). Conformational changesin novel thermotropic liquid crystalline polymer without conventional meso-gens: a raman spectroscopic investigation. Polymer 51, 5482–5489. doi:10.1016/j.polymer.2010.09.036
Unger, M., Morita, S., Sato, H., Ozaki, Y., and Siesler, H. W. (2009).Variable-temperature fourier transform infrared spectroscopic inves-tigations of poly(3-Hydroxyalkanoates) and perturbation-correlationmoving-window two-dimensional correlation analysis. part ii:study of poly(ε-Caprolactone) homopolymer and a poly(3-Hydroxybutyrate)–Poly(ε-Caprolactone) Blend. Appl. Spec.
63, 1034–1040. doi: 10.1366/000370209789379240Unger, M., Sato, H., Ozaki, Y., and Siesler, H. W. (2011). Crystallization behav-
ior of poly(3-hydroxybutyrate) (PHB), Poly(ε-caprolactone) (PCL) and TheirBlend (50:50?wt.%) Studied by 2D FT-IR correlation spectroscopy. Macromol.
Symp. 305, 90–100. doi: 10.1002/masy.201000135Wang, L., Di, S., Wang, W., Chen, H., Yang, X., Gong, T., et al. (2014). Tun-
able temperaturememory effect of photo-cross-linked star PCL–PEGnetworks.Macromolecules 47, 1828–1836. doi: 10.1021/ma4023229
Wang, X., Xiang, K., Nie, Y., Huang, G., Wu, J., and Su, Z. (2013). Intermediatestate and weak intermolecular interactions of α-trans-1,4-Polyisoprene during
Frontiers in Chemistry | www.frontiersin.org 15 March 2015 | Volume 3 | Article 14
Park et al. 2DCOS in polymer study
the gradual cooling crystallization process investigated by In situ FTIR and two-dimensional infrared correlation spectroscopy. Macromol. Res. 21, 493–501.doi: 10.1007/s13233-013-1045-2
Wang, Z., and Wu, P. (2011). Spectral insights into gelation microdynamicsof PNIPAM in an ionic liquid. J. Phys. Chem. B 115, 10604–10614. doi:10.1021/jp205650h
Wu, Q.-Y., Chen, X.-N., Wan, L.-S., and Xu, Z.-K. (2012). Interactions betweenpolyacrylonitrile and solvents: density functional theory study and two-dimensional infrared correlation analysis. J. Phys. Chem. B 116, 8321–8330. doi:10.1021/jp304167f
Wu, Y., Jiang, J.-H., and Ozaki, Y. (2002). A new possibility of gener-alized two-dimensional correlation spectroscopy:? hybrid two-dimensionalcorrelation spectroscopy. J. Phys. Chem. A 106, 2422–2429. doi: 10.1021/jp012140g
Wu, Y., Meersman, F., and Ozaki, Y. (2006). A novel application ofhybrid two-dimensional correlation infrared spectroscopy:? exploration ofthe reversibility of the pressure- and temperature-induced phase separa-tion of poly(N-isopropylacrylamide) and Poly(N-isopropylmethacrylamide)in aqueous solution. Macromolecules 39, 1182–1188. doi: 10.1021/ma0521755
Zhang, M., Dang, Y.-Q., Liu, T.-Y., Li, H.-W., Wu, Y., Li, Q., et al.(2013). Pressure-induced fluorescence enhancement of the BSA-protected gold nanoclusters and the corresponding conformational
changes of protein. J. Phys. Chem. C 117, 639–647. doi: 10.1021/jp309175k
Zhang, M., Zhang, L., and Wu, Y. (2011). The pressure tolerance of dif-ferent poly-l-lysine conformers in aqueous solution: infrared spectroscopyand two-dimensional correlation analysis. Vib. Spec. 57, 319–325. doi:10.1016/j.vibspec.2011.09.007
Zheng, K., Liu, R., and Huang, Y. (2010). A two-dimensional IR correlation spec-troscopic study of the conformational changes in syndiotactic polypropyleneduring crystallization. Polym. J. 42, 81–85. doi: 10.1038/pj.2009.304
Zhong, X., Liu, Y., Tang, X., Wu, Q., Li, L., and Yu, Y. (2012). Polyoxometa-late cured epoxy resins with photochromic properties. Colloid Polym. Sci. 290,1683–1693. doi: 10.1007/s00396-012-2688-9
Conflict of Interest Statement: The authors declare that the research was con-ducted in the absence of any commercial or financial relationships that could beconstrued as a potential conflict of interest.
Copyright © 2015 Park, Noda and Jung. This is an open-access article distributed
under the terms of the Creative Commons Attribution License (CC BY). The use,
distribution or reproduction in other forums is permitted, provided the original
author(s) or licensor are credited and that the original publication in this jour-
nal is cited, in accordance with accepted academic practice. No use, distribution or
reproduction is permitted which does not comply with these terms.
Frontiers in Chemistry | www.frontiersin.org 16 March 2015 | Volume 3 | Article 14