tvs upasana limited - sundram...tvs upasana limited report of the directors to the shareholders the...
TRANSCRIPT

ANNUAL REPORT
for the year endedMarch 31, 2018
TVS Upasana Limited

1
TVS Upasana Limited
REPORT OF THE DIRECTORS TO THE SHAREHOLDERS
The Directors have pleasure in presenting the Twenty Sixth Annual Report, together with the audited accounts for the year ended 31st March, 2018.
FINANCIAL RESULTS ` in lakhs
Particulars 2017-18 2016-17Revenue from operations 15,541.17 14,793.60Gross Profit / (Loss) before interest & depreciation
3,291.94 2,387.34
Less: Interest 313.64 263.63Less: Depreciation 428.07 429.53Profi t / (Loss) before tax 2,550.23 1,694.18Add / (Less): Provision for Tax (including Deferred Tax)
805.71 587.21
Profi t / (Loss) after tax 1,744.52 1,106.97Other Comprehensive income net of deferred Tax
(2.48) (4.17)
Total Comprehensive Income for the year 1,742.04 1,102.80Add : Brought forward 3,860.47 2,757.67Add : Financial Guarantee 41.46 -Less: Final Dividend Paid 2016-17 237.99 -Less: Interim Dividend Paid 2017-18 119.00 -Less: Dividend Distribution Tax paid 72.68 -Balance carried forward 5,214.30 3,860.47
OPERATIONS
During the year under review, the revenue from operations of the Company amounted to ` 15,541.17 lakhs as against ` 14,793.60 lakhs in 2016 - 2017. During the year under review, the total comprehensive income of the Company for the year was at ` 1,742.04 lakhs as against ` 1,102.80 lakhs during2016-2017
DIVIDEND
The Directors have paid an interim Dividend of ` 1.00 per share.
The Directors recommend 25% dividend for the year under review i.e ` 2.50 per share.
TRANSFER TO RESERVES
The Company has not transferred any amounts to reserves during the year 2017-2018.
BOARD MEETINGS
During the fi nancial year 2017-2018, there were 6 (Six) board meetings, which were held on 23rd May, 2017, 15th September, 2017, 27th September, 2017, 5th October, 2017, 19th February, 2018 and 5th March, 2018.
DIRECTORS’ RESPONSIBILITY STATEMENT
The Directors confi rm that:-
a) in the preparation of the annual accounts, the applicable accounting standards had been followed;
b) we have selected appropriate accounting policies and applied them consistently, made judgments and estimates that have
been made are reasonable and prudent so as to give a true and fair view of the state of affairs of the Company at the end of the fi nancial year and of the profi t of the Company for that year.
c) we had taken proper and suffi cient care for the maintenance of adequate accounting records in accordance with the provisions of the Companies Act, 2013 for safeguarding the assets of the Company and for preventing and detecting fraud and other irregularities.
d) we had prepared the annual accounts on a going concern basis.
e) we had devised proper systems to ensure compliance with the provisions of all applicable laws and such systems were adequate and operating effectively.
DIRECTORS
In terms of the provisions of sub-section (6) read with explanation to Section 152 of the Companies Act, 2013, two-third of the total number of directors i.e. excluding independent directors, are liable to retire by rotation and out of which, one-third is liable to retire by rotation at every Annual General Meeting (AGM).
Accordingly, Ms Arundathi Krishna (DIN 00270935), Managing Director of the Company, becomes liable to retire by rotation, at the ensuing AGM, and being eligible, offers herself for re-appointment.
Mr R Krishnan, (DIN 00271938) Independent Director, has resigned from the Board effective October 5, 2017. The Board recorded its appreciation for the services rendered by Sri R Krishnan
STATEMENT ON DECLARATION GIVEN BY INDEPENDENT DIRECTORS UNDER SUB-SECTION (7) OF SECTION 149
The Independent Director have submitted the declaration of independence, pursuant to Section 149 (7) of the Companies Act, 2013 stating that they meet the criteria of independence as provided in sub-section (6).
PARTICULARS OF LOANS, GUARANTEES OR INVESTMENTS UNDER SECTION 186 OF THE COMPANIES ACT, 2013
The Company has not given any loans or guarantees covered under the provisions of Section 186 of the Companies Act, 2013.
AUDITORS
Pursuant to Section 139 of the Companies Act, 2013, B S R & Co LLP, Chartered Accountants, Chennai, (Registration No. 101248 W / W- 100022 with the Institute of Chartered Accountants of India), were appointed as Statutory Auditors of the Company at the Twenty Fifth Annual General Meeting of the Company for a consecutive period of 5 years commencing from 28th June, 2017.
RELATED PARTY TRANSACTIONS
All related party transactions were entered at arm’s length basis and in the ordinary course of business. The particulars of contracts or arrangements with related parties referred to in sub-section (1) of Section 188 prepared in Form AOC-2 pursuant to Section 134 of the Companies Act, 2013 read with the Companies (Accounts) Rules, 2014 is enclosed vide Annexure I forming part of this report.
EXTRACT OF ANNUAL RETURN
The details forming part of the extract of the Annual Return in Form MGT-9 is annexed herewith as Annexure-II.

2
TVS Upasana Limited
MATERIAL CHANGES AND COMMITMENTS
There were no material changes and commitments, affecting the fi nancial position of the Company, which have occurred between the end of the fi nancial year of the Company to which the fi nancial statements relate and the date of the report.
CONSERVATION OF ENERGY / TECHNOLOGY ABSORPTION
The Company has utilized renewable energy in the form of Wind Energy at its hosur plant in lieu of fossil fuels. There is on technology absorption during the year under review.
FOREIGN EXCHANGE EARNINGS AND OUTGO
The total foreign exchange earned and used are as under:
Rs in lakhs
Particulars 2017-18 2016-17Foreign exchange earned - Exports 3,952.80 3,642.79Foreign Exchange earned - Others - 7.44Foreign exchange used - imports 957.60 1,019.36Foreign exchange used – others 50.44 34.44
DETAILS OF DIRECTORS OR KEY MANAGERIAL PERSONNEL APPOINTED OR HAVE RESIGNED DURING THE YEAR
During the year under review, Sri R Dilip Kumar, Chief Financial Offi cer and Company Secretary resigned effective October 5, 2017.
In view of the resignation of Sri R Dilip Kumar, Sri R Krishnan, a qualified Company Secretary and Cost and Management Accountant, having more than 30 years’ of experience in the areas of fi nance, accounting, taxation and legal, is appointed as Chief Financial Offi cer and Company Secretary of the Company effective October 5, 2017.
CHANGE IN THE NATURE OF BUSINESS
There was no change in the nature of business of the Company during the fi nancial year.
COMPANIES WHICH HAVE BECOME OR CEASED TO BE COMPANY'S SUBSIDIARIES, JOINT VENTURES OR ASSOCIATE COMPANIES DURING THE YEAR
The Company does not have any subsidiary, joint venture or associate company.
PUBLIC DEPOSITS
During the year under review, the Company has not accepted any deposits from the public within the meaning of Section 73 of the Companies Act, 2013.
REGULATORY / COURT ORDERS
During the year 2017 - 2018, no signifi cant and material orders were passed by the regulators or courts or tribunals impacting the going concern status and company’s operations in future.
INTERNAL FINANCIAL CONTROLS
The company has internal control procedures and suffi cient internal control checks considering the size and nature of its business and the Board of directors are of the view that those controls are adequate with reference to the fi nancial statements.
RISK MANAGEMENT
The Company had identifi ed certain business risks and also the measures for dealing with such risks which it faces in day to day operations of the Company.
AUDIT COMMITTEE AND NOMINATION AND REMUNERATION COMMITTEE
The Audit Committee met once during the year on 23rd May, 2017. All the members attended the meeting.
Pursuant to the amendments on Companies (Appointment and Qualifi cation of Directors) Rules, 2014 and Companies (Meetings of Board and its Powers) Rules, 2014 vide MCA notifi cations dated July 5, 2017 and July 13, 2017 respectively, the Board of directors had resolved for the dissolution of Audit Committee and Nomination and Remuneration Committee at its meeting held on September 15, 2017 effective from that date.
CORPORATE SOCIAL RESPONSIBILITY COMMITTEE (CSR)
The CSR Committee of the Board consists of Sri Suresh Krishna, Ms Arundathi Krishna, Ms Usha Krishna and Sri R Ramakrishnan as members of the CSR Committee, with Sri Suresh Krishna as its Chairman.
The CSR Committee of the Board met one time during the year on 15th September, 2017.
With the enactment of the Companies Act, 2013 and the Companies (Corporate Social Responsibility) Rules, 2014 and any amendment(s) relating thereto, read with various clarifi cations issued by Ministry of Corporate Affairs, the Company has undertaken activities as per the CSR Policy (available on your Company’s website www.uel.in) and the details are contained in the annual report on CSR activities enclosed vide Annexure-III forming part of this report.
STATEMENT UNDER RULE 5(2) OF THE COMPANIES (APPOINTMENT AND REMUNERATION OF MANAGERIAL PERSONNEL) RULES, 2014
None of the employees was in receipt of remuneration in excess of the limit prescribed under Rule 5(2) of the Companies (Appointment and Remuneration of Managerial Personnel) Rules, 2014.
DISCLOSURE UNDER THE SEXUAL HARRASSMENT OF WOMEN AT WORKPLACE (PREVENTION, PROHIBITION AND REDRESSAL) ACT, 2013
The Company has adopted the Anti-Sexual Harassment Policy laid down by the Holding Company (Sundram Fasteners Limited-SFL), which is in line with the requirements of the Sexual Harassment of Women at the Workplace (Prevention, Prohibition & Redressal) Act, 2013. Internal Complaints Committee (ICC) of SFL is entrusted to redress complaints regarding sexual harassment. No complaints were received during the calendar year 2017.
ACKNOWLEDGMENT
Your Directors thank the holding company, Sundram Fasteners Limited for its continued support. The Directors wish to thank the Company’s bankers, customers and vendors for their continued support. They also place on record their appreciation of all the employees of the Company for their contribution and dedicated service.
On behalf of the Board
April 30, 2018 Suresh KrishnaChennai Chairman
3
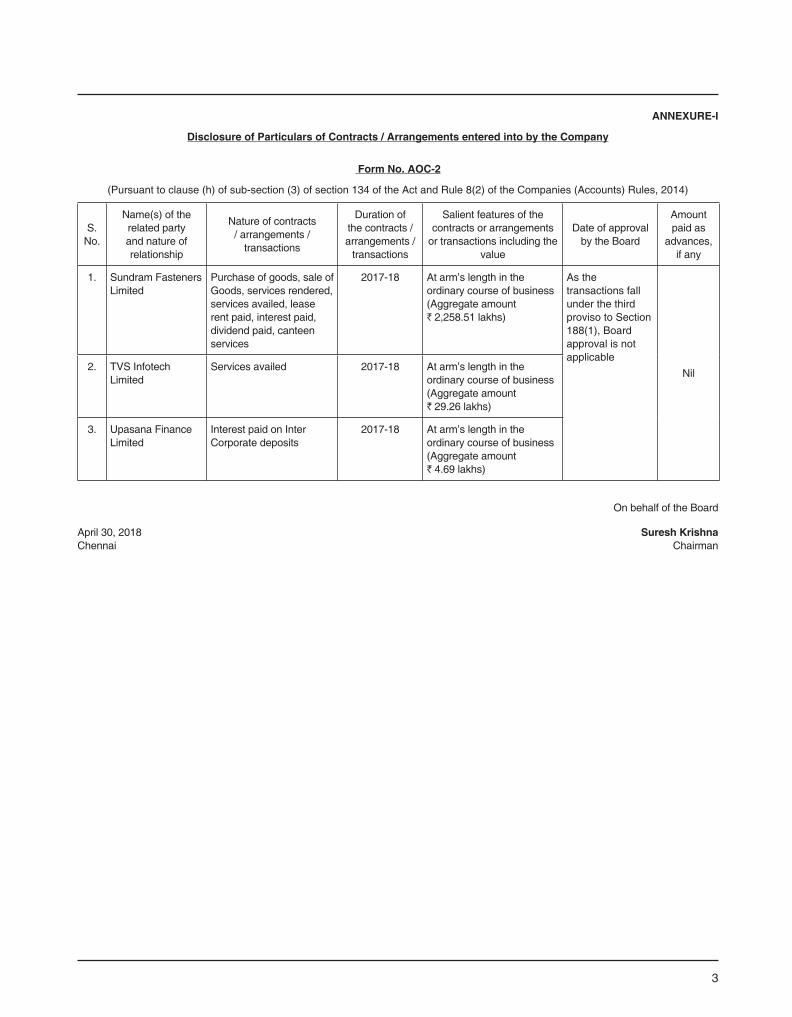
ANNEXURE-I
Disclosure of Particulars of Contracts / Arrangements entered into by the Company
Form No. AOC-2
(Pursuant to clause (h) of sub-section (3) of section 134 of the Act and Rule 8(2) of the Companies (Accounts) Rules, 2014)
S. No.
Name(s) of the related party and nature of relationship
Nature of contracts / arrangements /
transactions
Duration of the contracts / arrangements /
transactions
Salient features of the contracts or arrangements
or transactions including the value
Date of approval by the Board
Amount paid as
advances, if any
1. Sundram Fasteners Limited
Purchase of goods, sale of Goods, services rendered, services availed, lease rent paid, interest paid, dividend paid, canteen services
2017-18 At arm’s length in the ordinary course of business (Aggregate amount ` 2,258.51 lakhs)
As the transactions fall under the third proviso to Section 188(1), Board approval is not applicable
Nil2. TVS Infotech
LimitedServices availed 2017-18 At arm’s length in the
ordinary course of business (Aggregate amount ` 29.26 lakhs)
3. Upasana Finance Limited
Interest paid on Inter Corporate deposits
2017-18 At arm’s length in the ordinary course of business (Aggregate amount ` 4.69 lakhs)
On behalf of the Board
April 30, 2018 Suresh KrishnaChennai Chairman
4
TVS Upasana Limited
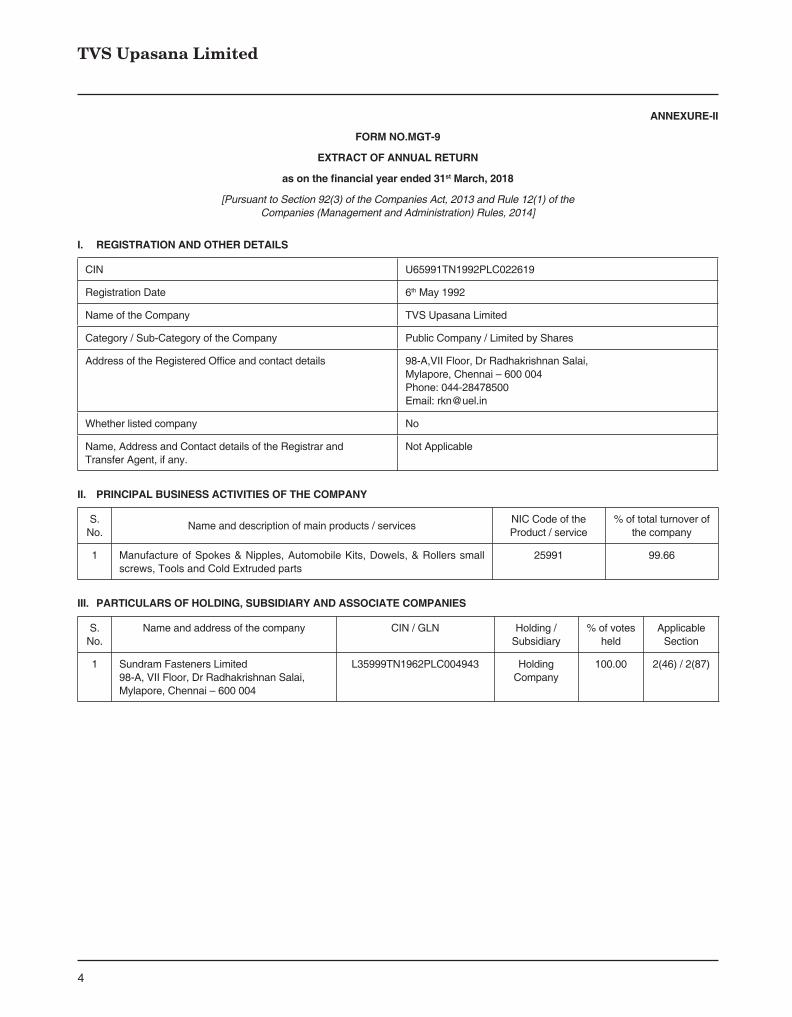
ANNEXURE-II
FORM NO.MGT-9
EXTRACT OF ANNUAL RETURN
as on the fi nancial year ended 31st March, 2018
[Pursuant to Section 92(3) of the Companies Act, 2013 and Rule 12(1) of theCompanies (Management and Administration) Rules, 2014]
I. REGISTRATION AND OTHER DETAILS
CIN U65991TN1992PLC022619
Registration Date 6th May 1992
Name of the Company TVS Upasana Limited
Category / Sub-Category of the Company Public Company / Limited by Shares
Address of the Registered Offi ce and contact details 98-A,VII Floor, Dr Radhakrishnan Salai, Mylapore, Chennai – 600 004Phone: 044-28478500Email: [email protected]
Whether listed company No
Name, Address and Contact details of the Registrar and Transfer Agent, if any.
Not Applicable
II. PRINCIPAL BUSINESS ACTIVITIES OF THE COMPANY
S. No.
Name and description of main products / servicesNIC Code of the Product / service
% of total turnover of the company
1 Manufacture of Spokes & Nipples, Automobile Kits, Dowels, & Rollers small screws, Tools and Cold Extruded parts
25991 99.66
III. PARTICULARS OF HOLDING, SUBSIDIARY AND ASSOCIATE COMPANIES
S. No.
Name and address of the company CIN / GLN Holding / Subsidiary
% of votes held
Applicable Section
1 Sundram Fasteners Limited98-A, VII Floor, Dr Radhakrishnan Salai, Mylapore, Chennai – 600 004
L35999TN1962PLC004943 Holding Company
100.00 2(46) / 2(87)

5
IV. SHAREHOLDING PATTERN (Equity Share Capital Breakup as percentage of Total Equity)
(i) Category wise shareholding
Category of shareholders
No. of shares held at the beginning of the year
No. of shares held at the end of the year %
change during
the yearDemat Physical Total% of total
sharesDemat Physical Total
% of total
sharesA. Promoters1. Indiana) Individuals / HUF (Nominees of Bodies Corporate)
- 6 6 0.00 - 6 6 0.00 Nil
b) Central Govt. - - - - - - - - -
c) Bodies Corporate - 11899668 11899668 100.00 - 11899668 11899668 100.00 Nil
d) Banks / FI - - - - - - - - -
e) Any other - - - - - - - - -
Sub-Total (A)(1) 11899674 11899674 100.00 - 11899674 11899674 100.00 Nil
Foreign
a) NRIs – Individuals - - - - - - - - -
b) Other individuals - - - - - - - - -
c)Bodies Corporate - - - - - - - - -
d) Banks / FI - - - - - - - - -
e) Any other - - - - - - - - -
Sub-Total (A)(2) - - - - - - - - -
Total shareholding(A)=(A)(1)+ (A)(2)
- 11899674 11899674 100.00 - 11899674 11899674 100.00 Nil
B. Public Shareholding
1.Institutions - - - - - - - - -
2.Non-Institutions - - - - - - - - -
Total Public Shareholding (B) = (B)(1)+(B)(2)
- - - - - - - - -
C. Shares held by Custodian for GDRs and ADRs
- - - - - - - - -
Grand Total = A+B+C - 11899674 11899674 100.00 - 11899674 11899674 100.00 Nil
(ii) Shareholding of Promoters
S. No.
Shareholders’ Name
Shareholding at the beginning of the year
Shareholding at the end of the year
% change during the
yearNo. of shares
% of total shares of the
company
% of shares pledged /
encumbered to total shares
No. of shares
% of total shares of the
company
% of shares pledged /
encumbered to total shares
1 Sundram Fasteners Ltd 11899668 100.00 0.00 11899668 100.00 0.00 Nil
2 Nominees of Sundram Fasteners Ltd 6 0.00 0.00 6 0.00 0.00 Nil
Total 11899674 100.00 0.00 11899674 100.00 0.00 Nil
(iii) Change in Promoters’ Shareholding (please specify, if there is no change)
There have been no changes in the Promoters’ shareholding during the year.
(iv) Shareholding pattern of top ten shareholders (other than Directors, Promoters and Holders of GDRs and ADRs)
Not Applicable

6
TVS Upasana Limited
(v) Shareholding of Directors and Key Managerial Personnel:
S. No.
For Each of the Directors and KMP
Name of the Director / KMP
Shareholding at the beginning of the year
Cumulative Shareholding during the year
No. of Shares
% of total shares of the
company
No. of Shares
% of total shares of the company
1At the beginning, during and end of the year
S Meenakshisundaram, Director* 1 0.00 1 0.00
2At the beginning, during and end of the year
R Dilip Kumar, CFO & CS*(resigned effective October 5, 2017)
1 0.00 1 0.00
3At the beginning, during and end of the year
R Krishnan* (Director till October 5, 2017 and CFO & CS from October 5, 2017
1 0.00 1 0.00
* Nominees of Sundram Fasteners Limited
V. INDEBTEDNESS
Indebtedness of the Company including interest outstanding/accrued but not due for payment (as on 31st March, 2018)
` in lakhs
S. No.
Particulars Secured Loans Unsecured Loans DepositsTotal
Indebtedness
1.
Indebtedness at the beginning of the fi nancial yeari) Principal amountii) Interest due but not paidiii) Interest accrued but not due
4,506.909.68
-
690.0010.35
-
---
5,196.9020.03
-
Total of (i) + (ii) + (iii) 4,516.58 700.35 5,216.93
2.Change in indebtedness during the fi nancial year- Addition- Reduction
1,033.75-
-115.00
--
1,033.75115.00
Net Change 1,033.75 (115.00) 918.75
3.
Indebtedness at the end of the fi nancial yeari) Principal amountii) Interest due but not paidiii) Interest accrued but not due
5,540.6525.83
-
575.00--
---
6,115.6525.83
-
Total of (i) + (ii) + (iii) 5,566.48 575.00 - 6,141.48
7
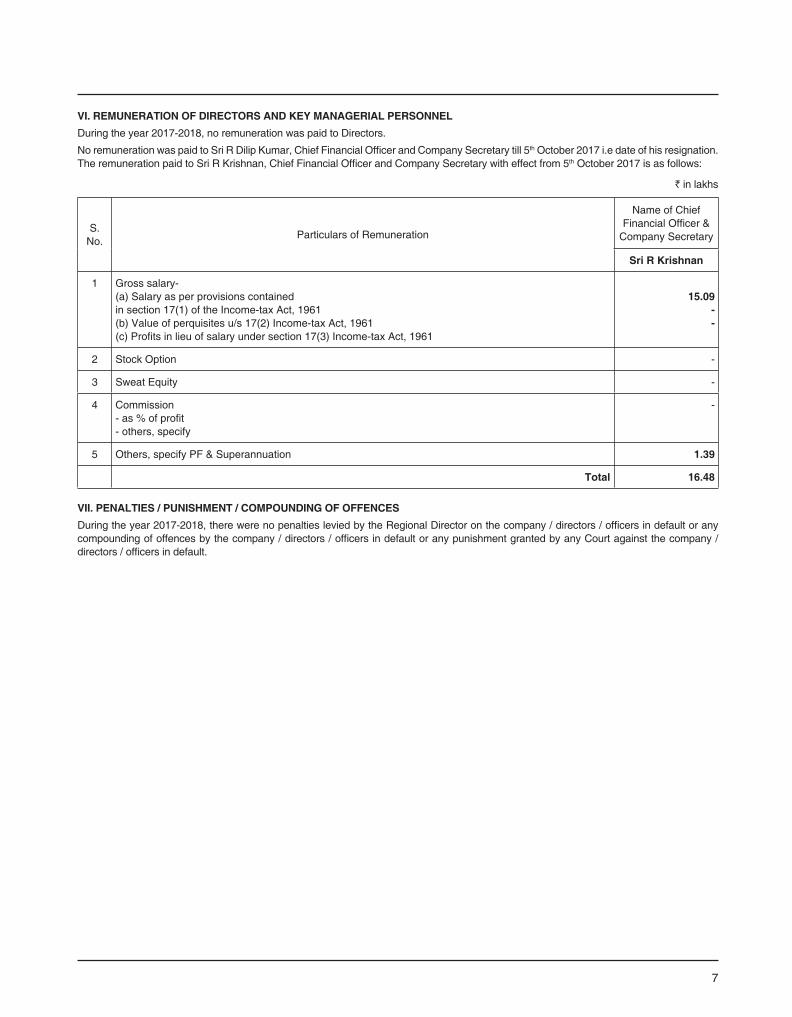
VI. REMUNERATION OF DIRECTORS AND KEY MANAGERIAL PERSONNEL
During the year 2017-2018, no remuneration was paid to Directors.
No remuneration was paid to Sri R Dilip Kumar, Chief Financial Offi cer and Company Secretary till 5th October 2017 i.e date of his resignation. The remuneration paid to Sri R Krishnan, Chief Financial Offi cer and Company Secretary with effect from 5th October 2017 is as follows:
` in lakhs
S. No.
Particulars of Remuneration
Name of Chief Financial Offi cer &
Company Secretary
Sri R Krishnan
1 Gross salary-(a) Salary as per provisions containedin section 17(1) of the Income-tax Act, 1961(b) Value of perquisites u/s 17(2) Income-tax Act, 1961(c) Profi ts in lieu of salary under section 17(3) Income-tax Act, 1961
15.09--
2 Stock Option -
3 Sweat Equity -
4 Commission- as % of profi t- others, specify
-
5 Others, specify PF & Superannuation 1.39
Total 16.48
VII. PENALTIES / PUNISHMENT / COMPOUNDING OF OFFENCES
During the year 2017-2018, there were no penalties levied by the Regional Director on the company / directors / offi cers in default or any compounding of offences by the company / directors / offi cers in default or any punishment granted by any Court against the company / directors / offi cers in default.

8
TVS Upasana Limited
ANNEXURE-III
Report on Corporate Social Responsibility as per Rule 8 of Companies (Corporate Social Responsibility Policy) Rules, 2014
(i) Brief Outline of the Company’s CSR Policy
a. CSR Committee (CSRC) shall formulate and recommend to the Board the CSR Policy, which shall include statutorily recognized activities.
b. CSRC to monitor the CSR Policy of the Company.
c. CSRC shall recommend amount of expenditure to be incurred by the company on CSR activities.
d. CSRC shall institute a transparent monitoring mechanism for implementation of the activities / projects undertaken by the Company.
e. The CSRC shall have meetings periodically as it may deem fi t with one meeting before fi nalization of annual accounts. The quorum shall be either two members or one third of the members of the CSR Committee, whichever is higher with a minimum of two directors, out of which one shall be an independent director.
f. The CSRC shall invite Managing Directors and such of the executives to be present at the meetings of the Committee as may be required by it.
g. Such other matters as may be prescribed under the Companies Act, 2013 and rules thereunder and such other rules / regulations, as may be applicable from time to time.
(ii) Overview of projects/ programmes
The Company made a CSR contribution amounting to Rs 26,48,625/- (Twenty Six Lakhs Forty Eight Thousand Six Hundred and Twenty Five Only) to World Wide Fund – India (WWF – India) towards the project titled “Eco-Trails” with the objectives of highlighting native urban biodiversity, urban degradation and solutions for conservation and restoration
(iii) Web link: www.uel.in
(iv) Composition of CSR Committee
The following directors are the members of the Corporate Social Responsibility Committee:
1. Sri Suresh Krishna (Chairman)
2. Ms. Usha Krishna
3. Ms. Arundathi Krishna
4. Sri R Ramakrishnan
(v) Average net profi ts
Average net profi ts of the company for the last three fi nancial years is Rs. 1,223.80 Lakhs.
(vi) Prescribed CSR expenditure (two per cent of the amount specifi ed above)
Prescribed CSR expenditure is Rs. 24.48 Lakhs
(vii) Details of CSR spent during the fi nancial year 2017-2018
Total amount to be spent for the fi nancial year 2017-2018 24.48 Lakhs
Amount unspent -

9
Manner in which the amount spent during the fi nancial year Towards the project titled “Eco-Trails” by WWF – India with the objectives of highlighting native urban biodiversity, urban degradation and solutions for conservation and restoration
(viii) Manner in which the amount spent during the fi nancial year is detailed below:
S. No.
CSR Project or activity identifi ed
Sector in which the project is covered
Projects or programs (1) Local
area or other(2) Specify the
State and district where projects
or programs was undertaken
Amount outlay
(budget) project or programs-
wise(` In Lakhs)
Amount spent on the projects or programs.
Sub-heads:(1) Direct expenditure on projects or programs(2) O v e r h e a d s : (` In Lakhs)
Cumulative expenditure up to the reporting
period(` In Lakhs)
Amount spent: Direct or through
implementing agency
(` In Lakhs)
1 World Wide Fund – India for the project titled “Eco Trail”
Environmental sustainability / Ecological balance
1. Others2. Tamil Nadu
` 26.48 Lakhs*
` 26.48 Lakhs ` 26.48 Lakhs ` 26.48 LakhsIn association with World Wide Fund – India
* Refund (Rs 1.50 lakhs) received from Kalakshetra Foundation is spent towards CSR activity in FY 2017 - 18.
(ix) We hereby confi rm that the Implementation and monitoring of CSR Policy, is in compliance with CSR objectives and Policy of the Company.
On behalf of the Board
April 30, 2018 Suresh KrishnaChennai Chairman

10
TVS Upasana Limited
Report on the Audit of Indian Accounting Standards (‘Ind AS’) fi nancial statements
We have audited the accompanying Ind AS financial statements of TVS Upasana Limited (“the Company”), which comprise the balance sheet as at March 31, 2018, the statement of profi t and loss, the statement of changes in equity and the statement of cash fl ows for the year then ended and summary of signifi cant accounting policies and other explanatory information (herein after referred to as “Ind AS fi nancial statements”).
Management’s responsibility for the Ind AS fi nancial statements
The Company’s board of directors is responsible for the matters stated in section 134(5) of the Companies Act, 2013 (“the Act”) with respect to the preparation of these Ind AS fi nancial statements that give a true and fair view of the state of affairs, profi t or loss and other comprehensive income, changes in equity and cash fl ows of the Company in accordance with the accounting principles generally accepted in India, including the Indian Accounting Standards (‘Ind AS’) prescribed under section 133 of the Act.
This responsibility also includes maintenance of adequate accounting records in accordance with the provisions of the Act for safeguarding the assets of the Company and for preventing and detecting frauds and other irregularities; selection and application of appropriate accounting policies; making judgments and estimates that are reasonable and prudent; and design, implementation and maintenance of adequate internal fi nancial controls, that were operating effectively for ensuring the accuracy and completeness of the accounting records, relevant to the preparation and presentation of the Ind AS fi nancial statements that give a true and fair view and are free from material misstatement, whether due to fraud or error.
In preparing the fi nancial statements, management is responsible for assessing the Company’s ability to continue as a going concern, disclosing, as applicable, matters related to going concern and using the going concern basis of accounting unless management either intends to liquidate the Company or to cease operations, or has no realistic alternative but to do so.
Auditor’s responsibility
Our responsibility is to express an opinion on these Ind AS fi nancial statements based on our audit.
We have taken into account the provisions of the Act, the accounting and auditing standards and matters which are required to be included in the audit report under the provisions of the Act and the rules made thereunder.
We conducted our audit of the Ind AS fi nancial statements in accordance with the standards on auditing specifi ed under section 143(10) of the Act. Those standards require that we comply with ethical requirements and plan and perform the audit to obtain reasonable assurance about whether the Ind AS fi nancial statements are free from material misstatement.
An audit involves performing procedures to obtain audit evidence about the amounts and the disclosures in the Ind AS fi nancial statements. The procedures selected depend on the auditor’s judgment, including the assessment of the risks of material misstatement of the Ind AS fi nancial statements, whether due to fraud or error. In making those risk assessments, the auditor considers internal fi nancial control relevant to the Company’s preparation of the Ind AS fi nancial statements that give a true and fair view in order to design audit procedures that are appropriate in the circumstances. An audit also includes evaluating the appropriateness of the accounting
policies used and the reasonableness of the accounting estimates made by the Company’s directors, as well as evaluating the overall presentation of the Ind AS fi nancial statements.
We are also responsible to conclude on the appropriateness of management’s use of the going concern basis of accounting and, based on the audit evidence obtained, whether a material uncertainty exists related to events or conditions that may cast signifi cant doubt on the entity’s ability to continue as a going concern. If we conclude that a material uncertainty exists, we are required to draw attention in the auditor’s report to the related disclosures in the fi nancial statements or, if such disclosures are inadequate, to modify the opinion. Our conclusions are based on the audit evidence obtained up to the date of the auditor’s report. However, future events or conditions may cause an entity to cease to continue as a going concern.
We believe that the audit evidence we have obtained is suffi cient and appropriate to provide a basis for our audit opinion on the Ind AS fi nancial statements.
Opinion
In our opinion, and to the best of our information and according to the explanations given to us, the aforesaid Ind AS financial statements give the information required by the Act in the manner so required and give a true and fair view in conformity with the accounting principles generally accepted in India, of the state of affairs of the Company as at March 31, 2018, its profi t and other comprehensive income, changes in equity and its cash fl ows for the year ended on that date.
Other Matters
The Ind AS fi nancial statements of the Company for the year ended March 31, 2017, were audited by another auditor who expressed an unmodifi ed opinion on those statements on May 23, 2017. Our opinion is not modifi ed in respect to this matter.
Report on other legal and regulatory requirements
1. As required by the Companies (Auditor's Report) Order, 2016 (“the Order”), issued by the Central Government in terms of section 143 (11) of the Act, we give in "Annexure A" a statement on the matters specifi ed in paragraphs 3 and 4 of the Order.
2. As required by section 143 (3) of the Act, we report that:
(a) we have sought and obtained all the information and explanations which to the best of our knowledge and belief were necessary for the purpose of our audit;
(b) in our opinion, proper books of account as required by law have been kept by the Company so far as it appears from our examination of those books;
(c) the balance sheet, the statement of profi t and loss, the statement of changes in equity and the statement of cash fl ows dealt with by this report are in agreement with the books of account;
(d) in our opinion, the aforesaid Ind AS fi nancial statements comply with the Indian Accounting Standards prescribed under section 133 of the Act.
(e) on the basis of written representations received from the directors as on March 31, 2018, taken on record by the board of directors, none of the directors are disqualifi ed as on March 31, 2018
Independent Auditor’s Report
To the Members of TVS Upasana Limited
KRM Tower, 1st & 2nd Floor, No. 1, Harrington Road,Chetpet, Chennai 600 031, India
Phone : +91 44 4608 3100Fax : +91 44 4608 3199
B S R & Co. LLPChartered Accountants

11
from being appointed as a director in terms of section 164 (2) of the Act;
(f) with respect to the adequacy of the internal fi nancial controls with reference to fi nancial statements of the Company and the operating effectiveness of such controls, refer to our separate report in "Annexure B"; and
(g) with respect to the other matters to be included in the auditor’s report in accordance with rule 11 of the Companies (Audit and Auditors) Rules, 2014, in our opinion and to the best of our information and according to the explanations given to us:
(i) the Company has disclosed the impact of pending litigations on its fi nancial position in its Ind AS fi nancial statements – refer note 30 (a) to the Ind AS fi nancial statements;
(ii) the Company did not have any long term contracts including derivative contracts for which there were any material foreseeable losses;
(iii) there were no amounts which were required to be transferred to the Investor Education and Protection Fund by the Company and
(iv) the disclosures in the financial statements regarding holdings as well as dealings in specifi ed bank notes during the period from November 8, 2016 to December 30, 2016 have not been made since they do not pertain to the fi nancial year ended March 31, 2018. However amounts as appearing in the audited Ind AS fi nancial statements for the period ended March 31, 2017 have been disclosed – refer note 13 to the Ind AS fi nancial statements.
for B S R & Co. LLPChartered AccountantsICAI Firm Registration Number: 101248W/W-100022
S SethuramanPartnerMembership No.: 203491
Place : ChennaiDate : April 30, 2018

12
TVS Upasana Limited
(i) (a) The Company has maintained proper records showing full particulars, including quantitative details and situation of fi xed assets.
(b) The Company has a regular programme of physical verifi cation of its fi xed assets by which all fi xed assets are verifi ed. In our opinion, the periodicity of physical verifi cation is reasonable having regard to the size of the Company and the nature of its assets.
(c) According to the information and explanations given to us, the title deeds of immovable properties, as disclosed in note 4 of the Ind AS fi nancial statements are held in the name of the Company, except for freehold land amounting to ̀5.13 lakhs which is pending registration with relevant authorities.
(ii) The inventory, except goods in transit and certain stocks lying with third parties, has been physically verifi ed by the management during the year. In our opinion, the frequency of such verifi cation is reasonable. The discrepancies noticed on verifi cation between the physical stocks and the book records were not material. For stock lying with third parties at the year end, written confi rmations have been obtained by the management.
(iii) The Company has not granted any loan, secured or unsecured to companies, fi rms, limited liability partnerships or other parties covered in the register required under section 189 of the Act. Accordingly, paragraph 3(iii) of the Order is not applicable.
(iv) According to the information and explanations given to us, the Company has complied with the provision of Sections 185 and 186 of the Act, in respect of loans, guarantees, securities and investments, as applicable.
(v) According to the information and explanations given to us, the Company has not accepted any deposits as mentioned in the directives issued by Reserve Bank of India and the provisions of sections 73 to 76 or any other relevant provisions of the Act and the rules framed thereunder. Accordingly, paragraph 3(v) of the Order is not applicable.
(vi) We have broadly reviewed the books of account maintained by the Company pursuant to the rules made by the Central Government for the maintenance of cost records under subsection (1) of Section 148 of the Act in respect of products manufactured and are of the opinion that prima facie, the prescribed accounts and records have been made and maintained. However, we have not made a detailed examination of the records.
(vii) (a) According to the information and explanations given to us and on the basis of our examination of the records of the Company, amounts deducted / accrued in the books of account in respect of undisputed statutory dues including provident fund, employees state insurance, income tax, sales tax, service tax, duty of customs, duty of excise, value added tax and other material statutory dues have generally been regularly deposited by the Company with the appropriate authorities. As explained to us, the Company did not have any dues on account of cess.
According to the information and explanations given to us, no undisputed amounts payable in respect of provident fund, employees state insurance, income tax, sales tax, service tax, duty of customs, duty of excise and other material statutory dues were in arrears as at March 31, 2018 for a period of more than six months from the date they became payable.
KRM Tower, 1st & 2nd Floor, No. 1, Harrington Road,Chetpet, Chennai 600 031, India
Phone : +91 44 4608 3100Fax : +91 44 4608 3199
B S R & Co. LLPChartered Accountants
(b) According to the information and explanations given to us, the dues set out Appendix I in respect of income tax, sales tax, service tax, duty of customs, duty of excise, value added tax, have not been deposited by the Company on account of disputes.
(viii) In our opinion and according to the information and explanations given to us, the Company has not defaulted in repayment of dues to banks. The Company did not have any dues to fi nancial institutions or debenture holders or government during the year.
(ix) The Company did not raise any money by way of initial public offer or further public offer (including debt instruments) during the year. According to information and explanations given to us, money raised through term loans during the year has been utilised for the purpose for which there were raised.
(x) According to the information and explanations given to us, no fraud by the Company or any material fraud on the Company by its offi cers or employees has been noticed or reported during the course of our audit.
(xi) According to the information and explanations given to us and on the basis of our examination of the records of the Company, the Company has not paid or provided for any managerial remuneration during the year. Accordingly, paragraph 3(xi) of the Order is not applicable.
(xii) In our opinion and according to the information and explanations given to us, the Company is not a nidhi company. Accordingly, paragraph 3(xii) of the Order is not applicable.
(xiii) According to the information and explanations given to us and based on our examination of the records of the Company, transactions with the related parties are in compliance with section 188 of the Act, where applicable and details of such related party transactions have been disclosed in the Ind AS fi nancial statements as required under applicable accounting standards. According to the information and explanations given to us, provisions of section 177 is not applicable to the Company.
(xiv) According to the information and explanations given to us and based on our examination of the records of the Company, the Company has not made any preferential allotment or private placement of shares or fully or partly convertible debentures during the year. Accordingly, paragraph 3(xiv) of the Order is not applicable.
(xv) According to the information and explanations given to us and based on our examination of the records of the Company, the Company has not entered into any non-cash transactions with directors or persons connected with them during the year. Accordingly, paragraph 3(xv) of the Order is not applicable.
(xvi) The Company is not required to be registered under section 45-IA of the Reserve Bank of India Act 1934. Accordingly, paragraph 3(xvi) of the Order is not applicable.
for B S R & Co. LLPChartered AccountantsICAI Firm Registration Number: 101248W/W-100022
S SethuramanPartnerMembership No: 203491
Place : ChennaiDate : April 30, 2018
Annexure A to the Independent Auditor’s Report
To the Members of TVS Upasana Limited on the Ind AS fi nancial statements for the year ended March 31, 2018

13
Appendix I as referred to under para (vii)(b) of Annexure A to the Independent Auditor’s Report
To the Members of TVS Upasana Limited on the Ind AS fi nancial statementsfor the year ended March 31, 2018
Name of the Statute Nature of the DuesAmount*
(` in lakhs)Period to which the
amount relatesForum where the dispute is
pending
Income Tax Act, 1961 Income-tax dues 0.14 AY 2012-13The Commissioner of Income-tax (Appeals)
Income Tax Act, 1961 Income-tax dues 7.39 AY 2013-14 The Income tax Appellate Tribunal
Income Tax Act, 1961 Income-tax dues 27.80 AY 2015-16 The Income tax Appellate Tribunal
Tamil Nadu Value Added Tax Act, 2006, Central Sales Tax Act, 1956
Sales Tax 9.40 2006-07Appellate Deputy Commissioner- Chennai
Sales Tax 10.12 2007-08Appellate Deputy Commissioner- Chennai
Sales Tax 2.68 2010-11 Commercial Tax Offi cer - Chennai
Sales Tax 4.56 2011-12Appellate Deputy Commissioner- Chennai
Sales Tax 16.52 2013-14 High Court of Judicature at Madras
Sales Tax 540.73 2014-15 High Court of Judicature at Madras
Sales Tax 22.14 2015-16Appellate Deputy Commissioner- Chennai
* net of amount paid under protest

14
TVS Upasana Limited
KRM Tower, 1st & 2nd Floor, No. 1, Harrington Road,Chetpet, Chennai 600 031, India
Phone : +91 44 4608 3100Fax : +91 44 4608 3199
B S R & Co. LLPChartered Accountants
Report on the Internal Financial Controls with reference to fi nancial statements under clause (i) of sub-section 3 of section 143 of the Companies Act, 2013 ("the Act")
We have audited the internal fi nancial controls with reference to fi nancial statements of TVS Upasana Limited (“the Company”) as of March 31, 2018 in conjunction with our audit of the Ind AS fi nancial statements of the Company for the year ended on that date.
Management's Responsibility for Internal Financial Controls
The Company's management is responsible for establishing and maintaining internal fi nancial controls based on the internal fi nancial controls with reference to fi nancial statements established by the Company considering the essential components of internal control stated in the Guidance Note on Audit of Internal Financial Controls over Financial Reporting (the "Guidance Note") issued by the Institute of Chartered Accountants of India ('ICAI'). These responsibilities include the design, implementation and maintenance of adequate internal fi nancial controls that were operating effectively as at March 31, 2018 for ensuring the orderly and effi cient conduct of its business, including adherence to company’s policies, the safeguarding of its assets, the prevention and detection of frauds and errors, the accuracy and completeness of the accounting records, and the timely preparation of reliable fi nancial information, as required under the Act.
Auditor’s Responsibility
Our responsibility is to express an opinion on the Company's internal fi nancial controls with reference to fi nancial statements based on our audit. We conducted our audit in accordance with the Guidance Note and the standards on auditing, issued by ICAI and deemed to be prescribed under section 143(10) of the Act, to the extent applicable to an audit of internal fi nancial controls. Those Standards and the Guidance Note require that we comply with ethical requirements and plan and perform the audit to obtain reasonable assurance about whether adequate internal fi nancial controls with reference to fi nancial statements was established and maintained and if such controls operated effectively in all material respects.
Our audit involves performing procedures to obtain audit evidence about the adequacy of the internal fi nancial controls system with reference to fi nancial statements and their operating effectiveness. Our audit of internal fi nancial controls with reference to fi nancial statements included obtaining an understanding of internal fi nancial controls with reference to fi nancial statements, assessing the risk that a material weakness exists, and testing and evaluating the design and operating effectiveness of internal control based on the assessed risk. The procedures selected depend on the auditor's judgment, including the assessment of the risks of material misstatement of the fi nancial statements, whether due to fraud or error.
We believe that the audit evidence we have obtained is suffi cient and appropriate to provide a basis for our audit opinion on the Company’s internal fi nancial controls system with reference to fi nancial statements.
Annexure B to the Independent Auditor’s Report
To the Members of TVS Upasana Limited on the Ind AS fi nancial statements for the year ended March 31, 2018
Meaning of Internal fi nancial controls with reference to fi nancial statements
A company's internal fi nancial control with reference to fi nancial statements is a process designed to provide reasonable assurance regarding the reliability of fi nancial reporting and the preparation of fi nancial statements for external purposes in accordance with generally accepted accounting principles. A company's internal fi nancial controls with reference to fi nancial statements includes those policies and procedures that (1) pertain to the maintenance of records that, in reasonable detail, accurately and fairly refl ect the transactions and dispositions of the assets of the company; (2) provide reasonable assurance that transactions are recorded as necessary to permit preparation of fi nancial statements in accordance with generally accepted accounting principles, and that receipts and expenditures of the company are being made only in accordance with authorisations of management and directors of the company; and (3) provide reasonable assurance regarding prevention or timely detection of unauthorised acquisition, use, or disposition of the company's assets that could have a material effect on the fi nancial statements.
Inherent limitations of internal fi nancial controls with reference to fi nancial statements
Because of the inherent limitations of internal fi nancial controls with reference to fi nancial statements, including the possibility of collusion or improper management override of controls, material misstatements due to error or fraud may occur and not be detected. Also, projections of any evaluation of the internal fi nancial controls with reference to fi nancial statements to future periods are subject to the risk that the internal fi nancial control with reference to fi nancial statements may become inadequate because of changes in conditions, or that the degree of compliance with the policies or procedures may deteriorate.
Opinion
In our opinion, the Company has, in all material respects, an adequate internal fi nancial controls with reference to fi nancial statements and such internal fi nancial controls with reference to fi nancial statements were operating effectively as at March 31, 2018, based on the internal fi nancial controls with reference to fi nancial statements criteria established by the Company considering the essential components of internal control stated in the Guidance Note issued by the ICAI.
for B S R & Co. LLPChartered AccountantsICAI Firm Registration Number: 101248W/W-100022
S SethuramanPartnerMembership No.: 203491
Place : ChennaiDate : April 30, 2018

15
Balance sheet as at March 31, 2018(All amounts are in lakhs of Indian Rupees, except share data and as stated)
Note As at
March 31, 2018
As atMarch 31,
2017ASSETSNon-current assetsProperty, plant and equipment 4 3,391.34 3,195.20Capital work-in-progress 4 2,502.02 672.46Other intangible assets 5 3.70 4.63Financial assets- Investments 6 18.50 18.50- Loans 7 19.14 20.79- Others 8 328.72 329.18Other tax assets, net 9 190.99 192.81Other non-current assets 10 3,166.51 2,588.16
9,620.92 7,021.73Current assetsInventories 11 2,268.76 1,626.53Financial assets- Investments 6 350.85 267.25- Trade receivables 12 3,342.88 2,872.36- Cash and cash equivalents 13 3.38 4.41- Loans 7 11.32 8.74- Others 8 27.28 37.85Other current assets 10 342.14 734.16
6,346.61 5,551.30Total assets 15,967.53 12,573.03
EQUITY AND LIABILITIESEquityEquity share capital 14 1,189.97 1,189.97Other equity 5,214.30 3,860.47Total equity 6,404.27 5,050.44LiabilitiesNon-current liabilitiesFinancial liabilities- Borrowings 16 4,800.00 2,568.52Provisions 17 152.57 113.17Deferred tax liabilities, net 9 230.76 252.63
5,183.33 2,934.32Current liabilitiesFinancial liabilities- Borrowings 16 1,315.65 1,728.37- Trade payables 18 2,142.75 1,437.13- Other fi nancial liabilities 19 365.13 1,265.56Other current liabilities 20 111.56 94.33Provisions 17 19.36 19.19Other tax liabilities, net 9 425.48 43.69
4,379.93 4,588.27Total liabilities 9,563.26 7,522.59Total equity and liabilities 15,967.53 12,573.03Signifi cant accounting policies 3The notes referred to above form an integral part of the fi nancial statements
As per our report of even date attached
for B S R & Co. LLP For and on behalf of the Board of Directors ofChartered Accountants TVS Upasana LimitedICAI Firm registration No.: 101248W/W-100022 CIN: U65991TN1992PLC022619
S Sethuraman Suresh Krishna Arundathi KrishnaPartner Chairman Managing DirectorMembership No. 203491 DIN : 00046919 DIN: 00270935
R Krishnan S Meenakshisundaram Chief Financial Offi cer & DirectorPlace : Chennai Company Secretary DIN: 00513901Date : April 30, 2018 ACS Membership No.: 9994
Statement of profi t and loss for the year ended March 31, 2018
(All amounts are in lakhs of Indian Rupees, except share data and as stated)
Note Year ended
March 31, 2018
Year endedMarch 31,
2017
INCOME
Revenue from operations 21 15,541.17 14,793.62
Other income 22 233.72 65.60
Total Income 15,774.89 14,859.22
EXPENSES
Cost of materials consumed 23 5,812.75 4,804.44
Changes in inventories of fi nished goods and work-in-progress 24 (369.54) 336.07
Excise duty 291.91 1,220.72
Employee benefi ts expense 25 1,702.90 1,499.98
Finance costs 26 313.64 263.63
Depreciation and amortisation expense 27 428.07 429.51
Other expenses 28 5,044.93 4,610.65
Total expenses 13,224.66 13,165.00
Profi t before exceptional items and tax 2,550.23 1,694.20
Exceptional items - -
Profi t before tax 2,550.23 1,694.20
Tax expense
- Current tax 9 820.00 540.00
- Deferred tax (20.56) 46.89
- Tax relating to earlier years 6.27 0.32
Total tax expense 805.71 587.21
Profi t for the year 1,744.52 1,106.99
Other comprehensive incomeItems that will not be reclassifi ed to profi t or loss(i) Re-measurement loss on defi ned
benefi t plans (3.79) (10.05)
(ii) Income tax effect on above 1.31 5.88
Total other comprehensive income (2.48) (4.17)Total comprehensive income for the year 1,742.04 1,102.82
(Comprising profi t and other comprehensive income for the year)Earnings per equity share 15
Basic (in `) 14.66 9.30
Diluted (in `) 14.66 9.30
Signifi cant accounting policies 3
The notes referred to above form an integral part of the fi nancial statements

16
TVS Upasana Limited
As per our report of even date attached
for B S R & Co. LLP For and on behalf of the Board of Directors ofChartered Accountants TVS Upasana LimitedICAI Firm registration No.: 101248W/W-100022 CIN: U65991TN1992PLC022619
S Sethuraman Suresh Krishna Arundathi KrishnaPartner Chairman Managing DirectorMembership No. 203491 DIN : 00046919 DIN: 00270935
R Krishnan S Meenakshisundaram Chief Financial Offi cer & DirectorPlace : Chennai Company Secretary DIN: 00513901Date : April 30, 2018 ACS Membership No.: 9994
Statement of changes in equity for the year ended March 31, 2018
(All amounts are in lakhs of Indian Rupees, except share data and as stated)
(a) Equity share capital
Particulars Note Amount
Balance as at April 1, 2016 14A 1,189.97
Changes in equity share capital during the year -
Balance as at March 31, 2017 14A 1,189.97
Changes in equity share capital during the year -
Balance as at March 31, 2018 14A 1,189.97
(b) Other equity
Particulars
Reserves and surplus
Items of other compre-hensive income
Total
Deemed Equity
Retained Earnings
Re-measure-ment gain on defi ned
benefi t plan, net of
taxBalances as at April 1, 2016 - 2,810.92 (53.25) 2,757.67
Profi t for the year - 1,106.97 - 1,106.97
Other comprehensive income for the year - - (4.17) (4.17)
Balance as at March 31, 2017 - 3,917.89 (57.42) 3,860.47
Profi t for the year - 1,744.52 - 1,744.52
Other comprehensive income for the year - - (2.48) (2.48)
Fair value of fi nance guarantee given by parent company
41.46 - - 41.46
Dividends (refer note 14B(i)) - (429.67) - (429.67)
Balance as at March 31, 2018 41.46 5,232.74 (59.90) 5,214.30
Statement of cash fl ows for the year ended March 31, 2018(All amounts are in lakhs of Indian Rupees, except share data and as stated)
Year ended March 31,
2018
Year ended March 31,
2017Cash fl ows from operating activitiesProfi t for the year 2,550.23 1,694.20Adjustments for:Fair value gain on fi nancial instrumentsmeasured at fair value through profi t or loss (83.59) (47.86)
Depreciation and amortisation expense 428.07 429.51Finance costs 313.64 230.01Interest income (16.61) (16.01)Loss on sale of property, plant and equipment 13.06 4.50Financial guarantee expenses, net 2.12 -Dividend income (0.93) (0.58)Unrealised foreign exchange (gain)/loss (50.70) 64.68
3,155.29 2,358.46Working capital adjustments(Increase)/decrease in inventories (642.23) 460.49Increase in fi nancial liabilities 862.60 208.87Increase in fi nancial assets (407.82) (133.57)Increase in non fi nancial liabilities 52.98 5.57Decrease/(increase) in other non fi nancial assets 414.02 (2,676.14)Cash generated from operating activities 3,434.84 223.68Income tax paid, net (424.36) (486.82)Net cash from/(used in) operating activities (A) 3,010.48 (263.14)
Cash fl ow from investing activitiesAcquisition of property, plant and equipment(including capital work-in-progress and capital advances)
(3,045.26) (1,570.39)
Proceeds from sale of property, plant and equipment 0.06 0.67Acquisition of investments - (18.50)Proceeds from sale of investments - 24.01Dividend received 0.93 0.58Interest received 16.61 16.01Net cash used in investing activities (B) (3,027.66) (1,547.62)Cash fl ow from fi nancing activitiesProceeds from borrowings 1,653.66 3,729.64Repayment of borrowings (900.00) (1,696.50)Interest paid (307.84) (220.33)Dividend paid (including dividend distribution tax) (429.67) -Net cash from fi nancing activities (C) 16.15 1,812.81Net (decrease)/increase in cash and cash equivalents (A+B+C) (1.03) 2.05
Cash and cash equivalents at the beginning of the year 4.41 2.36
Cash and cash equivalents at the year end 3.38 4.41Reconciliation of the cash and cash equivalents as per the cash fl ow statementCash on hand 0.74 1.06Balances with banks in current accounts 2.64 3.35Cash and cash equivalents 3.38 4.41Signifi cant accounting policies 3The notes referred to above form an integral part of the fi nancial statements
As per our report of even date attached
for B S R & Co. LLP For and on behalf of the Board of Directors ofChartered Accountants TVS Upasana LimitedICAI Firm registration No.: 101248W/W-100022 CIN: U65991TN1992PLC022619
S Sethuraman Suresh Krishna Arundathi KrishnaPartner Chairman Managing DirectorMembership No. 203491 DIN : 00046919 DIN: 00270935
R Krishnan S Meenakshisundaram Chief Financial Offi cer & DirectorPlace : Chennai Company Secretary DIN: 00513901Date : April 30, 2018 ACS Membership No.: 9994

17
1. Corporate information
TVS Upasana Limited (“TUL” or ‘’the Company’’) is incorporated in India and is a subsidiary of Sundram Fasteners Limited (SFL). The registered offi ce of the Company is situated at No. 98-A, VII Floor, Dr. Radhakrishnan Salai, Mylapore, Chennai 600 004. The Company manufactures spokes and nipples, tools, small screws, dowel, kits and cold extrusion components.
2. Basis of preparation
2.1 Statement of compliance
These fi nancial statements of the Company have been prepared in accordance with Indian Accounting Standards (Ind AS) as per the Companies (Indian Accounting Standards) Rules, 2015 notifi ed under Section 133 of Companies Act, 2013, (the ‘Act’) and other relevant provisions of the Act.
The fi nancial statements for the year ended March 31, 2018 (including comparatives) are authorised by the Board on April 30, 2018.
Details of the Company’s accounting policies are included in note 3.
2.2 Functional and presentation currency
These fi nancial statements are presented in Indian Rupees which is also the Company’s functional currency. All amounts have been presented in lakhs of Indian Rupees (Rs.), except share data and as otherwise stated.
2.3 Basis of measurement
The fi nancial statements have been prepared on the historical cost basis except for the following items;
Items Measurement basisCertain fi nancial assets and liabilities
Fair value
Net defined benefit (asset)/ liability
Fair value of plan assets less present value of defi ned benefi t obligations
2.4 Use of estimates and judgments
In preparing these financial statements, management has made judgements, estimates and assumptions that affect the application of accounting policies and the reported amounts of assets, liabilities, income and expenses. Actual results may differ from these estimates.
Estimates and underlying assumptions are reviewed on an ongoing basis. Revisions to estimates are recognised prospectively.
Signifi cant management judgment
Information about judgements made in applying accounting policies that have the most signifi cant effects on the amounts recognised in the fi nancial statements is included in the following notes:
- Note 33 leases: whether an arrangement contains a lease; and
- Note 33 lease classifi cation
Assumptions and estimation uncertainty
Information about estimates and assumptions that have the most signifi cant effect on recognition and measurement of assets, liabilities, income and expenses is mentioned below. Actual results may be different from these estimates.
2.4.1 Recognition of deferred tax assets:
The extent to which deferred tax assets can be recognized is based on an assessment of the probability that future taxable income will be available against which the deductible temporary differences and tax loss carry-forwards can be utilized. In addition, careful judgment is exercised in assessing the impact of any legal or economic limits or uncertainties in various tax issues. (also refer note 9)
2.4.2 Impairment of fi nancial and non-fi nancial assets
In assessing impairment, management has estimated economic use of assets, the recoverable amount of each asset or cash- generating units based on expected future cash fl ows and use an interest rate to discount them. Estimation of uncertainty relates to assumptions about future operating cash fl ows and determination of a suitable discount rate. (also refer note 3.7)
2.4.3 Useful lives of depreciable assets
Management reviews estimate of useful lives of depreciable assets at each reporting date, based on expected utility of assets. Uncertainties in these estimates relate to technological obsolescence that may change utility of assets (also refer note 3.2.5)
2.4.4 Inventories
Management has carefully estimated the net realizable values of inventories, taking into account the most reliable evidence available at each reporting date. The future realization of these inventories may be affected by market-driven changes.
2.4.5 Defi ned benefi t obligation (DBO)
The actuarial valuation of the DBO is based on a number of critical underlying management’s assumptions such as standard rates of infl ation, mortality, discount rate and anticipation of future salary increases. Variation in these assumptions may signifi cantly impact the DBO amount and the annual defi ned benefi t expenses (also refer note 17)
2.4.6 Recognition and measurement of provisions and contingencies:
Key assumptions about the likelihood and magnitude of an outfl ow of resources (also refer note 3.10 and note 30).
2.5 Measurement of fair values
A number of the Company’s accounting policies and disclosures require the measurement of fair values, for both fi nancial and non-fi nancial assets and liabilities. Fair values are categorised into different levels in a fair value hierarchy based on the inputs used in the valuation techniques as follows.
Level 1: quoted prices (unadjusted) in active markets for identical assets or liabilities.
NOTES TO FINANCIAL STATEMENTS FOR THE YEAR ENDED 31ST MARCH, 2018(All amounts are in lakhs of Indian Rupees, except share data and as stated)
NOTES TO FINANCIAL STATEMENTS FOR THE YEAR ENDED 31ST MARCH, 2018 (Contd.)(All amounts are in lakhs of Indian Rupees, except share data and as stated)

18
TVS Upasana Limited
Level 2: inputs other than quoted prices included in Level 1 that are observable for the asset or liability, either directly (i.e. as prices) or indirectly (i.e. derived from prices).
Level 3: inputs for the asset or liability that are not based on observable market data (unobservable inputs).
When measuring the fair value of an asset or a liability, the Company uses observable market data as far as possible. The inputs used to measure the fair value of assets or a liability fall into different levels of the fair value hierarchy. Accordingly, the fair value measurement is categorised in its entirety in the same level of the fair value hierarchy as the low level input that is signifi cant to the entire measurement.
Management uses various valuation techniques to determine fair value of fi nancial instruments (where active market quotes are not available). This involves developing estimates and assumptions consistent with how market participants would price the instrument. Management based on its assumptions on observable data as far as possible but where it not available, the management uses the best information available. Estimated fair values may vary from the actual prices that would be achieved in an arm’s length transaction at the reporting date (also refer note 29). The Company recognises transfers between levels of the fair value hierarchy at the end of the reporting period during which the change has occurred.
2.6 Current and non-current classifi cation
All assets and liabilities have been classifi ed as current or non-current as per the Company's normal operating cycle and other criteria set out in the Schedule III to the Companies Act, 2013. Based on the nature of products and time between the acquisition of assets for processing and their realization in cash and cash equivalents, the Company has ascertained its operating cycle as twelve months for the purpose of current or non-current classifi cation of assets and liabilities.
3. Summary of accounting policies
The fi nancial statements have been prepared applying signifi cant accounting policies and measurement bases summarized below:
1. Revenue recognition
1.1 Sale of products:
Revenue from the sale of goods in the course of ordinary activities is measured at the fair value of the consideration received or receivable, net of returns, trade discounts and volume rebates. This inter alia involves discounting of the consideration due to the present value if payment extends beyond normal credit terms. It includes excise duty but excludes value added tax, sales tax, service tax and goods and service tax. Revenue is recognised when the signifi cant risks and rewards of ownership have been transferred to the buyer, recovery of the consideration is probable, the associated costs and possible return of goods can be estimated reliably, there is no continuing effective control over, or managerial involvement with, the goods, and the amount of revenue can be measured reliably. The timing of transfers of risks and rewards varies depending on the individual terms of sale.
1.2 Revenue from Services:
Revenue from services rendered is recognised in profi t or loss in proportion to the stage of completion of the transaction at the reporting date based on agreements with customer. The stage of completion is assessed by reference to surveys of work performed.
1.3 Interest and dividend income:
Dividend income is recognised in statement of profi t or loss on the date on which the Company’s right to receive payment is established.
Interest income or expense is recognised using the effective interest method. The ‘effective interest rate’ is the rate that exactly discounts estimated future cash payments or receipts through the expected life of fi nancial instrument to:
- the gross carrying amount of the fi nancial asset; or
- the amortised cost of the fi nancial liability.
In calculating interest income and expense, the effective interest rate is applied to the gross carrying amount of the asset (when the asset is not credit-impaired) or to the amortised cost of the liability.
However, for fi nancial assets that have become credit-impaired subsequent to initial recognition, interest income is calculated by applying the effective interest rate to the amortised cost of the fi nancial asset. If the asset is no longer credit-impaired, then the calculation of interest income reverts to the gross basis.
2. Property, plant and equipment
2.1 Recognition and measurement
Free hold land is stated at historical cost. Items of property, plant and equipment are measured at cost, which includes capitalised borrowing costs, less accumulated depreciation and accumulated impairment losses, if any. Cost of an item of property, plant and equipment comprises:
a. purchase price, including import duties and non-refundable taxes on purchase (goods and service tax, value added tax), after deducting trade discounts and rebates.
b. any directly attributable cost of bringing the item to its working condition for its intended use estimated costs of dismantling and removing the item and restoring the site on which it is located.
c. The cost of a self-constructed item of property, plant and equipment comprises the cost of materials and direct labour, any other costs directly attributable to bringing the item to working condition for its intended use, and estimated costs of dismantling and removing the item and restoring the site on which it is located.
Any gain/ loss on disposal of an item of property, plant and equipment is recognised in profi t or loss.
2.2 Subsequent expenditure
Subsequent costs are included in asset’s carrying amount or recognised as a separate asset, as appropriate, only when it is probable that future economic benefi ts associated with the item will fl ow to the Company.
NOTES TO FINANCIAL STATEMENTS FOR THE YEAR ENDED 31ST MARCH, 2018 (Contd.)(All amounts are in lakhs of Indian Rupees, except share data and as stated)
NOTES TO FINANCIAL STATEMENTS FOR THE YEAR ENDED 31ST MARCH, 2018 (Contd.)(All amounts are in lakhs of Indian Rupees, except share data and as stated)
19
2.3 Component accounting
The component of assets are capitalized only if the life of the components vary signifi cantly and whose cost is signifi cant in relation to the cost of the respective asset, the life of the component in assets are determined based on technical assessment and past history of replacement of such components in the assets. The carrying amount of any component accounted for as separate asset is derecognised when replaced.
2.4 Depreciation:
a. Depreciation is recognized on a straight-line basis, over useful life of buildings and other equipment as prescribed under Schedule II of Companies Act, 2013, except in respect of certain assets, where useful life is different from those prescribed under Schedule II.
b. Depreciation on property, plant and equipment is charged over the estimated useful life of the asset or part of the asset (after considering double/triple shifts) as evaluated on technical assessment on straight line method, in accordance with Part A of Schedule II to the Companies Act, 2013.
c. The estimated useful life of the property, plant and equipment on technical assessment followed by the Company is furnished below:
Asset categoryManagement estimate of
useful life (in years)Buildings 3-60Plant and machinery 8-30Furniture and fi xtures 8-10Offi ce equipment 3-10Vehicles 8-10
d. The residual value for all the above assets are retained at 5% of the cost.
e. Depreciation method, useful lives and residual values are reviewed at each fi nancial year-end and adjusted if necessary, for each reporting period.
f. On property, plant and equipment added/ disposed off during the year, depreciation is charged on pro-rata basis for the period for which the asset was purchased and used.
3. Investment property
Investment property is property held either to earn rental income or for capital appreciation or for both, but not for sale in the ordinary course of business, use in the production or supply of goods or services or for administrative purposes. Upon initial recognition, an investment property is measured at cost. Subsequent to initial recognition, investment properties are stated at cost less accumulated depreciation.
The Company has depreciated assets based on Straight line method as per Schedule II to the Companies Act 2013. Any gain or loss on disposal of an investment property is recognised in the statement of profi t and loss.
4. Inventories
Inventories are valued at lower of cost and net realizable value including necessary provision for obsolescence. Net realisable value is the estimated selling price in the ordinary course of
business, less the estimated cost of completion and selling expenses. The comparison of cost and net realisable value is made on an item by item basis. The cost of raw materials, components, consumable stores and spare parts are determined using the weighted average method and includes freight, taxes and duties, net of duty credits wherever applicable. Finished goods, including stock in trade and work in progress are valued at lower of cost and net realisable value. Cost includes all direct costs including excise duty and applicable manufacturing overheads incurred in bringing them to their present location and condition.
4.1 Raw materials
Raw materials are valued at cost of purchase net of duties and includes all expenses incurred in bringing such materials to the location of its use.
4.2 Work-in-process and fi nished goods
Work-in-process and fi nished goods include conversion costs in addition to the landed cost of raw materials.
4.3 Stores, spares and tools
Stores, spares and tools cost includes cost of purchase and other costs incurred in bringing the inventories to their present location and condition.
5. Leases
5.1 Determining whether an arrangement contains a lease
At inception of an arrangement, it is determined whether the arrangement is or contains a lease.
At inception or on reassessment of arrangement that contains a lease, payments and other consideration required by such an arrangement are separated into those for lease and those for other elements on the basis of their relative fair values. If it is concluded for a fi nance lease that it is impracticable to separate the payments reliably, then an asset and a liability are recognised at an amount equal to the fair value of the underlying asset. The liability is reduced as payments are made and an imputed fi nance cost on the liability is recognised using the incremental borrowing rate.
5.2 Assets held under leases
i. Assets leased out
As per terms of lease agreements there is no substantial transfer of risk and reward of the property to the lessee. Accordingly such leased out assets are treated as belonging to the Company.
ii. Assets taken on lease
As per the terms of lease agreements there is no substantial transfer of risk and reward of the property to the Company and hence such leases are treated as operating lease.
The payments on operating lease are recognised in profi t or loss on a straight-line basis over the term of the lease unless such payments are structured to increase in line with expected general infl ation to compensate for the lessor’s expected infl ationary cost increases. Associated costs, such as maintenance and insurance, are expensed.
NOTES TO FINANCIAL STATEMENTS FOR THE YEAR ENDED 31ST MARCH, 2018 (Contd.)(All amounts are in lakhs of Indian Rupees, except share data and as stated)
NOTES TO FINANCIAL STATEMENTS FOR THE YEAR ENDED 31ST MARCH, 2018 (Contd.)(All amounts are in lakhs of Indian Rupees, except share data and as stated)

20
TVS Upasana Limited
5.3 Lease payments
Payments made under operating leases are generally recognised in profi t or loss on a straight-line basis over the term of the lease unless such payments are structured to increase in line with expected general infl ation to compensate for the lessor’s expected infl ationary cost increases. Lease incentives received are recognised as an integral part of the total lease expense over the term of the lease.
6. Financial instruments
6.1 Recognition and initial measurement:
Trade receivables are initially recognised when they are originated.
All other fi nancial assets and fi nancial liabilities are recognized when the Company becomes a party to the contractual provisions of the fi nancial instrument and are measured initially at fair value adjusted for transaction costs, except for those carried at fair value through profi t or loss which are measured initially at fair value.
The 'trade payable' is in respect of the amount due on account of goods purchased in the normal course of business. They are recognised at their transaction and services availed value if the transaction do not contain signifi cant fi nancing component.
6.2 Financial assets
6.2.1 Classifi cation and subsequent measurement of fi nancial assets:
For the purpose of subsequent measurement, fi nancial assets are classifi ed and measured based on the entity's business model for managing fi nancial asset and contractual cash fl ow characteristics of fi nancial asset at:
a. Those to be measured at Fair value through other comprehensive Income (FVTOCI)
b. Those to be measured at Fair value through profi t and loss (FVTPL) and;
c. Those measured at amortized cost.
i. Financial assets at amortised cost
Includes assets that are held within a business model where objective is to hold fi nancial assets to collect contractual cash fl ows and contractual terms gives rise on specifi ed dates to cash fl ows that are solely payments of principal and interest on principal amount outstanding.
These assets are measured subsequently at amortized cost using the effective interest method. Interest income, foreign exchange gains and losses, if any and impairment are recognised in profi t or loss. Any gain or loss on de recognition is recognised in statement of profi t and loss.
ii. Financial assets at Fair Value Through Other Comprehensive Income (FVTOCI)
Includes assets that are held within a business model where objective is both collecting contractual cash fl ows and selling fi nancial assets along with contractual terms giving rise on specifi ed dates to cash fl ows that are
solely payments of principal and interest on principal amount outstanding. The Company has made an irrevocable election to present in other comprehensive income changes in the fair value of an investment in an equity instrument that is not held for trading. This selection is made on an instrument-by instrument basis.
Dividends are recognised as income in profi t or loss unless it clearly represents a recovery of part of cost of the investment. Other net gains and losses are recognised in OCI and are not reclassifi ed to profi t or loss.
The fair values of fi nancial assets in this category are determined by reference to active market transactions or using a valuation technique where no active market exists.
iii. Financial assets at Fair Value Through Profi t or Loss (FVTPL)
Financial assets at FVTPL include fi nancial assets that are designated at FVTPL upon initial recognition and fi nancial assets that are not measured at amortised cost or FVTOCI. All derivative fi nancial instruments fall into this category, except for those designated and effective as hedging instruments, for which the hedge accounting requirements apply. Assets in this category are measured at fair value with gains or losses recognized in profi t or loss. The fair values of fi nancial assets in this category are determined by reference to active market transactions or using a valuation technique where no active market exists.
The loss allowance in respect of FVTPL at each reporting period is evaluated based on expected credit losses for next 12 months and credit risk exposure. The Company also measures loss allowance for fi nancial instrument at an amount equal to lifetime expected credit losses if the credit risk on that fi nancial instrument has increased signifi cantly since initial recognition. The allowance shall be recognised in profi t and loss.
6.2.2 Derivative fi nancial instruments and hedge accounting Derivative fi nancial instruments are accounted for at FVTPL
except for derivatives designated as hedging instruments in cash fl ow hedge relationships, which require a specifi c accounting treatment. To qualify for hedge accounting, the hedging relationship must meet several strict conditions with respect to documentation, probability of occurrence of the hedged transaction and hedge effectiveness. These arrangements have been entered into to mitigate currency exchange risk arising from certain legally binding sales and purchase orders denominated in foreign currency. For the reporting periods under review, the Company has not designated any forward currency contracts as hedging instruments.
6.2.3 De-recognition of fi nancial assets A fi nancial asset is derecognised only when; a. The Company has transferred the rights to receive cash
fl ows from the fi nancial asset or b. The Company retains the contractual rights to receive the
cash fl ows of the fi nancial asset, but expects a contractual obligation to pay the cash fl ows to one or more recipients.
NOTES TO FINANCIAL STATEMENTS FOR THE YEAR ENDED 31ST MARCH, 2018 (Contd.)(All amounts are in lakhs of Indian Rupees, except share data and as stated)
NOTES TO FINANCIAL STATEMENTS FOR THE YEAR ENDED 31ST MARCH, 2018 (Contd.)(All amounts are in lakhs of Indian Rupees, except share data and as stated)

21
Where entity has transferred an asset, the Company examines and assesses whether it has transferred substantially all risk and rewards of ownership of fi nancial asset. In such cases, fi nancial asset is derecognised. Where entity has not transferred substantially all risks and rewards of ownership of fi nancial asset, such fi nancial asset is not derecognised.
Where the entity has neither transferred a financial asset nor retains substantially all risk and rewards of ownership of the fi nancial asset, the fi nancial asset is derecognised, if the Company has not retained control of the fi nancial asset. Where the company retains control of the fi nancial asset is continued to be recognised to the extent of continuing involvement in the fi nancial asset.
6.3 Financial Liabilities
6.3.1 Classifi cation of fi nancial liabilities
Financial liabilities are classifi ed, at initial recognition, as fi nancial liabilities at fair value through profi t or loss or at amortised cost. The Company’s fi nancial liabilities include borrowings, trade and other payables and derivative fi nancial instruments.
6.3.2 Subsequent measurement
Financial liabilities are measured subsequently at amortized cost using the effective interest method except for derivatives and fi nancial liabilities designated at FVTPL, which are carried subsequently at fair value with gains or losses recognized in profi t or loss.
All interest-related charges and, if applicable, changes in an instrument’s fair value that are reported in profi t or loss are included within fi nance costs or fi nance income.
6.3.3 De recognition
A fi nancial liability is derecognised when the obligation under the liability is discharged or cancelled or has expired. When an existing fi nancial liability is replaced by another from the same lender on substantially different terms, or the terms of an existing liability are substantially modifi ed, such an exchange or modifi cation is treated as the de recognition of the original liability and the recognition of a new liability. The difference in the respective carrying amounts is recognised in the statement of profi t or loss.
6.4 Offsetting
Financial assets and fi nancial liabilities are offset and the net amount presented in the balance sheet when, and only when, the Company currently has a legally enforceable right to set off the amounts and it intends either to settle them on a net basis or to realise the asset and settle the liability simultaneously.
7. Impairment 7.1 Impairment of fi nancial instruments The Company recognise loss allowance for expected credit loss
on fi nancial assets measured at amortised cost.
At each reporting date, the Company assesses whether fi nancial assets carried at amortised cost are credit impaired. A fi nancial asset is ‘credit impaired’ when one or more events that have a detrimental impact on the estimated future cash fl ows of the fi nancial asset have occurred.
Evidence that a fi nancial asset is credit - impaired includes the following observable data:
- signifi cant fi nancial diffi culty;
- a breach of contract such as a default or being past due;
- the restructuring of a loan or advance by the Company on terms that the Company would not consider otherwise;
- it is probable that the borrower will enter bankruptcy or other fi nancial reorganisation; or
- the disappearance of an active market for a security because of fi nancial diffi culties.
Loss allowances for trade receivables are measured at an amount equal to lifetime expected credit losses. Lifetime expected credit losses are credit losses that result from all possible default events over expected life of fi nancial instrument.
The maximum period considered when estimating expected credit losses is the maximum contractual period over which the Company is exposed to credit risk.
When determining whether the credit risk of a fi nancial asset has increased signifi cantly since initial recognition and when estimating expected credit losses, the Company considers reasonable and supportable information that is relevant and available without undue cost or effort. This includes both quantitative and qualitative information and analysis, based on the Company’s historical experience and informed credit assessment and including forward looking information. The Company assumes that credit risk on a fi nancial asset has increased signifi cantly if it is past due.
The Company considers a fi nancial asset to be in default when:
- the recipient is unlikely to pay its credit obligations to the Company in full, without recourse by the Company to actions such as realising security (if any is held); or
- the fi nancial asset is past due.
7.1.1 Measurement of expected credit losses
Expected credit losses are a probability weighted estimate of credit losses. Credit losses are measured as the present value of all cash shortfalls (i.e. the difference between the cash fl ows due to the Company in accordance with the contract and the cash fl ows that the Company expects to receive).
7.1.2 Presentation of allowance for expected credit losses in the balance sheet
Loss allowances for fi nancial assets measured at amortised cost are deducted from the gross carrying amount of the assets.
7.1.3 Write-off
The gross carrying amount of a fi nancial asset is written off (either partially or in full) to the extent that there is no realistic prospect of recovery. This is generally the case when the Company determines that the debtor does not have assets or sources of income that could generate suffi cient cash fl ows to repay the amounts subject to the write off. However, fi nancial assets that are written off could still be subject to enforcement activities in order to comply with the Company’s procedures for recovery of amounts due.
NOTES TO FINANCIAL STATEMENTS FOR THE YEAR ENDED 31ST MARCH, 2018 (Contd.)(All amounts are in lakhs of Indian Rupees, except share data and as stated)
NOTES TO FINANCIAL STATEMENTS FOR THE YEAR ENDED 31ST MARCH, 2018 (Contd.)(All amounts are in lakhs of Indian Rupees, except share data and as stated)

22
TVS Upasana Limited
7.2 Impairment of non-fi nancial assets
The Company’s non-fi nancial assets, other than inventories and deferred tax assets, are reviewed at each reporting date to determine whether there is any indication of impairment. If any such indication exists, then the asset’s recoverable amount is estimated. Goodwill is tested annually for impairment.
For impairment testing, assets that do not generate independent cash infl ows are grouped together into cash-generating units (CGUs). Each CGU represents the smallest group of assets that generates cash infl ows that are largely independent of the cash infl ows of other assets or CGUs.
Goodwill arising from a business combination is allocated to CGUs or groups of CGUs that are expected to benefi t from the synergies of the combination.
The recoverable amount of a CGU (or an individual asset) is the higher of its value in use and its fair value less costs to sell. Value in use is based on the estimated future cash fl ows, discounted to their present value using a pre-tax discount rate that refl ects current market assessments of the time value of money and the risks specifi c to the CGU (or the asset).
The Company’s corporate assets (e.g., central offi ce building for providing support to various CGUs) do not generate independent cash infl ows. To determine impairment of a corporate asset, recoverable amount is determined for the CGUs to which the corporate asset belongs.
An impairment loss is recognised if the carrying amount of an asset or CGU exceeds its estimated recoverable amount. Impairment losses are recognised in the statement of profi t and loss. Impairment loss recognised in respect of a CGU is allocated fi rst to reduce the carrying amount of any goodwill allocated to the CGU, and then to reduce the carrying amounts of the other assets of the CGU (or group of CGUs) on a pro rata basis.
An impairment loss in respect of goodwill is not subsequently reversed. In respect of other assets for which impairment loss has been recognised in prior periods, the Company reviews at each reporting date whether there is any indication that loss has decreased or no longer exists. An impairment loss is reversed if there has been a change in estimates used to determine recoverable amount. Such a reversal is made only to an extent that asset’s carrying amount does not exceed carrying amount that would have been determined, net of depreciation/ amortisation, if no impairment loss was recognised.
8. Income Taxes
Income tax comprises current and deferred tax. It is recognised in profi t or loss except to the extent that it relates to a business combination or to an item recognised directly in equity or in other comprehensive income.
Current tax comprises the expected tax payable or receivable on the taxable income or loss for the year and any adjustment to the tax payable or receivable in respect of previous years. The amount of current tax refl ects the best estimate of the tax amount expected to be paid or received after considering the uncertainty, if any, related to income taxes. Calculation of current tax is based on tax rates in accordance with tax laws that have been enacted or substantively enacted by the end of
the reporting period. Current tax assets and current tax liabilities are offset only if there is a legally enforceable right to set off the recognised amounts, and it is intended to realise the asset and settle the liability on a net basis or simultaneously
Deferred tax is recognised in respect of temporary difference between carrying amount of assets and liabilities for fi nancial reporting purposes and corresponding amounts used for tax purposes. Deferred tax is also recognised in respect of carried forward tax losses and tax credits. Deferred tax is not recognised for:
- temporary differences arising on the initial recognition of assets or liabilities in a transaction that is not a business combination and that affects neither accounting nor taxable profi t or loss at the time of the transaction;
- taxable temporary differences arising on the initial recognition of goodwill.
Deferred tax assets are recognised to the extent that it is probable that future taxable profi ts will be available against which they can be used. The existence of unused tax losses is strong evidence that future taxable profi t may not be available. Therefore, in case of a history of recent losses, the Company recognises a deferred tax asset only to the extent that it has suffi cient taxable temporary differences or there is convincing other evidence that suffi cient taxable profi t will be available against which such deferred tax asset can be realised. Deferred tax assets – unrecognised/ recognised, are reviewed at each reporting date and are recognised/ reduced to an extent that it is probable/ no longer probable respectively that related tax benefi t will be realised.
Deferred tax is measured at the tax rates that are expected to apply to the period when the asset is realised or the liability is settled, based on the laws that have been enacted or substantively enacted by the reporting date. The measurement of deferred tax refl ects the tax consequences that would follow from the manner in which the Company expects, at the reporting date, to recover or settle the carrying amount of its assets and liabilities.
Deferred tax assets and liabilities are offset if there is a legally enforceable right to offset current tax liabilities and assets, and they relate to income taxes levied by same tax authority on same taxable entity, or on different tax entities, but they intend to settle current tax liabilities and assets on a net basis or its tax assets and liabilities will be realised simultaneously.
9. Post-employment benefi ts and short-term employee benefi ts
9.1 Short term employee benefi t obligations:
Short term employee benefi t obligations are those that are expected to be settled within 12 months after end of reporting period. They are recognised up to end of the reporting period at amounts expected to be paid at the time of settlement.
With respect to bonus, the Company recognises a liability and an expense for bonus. The Company recognises a provision where contractually obliged or where there is a past practice that has created a constructive obligation.
9.2 Other long term employee benefi t obligations:
These obligation represent liability towards compensated absences that are not expected to be settled wholly within
NOTES TO FINANCIAL STATEMENTS FOR THE YEAR ENDED 31ST MARCH, 2018 (Contd.)(All amounts are in lakhs of Indian Rupees, except share data and as stated)
NOTES TO FINANCIAL STATEMENTS FOR THE YEAR ENDED 31ST MARCH, 2018 (Contd.)(All amounts are in lakhs of Indian Rupees, except share data and as stated)

23
a period of 12 months after end of the period in which the employees render the related service. They are, therefore, recognised and provided for at the present value of the expected future payments to be made in respect of services provided by employee up to the end of reporting period using the projected unit credit method. The benefits are discounted using the market yields at the end of the reporting period that have terms approximating to the terms of the related obligation.
The obligations are presented as current liabilities in balance sheet if entity does not have an unconditional right to defer settlement for at least twelve months after reporting period, regardless of when the actual settlement is expected to occur.
9.3 Post-employment obligation:
The Company operates the post-employment schemes comprising of defi ned benefi t and contribution plans and such as gratuity and group terminal benefi t plan, provident fund contributions for its eligible employees.
9.3.1 Gratuity:
The liability or asset recognised in the balance sheet in respect of these defi ned benefi t obligation is the present value of the defi ned benefi t obligation at the end of the reporting period less the fair value of plan assets. The defi ned benefi t obligation is calculated annually by an Independent actuary using projected unit credit method. The present value of defi ned benefi t obligation is determined by discounting the estimated future cash outfl ows by reference to market yields at the end of reporting period on the government bonds that have terms approximating to the terms of the related obligation.
The net interest cost is calculated by applying the discount rate to the net balance of the defi ned benefi t obligation and the fair value of plan assets. The cost is included in employee benefi t expenses in the Statement of Profi t and Loss. Re-measurement gains and losses arising from experience adjustments and changes in actuarial assumptions are recognised in the period in which they occur, directly in other comprehensive income. They are included in retained earnings in the statement of changes in equity and in the balance sheet. Changes in present value of the defi ned benefi t obligation resulting from plan amendment or curtailment are recognised immediately in the statement of profi t or loss or service cost.
9.3.2 Provident Fund:
The eligible employees of the Company are entitled to receive benefi ts in respect of provident fund, partly a defi ned benefi t obligation and partly a defi ned contribution plan, in which both employees and the Company make monthly contributions at a specifi ed percentage of the covered employee’s salary. The provident fund contributions are made partly to employee provident fund organisation. The Company is liable for annual contributions
10. Provisions, contingent liabilities and contingent assets
10.1 Provisions:
A provision is recognised if, as a result of a past event, the Company has a present legal or constructive obligation that can be estimated reliably, and it is probable that an outfl ow
of economic benefi ts will be required to settle the obligation. Provisions are determined by discounting the expected future cash fl ows (representing the best estimate of the expenditure required to settle the present obligation at the balance sheet date) at a pre-tax rate that refl ects current market assessments of the time value of money and the risks specifi c to the liability. The unwinding of the discount is recognised as fi nance cost. Expected future operating losses are not provided for.
10.1.1 Provision for warranties
A provision for warranties is recognised when the underlying products or services are sold. The provision is based on technical evaluation, historical warranty data and a weighting of all possible outcomes by their associated probabilities.
10.1.2 Onerous contract
A contract is considered to be onerous when the expected economic benefi ts to be derived by the Company from the contract are lower than the unavoidable cost of meeting its obligations under the contract. The provision for an onerous contract is measured at the present value of the lower of the expected cost of terminating the contract and the expected net cost of continuing with the contract. Before such a provision is made, the Company recognises any impairment loss on the assets associated with that contract.
10.2 Contingent liabilities:
Whenever there is possible obligation that arises from past events and whose existence will be confi rmed only by the occurrence or non-occurrence of one or more uncertain future events not wholly within the control of the entity or a present obligation that arises from past events but is not recognised because (a) it is not probable that an outfl ow of resources embodying economic benefi ts will be required to settle the obligation; or (b) the amount of the obligation cannot be measured with suffi cient reliability are considered as contingent liability.
10.3 Contingent assets:
The Company does not recognise contingent assets. These are assessed continually to ensure that the developments are appropriately disclosed in the fi nancial statements.
11. Earnings per share
Basic earnings per share are calculated by dividing the net profi t or loss for the period attributable to equity shareholders by the weighted average number of equity shares outstanding during the period. The weighted average number of equity shares outstanding during the period is adjusted for events including a bonus issue, bonus element in a rights issue to existing shareholders, share split and reverse share split (consolidation of shares). For the purpose of calculating diluted earnings per share, the net profi t or loss for the period attributable to equity shareholders and the weighted average number of shares outstanding during the period are considered for the effects of all dilutive potential equity shares.
12. Cash and cash equivalents and cash fl ow statement
Cash and cash equivalents comprise cash on hand and demand deposits, together with other short-term, highly liquid investments
NOTES TO FINANCIAL STATEMENTS FOR THE YEAR ENDED 31ST MARCH, 2018 (Contd.)(All amounts are in lakhs of Indian Rupees, except share data and as stated)
NOTES TO FINANCIAL STATEMENTS FOR THE YEAR ENDED 31ST MARCH, 2018 (Contd.)(All amounts are in lakhs of Indian Rupees, except share data and as stated)

24
TVS Upasana Limited
maturing within three months from the date of acquisition and which are readily convertible into cash and which are subject to only an insignifi cant risk of changes in value.
Cash fl ows are reported using the indirect method, whereby profi t/ (loss) before extraordinary items and tax is appropriately classifi ed for the effects of transactions of non-cash nature and any deferrals or accruals of past or future receipts or payments. In cash fl ow statement, cash and cash equivalents include cash in hand, balances with banks in current accounts and other short- term highly liquid investments with original maturities of three months or less.
13. Segment reporting
The Company is engaged in manufacture and sale of spokes and nipples, tools, small screws, dowel, kits and cold extrusion components which largely have applications primarily in automobile industry and thus the Company has only one reportable segment.
14. Government grants
Government grants and subsidies are recognised when there is reasonable assurance that the conditions attached to them will be complied and grant/subsidy will be received. Government grants relating to income are deferred and recognized in the statement of profi t and loss over the period necessary to match them with the costs that they intended to compensate and presented in other operating revenues. Grants that compensate the Company for expenses incurred are recognised in profi t or loss as other operating revenue on a systematic basis in the periods in which such expenses are recognised.
15. Foreign currency transactions
In preparing the fi nancial statements, transactions in currencies other than Company’s functional currency (i.e. foreign currencies) are recognised at rates of exchange prevailing on date of transactions or an average rate if average rate approximates actual rate at the date of the transaction. Monetary assets and liabilities denominated in foreign currencies are translated into the functional currency at exchange rate at the reporting date. Non-monetary assets and liabilities that are measured at fair value in a foreign currency are translated into functional currency at exchange rate when fair value was determined. Non-monetary
assets and liabilities that are measured based on historical cost in a foreign currency are translated at exchange rate at the date of the transaction. Exchange differences are recognised in profi t or loss.
16. Borrowing costs
Borrowing costs directly attributable to the acquisition, construction or production of a qualifying asset are capitalised during the period of time that is necessary to complete and prepare the asset for its intended use or sale. Other borrowing costs are expensed in the period in which they are incurred under fi nance costs. Borrowing cost also includes exchange differences to the extent regarded as an adjustment to interest costs.
3A. New standards and amendment to existing standards issued but not yet effective
New standard - Ind AS 115, Revenue from Contracts with Customers
Ind AS 115, establishes a comprehensive framework for determining whether, how much and when revenue should be recognised. It replaces existing revenue recognition guidance, including Ind AS 18 on Revenue, Ind AS 11 on Construction Contracts and Guidance Note on Accounting for Real Estate Transactions. This standard is effective from annual periods beginning on or after April 1, 2018 and will be applied accordingly. In this regard, the Company is in process of carrying out assessment of potential impact on adoption of Ind AS 115 on accounting policies followed and accordingly impact on its fi nancial statements on initial application of this standard is not reasonably estimable at present.
Amendment to existing standard - Ind AS 21, The effect of changes in Foreign Exchange rates
The amendment to Ind AS 21 clarifi es on accounting of transactions that include receipt or payment of advance consideration in a foreign currency. The appendix explains that the date of the transaction, for the purpose of determining the exchange rate, is the date of initial recognition of the non-monetary prepayment asset or deferred income liability. If there are multiple payments or receipts in advance, a date of transaction is established for each payment or receipt. In this regard, the Company is in the process of carrying out its assessment of potential impact on adoption of this amendment on accounting policies followed in its fi nancial statements.
NOTES TO FINANCIAL STATEMENTS FOR THE YEAR ENDED 31ST MARCH, 2018 (Contd.)(All amounts are in lakhs of Indian Rupees, except share data and as stated)
NOTES TO FINANCIAL STATEMENTS FOR THE YEAR ENDED 31ST MARCH, 2018 (Contd.)(All amounts are in lakhs of Indian Rupees, except share data and as stated)

25
4 a) Property, plant and equipment and other intangible assets
Gross block Freehold
land * Buildings
Plant and equip-
ment
Furniture and
fi xtures
Offi ce equip-ments
Vehicles Total
As at April 1, 2016 79.99 443.63 2,488.40 14.85 44.33 1.01 3,072.21
Additions - 23.80 908.11 1.60 5.48 - 938.99
Disposal - - (6.39) - (0.24) - (6.63)
As at March 31, 2017 79.99 467.43 3,390.12 16.45 49.57 1.01 4,004.57
Additions - - 629.27 - 6.22 - 635.49
Disposal - - (22.34) (1.13) (3.16) (0.01) (26.64)
As at March 31,2018 79.99 467.43 3,997.05 15.32 52.63 1.00 4,613.42
Accumulated depreciation
As at April 1, 2016 - 26.66 346.69 4.00 7.11 0.15 384.61
For the year - 16.43 397.44 4.04 8.19 0.11 426.21
Disposals - - (1.35) - (0.10) - (1.45)
Other Adjustments - - 0.13 - (0.13) - -
As at March 31, 2017 - 43.09 742.91 8.04 15.07 0.26 809.37
For the year - 17.58 397.99 2.40 8.33 0.11 426.41
Disposals - - (11.12) (0.80) (1.78) - (13.70)
As at March 31, 2018 - 60.67 1,129.78 9.64 21.62 0.37 1,222.08
Net block
As at March 31, 2017 79.99 424.34 2,647.21 8.41 34.50 0.75 3,195.20
As at March 31, 2018 79.99 406.76 2,867.27 5.68 31.01 0.63 3,391.34
* Cost of Land includes pending registration - Rs. 5.13 of title deeds.
b) Capital work-in-progress
As at March 31, 2017 - 86.63 585.83 - - - 672.46
As at March 31, 2018 - 1,736.60 765.42 - - - 2,502.02
5 Other intangible assets
Gross block Software
As at April 1, 2016 16.47
Additions -
Disposal -
As at March 31, 2017 16.47
Additions 0.91
Disposal (2.11)
As at March 31,2018 15.27
Accumulated amortization
As at April 1, 2016 8.53
For the year 3.31
Disposals -
As at March 31, 2017 11.84
For the year 1.66
Disposals (1.93)
As at March 31, 2018 11.57
Net block
As at March 31, 2017 4.63
As at March 31, 2018 3.70
As at March 31,
2018
As at March 31,
20176 Investments
(I) Non-current investments
Investments measured at fair value through statement of profi t and loss
(i) Unquoted
a) 3,000 (March 31, 2017: 3,000) Class A equity shares of `10/- each fully paid of Clean Switch India Private Limited
4.50 4.50
b) 140,000 (March 31, 2017: 40,000) Class B equity shares of `10/- each fully paid of Clean Switch India Private Limited
14.00 14.00
Total non-current investments 18.50 18.50
NOTES TO FINANCIAL STATEMENTS FOR THE YEAR ENDED 31ST MARCH, 2018 (Contd.)(All amounts are in lakhs of Indian Rupees, except share data and as stated)
NOTES TO FINANCIAL STATEMENTS FOR THE YEAR ENDED 31ST MARCH, 2018 (Contd.)(All amounts are in lakhs of Indian Rupees, except share data and as stated)

26
TVS Upasana Limited
As at March 31,
2018
As at March 31,
2017(II) Current investments
Investments measured at fair value through statement of profi t and lossInvestments in equity instruments
(i) Quoted
a) 1,000 (March 31, 2017: 1,000) equity shares of ` 2/- each, fully paid up of Sterling Tools Limited
3.63 2.24
b) 83 (March 31, 2017: 83) equity shares of ` 10/- each, fully paid up of Lakshmi Precision Screws Limited
0.03 0.03
c) 500 (March 31, 2017: 500) equity shares of ` 2/- each, fully paid up of Simmonds-Marshall Limited
0.58 0.47
d) 25 (March 31, 2017: 25) equity shares of ` 2/- each, fully paid up of Bharat Forge Limited
0.35 0.26
e) 13,900 (March 31, 2017: 13,900) equity shares of ` 10/- each, fully paid up of Sundaram Brake Linings Limited
70.25 57.16
As at March 31,
2018
As at March 31,
2017f) 660 (March 31, 2017: 300) equity
shares of ` 1/- each, (March 31, 2017: ` 10/-) fully paid up of State Bank of India
1.65 1.83
g) 1,994 (March 31, 2017: 1,994) equity shares of ` 5/- each, fully paid up of Sundaram Clayton Limited
96.05 72.63
h) 1,994 (March 31, 2017: 1,994) equity shares of ` 5/- each, fully paid up of WABCO-INDIA Limited
158.14 116.17
i) 1,968 (March 31, 2017: 1,968) equity shares of ` 10/- each, fully paid up of India Motor Parts and Accessories Limited
20.17 16.46
Total current investments 350.85 267.25
Total (i+ii) 369.35 285.75
Aggregate amount of quoted investments and market value thereof
350.85 267.25
Aggregate value of unquoted investments
18.50 18.50
Aggregate amount of impairment in value of investments
- -
As at March 31, 2018 As at March 31, 2017
Non-current Current Non-current Current
7 Loans
(Unsecured considered good, unless otherwise stated)
Loans to employees 19.14 11.32 20.79 8.74
19.14 11.32 20.79 8.74
8 Other fi nancial assets
(Unsecured considered good, unless otherwise stated)
Security deposits 328.72 - 329.18 1.00
Claims receivable - 27.25 - 36.82
Interest receivable - 0.03 - 0.03
328.72 27.28 329.18 37.85
9 Income Tax
A Amount recognised in statement of profi t and loss
Year endedMarch 31,
2018
Year endedMarch 31,
2017
Current tax (a)
Current period 820.00 540.00
Tax relating to earlier years (b) 6.27 0.32
Deferred tax (c)
Attributable to - origination and reversal of temporary differences (20.56) 46.89
Tax expense (a) + (b) + (c) 805.71 587.21
NOTES TO FINANCIAL STATEMENTS FOR THE YEAR ENDED 31ST MARCH, 2018 (Contd.)(All amounts are in lakhs of Indian Rupees, except share data and as stated)
NOTES TO FINANCIAL STATEMENTS FOR THE YEAR ENDED 31ST MARCH, 2018 (Contd.)(All amounts are in lakhs of Indian Rupees, except share data and as stated)

27
B Income tax recognised in other comprehensive income
As at March 31, 2018 As at March 31, 2017
Amount Tax benefi t Net of tax Amount Tax benefi t Net of tax
Remeasurements of defi ned benefi t liability (3.79) 1.31 (2.48) (10.05) 5.88 (4.17)
Total (3.79) 1.31 (2.48) (10.05) 5.88 (4.17)
Year endedMarch 31,
2018
Year endedMarch 31,
2017
C Income tax recognised directly in equity - -
D Reconciliation of effective tax rate
Year ended March 31, 2018
Year ended March 31, 2017
% Amount % Amount
Profi t before tax 2,550.23 1,694.20
Tax using the Company's domestic tax rate 34.61% 882.58 34.61% 586.33
Effect of:
- Fair valuation of investments (1.13%) (28.93) (0.98%) (16.56)
- CSR expenditure disallowance, net 0.34% 8.59 0.40% 6.83
- Loss on sale of assets 0.18% 4.52 0.27% 4.50
- Others (0.64%) (61.05) 0.36% 6.11
Effective tax rate / tax expense 31.59% 805.71 34.66% 587.21
E Recognised deferred tax assets and liabilities
Deferred tax assets and liabilities are attributable to the following
Deferred tax assets Deferred tax liabilities Net deferred tax (assets) / liabilities
As atMarch 31,
2018
As atMarch 31,
2017
As atMarch 31,
2018
As atMarch 31,
2017
As atMarch 31,
2018
As atMarch 31,
2017
Property, plant and equipment and other intangibles - - 271.14 286.92 271.14 286.92
Provision for employee benefi ts 33.41 34.29 - - (33.41) (34.29)
Loss allowance on trade receivables 6.97 - - - (6.97) -
Others - - - - - -
40.38 34.29 271.14 286.92 230.76 252.63
Movement in temporary differences for the year ended March 31, 2018
Balance as at April 1, 2017
Recognized in profi t and loss during
2017-18
Recognized in OCI during
2017-18
Balance as at March 31,
2018
Property, plant and equipment and other intangibles 286.92 (15.78) - 271.14
Provision for employee benefi ts (34.29) (0.43) 1.31 (33.41)
Loss allowance on trade receivables - (6.97) - (6.97)
Others - - - -
252.63 (23.18) 1.31 230.76
NOTES TO FINANCIAL STATEMENTS FOR THE YEAR ENDED 31ST MARCH, 2018 (Contd.)(All amounts are in lakhs of Indian Rupees, except share data and as stated)
NOTES TO FINANCIAL STATEMENTS FOR THE YEAR ENDED 31ST MARCH, 2018 (Contd.)(All amounts are in lakhs of Indian Rupees, except share data and as stated)

28
TVS Upasana Limited
Movement in temporary differences for the year ended March 31, 2017
Balance as atApril 1, 2016
Recognized in profi t and loss during
2016-17
Recognized in OCI during
2016-17
Balance as at March 31,
2017
Property, plant and equipment and Investment property 239.33 47.59 - 286.92
Provision for employee benefi ts 27.72 (67.89) 5.88 (34.29)
Loss allowance on trade receivables - - - -
Others - - - -
267.05 (20.30) 5.88 252.63
F Other tax assets/liabilities
As at March 31, 2018 As at March 31, 2017
Non-current Current Non-current Current
i) Advance tax, net 190.99 - 192.81 -
ii) Provision for taxation, net - 425.48 - 43.69
As at March 31, 2018 As at March 31, 2017
Non-current Current Non-current Current
10 Other assets
(Unsecured considered good, unless otherwise stated)
Prepaid expenses 459.88 26.26 469.26 56.91
Capital advances 591.13 - 11.82 -
Claims receivable - 230.73 - 388.77
Balance with statutory/government authorities - 51.55 - 208.26
Advances to suppliers - 2.69 - 58.68
Prepaid guarantee charges 29.96 9.37 - -
Unamortised cost of leasehold land 2,085.54 21.54 2,107.08 21.54
3,166.51 342.14 2,588.16 734.16
As atMarch 31,
2018
As atMarch 31,
2017
11 Inventories(Valued at lower of cost and net realizable value)
Raw materials and components 648.60 362.43
(includes goods in transit of ` 149.36 (March 31, 2017 ` 70.50))
Work-in-progress 595.39 437.85
Finished goods 696.67 484.67
(includes goods in transit of ` 196.39 (March 31, 2017 ` 255.68))
Stores & spares 109.83 96.69
Loose tools 203.84 220.31
Packing materials 14.43 24.58
2,268.76 1,626.53
As atMarch 31,
2018
As atMarch 31,
2017
12 Trade receivables
Unsecured, considered good 3,342.88 2,872.36
Doubtful 24.18 -
3,367.06 2,872.36
Loss allowance
Doubtful (24.18) -
Net trade receivables 3,342.88 2,872.36
Of the above, trade receivables from related parties are as below:-Total trade receivables from related parties 548.77 696.79
Loss allowance - -
548.77 696.79
The Company's exposure to credit risks and loss allowances related to traded receivables are disclosed in note 29
NOTES TO FINANCIAL STATEMENTS FOR THE YEAR ENDED 31ST MARCH, 2018 (Contd.)(All amounts are in lakhs of Indian Rupees, except share data and as stated)
NOTES TO FINANCIAL STATEMENTS FOR THE YEAR ENDED 31ST MARCH, 2018 (Contd.)(All amounts are in lakhs of Indian Rupees, except share data and as stated)

29
As atMarch 31,
2018
As atMarch 31,
2017
13 Cash and cash equivalentsBalances with banks in current accounts 2.64 3.35Cash on hand 0.74 1.06
3.38 4.41Note:The disclosures in the fi nancial statements regarding holdings as well as dealings in specifi ed bank notes during the period from November 8, 2016 to December 30, 2016 have not been made since they do not pertain to the fi nancial year ended March 31, 2018. However amounts as appearing in the audited standalone fi nancial statements for the period ended March 31, 2017 have been disclosed hereunder:
Disclosure required pursuant to G.S.R. 307(E) and G.S.R. 308(E) dated March 30, 2017
ParticularsSpecifi ed
Bank Notes
Other denomi-nation
Total
Cash on Hand as on November 08, 2016 0.66 0.14 0.80
Add: Permitted receipts - 3.18 3.18Less: Permitted payments - 2.41 2.41Less: Deposits with Banks 0.66 - 0.66
Cash on Hand as on December 30, 2016 - 0.91 0.91
As atMarch 31,
2018
As atMarch 31,
2017
14 Share capital and other equityA Share capital
Authorized11,999,000 (March 31, 2017: 11,999,000) equity shares of ` 10/- each 1,199.90 1,199.90
1,000 (March 31, 2017: 1,000) redeemable preference shares of ` 10/- each
0.10 0.10
1,200.00 1,200.00Issued, subscribed and fully paid up11,899,674 (March 31, 2017: 11,899,674) equity shares of Rs.10/- each
1,189.97 1,189.97
1,189.97 1,189.97
(a) Reconciliation of shares outstanding at the beginning and at the end of the reporting period
As at March 31, 2018 As at March 31, 2017
No. of shares Amount No. of
shares Amount
Equity shares of ` 10/- each fully paid up
At the beginning of the year 11,899,674 1,189.97 11,899,674 1,189.97
Add: Equity shares issued during the year
- - - -
At the end of the year 11,899,674 1,189.97 11,899,674 1,189.97
(b) Rights, preferences and restrictions attached to equity sharesThe Company has two class of shares viz., redeemable preference shares of face value of Rs. 10/- each and equity shares of face value of Rs. 10/- each. Each holder of equity share is entitled to one vote per share. The equity shares are entitled to receive dividend as declared from time to time the same is declared. The voting rights of an equity shareholder on a poll (not on show of hands) are in proportion to its share of the paid-up equity capital of the Company.
In the event of liquidation of the Company, the holders of equity shares will be entitled to receive remaining assets of the company, after distribution of all preferential amounts. The distribution will be in proportion to the number of equity shares held by the shareholders. The terms and conditions of redeemable preference shares will be determined at the time of issue of such shares. The Company has not issued any redeemable preference shares and paid up capital consists only of equity shares.
(c) Details of shareholders holding more than 5% shares in the Company
As at March 31, 2018 As at March 31, 2017 Nos. % holding Nos. % holding
Equity shares of ` 10/- each fully paid up held by
Sundram Fasteners Limited and its nominees, Holding company
11,899,674 100.00% 11,899,674 100.00%
(d) The Company does not have any shares reserved for a subsequent issuance.
(e) Capital managementThe Company’ s capital management objectives are to ensure the Company’s ability to continue as a going concern and to provide an adequate return to shareholders by pricing products and services commensurate with the level of risk
For the purpose of the Company’s capital management, capital includes issued equity share capital and borrowings obtained from external agencies including banks and fi nancial institutions. The primary objective of the Group’s capital management is to maximize the shareholder value.
Management assesses the Company’s capital requirements in order to maintain an effi cient overall fi nancing structure while avoiding excessive leverage. The Company manages the capital structure and makes adjustments to it in the light of changes in economic conditions and the risk characteristics of the underlying assets. In order to maintain or adjust the capital structure, the Company may adjust the amount of dividends paid to shareholders, return capital to shareholders, issue new shares, or sell assets to reduce debt. The amounts managed as capital by the Company for the reporting periods are summarized as follows:
As atMarch 31,
2018
As atMarch 31,
2017
Total debt (bank and other borrowings) 6,115.65 5,196.90Cash and cash equivalents (3.38) (4.41)Capital A 6,112.27 5,192.49Total equity 6,404.27 5,050.44Overall fi nancing B 6,404.27 5,050.44Gearing ratio C = (A/B)*100 95.44% 102.81%
NOTES TO FINANCIAL STATEMENTS FOR THE YEAR ENDED 31ST MARCH, 2018 (Contd.)(All amounts are in lakhs of Indian Rupees, except share data and as stated)
NOTES TO FINANCIAL STATEMENTS FOR THE YEAR ENDED 31ST MARCH, 2018 (Contd.)(All amounts are in lakhs of Indian Rupees, except share data and as stated)

30
TVS Upasana Limited
Year endedMarch 31,
2018
Year endedMarch 31,
2017
B Other equityDividendsThe following dividends were declared and paid by the Company during the year:
Final dividend ` 2/- per equity share (March 31, 2017: Nil) 237.99 -
Interim dividend - ` 1/- per equity share (March 31, 2017: Nil) 119.00 -
Dividend distribution tax (DDT) on above 72.68 - 429.67 -
After the reporting dates the following dividends (excluding dividend distribution tax) were proposed by the directors subject to the approval at the annual general meeting; these dividends have not been recognised as liabilities and would attract dividend distribution tax when declared or paid.
Year endedMarch 31,
2018
Year endedMarch 31,
2017
Final dividend of ` 2.50 (March 31, 2017: Nil/-) per equity share
297.49 -
297.49 -
15 Earnings per share (EPS)
Year endedMarch 31,
2018
Year endedMarch 31,
2017
Net profi t attributable to equity shareholders (A) 1,744.52 1,106.99
Weighted average number of equity shares outstanding as at reporting date (B) 11,899,674 11,899,674
Basic earnings per equity share (A/B) (in `) 14.66 9.30
Diluted EPS
The Company does not have any potential equity shares and accordingly basic and diluted EPS would remain the same.
As at March 31, 2018 As at March 31, 2017 Non-current Current Non-current Current
16 BorrowingsFinancial liabilities at amortised cost
a) SecuredTerm loan (refer note 1 below)
From banks in local currency
4,800.00 - 900.00 -
From banks in foreign currency
- - 2,568.52 -
Working Capital Loans
Working capital facility from bank (refer note 2 below)
- 740.65 - 1,038.37
4,800.00 740.65 3,468.52 1,038.37
As at March 31, 2018 As at March 31, 2017 Non-current Current Non-current Current
Less: Current maturities of long term borrowings
- - 900.00 -
4,800.00 740.65 2,568.52 1,038.37
b) Unsecured Working capital loans - from other related parties
- - - 115.00
Working capital loans - from holding company
- 575.00 - 575.00
- 575.00 - 690.00 Total 4,800.00 1,315.65 2,568.52 1,728.37
Note:
(1) Term loan from banks are secured by exclusive mortgage on the factory land and building at SIPCOT, Oragadam-Vallam and fi rst pari pasu charge on moveable fi xed assets of the company.
(2) Working capital loans represents cash credit and export packing credit loans availed from banks, secured by hypothecation of current assets consisting of stocks of raw materials, work-in-process & fi nished goods and receivables
(iii) Reconciliation of cashfl ows from fi nancing activities
As atMarch 31,
2018
As atMarch 31,
2017
Cash and cash equivalents 3.38 4.41Current borrowings 1,315.65 2,628.37Non-current borrowings 4,800.00 2,568.52Net debt 6,119.03 5,201.31
Other assetsLiabilities from fi nancing
activitiesTotalCash
and cash equivalents
Currentborrowings
Non-current borrowings
Net debt as at April 1, 2017
4.41 2,628.37 2,568.52 5,201.31
Net cash fl ows (1.03) (1,312.72) 2,066.39 752.63
Foreign exchange adjustments
- - - -
Other non-cash movement
- - 165.09 165.09
Net debt as at March 31, 2018
3.38 1,315.65 4,800.00 6,119.03
NOTES TO FINANCIAL STATEMENTS FOR THE YEAR ENDED 31ST MARCH, 2018 (Contd.)(All amounts are in lakhs of Indian Rupees, except share data and as stated)
NOTES TO FINANCIAL STATEMENTS FOR THE YEAR ENDED 31ST MARCH, 2018 (Contd.)(All amounts are in lakhs of Indian Rupees, except share data and as stated)

31
As at March 31, 2018 As at March 31, 2017 Non-current Current Non-current Current
17 Provisions
Provision for employee benefi ts
Gratuity (refer note (i)(a))
102.23 13.63 82.51 16.58
Compensated absences (refer note (i)(b))
50.34 5.73 30.66 2.61
152.57 19.36 113.17 19.19
(i) Defi ned Benefi t Plan(a) Gratuity1) Chennai unit
Retirement Benefi t in the form of Gratuity Liability is a defi ned benefi t obligation and is provided on the basis of an actuarial valuation made at the end of each fi nancial year for unit located at Chennai. The gratuity scheme is unfunded and the actuarial liability is shown in the balance sheet.
The following tables summarise the components of net benefi t expenses recognised in the statement of profi t and loss and the funded status and amounts recognised in the balance sheet for the Gratuity.
Particulars As atMarch
31,2018
As atMarch 31,
2017
Amount recognised in statement of profi t and loss
15.25 12.88
Amount recognised in other comprehensive income
5.46 10.22
Total expense 20.71 23.10Net employee benefi t expenseRecognised in statement of profi t and loss Current Service cost 8.98 7.77 Interest cost on benefi t obligation 6.27 5.11
(A) 15.25 12.88
Recognised in other comprehensive income
Net actuarial loss recognized in the year
(B) 5.46 10.22
Net benefi t expense (A) +(B) 20.71 23.10
As at March 31,
2018
As atMarch 31,
2017
Net defi ned obligationPresent value of defi ned benefi t obligation 103.20 84.82Fair value of plan assets - -
103.20 84.82
As at March 31,
2018
As atMarch 31,
2017Changes in present value of the defi ned benefi t obligation are as follows:
Balance at the beginning of the year 84.82 67.74Interest expense 6.27 5.11Current service cost 8.98 7.77Benefi ts paid (2.33) (6.02)Actuarial loss on obligation 5.46 10.22Balance at the end of the year 103.20 84.82
(iii) Principal actuarial assumptions used : Discount rate 7.90% 7.50% Salary escalation rate 7.00% 5.50% Attrition rate 5.00% 2.00%
The estimates of future salary increases, considered in actuarial valuation taking into account of infl ation, seniority, promotion, attrition and relevant factors, such as supply and demand in the employment market.
A quantitative sensitivity analysis for signifi cant assumption as at the reporting dates are as shown below:
Discount rate Salary escalation rate Increase Decrease Increase Decrease
March 31, 2018- Sensitivity Level (%) 1.00% 1.00% 1.00% 1.00%
- Impact on defi nedbenefi t obligation
(8.65) 9.98 8.93 (7.90)
March 31, 2017- Sensitivity Level (%) 0.50% 0.50% 0.50% 0.50%- Impact on defi ned
benefi t obligation 4.80 5.24 5.39 (4.99)
2) Hosur unitWith respect to Hosur unit, the Company participates in the gratuity policy maintained by the holding company with Life Insurance Corporation of India. The net defi ned benefi t cost is recognised based on the contribution payable, as determined by the holding company in respect of this unit based on actuarial valuation obtained centrally by holding company. The contribution made in this regard are as follows:-
Contribution made to the defi ned benefi t plan 7.55 7.50
Note: The Company believes that there is no further payment/ refund expected towards its employees out of fund remittances made centrally by the holding company.
Classifi cation- Current 13.63 16.58- Non-current 102.23 82.51
(b) Compensated absencesThe Company’s net obligation in respect of compensated absences is the amount of future benefi t that employees have earned in return for their service in current and prior periods. Such benefi t is discounted to determine its present value, and fair value of any related assets is deducted. The obligation is measured on the basis of an annual independent actuarial valuation obtained using the projected unit credit method.
NOTES TO FINANCIAL STATEMENTS FOR THE YEAR ENDED 31ST MARCH, 2018 (Contd.)(All amounts are in lakhs of Indian Rupees, except share data and as stated)
NOTES TO FINANCIAL STATEMENTS FOR THE YEAR ENDED 31ST MARCH, 2018 (Contd.)(All amounts are in lakhs of Indian Rupees, except share data and as stated)

32
TVS Upasana Limited
As atMarch 31,
2018
As atMarch 31,
201718 Trade payables
Due to related parties 65.74 55.26Dues to Micro, Small and Medium Enterprises (MSME)
- -
Dues to others 2,077.01 1,381.87 2,142.75 1,437.13
Disclosure required under Clause 22 of Micro, Small and Medium Enterprise Development (‘MSMED’) Act, 2006The Ministry of Micro, Small and Medium Enterprises has issued an offi ce memorandum dated 26 August 2008 which recommends that the Micro and Small Enterprises should mention in their correspondence with its customers the Entrepreneurs Memorandum Number as allocated after fi ling of the Memorandum in accordance with the Micro, Small and Medium Enterprise Development Act, 2006 (‘the Act’). Accordingly, the disclosure in respect of the amounts payable to such enterprises as at reporting dates have been made in the fi nancial statements based on information received and available with the Company. Further in view of the Management, the impact of interest, if any, that may be payable in accordance with the provisions of the Act is not expected to be material. The Company has not received any claim for interest from any supplier as at the balance sheet date.
Particulars As at
March 31, 2018
As at March 31,
2017(a) the principal amount and the interest
due thereon (to be shown separately) remaining unpaid to any supplier at the end of each accounting year;
- -
(b) the amount of interest paid by the buyer in terms of section 16 of the Micro, Small and Medium Enterprises Development Act, 2006, along with the amount of the payment made to the supplier beyond the appointed day during each accounting year;
- -
(c) the amount of interest due and payable for the period of delay in making payment (which have been paid but beyond the appointed day during the year) but without adding the interest specifi ed under the Micro, Small and Medium Enterprises Development Act, 2006;
- -
(d) the amount of interest accrued and remaining unpaid at the end of each accounting year; and
- -
(e) the amount of further interest remaining due and payable even in the succeeding years, until such date when the interest dues above are actually paid to the small enterprise, for the purpose of disallowance of a deductible expenditure under section 23 of the Micro, Small and Medium Enterprises Development Act, 2006.
- -
The above disclosures are provided by the Company based on the information available with the Company in respect of the registration status of its vendors / suppliers.All trade payables are current. The Company's exposure to liquidity risks related to trade payables is disclosed in note 33
Particulars As at
March 31, 2018
As at March 31,
201719 Other fi nancial liabilities
a) Financial liabilities at fair value through profi t or loss
Derivative liability - 165.09b) Financial liabilities at amortised cost
Current maturities of term loans from banks (Secured)
- 900.00
Interest accrued but not due on borrowings 25.83 20.03Trade deposits 0.10 0.10Employee benefi ts payable 188.95 180.34Capital creditors 150.25 -
365.13 1,265.56
20 Other current liabilitiesAdvance from customer 6.44 5.05Statutory dues 105.12 89.28
111.56 94.33
Year ended March 31,
2018
Year ended March 31,
2017
21 Revenue from operations
a) Sale of products:
Domestic 10,546.42 10,014.39
Export 3,985.76 3,845.36
14,532.18 13,859.75b) Other operating revenues (refer note
below) 1,008.99 933.87
Total 15,541.17 14,793.62
Note:
Other operating revenues
Sale of services 518.97 499.80
Scrap sales 349.59 207.37
Export incentives 139.61 205.19
Others 0.82 21.51
1,008.99 933.87
NOTES TO FINANCIAL STATEMENTS FOR THE YEAR ENDED 31ST MARCH, 2018 (Contd.)(All amounts are in lakhs of Indian Rupees, except share data and as stated)
NOTES TO FINANCIAL STATEMENTS FOR THE YEAR ENDED 31ST MARCH, 2018 (Contd.)(All amounts are in lakhs of Indian Rupees, except share data and as stated)

33
Year ended March 31,
2018
Year ended March 31,
2017
22 Other income
Interest income 16.61 16.01
Net foreign exchange gain 130.16 -
Fair value gain on fi nancial instruments measured at fair value through profi t or loss
83.59 47.86
Dividend income 0.93 0.58
Profi t on sale of property, plant and equipment 0.01 -
Miscellaneous income 2.42 1.15
233.72 65.60
23 Cost of materials consumed
Opening stock of raw materials and components 291.94 469.65
Add : Purchases made during the year 6,020.05 4,626.73
Less: Closing stock of raw materials and components
499.24 291.94
5,812.75 4,804.44
24 Changes in inventories of fi nished goods and work-in-progress
A) Opening stock:
Work-in-progress 437.85 712.43
Finished goods 465.95 535.29
Excise duty on fi nished goods 18.72 10.87
922.52 1,258.59
B) Closing stock:
Work-in-progress 595.39 437.85
Finished goods 696.67 465.95
Excise duty on fi nished goods - 18.72
1,292.06 922.52
Total (A- B) (369.54) 336.07
25 Employee benefi ts expense
Salaries and wages 1,412.09 1,245.55
Expenses relating to post-employment benefi t plans 59.42 42.33
Contribution to provident and other funds 102.88 95.29
Staff welfare expenses 128.51 116.81
1,702.90 1,499.98
Year ended March 31,
2018
Year ended March 31,
2017
26 Finance costs
Interest expense on fi nancial liabilities measured at amortised cost 286.09 226.37
Applicable net loss on foreign currency transactions and translation to the extent regarded as borrowing costs
27.55 37.26
313.64 263.63
27 Depreciation and amortisation expense
Depreciation on property, plant and equipment 426.41 426.21
Amortisation on other intangible assets 1.66 3.31
428.07 429.51
28 Other expenses
Consumption of stores, tools and spares 3,686.71 3,255.59
Power and fuel 624.36 579.53
Repairs and maintenance
- building 8.90 13.79
- plant and equipment 38.32 45.25
- other assets 1.98 3.36
Rent 75.17 98.00
Rates and taxes 71.23 22.40
Insurance 16.44 15.11
Freight and cartage outward 260.85 317.90
Advertisement and sales promotion 6.61 0.71
Payment to auditors (refer (a) below) 2.50 6.55
Loss on sale of property, plant and equipment 13.07 4.50
Bank charges 4.26 8.70
Printing and stationery 17.62 18.44
Travel expenses 38.66 45.90
Postage and telecom expenses 12.09 16.88
Consultancy 55.67 73.02
Allowance towards trade receivables 24.18 -
Net foreign exchange loss(net off gain) - 4.98
Corporate social responsibility expenditure (refer (b) below) 24.83 19.73
Fair value loss on fi nancial instruments at fair value through profi t or loss - -
Miscellaneous expenses 61.48 60.31
5,044.93 4,610.65
NOTES TO FINANCIAL STATEMENTS FOR THE YEAR ENDED 31ST MARCH, 2018 (Contd.)(All amounts are in lakhs of Indian Rupees, except share data and as stated)
NOTES TO FINANCIAL STATEMENTS FOR THE YEAR ENDED 31ST MARCH, 2018 (Contd.)(All amounts are in lakhs of Indian Rupees, except share data and as stated)

34
TVS Upasana Limited
Year ended March 31,
2018
Year ended March 31,
2017
(a) Payment to auditors*
a) As auditors 2.00 2.00
b) Taxation matters 0.50 0.71
c) Other services - 2.95
d) Reimbursement of expenses - 0.89
2.50 6.55
*Payments for the year ended March 31, 2017 and partly for the year ended March 31, 2018 include fees and reimbursements paid to the predecessor auditor.
Year ended March 31,
2018
Year ended March 31,
2017
(b) Details of corporate social responsibility expenditure
(A) Amount required to be spent by theCompany during the year 24.50 19.64
(B) Amount spent during the year
(i) Construction/ acquisition of any asset - -
(ii) On purposes other than (i) above 24.83 19.73
29 Financial instruments - Fair values and risk management
A Accounting classifi cation and fair values
The following table shows the carrying amounts and fair values of fi nancial assets and fi nancial liabilities, including their levels in the fair value hierarchy
Particulars March 31, 2018 March 31, 2017
FVTPL FVOCI Amortised Cost Total FVTPL FVOCI Amortised
Cost Total
Financial assets
Investments 350.85 - - 350.85 267.25 - - 267.25
Trade receivables - - 3,342.88 3,342.88 - - 2,872.36 2,872.36
Loans - - 30.46 30.46 - - 29.53 29.53
Cash and cash equivalents - - 3.38 3.38 - - 4.41 4.41
Security deposits - - 328.72 328.72 - - 330.18 330.18
Claims receivable - - 27.25 27.25 36.82 36.82
Interest receivable - - 0.03 0.03 0.03 0.03
Total fi nancial assets 350.86 - 3,732.72 4,083.57 267.25 - 3,273.33 3,540.58
Financial liabilities
Borrowings - - 6,115.65 6,115.65 - 5,196.89 5,196.89
Derivative liabilities - - - - 165.09 - - 165.09
Trade payables - - 2,142.75 2,142.75 - - 1,437.13 1,437.13Interest accrued but not due on borrowings - - 25.83 25.83 8.44 - 11.59 20.03
Trade deposits - - 0.10 0.10 - - 0.10 0.10
Employee benefi ts payable - - 188.95 188.95 - - 180.34 180.34
Capital creditors - - 150.25 150.25 - - - -
Total Financial Liabilities - - 8,623.53 8,623.53 173.53 - 6,826.06 6,999.58 0
Fair value measurement hierarchyThe company uses the following hierarchy for determining and disclosing the fair value of fi nancial instruments by valuation technique:
Level 1: quoted (unadjusted) prices in active markets for identical assets or liabilities
Level 2: other techniques for which all inputs which have a signifi cant effect on the recorded fair value are observable, either directly or indirectly
Level 3: techniques which use inputs that have a signifi cant effect on the recorded fair value that are not based on observable market data
28 Other expenses (Contd.) 28 Other expenses (Contd.)
NOTES TO FINANCIAL STATEMENTS FOR THE YEAR ENDED 31ST MARCH, 2018 (Contd.)(All amounts are in lakhs of Indian Rupees, except share data and as stated)
NOTES TO FINANCIAL STATEMENTS FOR THE YEAR ENDED 31ST MARCH, 2018 (Contd.)(All amounts are in lakhs of Indian Rupees, except share data and as stated)
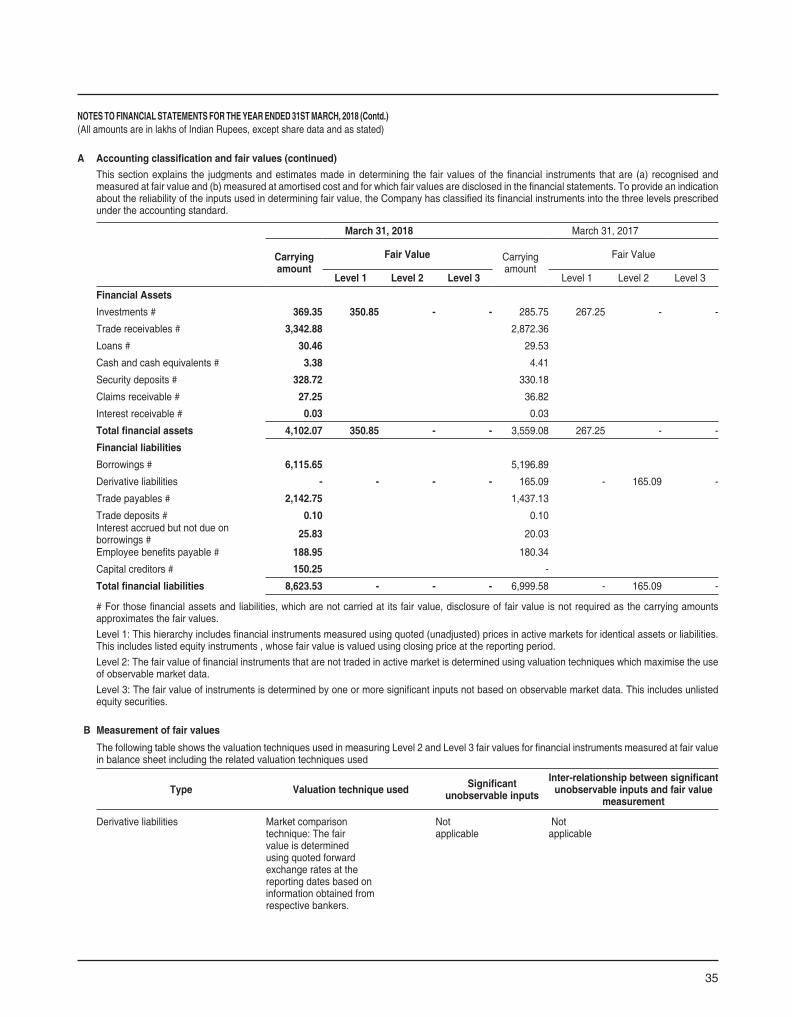
35
A Accounting classifi cation and fair values (continued)
This section explains the judgments and estimates made in determining the fair values of the fi nancial instruments that are (a) recognised and measured at fair value and (b) measured at amortised cost and for which fair values are disclosed in the fi nancial statements. To provide an indication about the reliability of the inputs used in determining fair value, the Company has classifi ed its fi nancial instruments into the three levels prescribed under the accounting standard.
March 31, 2018 March 31, 2017
Carryingamount
Fair Value Carryingamount
Fair Value
Level 1 Level 2 Level 3 Level 1 Level 2 Level 3
Financial Assets
Investments # 369.35 350.85 - - 285.75 267.25 - -
Trade receivables # 3,342.88 2,872.36
Loans # 30.46 29.53
Cash and cash equivalents # 3.38 4.41
Security deposits # 328.72 330.18
Claims receivable # 27.25 36.82
Interest receivable # 0.03 0.03
Total fi nancial assets 4,102.07 350.85 - - 3,559.08 267.25 - -
Financial liabilities
Borrowings # 6,115.65 5,196.89
Derivative liabilities - - - - 165.09 - 165.09 -
Trade payables # 2,142.75 1,437.13
Trade deposits # 0.10 0.10Interest accrued but not due on borrowings # 25.83 20.03
Employee benefi ts payable # 188.95 180.34
Capital creditors # 150.25 -
Total fi nancial liabilities 8,623.53 - - - 6,999.58 - 165.09 -
# For those fi nancial assets and liabilities, which are not carried at its fair value, disclosure of fair value is not required as the carrying amounts approximates the fair values.
Level 1: This hierarchy includes fi nancial instruments measured using quoted (unadjusted) prices in active markets for identical assets or liabilities. This includes listed equity instruments , whose fair value is valued using closing price at the reporting period.
Level 2: The fair value of fi nancial instruments that are not traded in active market is determined using valuation techniques which maximise the use of observable market data.
Level 3: The fair value of instruments is determined by one or more signifi cant inputs not based on observable market data. This includes unlisted equity securities.
B Measurement of fair values
The following table shows the valuation techniques used in measuring Level 2 and Level 3 fair values for fi nancial instruments measured at fair value in balance sheet including the related valuation techniques used
Type Valuation technique used Signifi cant unobservable inputs
Inter-relationship between signifi cant unobservable inputs and fair value
measurement
Derivative liabilities Market comparison technique: The fair value is determined using quoted forward exchange rates at the reporting dates based on information obtained from respective bankers.
Not applicable
Not applicable
NOTES TO FINANCIAL STATEMENTS FOR THE YEAR ENDED 31ST MARCH, 2018 (Contd.)(All amounts are in lakhs of Indian Rupees, except share data and as stated)

36
TVS Upasana Limited
C Financial risk management
The Company has exposure to the following risks arising from fi nancial instruments:
- Market risk
- Credit risk
- Liquidity risk
Financial risk management framework
The Company’s board of directors has overall responsibility for the establishment and oversight of the Company’s risk management framework. The board of directors along with the top management are responsible for developing and monitoring the Company’s risk management policies. The Company’s senior management advises on fi nancial risks and the appropriate fi nancial risk governance framework for the Company.
The Company's risk management policies established to identify and analyse the risks faced by the Company, to set appropriate risk limits and controls and to monitor risks and adherence to limits. Risk management systems are reviewed regularly to refl ect changes in market conditions and the Company’s activities. The Company, through its training and management standards and procedures, aims to maintain a disciplined and constructive control environment in which all employees understand their roles and obligations.
The Company’s senior management oversees how management monitors compliance with the Company’s risk management policies and procedures, and reviews the adequacy of the risk management framework in relation to the risks faced by the Company.
The Company’s principal fi nancial liabilities, other than derivatives, comprise borrowings, trade and other payables, and fi nancial guarantee contracts. The main purpose of these fi nancial liabilities is to fi nance the Company’s operations. The Company’s principal fi nancial assets include loans, trade and other receivables, investments and cash and cash equivalents that derive directly from its operations.
The Company is exposed to market risk, credit risk and liquidity risk. The Company’s overall risk management focuses on the unpredictability of fi nancial markets and seeks to minimise potential adverse effects on the fi nancial performance of the company. The Company uses derivative fi nancial instruments, such as foreign exchange forward contracts to hedge foreign currency risk exposure. Derivatives are used exclusively for hedging purposes and not as trading or speculative instruments.
The sources of risks which the company is exposed to and their management is given below:
(i) Market riskMarket risk is the risk of loss of future earnings, fair values or future cash fl ows that may result from a change in the price of a fi nancial instrument. The value of a fi nancial instrument may change as a result of changes in the interest rates, foreign currency exchange rates, commodity prices, equity prices and other market changes that affect market risk sensitive instruments. Market risk is attributable to all market risk sensitive fi nancial instruments including investments and deposits, foreign currency receivables, payables and borrowings. The Company is exposed to market risk through its use of fi nancial instruments and specifi cally to currency risk, interest rate risk and certain other price risks, which result from both its operating and investing activities.
a) Interest rate risk
Interest rate risk is the risk that the fair value or future cash fl ows of a fi nancial instrument will fl uctuate because of changes in market interest rates. The Company’s exposure to the risk of changes in market interest rates relates primarily to the Company’s debt obligations with fl oating interest rates.
The Company constantly monitors the credit markets and rebalances its fi nancing strategies to achieve an optimal maturity profi le and fi nancing cost. The Company manages its interest rate risk by having a balanced portfolio of fi xed and variable rate borrowings. At March 31, 2018, approximately 21% (March 31, 2017: 44%) of the Company’s borrowings are at a fi xed rate of interest.
Interest rate sensitivity
The following table illustrates the sensitivity to profi ts and equity to a reasonably possible change in interest rates of +/- 1% for the year ended March 31, 2018 (March 31, 2017: +/- 1%). These changes are considered to be reasonably possible based on observation of current market conditions. The calculations are based on a change in the average market interest rate for each period, and the fi nancial instruments held at each reporting date that are sensitive to changes in interest rates. All other variables are held constant.
Interest rate exposure
Particulars Floating rate Fixed rate Total
borrowings
` loans 4,840.65 1,275.00 6,115.65
USD - - -
As at March 31, 2018 4,840.65 1,275.00 6,115.65
` loans 338.37 2,290.00 2,628.37
USD 2,568.52 - 2,568.52
As at March 31, 2017 2,906.90 2,290.00 5,196.90
NOTES TO FINANCIAL STATEMENTS FOR THE YEAR ENDED 31ST MARCH, 2018 (Contd.)(All amounts are in lakhs of Indian Rupees, except share data and as stated)

37
As atMarch 31,
2018
As atMarch 31,
2017
Increase +1% 48.41 29.07
Decrease -1% (48.41) (29.07)
The Company does not expect any change in interest rates on fi xed rate borrowings and accordingly have not presented any sensitivities on such borrowings.
b) Foreign currency risk
Foreign currency risk is the risk that the fair value or future cash fl ows of an exposure will fl uctuate because of changes in foreign exchange rates. The Company’s exposure to the risk of changes in foreign exchange rates relates primarily to the Company’s operating activities (when revenue or expense is denominated in a foreign currency) and the Company’s borrowings in foreign currency.
Currency risk (or foreign exchange risk) arises on fi nancial instruments that are denominated in a foreign currency, i.e. in a currency other than the functional currency in which they are measured. For the purpose of this Ind AS, currency risk does not arise from fi nancial instruments that are non-monetary items or from fi nancial instruments denominated in the functional currency.
The Company manages its foreign currency risk by hedging transactions through forward contracts, for the repayment of short and long term borrowings and payables arising out of procurement of raw materials and other components. When a derivative is entered into for the purpose of being a hedge, the Company negotiates the terms of those derivatives to match the terms of the hedged exposure.
Where the amounts to be paid and received in a specifi c currency are expected to largely offset one another, no further hedging activity is undertaken.
Foreign currency denominated fi nancial assets and liabilities which expose the Company to currency risk are disclosed below. The amounts shown are those reported translated at the closing rate. Unhedged foreign currency risk exposure at the end of the reporting period has been expressed in Rupees.
Short term exposure Long-term exposure
USD EURO Others USD EURO Others
March 31, 2018
Financial assets 810.04 452.16 - - - -
Financial liabilities (5.12) (60.47) (5.49) - -
804.92 391.69 (5.49) - - -
March 31, 2017
Financial assets 392.85 653.58 0.97 - - -
Financial liabilities (1.53) (127.56) (11.43) (2,568.52) - -
390.32 526.02 (10.46) (2,568.52) - -
Foreign currency sensitivity
The following table illustrates the sensitivity of profi t and equity in regards to the Company’s fi nancial assets and fi nancial liabilities and the USD/Rs. exchange rate and EURO/Rs. exchange rate ‘all other things being equal’. If the Indian Rupee had strengthened/ weakened against the respective currency 5% during the year ended March 31, 2018 (March 31, 2017: 5%), then this would have had the following impact on profi t before tax and equity:
Strengthening Weakening
Year ended March 31,
2018
Year ended March 31,
2017
Year ended March 31,
2018
Year ended March 31,
2017
Increase/ (decrease) in profi t and equity
USD 40.25 (108.91) (40.25) 108.91
EURO 19.58 26.30 (19.58) (26.30)
Others (0.27) (0.52) 0.27 0.52
59.56 (83.13) (59.56) 83.13
NOTES TO FINANCIAL STATEMENTS FOR THE YEAR ENDED 31ST MARCH, 2018 (Contd.)(All amounts are in lakhs of Indian Rupees, except share data and as stated)

38
TVS Upasana Limited
Derivative instruments
The Company holds derivative fi nancial instruments such as foreign currency forward to mitigate the risk of changes in exchange rates on foreign currency exposure arising from settlement of borrowings. The counterparties of these contracts are generally banks. These derivative fi nancial instruments are determined using quoted forward exchange rates at the reporting dates based on information obtained from respective bankers.
c) Equity price risk
The Company’s investments in listed and unlisted equity securities are current. All the investments in the equity portfolio are reviewed and approved by the Board of Directors. As at the reporting date the investments in equity instruments amounted to Rs. 350.85 (March 31, 2017: ` 267.25)
(ii) Credit risk
Credit risk is the risk that a counterparty will not meet its obligations under a fi nancial instrument or customer contract, leading to a fi nancial loss. The Company is exposed to credit risk from its operating activities (primarily trade receivables) and from its fi nancing activities, including, foreign exchange transactions and other fi nancial instruments.
Credit risk is managed through credit approvals, establishing credit limits and continuously monitoring the credit worthiness of customers to which the Company grants credit terms in the normal course of business. The Company establishes an allowance for doubtful debts and impairment that represents its estimate of incurred losses in respect of the Company’s trade receivables, certain loans and advances and other fi nancial assets. The Company enters into long term contracts with its customers whereby it mitigates the risk exposure on high risk customers.
The carrying amount of fi nancial assets represents the maximum credit exposure.
Particulars ReferenceAs at
31 March 2018
As at31 March
2017Investments (i) 369.35 285.75
Loans (ii) 30.46 29.53
Cash and cash equivalents (iii) 3.38 4.41
Trade receivables (iv) 3,342.88 2,872.36
Security deposits (v) 328.72 330.18
Claims receivable (v) 27.25 36.82
Interest receivable (v) 0.03 0.03
Total 4,102.07 3,559.08
(i) Investments
This balance represents investments made by the Company in instruments of certain listed companies in the past. These investments are liquid in nature as the same is freely transferable in the stock exchange.
(ii) Loans
This balance is primarily constituted by loans given to employees. The Company does not expect any losses from non-recoverability by these concerned parties also taking into consideration the fact that the same have been granted to the employees of the Company.
As at March 31,
2018
As at March 31,
2017
Loans to employees 30.46 29.53
Net carrying amount 30.46 29.53
(iii) Cash and cash equivalents
The Company has its cash and bank balances deposited with credit worthy banks as at the reporting date. The credit worthiness of these banks are evaluated by the management on an ongoing basis and is considered to be good with low credit risk.
(iv) Trade receivables
The Company’s exposure to credit risk is infl uenced mainly by the individual characteristics of each customer. However, management also considers the factors that may infl uence the credit risk of its customer base, including the default risk associated with the industry and country in which customers operate. In monitoring customer credit risk, customers are grouped according to their credit characteristics, including end-user customers, their geographic location, industry, trading history with the Company and existence of previous fi nancial diffi culties. With respect to other fi nancial assets, the Company does not expect any credit risk against such assets except as already assessed. The Company is monitoring the economic environment in the country and is taking actions to limit its exposure to customers with customers experiencing particular economic volatility.
NOTES TO FINANCIAL STATEMENTS FOR THE YEAR ENDED 31ST MARCH, 2018 (Contd.)(All amounts are in lakhs of Indian Rupees, except share data and as stated)

39
Exposures to customers outstanding at the end of each reporting period are reviewed by the Company to determine incurred and expected credit losses. Historical trends of impairment of trade receivables do not refl ect any signifi cant credit losses. The Company has used a practical expedient by computing the expected credit loss allowance for trade receivable and other fi nancial assets, which comprise large number of small balances, based on a provision matrix. The provision matrix takes into account historical credit loss experience and adjusted for forward-looking information. Further, the Company also makes an allowance for doubtful debts on a case to case basis.The maximum exposure to credit risk for trade and other receivables are as follows:
As atMarch 31,
2018
As atMarch 31,
2017Not more than 180 days 3,349.25 2,844.93More than 180 days 17.81 27.43Sub-total 3,367.05 2,872.36Less: Loss allowance in accordance with expected credit loss model 24.18 -Total 3,342.88 2,872.36
Based on expected credit loss model, the Company has provided for Rs. 24.18 as of 31 March 2018 (31 March 2017: Nil)
(v) OthersOther fi nancial assets comprising of security deposits and advance recoverable primarily consists of deposits with TNEB for obtaining Electricity connections, rental deposits given for lease of premises. The Company does not expect any loss from non-performance by these counter-parties.
(iii) Liquidity riskLiquidity risk is defi ned as the risk that the Company will not be able to settle or meet its obligations on time or at reasonable price. Prudent liquidity risk management implies maintaining suffi cient cash and marketable securities and the availability of funding through an adequate amount of credit facilities to meet obligations when due. The Company’s treasury team is responsible for liquidity, funding as well as settlement management. In addition, processes and policies related to such risks are overseen by senior management. Management monitors the Company’s liquidity position through rolling forecasts on the basis of expected cash fl ows.The Company’s objective is to maintain a current ratio with an optimal mix of short term loans and long term loans. The Company assessed the concentration of risk with respect to refi nancing its debt and concluded it to be low. The Company has access to a suffi cient variety of sources of funding and debt maturing within 12 months can be rolled over with existing lenders. The Board of Directors periodically reviews the Company's business requirements vis-a-vis the source of funding.The table below provides details regarding the remaining contractual maturities of fi nancial liabilities at the reporting date based on contractual undiscounted payments
As at March 31, 2018 Carryingamount
Less than180 days
More than180 days
Borrowings* 6,115.65 1,315.65 4,800.00
Trade payables 2,142.76 2,142.76 -
Trade deposits - - -
Interest accrued but not due on borrowings 0.10 0.10 -
Employee benefi ts payable 25.83 25.83 -
Capital creditors 188.95 188.95 -
Other payable 150.25 150.25 -
Total 8,623.53 3,823.53 4,800.00
As at March 31, 2017
Borrowings* 7,765.41 5,196.89 2,568.52
Derivative liabilities 165.09 165.09 -
Trade payables 1,437.13 1,437.13 -
Trade deposits 0.10 0.10 -
Interest accrued but not due on borrowings 20.03 20.03 -
Employee benefi ts payable 180.34 180.34 -
Total 9,568.10 6,999.58 2,568.52
*excluding contractual interest payments
(v) Offsetting fi nancial assets and fi nancial liabilities
The Company does not have any fi nancial instruments that are offset or are subject to enforceable master netting arrangements and other similar agreements
NOTES TO FINANCIAL STATEMENTS FOR THE YEAR ENDED 31ST MARCH, 2018 (Contd.)(All amounts are in lakhs of Indian Rupees, except share data and as stated)

40
TVS Upasana Limited
30 Contingent liabilities and commitments
(to the extent not provided for)
As atMarch 31,
2018
As atMarch 31,
2017
Contingent liabilities
(a) Claims against the company not acknowledged as debt
- Sales tax/ Entry Tax - under appeal 585.01 673.93
- Income-tax - under appeal 92.68 72.56
(b) Guarantees excluding fi nancial guarantees 50.24 10.66
(c) Other money for which the company is contingently liable comprising of letter of credit 659.62 10.51
Capital commitments
Estimated amount of contracts remaining to be executed on capital account and not provided for 3,947.03 160.50
31 Related party disclosures
Parties are considered to be related if one party has the ability to control the other party or exercise signifi cant infl uence over the other party in making fi nancial and operating decisions.
I Related Parties with whom transactions have taken place during the year:
Ultimate Holding Company TV Sundram Iyengar & Sons Private Limited, Madurai
Holding Company Sundram Fasteners Limited, Chennai
Fellow Subsidiaries TVS Infotech Limited., Chennai
Sundram Fasteners Investments Limited., Chennai,
Sundram Non-Conventional Energy Systems Limited., Chennai,
Sundram Precision Components Limited., Chennai
Sundram International Limited, UK,
Sundram International Inc, Michigan, USA,
Key Management Personnel Arundathi Krishna, Managing Director
Enterprises in which key management personnel have signifi cant infl uence: Upasana Finance Limited (upto 4 October 2017)
Subsidiaries / joint ventures / associates of ultimate holding company: Southern Roadways Ltd., Madurai
TVS Electronics Limited
The Associated Auto Parts Private Limited
TVS Motor Company Limited
Lucas TVS Limited
Sundaram-Clayton Limited
NOTES TO FINANCIAL STATEMENTS FOR THE YEAR ENDED 31ST MARCH, 2018 (Contd.)(All amounts are in lakhs of Indian Rupees, except share data and as stated)

41
II The signifi cant related party transactions during the year and outstanding balance as at the reporting date are as follows:
Nature of transaction Holding Company
FellowSubsidiaries
Subsidiaries / joint ventures / associates of
ultimate holding company:
Enterprise in which key management
personnel have signifi cant infl uence
Purchases
Goods and Materials 110.98 - - -
(92.73) - - -
Sales
Goods and Materials 1,011.81 - 1,523.22 -
(919.53) - (1,484.93) -
Services
Rendered 517.43 - - -
(499.85) - - -
Received 113.73 29.26 - -
(178.07) (33.65) - -
Borrowings and fi nance costs
Repayment of Loan - - - 115.00
Interest on Inter Corporate Deposit 44.68 - - 4.69
(48.51) - - (11.50)
Dividend Received - - 0.63 -
- - (0.30) -
Dividend Paid 356.99 - - -
- - - -OthersLeasing inward or outward (or) hire purchase arrangements 59.11 - - -
(74.24) - - -
Guarantees & Collaterals furnished or availed 5,540.65 - - -
- - - -
Freight Charges - - 5.45 -
- - (6.37) -
Clearance Charges - - 0.51 -
- - - -
Canteen Running expenses 43.76 - - -
(78.69) - - -Outstanding balancesDue to the Company 216.98 - 331.79 -
(485.93) - (210.86) -
Due by the Company 49.30 15.80 0.64
(35.60) (3.98) (0.68) -
(Previous year fi gures are in brackets)
III Terms and conditions of transactions with related parties
- Transactions with related parties are at arm's length and all the outstanding balances are unsecured.
NOTES TO FINANCIAL STATEMENTS FOR THE YEAR ENDED 31ST MARCH, 2018 (Contd.)(All amounts are in lakhs of Indian Rupees, except share data and as stated)
42
TVS Upasana Limited
32 Segment reporting
The Company primarily caters to only a single segment, manufacture and supply automobile parts primarily comprising of spokes & nipples and cold extrusion components and accordingly has not presented segment information.
33 LeasesThe company has entered into lease agreements with respect of plant and equipments for a period up to fi ve years, which are in the nature of operating leases. Lease agreements are renewable for further period or periods on terms and conditions mutually agreed between the parties. Any variations in lease rentals are made in the event of a change in the basis of computation of lease rentals by the lessor. There are no restrictions imposed by the lease arrangements, concerning dividends, additional debt & further leasing.
(i) Future minimum lease payments
The future minimum lease payments to be made under non-cancellable operating leases are as follows:
Particulars As atMarch 31, 2018
As atMarch 31, 2017
Payable in less than one year 7.16 48.34
Payable between one and fi ve years - 7.16
(ii) Amounts recognised in the statement of profi t and loss 75.17 98.00
34 Events after the reporting period
The Board of Directors of the Company has proposed fi nal dividend in its meeting held on April 30, 2018 as disclosed under note 14B.
35 Prior year comparatives
The previous year fi nancial statements have been audited by a fi rm other than B S R & Co. LLP. Prior year fi gures have been reclassifi ed wherever necessary to conform to current year classifi cation.
As per our report of even date attached
for B S R & Co. LLP For and on behalf of the Board of Directors ofChartered Accountants TVS Upasana LimitedICAI Firm registration No.: 101248W/W-100022 CIN: U65991TN1992PLC022619
S Sethuraman Suresh Krishna Arundathi KrishnaPartner Chairman Managing DirectorMembership No. 203491 DIN : 00046919 DIN: 00270935
R Krishnan S Meenakshisundaram Chief Financial Offi cer & DirectorPlace : Chennai Company Secretary DIN: 00513901Date : April 30, 2018 ACS Membership No.: 9994
NOTES TO FINANCIAL STATEMENTS FOR THE YEAR ENDED 31ST MARCH, 2018 (Contd.)(All amounts are in lakhs of Indian Rupees, except share data and as stated)