tutorial and user’s guide - química orgánicaorganica1.org/teoria1411/manual_spartan.pdf ·...
TRANSCRIPT

Tutorial and User’s Guide
WAVEFUNCTION
Wavefunction, Inc.18401 Von Karman Avenue, Suite 370
Irvine, CA 92612 U.S.A.www.wavefun.com
Wavefunction, Inc., Japan Branch OfficeLevel 14 Hibiya Central Building, 1-2-9 Nishi-Shinbashi
Minato-ku, Tokyo, Japan 105-0003+81-3-5532-7335 • +81-3-5532-7373 fax
[email protected] • www.wavefun.com/japan
First Page 7/31/03, 10:29 AM1

Copyright © 2001-2004 by Wavefunction, Inc.
All rights reserved in all countries. No part of thisbook may be reproduced in any form or by anyelectronic or mechanical means including informationstorage and retrieval systems without permission inwriting from the publisher, except by a reviewer whomay quote brief passages in a review.
ISBN 1-890661-23-6
Printed in the United States of America
First Page 12/30/03, 2:21 PM2

This book derives from materials and experience accumulatedat Wavefunction and Q-Chem over the past several years. It owesmuch to members of both companies, both past and present. Specialthanks goes to Pamela Ohsan and Stephanie-Ann Yu for turning a“sloppy manuscript” into a finished book.
Acknowledgments
First Page 12/30/03, 2:21 PM3

First Page 12/30/03, 2:21 PM4

i
Scope of this GuideThis guide provides a general reference for both Spartan’04 and theEssential Edition of Spartan’04 for Windows. Following a briefsummary of “What’s New in Spartan’04”, it is divided into 17chapters grouped into three sections, along with several appendices.
Section I (Introduction, Chapter 1) introduces Spartan’04 as a toolfor exploring organic, bioorganic, inorganic and organometallicchemistry by way of molecular mechanics and quantum chemicalcalculations, together with an array of graphical models for conveyingthe results of these calculations.
Section II (Getting Started, Chapters 2 to 7) describes the overalloperating environment of Spartan’04 for Windows, and then providesan extensive set of “hands-on” tutorials. Most of the tutorials can becompleted with the Essential Edition, and sections which can not becompleted are marked as such. This section is the place to start fornew users of the program, and should also be perused by users ofprevious versions of SPARTAN.
Section III (Features and Functions, Chapters 8 to 17) describesin detail the functions available from the menus and dialogsincorporated into the graphical user interface for Spartan’04. The focusis on graphical input and manipulation of structure, input of otherrequired information, and text, spectral and graphical output resultingfrom molecular mechanics and quantum chemical calculations. Thissection is intended as a general reference to Spartan’04 for Windows.
What this guide does not do is document the “performance” and “cost”of the different molecular mechanics and quantum chemical modelsavailable in Spartan’04, or recommend specific models orcombinations of models for use on “real” chemical problems. Neitherdoes it show the utility of graphical models in presenting andinterpreting the results of the calculations. These topics are coveredin depth in “A Guide to Molecular Mechanics and Quantum
Scope 12/30/03, 2:34 PM1

ii
Chemical Calculations” available from Wavefunction, which alsoprovides a collection of illustrative examples.
Appendices provide an overview of the program’s overall architectureas well as its present capabilities and limitations (A), a directory offunctions under its menus (B), a listing of commonly-used options(C), a listing of units (D), NMR chemical shift standards (E), theproper citation for the program (F), instructions for installing theCambridge Structural Database (G), directions for making databasesfrom Spartan calculations (H) and directions for installing a networkHASP (I). Several of these appendices are included as part of theprogram’s “On Line Help” facilities.
Scope 12/30/03, 2:34 PM2

iii
What’s New inSpartan’04Several significant capabilities have been introduced in Spartan’04,and promise to expand in the future.
• NMR. This is available for chemical shifts with Hartree-Fockmodels. Future development will implement coupling constantsand to extend the overall capability to density functional models.Not available in Essential Edition.
• Solvation via mixed quantum mechanics/molecular mechanics.This allows not only calculation of the solvation energy but alsothe effect of the solvent on molecular properties. This is presentlyavailable for water as a solvent. Future development will extendthis to other solvents. Not available in Essential Edition.
• Spartan Molecular Database (SMD). This is a database ofcalculated structures, energies and selected molecular properties.SMD presently comprises approximately 50,000 organic and main-group inorganic molecules, each of which is available at up tofive different theoretical models: HF/3-21G, HF/6-31G*, EDF1/6-31G*, B3LYP/6-31G* and MP2/6-31G*. Additional modelsmay also be added in the future. Database entries may either beused to directly replace structures built by or imported into Spartan,and may be accessed through substructure searches. SMD isexpected to grow at 25%/year, and will soon include infrared,UV/vis and NMR spectra and to extend to transition-metalinorganic and organometallic compounds as well as transitionstates. EDF1/6-31G*, B3LYP/6-31G* and MP2/6-31G* entriesnot available in Essential Edition.
• UV/vis Spectra. This is presently limited to vertical excitationspectra based either on the difference in energy between Hartree-
Whats New 12/30/03, 3:40 PM3

iv
Fock and CIS models or between density functional (local, BP,EDF1, BLYP and B3LYP functionals) and time-dependent densityfunctional (TDDFT) models. Not available in Essential Edition.
• Import of two-dimensional structures. Input of SDF, TGF andSKC files and automatic conversion into 3D geometries.
• Intrinsic Reaction Coordinate. This constructs a series of stepswhich smoothly follow the reaction coordinate from the transitionstate to both reactants and products. Not available for semi-empirical models. Not available in Essential Edition.
A number of additional important improvements and enhancementsare implemented in Spartan’04.
• Use of NOE data in conformational searching.
• Display of hydrogen bonds.
• Plotting of infrared spectra.
• Inversion of a chiral center.
• Control over animation speed.
• Tube and Ball-and-Spoke models (optionally) showing multiplebonds.
• Automatic centering of molecules on screen.
• Help functions in individual dialogs.
Spartan’04 is generally faster than Spartan’02 due to improvedcompilers. Some specific calculations, e.g., frequencies using densityfunctional models, have been reworked and are significantly faster.
Whats New 12/30/03, 3:40 PM4

v
Table of ContentsSection I INTRODUCTION .............................................. 1
Chapter 1 Spartan’04 for Windows .................................... 3
Section II GETTING STARTED ........................................ 9
Chapter 2 Operating Spartan’04 ......................................... 11Starting and Quitting Spartan’04 .......................... 11Pull-Down Menus ................................................. 11Keystroke Equivalents .......................................... 11Toolbars ................................................................ 12Using the Mouse ................................................... 12Keyboard Functions .............................................. 14Selecting Molecules, etc ....................................... 14Dialogs .................................................................. 153-Dimensional Displays........................................ 16Changing Colors and Setting Preferences ............ 16Monitoring and Killing Jobs ................................. 16Iconifying Spartan’04 ........................................... 16
Chapter 3 Organic Molecules .............................................. 17Acrylonitrile .......................................................... 19Cyclohexanone ..................................................... 30Camphor ............................................................... 33Ethinamate ............................................................ 363-Cyano-4-methylcyclohexenyl radical ................ 38Infrared Spectrum of Benzyne .............................. 4113C NMR of cis-1,2-Dimethylcyclohexane ........... 44
Chapter 4 Groups of Organic Molecules ............................ 47Dienophiles in Diels-Alder Cycloadditions .......... 49Allyl Vinyl Ether ................................................... 55Internal Rotation in Dimethylperoxide ................. 58Hydration of Carbonyl Compounds...................... 62
TOC 12/30/03, 3:23 PM5

vi
Acidities of Carboxylic Acids ............................... 65Stereochemical Assignments from 13C NMR ....... 68Favoring One Tautomer Over Another ................. 70
Chapter 5 Organic Reactions ............................................... 73Ene Reaction of 1-Pentene.................................... 75Thermodynamic vs. Kinetic Control .................... 79Stereospecific Diels-Alder Reactions ................... 82Carbene Additions to Alkenes .............................. 85SN2 Reaction of Bromide and Methyl Chloride.... 89
Chapter 6 Biologically Interesting Molecules ..................... 93Vitamin E .............................................................. 95Androsterone......................................................... 97Tautomers of Nucleotide Bases ............................ 100Polyglycine ........................................................... 102Propamidine DNA Complex ................................. 106Hydrogen Bonding in Biopolymers ...................... 108
Chapter 7 Inorganic and Organometallic Molecules ........ 109Sulfur Tetrafluoride............................................... 111Benzene Chromium Tricarbonyl........................... 113Ziegler-Natta Polymerization of Ethylene ............ 115
Section III. FEATURES AND FUNCTIONS ....................... 117
Chapter 8 The File Menu ..................................................... 119New ....................................................................... 119Open ...................................................................... 119Close ..................................................................... 121Save....................................................................... 121Save As ................................................................. 121New Molecule ....................................................... 122Delete Molecule .................................................... 122Append Molecule(s) ............................................. 123Print....................................................................... 123Print Setup ............................................................ 124Exit ........................................................................ 124
TOC 12/30/03, 3:23 PM6

vii
Chapter 9 The Edit Menu .................................................... 125Undo ..................................................................... 125Cut ........................................................................ 125Copy ...................................................................... 125Paste ...................................................................... 125Find ....................................................................... 126Find Next .............................................................. 126Center .................................................................... 126Clear ...................................................................... 126
Chapter 10 The Model Menu ................................................. 127Wire....................................................................... 128Ball and Wire ........................................................ 128Tube ...................................................................... 130Ball and Spoke ...................................................... 130Space Filling ......................................................... 131Hide....................................................................... 131Global Model ........................................................ 132Coupled ................................................................. 132Hydrogens ............................................................. 132Labels .................................................................... 132Ribbons ................................................................. 133Hydrogen Bonds ................................................... 133Configure .............................................................. 133
Chapter 11 The Geometry Menu........................................... 135Measure Distance.................................................. 136Measure Angle ...................................................... 136Measure Dihedral .................................................. 137Freeze Center ........................................................ 138Set Torsions........................................................... 139Constrain Distance ................................................ 141Constrain Angle .................................................... 141Constrain Dihedral ................................................ 141Define Point, Define Ligand Point ....................... 142Define Plane.......................................................... 143Align Molecules.................................................... 144
TOC 12/30/03, 3:23 PM7

viii
Chapter 12 The Build Menu .................................................. 145Entry Model Kit .................................................... 146Expert Model Kit .................................................. 151Peptide Model Kit ................................................. 155Nucleotide Model Kit ........................................... 158General Molecule Building Functionality............. 160
Bond Rotation/Bond Sketching ...................... 160Atom/Fragment Replacement ........................ 160Chirality Inversion.......................................... 161
View ...................................................................... 161Add Fragment ....................................................... 161Delete .................................................................... 162Make Bond............................................................ 163Break Bond ........................................................... 164Minimize ............................................................... 164
Chapter 13 The Setup Menu .................................................. 165Calculations .......................................................... 166
Calculate ......................................................... 167Start From....................................................... 172Subject to ........................................................ 173Compute ......................................................... 173
Solvent....................................................... 174UV/vis ....................................................... 175IR ............................................................... 176NMR.......................................................... 176
Total Charge ................................................... 176Multiplicity ..................................................... 177Print ................................................................ 177Options ........................................................... 178Converge ........................................................ 178Global Calculations ........................................ 178
Surfaces................................................................. 179Surface ............................................................ 182Property .......................................................... 183Resolution....................................................... 184IsoValue .......................................................... 184
TOC 12/30/03, 3:23 PM8

ix
Submit ................................................................... 185
Chapter 14 The Display Menu ............................................... 187Output ................................................................... 187Properties .............................................................. 189
Molecule Properties........................................ 190Atom Properties.............................................. 191Bond Properties .............................................. 192Constraint Properties ...................................... 193Point and Plane Properties .............................. 194Surface Properties .......................................... 195Curve and Plot Properties ............................... 196Regression Properties ..................................... 200“Selected” Style.............................................. 201
Surfaces................................................................. 202Spectra .................................................................. 202
IR .................................................................... 202UV/vis ............................................................ 204NMR ............................................................... 205
Spreadsheet ........................................................... 206Plots ...................................................................... 216
Chapter 15 The Search Menu ................................................ 219Databases .............................................................. 219
Cambridge Structural Database ...................... 220Spartan Molecular Database........................... 226
Replacement .............................................. 228Substructure Searching.............................. 229
Transition States ................................................... 233Tautomers.............................................................. 235
Chapter 16 The Options Menu .............................................. 237About .................................................................... 237Preferences ............................................................ 238
Miscellaneous ................................................. 238Molecule ......................................................... 240VDW Radii ..................................................... 241Paths ............................................................... 242
TOC 12/30/03, 3:23 PM9

x
Colors .................................................................... 242Fonts ..................................................................... 243Monitor ................................................................. 244Calculator .............................................................. 245Model Kit .............................................................. 245File Toolbar ........................................................... 246Build Toolbar ........................................................ 246Geometry Toolbar ................................................. 246Search Toolbar ...................................................... 246Cascade ................................................................. 246Tile ........................................................................ 246Arrange Icons........................................................ 246
Chapter 17 The Help Menu ................................................... 247On-Line Help ........................................................ 247
Appendix A Capabilities and Limitations .............................. 249Essential Edition of Spartan’04 for Windows ...... 249Molecular Mechanics Models............................... 249Semi-Empirical Models ........................................ 249Hartree-Fock Models ............................................ 250Density Functional Models ................................... 250Møller-Plesset Models .......................................... 251Advanced Correlated Models ............................... 251Excited-State Models ............................................ 252Properties and Spectra .......................................... 252Graphics ................................................................ 253
Appendix B Menus ................................................................... 255
Appendix C Commonly-Used Program Options ................... 259Conformational Search ......................................... 259Geometry Optimization ........................................ 260Quantum Chemical Calculations .......................... 261Semi-Empirical Calculations ................................ 262Property and Spectra Calculations ........................ 263
Appendix D Units ..................................................................... 265
TOC 12/30/03, 3:23 PM10

xi
Appendix E NMR Chemical Shift Standards ........................ 267
Appendix F Citation ................................................................ 269
Appendix G Installing the Cambridge StructuralDatabase............................................................... 271
Appendix H Constructing Custom Databases ....................... 273
Appendix I Installing a Network HASP................................ 275
Index .......................................................................................... 277
TOC 12/30/03, 3:23 PM11

TOC 12/30/03, 3:23 PM12

1
IntroductionMolecular mechanics calculations and quantum chemical calculationsplay an ever-increasing role in modern chemistry. Traditionally, theyhave served to supply information about structures, relative stabilitiesand other properties of isolated molecules. Because of their inherentsimplicity, molecular mechanics calculations on complex moleculeshave spread widely throughout the chemical community. Quantumchemical calculations, including Hartree-Fock molecular orbitalcalculations, but especially calculations which take account of electroncorrelation, are much more time demanding. Only recently, have fastenough computers become widely available to make their applicationroutine among mainstream chemists.
Quantum chemical calculations may also be called on to furnishinformation about the mechanisms and product distributions ofchemical reactions, either directly by calculations on transition states,or indirectly by modeling the steric and electronic demands of thereactants. Quantitative calculations, leading directly to informationabout the geometries of transition states, and about reactionmechanisms in general, are becoming more and more common, whilequalitative models are still needed for systems which are too large tobe subjected to the more rigorous treatments. Finally, quantum chemicalcalculations may be asked to supply information to complementexisting experimental data or to replace it altogether, for example,atomic charges for QSAR analyses, and intermolecular potentials formolecular mechanics and molecular dynamics calculations.
Spartan’04 for Windows has been designed to address the everincreasing role which calculations play in chemistry and related fields.It represents a continued collaboration between Wavefunction, Inc.,and Q-Chem, Inc. Q-Chem codes supplement and extend thetraditional strengths of SPARTAN as an easy to learn and use tool for
Section I
Section I 12/30/03, 3:20 PM1

2
molecular mechanics and semi-empirical and Hartree-Fock molecularorbital calculations, as well as for a wide range of graphical models,with a full range of density functional models as well as a selectionof important post-Hartree-Fock models. All models have beenimplemented using what we believe are the most robust algorithmscurrently available, and have been especially tuned for highperformance on Intel processors.
Spartan’04 is intended to be utilized by chemists, not onlycomputational chemists who are already familiar with the capabilitiesof molecular mechanics and quantum chemical methods, but alsoexperimental chemists who may have little or no prior experience,but who want to use calculations much in the same way asexperimental techniques such as NMR spectroscopy. This ambitiousgoal is directly reflected in the program’s overall design criteria:“convenient access to a full range of modern molecular mechanicsand quantum chemical models”, and clearly distinguishes Spartan’04from other molecular modeling packages.
Section I 12/30/03, 3:20 PM2

3
Spartan’04 for WindowsThis chapter provides a brief discussion of the architecture ofSpartan’04 for Windows, focusing on the connectivity of graphics,database and computational components. Available molecularmechanics and quantum chemical methods are enumerated, and theiroverall role suggested.
Spartan’04 for Windows comprises a series of independent modulestightly connected via a graphical user interface, which is highlyfunctional yet rather simple and uncluttered. It has been designednot only to greatly reduce the drudgery and possibility of humanerror associated with the preparation of input, but also to guide theinterpretation of output. The interface is perhaps best viewed as aninteractive and intuitive window into a full range of moderncomputational techniques.
Chapter 1
GraphicalUser
Interface
MolecularMechanics
DatabasesCorrelated
DensityFunctional
Properties
Hartree-Fock
Spectra
Graphics
Semi-Empirical
Chapter 1 12/30/03, 3:20 PM3

4
Included in the interface are builders for organic, inorganic andorganometallic molecules, polypeptides and polynucleotides, as wellas a procedure for guessing transition states from a database of organicand organometallic reactions. Also included is the Spartan MolecularDatabase, a collection of over 50,000 calculated structures for organicand main-group inorganic molecules, each obtained from as many asfive different theoretical models, as well as an interface to theCambridge Structural Database, comprising over 300,000experimental X-ray crystal structures for organic and organometallicmolecules*. Finally, Spartan allows for import of a variety of“external” data files, most important among them being PDB (proteinstructures) and SDF (structure drawings). Thus, it is not only possibleto construct molecules “from scratch”, but also to access a wide varietyof existing structures.
Spartan’s interface also provides the gateway into a range of moderncomputational methods, including molecular mechanics models, semi-empirical and Hartree-Fock molecular orbital models, and a variety ofso-called correlated models including density functional models. Noneof these models is “ideal” for every application**. While the mostsophisticated quantum chemical models may yield excellent results,they will be likely be too expensive for routine application, and it willusually be necessary to contend with lesser treatments. Spartan’sinterface facilitates “mixing and matching” different molecularmechanics and quantum-chemical models. Results from one modelmay easily be passed on for further analysis with another (better) model.
* The Cambridge Structural Database itself is not included with Spartan’04, but rather isavailable on a subscription basis from the Cambridge Crystallographic Data Centre or oneof its distributors. Contact Wavefunction for information.
** Full discussion and assessment of the specific molecular mechanics and quantum chemicalmodels available in Spartan’04 is provided in: W.J. Hehre, A Guide to Molecular Mechanicsand Quantum Chemical Calculations, Wavefunction, Irvine, 2003. See also: W.J. Hehre,L. Radom, P.v.R. Schleyer and J.A. Pople, Ab Initio Molecular Orbital Theory, Wiley, NewYork, 1986; J. Kong, C.A. White, A.I. Krylov, C.D. Sherrill, R.D. Adamson, T.R. Furlani,M.S. Lee, A.M. Lee, S.R. Gwaltney, T.R. Adams, C. Ochsenfeld, A.T.B. Gilbert, G.S. Kedziora,V.A. Rassolov, D.R. Maurice, N. Nair, Y. Shao, N.A. Besley, P.E. Maslen, J.P. Dombroski, H.Daschel, W. Zhang, P.P. Korambath, J. Baker, E.F.C. Byrd, T. Van Voorhis, M. Oumi, S.Hirata, C.-P. Hsu, N. Ishikawa, J. Florian, A. Warshel, B.G. Johnson, P.M.W. Gill, M. Head-Gordon and J.A. Pople, J. Computational Chem., 21, 1532 (2000).
Chapter 1 12/30/03, 3:20 PM4

5
The simplest computational methods in Spartan’04 are molecularmechanics models using the SYBYL and MMFF94 force fields. Theseare applicable to the determination of equilibrium geometries andconformations of molecules comprising upwards of several thousandatoms. Molecular mechanics models are at present the onlycomputational techniques which are applicable to biopolymersincluding proteins. Very large molecule calculations andconformational analysis on smaller molecules, including bothassignment of lowest-energy conformer and identification ofcollections of “reasonable” low-energy conformers, are perhaps themost important role of molecular mechanics.
Quantum chemical models are required to account for the geometriesof transition states as well as to obtain reaction energies(thermodynamics) and activation energies (kinetics). The simplestof these are semi-empirical molecular orbital models, which can beroutinely applied to systems with one to two hundred atoms.Supported in Spartan’04 are the MNDO model (with “d” extensionsfor second-row and heavier main-group elements), the AM1 model,and the PM3 model with parameters for most transition metals.
Hartree-Fock molecular orbital models remain a mainstay of quantumchemical techniques, in particular, for equilibrium and transition-statestructure determination, and for thermochemical comparisons. Themodels available in Spartan’04 may be routinely applied to moleculeswith fifty to one hundred atoms, that is, typical “real” organic molecules.
Hartree-Fock models are, however, not adequate for thermochemicalcomparisons where bonds are broken or formed, nor do they providea proper account of the geometries of molecules incorporating transitionmetals. So-called correlated models are required. Several classes ofcorrelated models are available in Spartan’04*: density functionalmodels, Møller-Plesset models and coupled cluster models. Densityfunctional models may be applied as widely as Hartree-Fock models.On the other hand, the simplest Møller-Plesset model (MP2) is limitedto molecules comprising thirty or fewer atoms. An approximate “local
* Not available in the Essential Edition.
Chapter 1 12/30/03, 3:20 PM5

6
MP2” model, based on localized orbitals is available in Spartan’04. Itis less “costly” than MP2 and applicable to larger systems, but is stillsignificantly more expensive than either Hartree-Fock or densityfunctional models. Higher-order (MP3 and MP4) Møller-Plessetmodels and coupled cluster models are even more expensivecomputationally and, therefore, much more limited in their application.Density functional models and MP2 models may be used forequilibrium and transition-state structure determination as well asenergy calculations. The local MP2 model and higher-order correlatedmethods are available only for energy calculations.
Hartree-Fock and correlated models may be used with a variety ofall-electron Gaussian basis sets. Hartree-Fock models are oftenquite successful with minimal and split-valence basis sets, whilecorrelated models require at the very least polarization basis sets,and in some situations basis sets incorporating diffuse functions aswell. Pseudopotentials are available for use with both Hartree-Fockand correlated models for calculations on molecules incorporatingheavy elements.*
G3 and G3(MP2) energy calculations are also available in Spartan’04.*
While applicable at present only to very small systems, these“procedures”, which are in fact made up of a combination of differentmodels, have been shown to yield reaction energies in excellent accordwith experiment and, therefore, provide “benchmarks” against whichother calculations may be judged.
The majority of quantum chemical calculations have previously beenperformed on molecules in their electronic ground state. Only veryrecently have practical and reliable methods for excited-state speciesbecome available. Spartan’04 provides “singles” configurationinteraction (CI) techniques* for energies, equilibrium and transition-state geometries and conformations. In addition, energy calculations(only) on excited states with the CIS (D) model as well as a range ofdensity functional models*, may be performed.*
* Not available in the Essential Edition.
Chapter 1 12/30/03, 3:20 PM6

7
Spartan provides access to several common spectral quantities, inparticular infrared spectra (molecular mechanics, semi-empirical,Hartree-Fock, density functional and MP2 models), NMR spectra*
(Hartree-Fock models) and UV/vis spectra* (CIS, CIS(D) and densityfunctional models). These are available both as numerical data(vibrational frequencies, chemical shifts, etc.) as well as spectral plotswhere appropriate.
Finally, Spartan’04 provides a variety of “visual tools” to assist chemistsin interpreting the results of molecular mechanics and quantumchemical calculations. Not only do these include the usual variety ofstructure models, including structure models appropriate forbiopolymers, but also molecular orbitals, electron and spin densities,local ionization potentials and electrostatic potentials which can bedisplayed as surfaces, slices and property maps and manipulated inreal time. As many quantities as desired can be displayedsimultaneously, and visual comparisons easily made among them bothfor single molecules and among different molecules. “Movies” maybe made, based either on structural models alone or in combinationwith any graphical models, and these in turn are used to depictconformational change or chemical reaction.
* Not available in the Essential Edition.
Chapter 1 12/30/03, 3:20 PM7

Chapter 1 12/30/03, 3:20 PM8

9
Section IIGetting Started
The chapters in this section provide a brief introduction to thegraphical user interface for Spartan’04 for Windows and, followingthis, a series of simple tutorials. The objective of the latter is both toprovide “hands on” experience and, in doing so, illustrate the way inwhich molecular mechanics and quantum chemical calculations maybe set up, performed and interpreted. This is the place to start for“new users”. Users of previous versions of SPARTAN are also advisedto peruse this section.
No attempt has been made to illustrate all available program options.For this, the reader should consult Section III of this guide. Focus ison the use of Spartan’04 to calculate equilibrium and transition-stategeometries, to search conformation space, to evaluate reactionthermochemistry and activation energetics and to obtain infrared andNMR spectra. Also no attempt has been made to assess theperformance of the various molecular mechanics and quantumchemical models. In fact, the majority of tutorials make use only ofmolecular mechanics models and semi-empirical and Hartree-Fockmolecular orbital models, which in some cases may not lead to“acceptable results”.* Thorough assessment of all models availablein Spartan’04 is provided in “A Guide to Molecular Mechanics andQuantum Chemical Calculations”.
Graphical models are illustrated in several of the tutorials whichfollow, and connections between specific models and chemicalobservables are pointed out, for example, between electrostaticpotential maps and electrophilic character. A more complete account
* This is a deliberate decision, in that it “minimizes” the time required to complete the tutorialsand allows nearly all tutorials to be completed using only the Essential Edition of Spartan’04(which lacks density functional, MP2 and other correlated calculations). Tutorials or sectionsof tutorials which cannot be completed with the Essential Edition are indicated as such.
Section II 12/30/03, 3:42 PM9

10
is provided in the aforementioned guide. Spartan’04 for Windowsprovides greatly enhanced capabilities over previous versions fordisplay and manipulation of structure models for biopolymers, andthese too are illustrated.
Operating Spartan’04 outlines the basic workings of Spartan’04’sgraphical user interface. It should be perused before starting thetutorials and referred back to as needed. The tutorials, which makeup the bulk of this section, are divided across five chapters: OrganicMolecules, Groups of Organic Molecules, Organic Reactions,Biologically Interesting Molecules and Inorganic/OrganometallicMolecules. The first two of these cover a number of “basic” operationsand should be completed first, and in that order. The remainingchapters cover more specialized topics.
Estimates for required computer time (in minutes, assuming a 2GHzP4) are indicated at the top of the first page of each tutorial.
Where two times are provided, the second corresponds to the totaltime including the optional part. No times are provided where noactual calculations are to be performed.
5 mins
Section II 12/30/03, 3:42 PM10

11
Operating Spartan’04This chapter describes the general operating features of Spartan’04for Windows. It should be read prior to starting the tutorial.
Starting and Quitting Spartan’04
To start, click on the Start button, then click on Programs, and finallyclick on Spartan’04. To quit, select Exit from the File menu.
Pull-Down Menus
Program functions may be accessed using pull-down menus underthe headings in the menu bar, e.g., the Setup menu.
A listing of menu functions is provided in Appendix B.
Keystroke Equivalents
Keystroke equivalents for menus are designated by the underlined letter:File, Edit, Model, Geometry, Build, Setup, Display, Search, Optionsand Help. To access a menu, press the Alt key and the appropriateletter key (case insensitive), e.g., Alt “S” to access the Setup menu.
Each menu entry is designated by an underlined letter. To access theentry, press the appropriate letter key, e.g., press the C key to accessthe Calculations dialog.
Chapter 2
Chapter 2 12/30/03, 3:45 PM11

12
Toolbars
Toolbars provide convenient access to selected functions under theFile, Build, Geometry and Search menus.
New Break Bond Constrain Angle
Open Minimize Constrain Dihedral
Close Measure Distance Define Point
Save As Measure Angle Define Plane
View Measure Dihedral Align Molecules
Add Fragment Freeze Center Databases
Delete Set Torsions Transition States
Make Bond Constrain Distance Tautomers
If desired, one or more toolbars can be removed from view usingfunctions under the Options menu (see Chapter 16).
Using the Mouse
The following functions are associated with the two-button mouse.
button
keyboard left right
– picking, X/Y rotate, exchangea X/Y translate
Shift range picking, Z rotate scalingb
Ctrl global X/Y rotatec global X/Y translate
Ctrl + Shift multiple picking, global Z rotatec scalingb
Ctrl fragment X/Y rotate, chirality fragment X/Y translate(build mode) inverta
Ctrl + Shift fragment Z rotate scalingb
(build mode)
Alt group picking, bond rotation bond stretching
a) Requires double clicking.b) Scaling is always applied to all open molecules and all fragments.c) Global rotations can be either molecule or screen centered. This is controlled by Global
Rotate in the Miscellaneous Preferences dialog (Preferences... under Options menu).
Chapter 2 12/30/03, 3:45 PM12

13
Mouse/keyboard operations may be broadly separated into twocategories: selection (picking) and manipulation (translation/rotation).
Selection. The left button is used for picking of objects on screenand/or of menu items. Left and right buttons together are used to definea selection box for copying/cutting to the clipboard, as well as formultiple model selection. Together with the Shift key, the left buttonallows for picking over a range. Together with the Ctrl (Control)key, the left button allows for multiple picking. Both range and multiplepicking applies not only to text items in lists, but to atoms and bondsin molecules as well. Together with the Alt key, the left button allowsfor selection of an entire group (detached molecular fragment). Inbuild mode, double clicking the left button leads to atom or groupexchange while double clicking on an atom with the Ctrl keydepressed leads to inversion in chirality.
Manipulation. The left button is used for rotation and the right buttonis used for translation and scaling of objects on screen. With no keysdepressed, the left mouse button gives rise to rotation about the Xand Y (screen) axes; the right mouse button gives rise to translationin the X and Y (screen) directions. Together with the Shift key, theleft mouse button gives rise to rotation about the Z direction and theright mouse button gives rise to scaling.
The Ctrl key in conjunction with the left or right mouse buttons and(optionally) the Shift key, signifies a change in focus away from thedefault for the purpose of rotations and translations. Outside of “buildmode”, the default is focus on a single molecule (the “selected”molecule). Use of the Ctrl key changes focus to the entire set ofmolecules on screen, meaning that rotations and translations are carriedout globally. In “build mode”, the default is focus on the full set offragments which make up the molecule being constructed, and rotationsand translations refer to this set of fragments as a whole. Use of theCtrl key changes focus to a single fragment (the selected fragment),and rotations and translations now refer only to this fragment.
Use of the Alt key in addition to the left mouse button allows forrotation about a selected bond and, in addition to the right mousebutton, for stretching of the selected bond.
Chapter 2 12/30/03, 3:45 PM13

14
Keyboard Functions
Additional keys control various Spartan’04 functions. These areenumerated below:
3 Shifts into 3D (stereo). Pressing 3 again returnsto non-stereo display.
Page Up, Page Down Moves “up” (Page Up), “down” (Page Down),Home, End to the “top” (Home) and to the “bottom” (End)
of the set of open molecules. Also, moves upand down pages in the Output dialog.
Insert In build mode only, inserts a new fragment onscreen. This is accomplished by selecting thefragment from the model kit, holding down theInsert key and clicking on screen. One-timefragment insertion can also be accomplished byclicking on the Insert button at the bottom ofthe model kit prior to clicking on screen. See“Entry Model kit” in Chapter 12.
Delete Allows deletion of a fragment, a free valence,reaction arrow, the contents of a selection box,a spectrum, a curve or a plot. Deletion isaccomplished by holding down the Delete keyand clicking on the fragment, etc. No warningsare provided. Deletion may also be invoked byselecting Delete from the Build menu or byclicking on the icon, prior to clicking on thefragment, etc.
Selecting Molecules, etc.
Two or more molecules may be simultaneously displayed inSpartan’04’s window. However, only one molecule may be selected.The selected molecule has access to all capabilities (moleculebuilding, job setup and submission and text and graphical displayand manipulation), while non-selected molecules may only bedisplayed as static images. The exceptions involve scaling and theuse of the Ctrl key.
Chapter 2 12/30/03, 3:45 PM14

15
Selection of a molecule occurs by clicking on its structure model oron any of its associated graphical surfaces. This results in deselectionof the previously selected molecule. Molecular properties for theselected molecule are available in the Properties dialog (Displaymenu). Atom, bond and surface display properties, as well asinformation about geometrical constraints may be accessed bysubsequent clicking on an atom, bond, graphical display, or constraintmarker respectively, associated with the selected molecule. Selectedatoms, bonds and constraint markers are highlighted (colored gold).Clicking on the selected atom, bond or constraint marker resets thedisplay to molecular properties. Clicking on another molecule resultsin display of molecular properties for that molecule. Information aboutplots (including spectra) and changes to plot style and range are alsoavailable from this dialog.
Where the molecule belongs to a list with more than a single member,selection from among the different members in the list may be madeusing either the and buttons or the scroll bar at the bottom left ofthe screen. Alternatively, if the spreadsheet for the list is open on screen(see Chapter 14), selection can be made by clicking on the name ofthe desired molecule at the left of the spreadsheet. Clicking on atthe bottom left of the screen “animates” the display of molecules inthe list, that is, steps through them sequentially. This is useful fordisplaying a progression of graphical surfaces along a reactioncoordinate. Clicking on (which replaces ) stops the animation.
Two or more molecules from the same list may be displayed at once(although only one may be selected). Molecules are marked for displayby checking the box immediately to the right of the molecule namein the spreadsheet (Chapter 14).
Dialogs
Dialogs are either “modal” (as indicated by “...” following theirreference in a menu) or “non-modal”. Modal dialogs (Open, SaveAs, Append Molecule(s), Print and Print Setup from the File menu,Find from the Edit menu, Configure from the Model menu,Calculations from the Setup menu, Plots from the Display menu
Chapter 2 12/30/03, 3:45 PM15

16
and About, Preferences and Fonts from the Options menu) need tobe dismissed before program operation can continue, while non-modaldialogs may be kept open on screen. Non-modal dialogs fall into twocategories: those which reference the selected molecule (or list ofmolecules) and those which reference a specific molecule (or list ofmolecules). Only one copy of each of the former may be open onscreen, while several copies of the latter (each copy referring to adifferent molecule or list of molecules) may be open on screen.Properties, Surfaces and Spectra exemplify dialogs which refer tothe selected molecule, while Output and Spreadsheet exemplifydialogs which refer to a specific molecule.
3-Dimensional Displays
Any object displayed on Spartan’04’s screen may be rendered in 3D(stereo) using color filtration techniques. “Red/blue” glasses (suppliedwith Spartan’04) must be worn. 3D is turned “on” and “off” bytoggling the “3” key, or by checking Stereo in the MiscellaneousPreferences dialog under the Options menu (Chapter 16).
Changing Colors and Setting Preferences
Colors and Preferences... under the Options menu (Chapter 16)allows for changing default background and graphical object colors,and for setting (and resetting) program defaults, respectively. Furthercontrol of color is discussed in Chapter 14.
Monitoring and Killing Jobs
Monitor under the Options menu (Chapter 16) allows for monitoringof executing jobs as well as for killing jobs.
Iconifying Spartan’04
Spartan’04 may be iconified by clicking on “ ” at the top right ofthe screen. A small icon appears at the bottom of the screen.
Clicking on this icon returns the user to Spartan’04.
Chapter 2 12/30/03, 3:45 PM16

17
Chapter 3Organic Molecules
This chapter shows how to construct organic molecules from atomicfragments, functional groups and rings, how to carry out quantumchemical calculations, how to calculate and draw infrared and NMRspectra and how to interpret graphical models. It also illustrates useof the Spartan Molecular Database of calculated structures, energiesand molecular properties as well as Spartan’04’s interface to theCambridge Structural Database.
The simplest building blocks incorporated into Spartan’04’s entrymodel kit are “atomic fragments”. These constitute specification ofatom type, e.g., carbon, and local environment, e.g., tetrahedral.However, much of organic chemistry is organized around functionalgroups, collections of atoms the structure and properties of whichare roughly the same in every molecule. The entry model kit alsoincorporates a small library of functional groups which can easily beextended or modified. For example, the carboxylic acid group maybe modified to build a carboxylate anion (by deleting a free valencefrom oxygen), or an ester (by adding tetrahedral carbon to the freevalence at oxygen).
RC
OH
C
carboxylic acid
RC
O–
O
carboxylate anion
RC
OCH3
O
ester
Polyatomic rings are also common components in organic molecules,and the entry model kit incorporates a library of commonly-encountered hydrocarbon rings, which can easily be modified by atomreplacement. For example, pyridine can be built starting from benzeneby selecting aromatic nitrogen from the list of atomic fragments, andthen double clicking on one of the carbons.
Chapter 3.1 12/30/03, 3:48 PM17

18
N
pyridinebenzene
select aromatic nitrogenand double click on carbon
Functional groups may also be modified in this manner.
The tutorials in this chapter illustrate construction of organic moleculesusing atomic fragments, functional groups and rings. They alsoillustrate the way in which quantum chemical calculations are set up,their results examined and interpreted, and infrared and NMR spectracomputed and displayed. A variety of graphical models are introducedand illustrated. Finally, examples of the use of the Spartan MolecularDatabase of calculated molecular structures, energies and propertiesand of the Cambridge Structural Database of experimental X-raycrystal structures are provided.
Chapter 3.1 12/30/03, 3:48 PM18

19
Acrylonitrile
C C
H
H H
C
N
Acrylonitrile provides a good opportunity to illustrate the basics ofmolecule building in Spartan’04, as well as the steps involved incarrying out and analyzing a quantum chemical calculation.
1. Click with the left mouse button on File from the menu bar.
Then click on New from the menu which appears (or click onthe icon in the File toolbar). The “entry” model kit appears.
1 min
Chapter 3.1 12/30/03, 3:48 PM19

20
Among other things, it contains a library of atomic fragments.Click on trigonal planar sp2 hybridized carbon from thefragment library. The atom icon is shown in reverse video toindicate that it is “active”. In addition, a model of the fragmentappears at the top of the model kit. Bring the cursor anywhereon screen and click. Rotate the carbon fragment (drag themouse while holding down the left button) so that you canclearly see both the double free valence (“=”) and the two singlefree valences (“-”).
Spartan’04’s model kits connect atomic fragments (as well asgroups, rings and ligands) through free valences. Any remainingfree valences will automatically be converted to hydrogen atoms.
2. sp2 carbon is still selected. Click on the double free valence.The two fragments are connected by a double bond, leavingyou with ethylene. If you make a mistake and click instead onthe single free valence, select Undo from the Edit menu. Youcan also start over by selecting Clear from the Edit menu.
Spartan’04’s entry model kit allows only the same type offree valences to be connected, e.g., single to single, double todouble, etc.
3. Click on Groups in the model kit, and then select Cyano fromamong the functional groups available from the menu.
Chapter 3.1 12/30/03, 3:48 PM20

21
Click on any of the four single free valences on ethylene (theyare all the same). This bonds the cyano group to ethylene,leaving you with acrylonitrile.*
4. Select Minimize from the Build menu (or click on the iconin the Build toolbar).
The final molecular mechanics strain energy (8.65 kcal/mol)and symmetry point group (Cs) are provided at the bottom rightof the screen.
5. Select View from the Build menu (or click on the icon inthe Build toolbar). The model kit disappears, leaving only aball-and-spoke model of acrylonitrile on screen.
ball-and-spoke model
This model can be manipulated (rotated, translated andzoomed) by using the mouse (if necessary, in conjunction withkeyboard functions). To rotate the model, drag the mouse whileholding down the left button; to rotate in the plane of the screen
* You could also have built acrylonitrile without using the Groups menu. Starting from scratch(Clear from the Edit menu), first build ethylene as above, then select sp hybridized carbon
from the model kit and then click on one of the free valences on ethylene. Next, select sphybridized nitrogen from the model kit and click on the triple free valence on the spcarbon. Alternatively, you could have built the molecule entirely from groups. Starting fromscratch, click on Groups, select Alkene from the menu and click anywhere on screen. Thenselect Cyano from the menu of functional groups and click on one of the free valences onethylene. In general, molecules can be constructed in more than one way.
Chapter 3.1 12/30/03, 3:48 PM21

22
also hold down the Shift key. To translate the model, drag themouse with the right button depressed. To zoom the model(translation perpendicular to the screen), hold down the Shiftkey in addition to the right button while dragging the mouse.
6. One after the other, select Wire, then Ball and Wire, thenTube and finally Space Filling from the Model menu.
wire model ball-and-wire model tube model space-filling model
7. Return to a tube or ball-and-spoke model. Select Configure...from the Model menu, and check Label under “Atom” in theConfigure dialog which appears.
Chapter 3.1 12/30/03, 3:48 PM22

23
Click on OK to remove the dialog. Numbers will appear nextto the individual atoms together with atomic symbols. Removethe atom labels by selecting Labels from the Model menu.*
8. Select Measure Distance from the Geometry menu (or clickon the icon in the Geometry toolbar).
A message will appear at the bottom left of the screen.
Click on two atoms, e.g., the two carbons involved in the doublebond. Each atom will be colored gold, and the distance betweenthe two will be displayed at the bottom right of the screen.
Where the two atoms are bonded, an alternative is to click onthe bond. In this case, the bond will be colored gold. Anotherdistance may be obtained by selecting another pair of atoms (oranother bond), and so forth.
Measure Angle and Measure Dihedral from the Geometrymenu ( and icons from the Geometry toolbar) operate ina similar manner. In the former case, you will need to identifythree atoms or two bonds, and in the latter case, you will needto identify four atoms or three bonds. When you are done,click on .
* Labels from the Model menu was automatically selected (turned “on”) following exit fromthe Configure dialog with OK or Apply.
Chapter 3.1 12/30/03, 3:48 PM23

24
9. Select Calculations... from the Setup menu.
Perform the following operations in the Calculations dialogwhich appears.
a. Select Equilibrium Geometry from the top menu to theright of “Calculate”. This specifies optimization ofequilibrium geometry.
b. Select Hartree-Fock and then 3-21G(*) from the twobottom menus to the right of “Calculate”. This specifies aHartree-Fock calculation using the 3-21G split-valencebasis set.*
When you finish, click on OK to remove the dialog.
10. Select Submit from the Setup menu.** A file browser appears.
* 3-21G(*) indicates that the 3-21G basis set is to include polarization type functions on second-row and heavier, main-group elements. Polarization functions are not provided for hydrogenor first-row elements. For a discussion of basis sets supported by Spartan’04, see “A Guideto Molecular Mechanics and Quantum Chemical Calculations”.
** You could also have clicked on Submit inside the Calculations dialog.
Chapter 3.1 12/30/03, 3:48 PM24

25
Type the name “acrylonitrile_3-21G” in the box to the right of“File name”, and then click on Save.* You will be notified thatthe calculation has been submitted.
Click on OK to remove the message from the screen.
After a molecule has been submitted, and until the calculationhas completed, you are not permitted to modify any dialogsor other information associated with it.
11. You will be notified when the calculation has completed.
Click on OK to remove the message from the screen. SelectOutput from the Display menu.
* You can use default names (spartan1, spartan2, . . .) simply by clicking on Save.
Chapter 3.1 12/30/03, 3:48 PM25

26
A window containing “text output” for the job appears.
You can scan the output from the Hartree-Fock calculation byusing the scroll bar at the right of the window. The informationat the “top” of the dialog includes the task, basis set, numberof electrons, charge and multiplicity, as well as further detailsof the calculation. Below this is the symmetry point group ofthe molecule that was maintained during the optimization.
Eventually, a series of lines appear, each beginning with “Cycleno:”. These tell the history of the optimization process. Eachline provides results for a particular geometry; “Energy” givesthe energy in atomic units (1 atomic unit = 627.5 kcal/mol =2625 kJ/mol) for this geometry, “Max Grad.” gives themaximum Cartesian gradient, and “Max Dist.” gives themaximum displacement of atoms between cycles. “Neg.Eigen.” reports the number of negative eigenvalues uncoveredin the optimization procedure. This column should be blank
Chapter 3.1 12/30/03, 3:48 PM26

27
(0) at the end of a geometry optimization. Ideally, the energywill monotonically approach a minimum value for an optimizedgeometry, and Max Grad. and Max Dist. will each approachzero. If the geometry was not optimized satisfactorily an errormessage, such as: “Optimization has exceeded N steps – Stop”,will be displayed following the last optimization cycle. Youwould then have been notified that the job had failed.
Near the end of the output are the final total energy(-168.82040 atomic units for acrylonitrile with the 3-21G basisset), and the computation time. Click on in the top right-hand corner of the dialog to remove the dialog from the screen.
You may examine the final total energy and the dipole moment(among other properties) without having to go through the textoutput. Select Properties from the Display menu. TheMolecule Properties dialog appears.
To see the dipole moment vector (indicating the sign anddirection of the dipole moment), check the box to the left ofDipole. (A tube model is best for this display.)
When you are done, turn “off” display of the dipole momentvector by unchecking the box.
Chapter 3.1 12/30/03, 3:48 PM27

28
Click on an atom. The (Molecule Properties) dialog will bereplaced by the Atom Properties dialog.
Among other things, this provides three different sets of atomiccharges: “Electrostatic”, “Mulliken” and “Natural”. To obtainthe charge on another atom, simply click on it. Inspect all theatomic charges on acrylonitrile (by clicking on the appropriateatoms). When you are done, click on at the top right of theAtom Properties dialog to remove it from the screen.
12. Select Surfaces from either the Setup or Display menu.
Click on Add... (at the bottom of the dialog) to bring up theAdd Surface dialog.
Chapter 3.1 12/30/03, 3:48 PM28

29
Select density from the Surface menu and potential from theProperty menu.* This requests an electrostatic potential map(an electron density surface onto which the value of theelectrostatic potential has been mapped). Click on OK. A line“density potential . . .” appears at the top of the dialog. (If youmake a mistake, click on this line and then click on Delete atthe bottom of the dialog.)
13. Submit the job (Submit from the Setup menu). When complete,click on the line “density potential . . .” inside the Surfaces dialog.The surface itself corresponds to the electron density andprovides a measure of the overall size and shape of acrylonitrile.The colors indicate values of the electrostatic potential on thissurface; colors toward red correspond to negative potential(stabilizing interaction between the molecule and a positivecharge), while colors toward blue correspond to positivepotential. The nitrogen (the most electronegative atom) is redand the hydrogens (the most electropositive atoms) are blue.
14. Select Close from the File menu (or click on the icon fromthe File toolbar) to remove acrylonitrile from the screen.** Alsoclose any dialogs which may still be open.
* In this and other tutorials, Resolution will be set to medium. Both lower and higher resolutionimages can be obtained.
** While Spartan permits as many molecules as desired on screen at a given time, it willgenerally be less confusing for first-time users to handle but a single molecule.
Chapter 3.1 12/30/03, 3:48 PM29

30
Cyclohexanone
O
Cyclohexanone provides the opportunity to illustrate additionalbuilding features as well as graphical models for investigation of thestereoselectivity of an important class of organic reactions.
1. Click on . Click on Rings and select Cyclohexane from themenu of rings.
Click anywhere on screen and cyclohexane will appear. Selectsp2 carbon from the model kit. Double click on any carbon(not free valence). The sp3 hybridized center will be replacedby an sp2 hybridized carbon.
Spartan’04’s entry model kit allows replacement of fragments,subject both to the usual valence rules and to the availability offree valences. For example, replacement of an sp3 carbon by ansp2 carbon requires that at least two free valences be available.This is possible for cyclohexane (above), but would not havebeen allowed for the substituted ring carbon in methylcyclohexane
•
•
Me
•
X
Select sp2 oxygen from the model kit. Click on the doublefree valence on the sp2 carbon. You have made cyclohexanone.Click on to produce a final structure with Cs symmetry, andthen on to remove the model kit.
2 mins
Chapter 3.2 12/30/03, 4:00 PM30

31
2. Select Calculations... from the Setup menu. SpecifyEquilibrium Geometry from the top menu to the right of“Calculate”, and Hartree Fock and 3-21G(*) from the twobottom menus to the right of “Calculate”. Click on OK.
3. Cyclohexanone undergoes nucleophilic attack at the carbonylcarbon, and it is reasonable to expect that the molecule’s lowest-unoccupied molecular orbital (the LUMO) will be localizedhere. To visualize the LUMO, enter the Surfaces dialog (Setupor Display menu). Click on Add..., and select LUMO fromthe Surface menu (none from the Property menu). Click onOK. Also request an electron density surface onto which the(absolute) value of the LUMO has been mapped in color (aso-called LUMO map). Click on Add..., select density fromthe Surface menu and |LUMO| from the Property menu. Clickon OK. Submit the job (Submit from the Setup menu) withthe name “cyclohexanone_3-21G”.
Calculation of geometry and of graphical displays may either becompleted in one submission (as in the present example), or intwo or more submissions (as in the previous example). Spartan’04keeps track of what has been done and will not performunnecessary calculations.
4. After the calculations have completed, reenter the Surfacesdialog and click on the line “LUMO . . .”. The LUMO ofcyclohexanone appears. As expected, this is a π* orbitalprimarily localized on the carbonyl group.
5. Inside the Surfaces dialog, turn “off” the display of the LUMOby clicking on the line “LUMO . . .”. Next, click on the line“density |LUMO| . . .” to display the electron density surfaceonto which the (absolute) value of the LUMO has been mapped.Colors toward the red indicate small (absolute) values of theLUMO (near zero), while colors toward the blue indicate large(absolute) values of the LUMO. Note the “blue spot” directlyover the carbonyl carbon. This corresponds to the maximumvalue of the LUMO and is where nucleophilic attack will occur.
Chapter 3.2 12/30/03, 4:00 PM31

32
6. You will see that the “blue spot” over the axial face of thecarbonyl carbon is “bigger” than that over the equatorial face.This indicates preferential attack by nucleophiles onto the axialface. Quantify the difference by measuring the (absolute) valueof the LUMO on these two faces. Bring up the (Molecule)Properties dialog (Display menu) and click anywhere on theLUMO map. The Surface Properties dialog appears.
Turn the map such that you can clearly see the axial face ofthe carbonyl carbon, and click two times* on the area ofmaximum blue. The (absolute) Value of the LUMO at thesurface point you have selected is provided in the dialog. Notethe value, and then turn the map over such that you can nowsee the equatorial face of the carbonyl carbon, and click onthe point of maximum blue on this face. Do these values supportyour qualitative conclusions from viewing the image?
7. Remove cyclohexanone and any remaining dialogs from thescreen.
* All controls in the Properties dialogs operate in a “toggle” manner. Thus, the first click onthe surface “toggles” to the previous (molecule) mode and the second click back to thesurface mode.
Chapter 3.2 12/30/03, 4:00 PM32

33
Camphor
O
CH3H3C
H3C
Camphor illustrates how one molecule may be used as the startingpoint for another. It also illustrates a search on the Cambridge StructuralDatabase (CSD).* No calculations are involved in this example.
1. Bring “cyclohexanone_3-21G” (previous example) back ontothe screen. Select Open... from the File menu (or click on the
icon from the File toolbar) and double click on“cyclohexanone_3-21G” in the dialog which results. Next selectSave As... from the File menu (or click on the icon from theFile toolbar), supply the name “camphor” and click on Save.
2. Select Add Fragment from the Build menu (or click on the icon from the Build toolbar) to bring up the entry model
kit. Click on sp3 carbon from the model kit and then clickon the axial free valence two positions removed from thecarbonyl carbon. You have made axial 3-methylcyclohexanone.
3. Select Make Bond from the Build menu (or click on the icon from the Build toolbar). Click on one of the free valencesof the sp3 carbon which you have just added and then on theequatorial free valence on the opposite side of the six-membered ring (adjacent to the carbonyl group). A bond willbe drawn. Click on to produce a refined (intermediate)structure. Finish the structure by adding three methyl groups(click on from the model kit and, one after the other, clickon the three appropriate free valences). Finally, click on togive a minimized camphor geometry with C1 symmetry. Clickon to remove the model kit.
* In order to complete this tutorial, CSD will need to be licensed and installed. For informationabout a trial subscription, contact Wavefunction. For installation instructions, see Appendix G.
Chapter 3.2 12/30/03, 4:00 PM33

34
4. Select Configure... from the Model menu. Check R/S under“Atom” in the dialog which results, and click on OK. R/S labelsnow appear (only) on the two bridgehead carbons. Both shouldbe R (or both S), depending on which enantiomer you havebuilt. You can if you wish turn “off” the labels by selectingLabels from the Model menu.
5. Move the molecule to the far right of the screen. Then, selectDatabases from the Search menu (or click on the icon fromthe Search toolbar).
Click on the CSD tab at the top of the Databases dialog whichresults. This brings up the CSD dialog.
Click on one of the free valences on the “methyl group” whichyou added to the bridgehead carbon adjacent to the carbonylgroup. The free valence is replaced by an orange cone. Thissignifies that the search is to be restricted to molecules whichderive from substitution of camphor at this carbon.
Chapter 3.2 12/30/03, 4:00 PM34

35
6. Click on the Search button at the bottom of the dialog. “Hits”will appear in the text box at the right of the CSD dialog.
7. Wait for the search to complete, or terminate it at any time byclicking on to the right of the Search button. Hits for whichstructural data are available are indicated by filled yellowcircles.* Click on any one of these. Its name will be highlightedand a structure model will appear in the window at the top ofthe dialog. This model can be manipulated in the usual way.**
(You need to position the cursor inside the window.)
8. When you are done, remove the CSD dialog (click on at thetop right) and close “camphor.”
* Unfilled circles correspond to “hits” for which structural data are unavailable.** One (or more) structures may be transfered to Spartan’s file system using the Retreive
button. Full discussion is provided in Chapter 15.
Chapter 3.2 12/30/03, 4:00 PM35

36
Ethinamate
O
O
NH2
Acrylonitrile, cyclohexanone and camphor are examples of moleculeswhich can adopt only a single conformation. Much more commonare molecules which can adopt more than one conformation, usuallydue to rotation about single bonds or puckering of rings. The sedativeethinamate is not atypical, and presents an interesting question ofwhether the alkyne or the carbamate occupies the “favored” equatorialposition on the six-membered ring.
This tutorial, as well as the one immediately following, illustrate thesimplest approach to dealing with conformationally-flexiblemolecules, that is, finding the lowest-energy conformer (the globalminimum). Tutorials in later chapters address the more difficultproblem of identifying “all reasonable” low-energy conformers. Thepresent exercise is restricted to use of MMFF molecular mechanics.
1. Bring up the entry model kit ( ). Click on Rings, selectCyclohexane from the menu and click anywhere on screen.Click on sp3 oxygen ( ) in the model kit and add to either anequatorial or axial free valence on cyclohexane. Click onGroups and select Amide from the menu. Make certain thatfree valence on the amide group to be used for bonding isassociated with carbon and not with nitrogen. This is indicatedby a “dot” on the icon at the top of the model kit.
C N
O
•
You can move the bonding position by repeatedly clicking onthe icon. When you are satisfied, add the amide to oxygen tomake the carbamate functionality. Finally, select Alkyne fromthe Groups menu and add to the same carbon on thecyclohexane ring as occupied by the carbamate group (using
1 min
Chapter 3.2 12/30/03, 4:00 PM36

37
the remaining axial or equatorial free valence). Click on and then on to remove the model kit.
2. Bring up the Calculations dialog (Setup menu). SelectEquilibrium Conformer from the top menu to the right of“Calculate” and Molecular Mechanics and MMFF from thetwo bottom menus. You have requested that Spartan’04examine “all possible” conformers*, but then select only themost stable conformer (according to the MMFF model). Clickon Submit at the bottom of the dialog. Name the molecule“ethinamate_MMFF”.
3. When completed, the “preferred” conformer will replace theinitial conformer (just like a calculated equilibrium geometryreplaces a starting geometry). Which group, alkyne orcarbonate, occupies the equatorial position?
4. Note that the name “ethanimate” appears at the bottom of thescreen. This indicates that it is already available in the SpartanMolecular Database (SMD) of molecular structures andproperties. Click on immediately to the left of the name.This brings up the SMD Preview dialog.
Listed at the right are theoretical models for which ethanimateis available, while a ball-and-spoke model of the selected SMDentry is displayed at the left. It can be manipulated using themouse. Is the conformation of ethanimate in the database entriesthe same as you have found?
5. Close “ethinamate” as well as any open dialogs.
* This system is small, and the possible conformers will be systematically examined. Thiswill not be practical for molecules with a large number of degrees of conformational freedom.Here Monte-Carlo methods need to be employed.
Chapter 3.2 12/30/03, 4:00 PM37

38
3-Cyano-4-methylcyclohexenyl Radical
C N
CH3
This tutorial illustrates how different models may be combined toachieve a desired result with minimum “cost”, both human andmachine. MMFF molecular mechanics will be employed to establishequilibrium conformation, the semi-empirical AM1 model to establishequilibrium geometry and the Hartree-Fock 3-21G model to providea basis for graphical calculations.
1. Build 3-cyano-4-methylcyclohexene. Start with Cyclohexanefrom the Rings menu, click on , and then click on axial freevalences on any two adjacent carbons. Add Cyano from theGroups menu to one of the equatorial free valences on a carbonadjacent to the double bond. Finally, add a “methyl group”( from the model kit) to the appropriate ring position usingeither the equatorial or axial free valence.
2. Select Delete from the Build menu (or click on the iconfrom the Build toolbar), and click on the (axial) free valenceon the carbon to which the cyano group is attached. Click on
to produce a refined geometry with C1 symmetry. Click on to remove the model kit.
3. Select Calculations... (Setup menu). Specify Single PointEnergy from the top menu to the right of “Calculate” andHartree-Fock and 3-21G(*) from the two bottom menus. Next,specify MMFF Conformer from the menu to the right of “Startfrom”, and AM1 from the menu which then appears to theright. You have requested that a Hartree-Fock energy is to bebased on an AM1 geometry, which in turn is to be based on thebest conformation according to MMFF.
This molecule has one unpaired electron. It is necessary tochange Multiplicity from Singlet to Doublet. Click on OK.
5 mins
Chapter 3.2 12/30/03, 4:00 PM38

39
4. Select Surfaces (Setup or Display menu). Click on Add....Select spin from Surface menu and none from the Propertymenu, and click on OK. Again, click on Add..., and this timeselect density from the Surface menu and spin from theProperty menu. Click on OK. You have requested two differentrepresentations of spin distribution. The first presents spindensity as a surface of constant value, while the second colormaps the value of the spin density onto an electron densitysurface. Also, request the singly-occupied molecular orbital(SOMO). Click on Add.... Select SOMO from the Surfacemenu (none from the Property menu) and click on OK.
5. Submit the job. Name it “3-cyano-4-methylcyclohexenylradical_3-21G” When completed, examine the conformation.Is the methyl group equatorial or axial? Next, enter theSurfaces dialog. Display the spin density surface by clickingon the line “spin . . .”. Note that the spin density is delocalizedover two of the ring carbons and onto the cyano group.
6. Again enter the Surfaces dialog. First, remove the spin densitysurface by clicking on the line “spin . . .”. Then, display thespin density map. Click on the line “density spin . . .”. Notethat the areas of maximum spin (colored blue) exactly matchthose where the surface is large in the previous image.
Select Properties (Display menu) and click anywhere on thespin density map. This brings up the Surface Properties dialog.Range provides the range of spin density values. Note, inparticular, that negative values of the spin density are possible.
Chapter 3.2 12/30/03, 4:00 PM39

40
7. Enter the Surfaces dialog, and turn “off” display of the spindensity map (click on the line “density spin . . .”). Then turn“on” display of the SOMO (click on the line “SOMO . . .”).Note that the singly-occupied molecular orbital is nearlyidentical to the previously-displayed image of the spin.
8. Turn “off” display of the SOMO by clicking on the line “SOMO. . .” in the Surfaces dialog. Next, click on Add... at the bottomof the (Surfaces) dialog, and select Slice from the Surfacesmenu and spin from the Properties menu. Click on OK. Anew line “Slice spin . . .” appears in the window at the top ofthe dialog.* Click on it.
9. A plane (a “slice” of spin density) surrounded by a frameappears in the middle of the model on screen. Click on theframe (or inside of it) to select. It will now be surrounded by agold frame. Position the cursor outside the frame, then pressboth the Shift key and right button and move the mouse upand down. This will “zoom” the plane. You can also translateand rotate the plane independently of the molecule using theusual mouse operations. Alternatively, you can move themolecule and plane together by first clicking on the molecule(the frame will now turn white) and then using the mouse. Forall operations, be certain to keep the cursor positioned outsideof the frame. Size and orient the slice as you wish.**
10. Remove “3-cyano-4-methylcyclohexenyl radical” and anyremaining dialogs from the screen.
* No further calculations are involved as this is just another way of representing the spin density.** You can change the display style from Contours to Solid or Transparent using the Style
menu at the bottom right of the screen. This will appear only when the slice is selected.
Chapter 3.2 12/30/03, 4:00 PM40

41
5 mins
Infrared Spectrum of Benzyne
Benzyne has long been implicated as an intermediate in nucleophilicaromatic substitution, e.g.
–H2O–Cl–
Cl
OH– OH–
–H2O
benzyne
OH
While the geometry of benzyne has yet to be conclusively established,the results of a 13C labeling experiment leave little doubt that two(adjacent) positions on the ring are equivalent.
Cl
*KNH2
NH3
*
NH2
*
NH2
*+
1 : 1
* = 13C
There is a report, albeit controversial, that benzyne has been trappedin a low-temperature matrix and its infrared spectrum recorded.Furthermore, a line in the spectrum at 2085 cm-1 has been assigned tothe stretching mode of the incorporated "triple bond".
Here you will calculate the structure of benzyne using the Hartree-Fock 3-21G model and, following this, obtain an infrared spectrum forthe molecule. Comparison with the experimental spectrum (specificallythe line at 2085 cm-1 attributed to the C≡C stretch) should allow you tocomment one way or another about the controversial report.
1. Bring up the entry model kit, select Benzene from the Ringsmenu and click anywhere on screen. Click on and click ontwo adjacent free valences on benzene. (Alternatively, holddown the Delete key while you click on the two free valences.)Click on and then on .
2. Enter the Calculations dialog (from the Setup menu). SelectEquilibrium Geometry from the top menu to the right of
Chapter 3.2 12/30/03, 4:00 PM41

42
“Calculate” and Hartree-Fock and 3-21G(*) from thetwo bottom menus. Check IR to the right of “Compute” in thecenter of the dialog. You have requested that an infraredspectrum be computed following optimization of geometry.Click on Submit and provide the name “benzyne_3-21G”.
3. While you are waiting for the calculation to complete, build2-butyne, optimize its geometry with the same Hartree-Fockmodel and compute its infrared spectrum. Name the molecule“2-butyne_3-21G”. 2-butyne will serve as a “standard” withwhich to adjust the infrared spectrum of the benzyne.
4. When both calculations have completed, examine the geometryof benzyne. Does it incorporate a “real” triple bond? Comparethe length with that in 2-butyne.
You should have two molecules on screen, benzyne and2-butyne. Go between them by clicking on them in turn. Allmanipulations (except scaling) pertain only to the selectedmolecule as do all dialog operations.
5. Select (click on) benzyne and then select Spectra from theDisplay menu. Click on the IR tab in the dialog which resultsto bring up the IR Spectra dialog.
One after the other, check the yellow boxes to the left of thefrequencies in the dialog. In response, the vibrational motionassociated with this frequency will be animated. Find the
Chapter 3.2 12/30/03, 4:00 PM42

43
frequency which best fits the description of a C≡C stretch, andrecord its value. Do not close the IR Spectra dialog.
6. Select 2-butyne and find and record the frequencycorresponding to the C≡C stretch. It should be on the order of12% larger than the experimental frequency (2240 cm-1) at thislevel of calculation.* Compute a “scaling factor” based on theratio of measured to calculated frequencies, and apply this tothe calculated frequency in benzyne. Is your (scaled) frequencyin reasonable accord with the reported experimental value of2085cm-1?
7. Again, select benzyne and click on Draw IR Spectrum insidethe IR Spectra dialog.
The resulting spectrum is like any other graphical object inthat it can be translated and zoomed using the usual mousecommands. (It cannot be rotated.) You need to click on thespectrum to select it. Locate the line corresponding to the C≡Cstretch in the spectrum. Having done so, can you furthercomment one way or the other about the validity of theexperimental result?
8. Close both molecules on screen together with any open dialogs.
* Rationalization of this behavior together with performance statistics for a number oftheoretical models available in Spartan’04 is found in “A Guide to Molecular Mechanicsand Quantum Chemical Calculations”.
Chapter 3.2 12/30/03, 4:00 PM43

44
13C NMR of cis-1,2-Dimethylcyclohexane(cannot be completed with the Essential Edition)
At normal temperatures, the NMR spectrum of a conformationally-flexible molecule represents a (Boltzmann-weighted) average ofthe NMR spectra of all accessible conformers. Only when thetemperature is lowered will the spectrum reveal its components, andits “complexity”. A particularly simple example is cis-1,2-dimethylcyclohexane, where there are only two “equivalent”conformers.
Me
Me Me
Me
4
123
56
Me
Me
The room temperature 13C spectrum contains only four lines at 34.9,31.9, 24.2 and 16.4 ppm relative to TMS, corresponding to an equalweighting of C1 and C2, C3 and C6, and C4 and C5 and the two methylcarbons, respectively. Only when the sample is cooled sufficientlydoes the spectrum reveal eight distinct lines.
Here, you will calculate the (static) 13C NMR spectrum of cis-1,2-dimethylcyclohexane, and then average chemical shifts for the threepairs of “equivalent” ring carbons to yield the observed (roomtemperature) spectrum. You will use the carbon shifts in cyclohexaneas a “standard” (instead of TMS). Optionally, you will obtain a 13Cspectrum for cis-decalin to see to what extent it serves a model for“static” cis-1,2-dimethylcyclohexane. The Hartree-Fock 6-31G*model will be employed.
1. Build and minimize cis-1,2-dimethylcyclohexane. Inside theCalculations dialog, specify calculation of equilibriumgeometry using the Hartree-Fock 6-31G* model. Check NMRto the right of “Compute”, and submit the job. Name it “cis-1,2-dimethylcyclohexane_6-31Gs”.
2. Perform the same calculation (6-31G* equilibrium geometryand NMR spectrum) on cyclohexane (name it “cyclohexane_
15 mins/45 mins
Chapter 3.2 12/30/03, 4:00 PM44

45
6-31Gs”. This will be used (in place of TMS) as the referencecompound for the ring carbons in dimethylcyclohexane.
3. After the calculations have completed (several minutes),record chemical shifts for all ring carbons in cis-1,2-dimethylcyclohexane, either from the Atom Properties dialog(select Properties from the Display menu and click on acarbon) or by labeling the model (select Configure... from theModel menu and check Chem Shift under “Atom” in the dialogwhich results). In the latter case, you may want to remove thehydrogens (select Hydrogens from the Model menu) tosimplify the display. Also, obtain the 13C shift in cyclohexaneand compute a “correction factor” based on its difference tothe measured shift (27.6 ppm) to be added to the cis-1,2-dimethylcyclohexane shifts. Finally, average the calculatedchemical shifts to obtain a room temperature 13C spectrum.How do the averaged 13C shifts compare with measured values?
4 to 6 optional
4. cis-Decalin is a reasonable model for “static” cis-1,2-dimethylcyclohexane, in that it is unable to undergo (rapid)ring inversion.
Build cis-decalin. Instead of calculating its equilibriumgeometry, get it from the Spartan Molecular Database (SMD).Click on to the right of the name (cis-decalin) at the bottomof the screen to bring up the SMD Preview dialog. Check6-31G* and click on the Replace button at the bottom of thedialog. The SMD entry will replace the structure you built.
Chapter 3.2 12/30/03, 4:00 PM45

46
5. Enter the Calculations dialog. It should be set up for a single-point-energy calculation using the Hartree-Fock 6-31G* model.Check NMR to the right of “Compute” and click on Submit.
6. The calculation will require several minutes. When completed,select Spectra from the Display menu and click on the NMRtab. Click on Draw 13C Spectrum.
Because of the (C2) symmetry of cis-decalin, your spectrumwill contain only five lines, all of equal intensity. Relate theseto the six lines corresponding to the ring carbons in “static”cis-1,2-dimethylcyclohexane. Pay particular attention to thedifferences in chemical shifts between carbons which averagein the equilibrating molecule. Is cis-decalin a good model?
7. Close all molecules and any open dialogs.
Chapter 3.2 12/30/03, 4:00 PM46

47
Chapter 4Groups of Organic Molecules
This chapter introduces and illustrates a number of basic operationsinvolved in processing groups of molecules, as well as the associatedspreadsheet for organizing and fitting data and facilities for makingplots.
Computational investigations like experimental investigations arerarely restricted to single molecules, but rather may involve a seriesof related molecules. Here, it may be of interest to comparegeometries, energies or other calculated properties, or to comparetrends in calculated and measured properties. Spartan’04 providesfacilities for these purposes. In particular, it allows molecules to begrouped, either “manually”, or automatically as a result of aconformational search, from following a particular vibrational motion,or from a “scan” of one or more geometrical variables. Once put intoa group, molecules may be aligned based on their structures.Calculations may be performed either on individual molecules or,just as simply, on the complete group of molecules.
Associated with a group (including a group of one molecule) is aspreadsheet. This allows convenient access to virtually any calculatedquantity. Additionally, data may be entered manually into thespreadsheet. Data in the spreadsheet may be manipulated, linearregression analyses performed and both 2D and 3D plots constructed.
The tutorials in this chapter introduce a number of the basic groupoperations available in Spartan’04. These include building a group“from scratch”, and processing groups resulting from a conformationalsearch and from varying a torsion angle. Also provided is a simpleexample of fitting an experimental observable to one or morecalculated properties by way of linear regression.
Chapter 4.1 12/30/03, 4:03 PM47

Chapter 4.1 12/30/03, 4:03 PM48

Dienophiles in Diels-Alder Cycloadditions
The most common Diels-Alder reactions involve electron-rich dienesand electron-deficient dienophiles.
X
Y
X = R, OR
Y = CN, CHO, CO2H
X
Y
+
The rate of these reactions generally increases with increasingπ-donor ability of the diene substituent, and with increasingπ−acceptor ability of the dienophile substituent. This can berationalized by noting that donor groups raise the energy of thehighest-occupied molecular orbital (HOMO) on the diene, whileacceptor groups lower the energy of the lowest-unoccupied molecularorbital (LUMO) on the dienophile. Thus, the HOMO-LUMO gap isreduced, leading to enhanced stabilization.
HOMO
LUMO
Orbital Energy
diene dienophile
better acceptor groups
better donor groups
To test such an hypothesis, you will examine the extent to whichexperimental relative rates of Diels-Alder cycloadditions involvingcyclopentadiene and a variety of cyanoethylenes correlate withdienophile LUMO energies.
1. Bring acrylonitrile which you previously constructed onto thescreen. Select Open... from the File menu (or click on ),and double click on “acrylonitrile_3-21G” in the file browserwhich results.* Place acrylonitrile onto the clipboard, by firstdrawing a “selection box”. Position the cursor slightly aboveand slightly to the left of the molecule then, while holding
49
2 mins
* Make certain that the electrostatic potential map is not displayed. If it is, enter the Surfacesdialog (Display menu) and click on the line “density potential ...” to turn it off.
Chapter 4.1 12/30/03, 4:03 PM49

50
down on both left and right buttons, drag the mouse to aposition slightly below and slightly to the right of the molecule.Finally, release both buttons. Acrylonitrile will be surroundedby “dotted lines” (a “selection box”).
Select Copy from the Edit menu. Close acrylonitrile ( ).
2 Enter the builder ( ). Click on Clipboard at the bottom ofthe model kit. Spartan’s clipboard will be accessed and thestructure of acrylonitrile will appear in a box at the top of themodel kit. (You can manipulate this structure by positioningthe cursor inside the box and using the usual mouse/keyboardcommands.) Click anywhere on screen and acrylonitrile (thecontents of the clipboard) will be drawn. Click on to producea refined structure. Do not leave the builder.
3. Select New Molecule from the File menu. This requests that a“new molecule” (one which has yet to be built) is to beappended onto the end of a group in which the currently selectedmolecule (acrylonitrile) is a member. The screen will be cleared.Click on Clipboard at the bottom of the model kit and clickon screen. Acrylonitrile will appear. Click on Groups in themodel kit, select Cyano and add to the appropriate free valenceon acrylonitrile to make 1,1-dicyanoethylene. Click on .
4. Repeat this procedure (New Molecule, followed by Clipboard,followed by Groups, followed by ) four more times to buildcis and trans-1,2-dicyanoethylene, tricyanoethylene andtetracyanoethylene. When you are all done (six molecules intotal), click on to remove the model kit.
Chapter 4.1 12/30/03, 4:03 PM50

51
5. The molecules have been put into a single group, allowingcalculated properties to be accessed via a spreadsheet. SelectSpreadsheet from the Display menu.
To select individual molecules, click on their labels (“M001”,. . .) in the left hand column, or use the and keys at thebottom left of the screen. You may change the default names(to “acrylonitrile”, . . .) by directly typing in new names. Pressthe Enter key following each entry.
6. Enter the Calculations dialog (Setup menu), and specify asingle-point energy using the Hartree-Fock 3-21G model. SelectAM1 from the menu to the right of “Start from”. This indicatesthat the 3-21G energy calculation is to be preceded by calculationof geometry using the AM1 model. Make certain that GlobalCalculations is checked to ensure that calculations are to beapplied to all group members (and not just the selected member).
7. Submit the job. Name it “Diels-Alder dienophiles_3-21G”.While you are waiting for it to complete, enter the experimentalrelative rates from the table below into the spreadsheet.
Experimental relative rates forDiels-Alder cycloadditions of cyclopentadiene*
log10 log10
dienophile (relative rate) dienophile (relative rate)
acrylonitrile 0 1,1-dicyanoethylene 4.64trans-1,2-dicyanoethylene 1.89 tricyanoethylene 5.66cis-1,2-dicyanoethylene 1.94 tetracyanoethylene 7.61
* J. Sauer, H. Weist and A. Mielert, Chem. Ber., 97, 3183 (1964).
Chapter 4.1 12/30/03, 4:03 PM51

52
First, type a title “Log(rate)=” into the header cell at the top ofa “blank” column in the spreadsheet and press the Enter key.Then enter the rate data in the appropriate cells. Press the Enterkey after each entry. Sort the group according to relative rate.Click on the column header “Log(rate)”, and then click on Sortat the bottom of the spreadsheet.
8. After all calculations are complete, click on a header cell atthe top of a blank column. Then, click on Add... at the bottomof the spreadsheet. Alternatively, hold down the right mousebutton while the cursor is positioned inside the spreadsheet,and select Add... from the menu which results.
Select E LUMO from the list in the dialog which results andkcal/mol from the Energy menu. Click on OK.
Chapter 4.1 12/30/03, 4:03 PM52

53
The spreadsheet has now served its purpose by collecting bothcalculated (LUMO energy) and experimental (relative rate)data for all six dienophiles. You can, if you wish, now removeit from the screen (click on at the top right).
9. Select Plots... from the Display menu. This leads to the Plotsdialog.
Make certain that the “XY Plot” tab at the top of the dialog isselected. Select Log(rate) from the list of items in the X Axismenu and E LUMO(eV) from the Y Axes list. Click on OK toremove the dialog and show the plot.
The default curve, a so-called cubic spline, smoothly connectsthe data points, but is of little value in establishing a correlation.A better representation is provided by a simple linear least-
Chapter 4.1 12/30/03, 4:03 PM53

54
squares fit. Select Properties from the Display menu and clickanywhere on the “curve” which you have just drawn. TheCurve Properties dialog appears.
Select Linear LSQ from the Fit menu. A new plot appears.
Is there a correlation between relative rates and LUMO energy?
10. Remove all molecules and any remaining dialogs from thescreen.
Chapter 4.1 12/30/03, 4:03 PM54

55
Allyl Vinyl Ether
O
Allyl vinyl ether undergoes Claisen rearrangement, the mechanismfor which demands a chair arrangement of the reactant.
O O
O
‡
Is this the lowest-energy conformer (global minimum) or is additionalenergy required to properly orient the molecule for reaction? To findout, you need to locate all the conformers of allyl vinyl ether, identifythe best chair structure and evaluate its energy relative to that of theactual global minimum. You will first carry out a conformationalsearch using the MMFF molecular mechanics model, and then obtainrelative conformer energies using single-point 6-31G* Hartree-Fockcalculations based on AM1 equilibrium geometries.
1. Bring up the entry model kit and construct allyl vinyl ether (inany conformation) from a sequence of sp2 and sp3 carbons andan sp3 oxygen. Click on to produce a refined geometry.Click on .
2. Bring up the Calculations dialog and select ConformerDistribution from the top menu to the right of “Calculate”and Molecular Mechanics and MMFF from the two bottommenus. Click on OK.
3. Submit the job. Name it “allyl vinyl ether_MMFF”. Whencompleted, it will give rise to a series of low-energyconformers* placed in a new file “allyl vinyl ether_MMFF.Conformer1”. Open this file.** Select Spreadsheet fromthe Display menu.
* By default, only conformers within 10 kcal/mol of the global minimum will be kept. Thiscan be changed (see Conformational Search in Appendix C).
** To avoid confusion, it is a good idea to close the original file “allyl vinyl ether_MMFF”.
5 mins
Chapter 4.1 12/30/03, 4:03 PM55

56
Size the spreadsheet such that all rows (corresponding todifferent conformers) are visible at one time. Click on Add...at the bottom of the spreadsheet. Select E from the list at thetop of the dialog which appears, kcal/mol from the Energymenu and click on OK. Energies for each of the differentconformers will be added to the spreadsheet. Examine thelowest-energy conformer (the top entry). Is it in a “chairconformation” suitable for Claisen rearrangement? If not,identify the lowest-energy conformer which is suitable. Youcan keep two or more conformers on screen at the same timeby checking the boxes immediately to the right of “Label” (theleftmost column) in the spreadsheet. To get a clearer idea ofstructural similarities and differences, align the conformers.Select Align Molecules from the Geometry (or click on the
icon in the Geometry toolbar). A message will appear atthe bottom left of the screen.
Click on three (or more) atoms to designate them as alignmentcenters. Each will be marked by a red circle. If you make amistake, click again (two times) and the circle will disappear.When you are done, press the Align button at the bottom rightof the screen. Click on .
4. To obtain a better estimate of conformational energydifferences, perform 6-31G* single-point energy calculationsusing AM1 geometries. Make a copy of “allyl vinyl ether_MMFF.Conformer1” ( ), and name it “allyl vinyl ether_6-31Gs”. Using the copy, delete all conformers except theglobal minimum and the lowest-energy conformer poised forClaisen rearrangement. Select each conformer to be discarded,and then select Delete Molecule from the File menu.Alternatively, click on the cell in the spreadsheet containingthe “label” for the molecule to be deleted, and then click onDelete at the bottom of the spreadsheet. When you are done,the spreadsheet should contain only two entries.
Chapter 4.1 12/30/03, 4:03 PM56

57
5. Enter the Calculations dialog, and specify calculation of asingle-point energy using the Hartree-Fock 6-31G* model.Also, specify AM1 from the menu to the right of “Start from”.Check Global Calculations at the bottom of the dialog tospecify that the dialog settings apply to both conformers.
6. Submit the job. When completed, examine the conformerenergies. How much energy is needed to go from the globalminimum to a conformer poised to undergo Claisenrearrangement?
7. Remove all molecules and any remaining dialogs from thescreen.
Chapter 4.1 12/30/03, 4:03 PM57

58
Internal Rotation in Dimethylperoxide
OO
CH3
CH3
Quantum chemical calculations, in particular, Hartree-Fock molecularorbital calculations and density functional calculations, may be calledon to furnish data to parameterize empirical energy functions for usein molecular mechanics and/or molecular dynamics calculations. Mostimportant are data relating to torsional motions, for these are the mostdifficult to obtain experimentally. Here, the empirical energy functionneeds to reflect the inherent periodicity. As an example, considerrotation about the oxygen-oxygen bond in a molecule such asdimethylperoxide. This may be described by a truncated Fourier series.
Etorsion (ω) = ktorsion1 (1 - cos(ω - ωeq)) + ktorsion2 (1 - cos2(ω - ωeq))
+ ktorsion3 (1 - cos3(ω - ωeq))
Here, ωeq is the ideal dihedral angle and ktorsion1, ktorsion2 and ktorsion3 areparameters. The first (one-fold) term accounts for the difference inenergy between syn and anti conformers, the second (two-fold) termfor the difference in energy between planar and perpendicularconformers, and the third (three-fold) term for the difference in energybetween eclipsed and staggered conformers.
In this tutorial, you will generate a potential energy function forrotation in dimethylperoxide using 6-31G* Hartree-Fock calculations(and optionally from B3LYP/6-31G* density functional calculations)and then fit this potential to a truncated Fourier series.
1. Using the entry model kit, construct dimethylperoxide. If themolecule is not already in an anti conformation, click on andset the COOC dihedral angle to 180 (180°). Do not minimize.
2. Select Constrain Dihedral from the Geometry menu (or clickon the icon from the Geometry toolbar). Select the COOCtorsion, and then click on at the bottom right of the screen.The icon will change to indicating that a dihedral constraintis to be applied. Select Properties (Display menu) and click
30 mins/40 mins
Chapter 4.2 12/30/03, 4:06 PM58

59
on the constraint marker on the model on screen. This leads tothe Constraint Properties dialog.
3. Check Dynamic inside the dialog. This leads to an extendedform of the Constraint Properties dialog which allows thesingle (dihedral angle) constraint value to be replaced by asequence of constraint values.
Leave “180” (180°) in the box to the right of Value, but changethe contents of the box to the right of to to “0” (0°). You needto press the Enter key after you type in the value. Steps shouldbe set to “10”. (If it does not, type “10” and press the Enterkey.) What you have specified is that the dihedral angle willbe constrained first to 180°, then to 160°*, etc. and finally to0°. Click on to dismiss the dialog.
4. Bring up the Calculations dialog and select Energy Profilefrom the top menu to the right of “Calculate”, and Hartree-Fock and 6-31G* from the two bottom menus. Click on OKand submit the job. Name it “dimethylperoxide_6-31Gs”.
* The difference between constraint values is given by: (final-initial)/(steps-1).
Chapter 4.2 12/30/03, 4:06 PM59

60
5. When the calculations have completed, they will go into a filenamed “dimethylperoxide_6-31Gs.Profile1”. Open this file.Align the conformers. Click on and, one after the other,click on both oxygens and one of the carbons. Then click onthe Align button at the bottom right of the screen. Bring up thespreadsheet (Display menu), and enter both the energiesrelative to the 180° conformer, and the COOC dihedral angles.First click on the label (“M001”) for the top entry in thespreadsheet (the 180° conformer), then click on the header cellfor the leftmost blank column, and finally, click on Add... atthe bottom of the spreadsheet. Select rel. E from among theselections in the dialog which results, kJ/mol from the Energymenu and click on OK. To enter the dihedral angle constraints,click on , click on the constraint marker attached todimethylperoxide and click on at the bottom of the screen(to the right of the value of the dihedral angle). Click on .
6. Select Plots... (Display menu). Select Constraint(Con1) fromthe X Axis menu and rel. E(kJ/mol) from the Y Axes list.Click on OK.
The curve (a so-called cubic spline) smoothly connects thedata points. To fit the points to a Fourier series, bring up theProperties dialog (Display menu) and click anywhere on the
Chapter 4.2 12/30/03, 4:06 PM60

61
plot. Select Fourier LSQ from the Fit menu and click on toremove the dialog. A new plot appears.
The actual fit expression appears at the bottom of the plot.
7 and 8 optional (cannot be completed with the Essential Edition)
7. Use energies from B3LYP/6-31G* density functionalcalculations, together with the Hartree-Fock geometriesto provide a better “fitting function”. First, make a copyof “dimethylperoxide_6-31Gs.Profile1”. Name it“dimethylperoxide_B3LYP_6-31Gs”. Next, enter theCalculations dialog and specify calculation of single-pointenergies using the B3LYP/6-31G* density functional model.Make certain that Global Calculations (at the bottom of thedialog) is checked to signify that energy calculations are to beperformed on all conformers.
8. Submit the job. It will require several minutes to complete.When it is done, draw a new energy plot and compare it to theenergy plot produced earlier.
9. Remove all molecules and any remaining dialogs from thescreen.
Chapter 4.2 12/30/03, 4:06 PM61

62
Hydration of Carbonyl Compounds
The hydration of carbonyl compounds has been extensively studiedprimarily because it serves as a model for a number of importantreactions, nucleophilic addition to carbonyl compounds among them.
O
R
R‘H2O
-H2OR
R‘OH
OHKeq =
[hydrate]
[H2O] [carbonyl]=
[hydrate]
55.5 [carbonyl]
Experimental Keq for hydration of carbonyl compounds*
log(keq/55.5) log(keq/55.5)
PhCOCH3 -6.8 CF3COCH3 -0.2CH3COCH3 -4.6 PhCOCF3 0.1PhCHO -3.8 H2CO 1.6t-BuCHO -2.4 CF3CHO 2.7CH3CHO -1.7 CF3COCF3 4.3
* J.P. Guthrie, Can. J. Chem., 53, 898 (1975); 56, 962 (1978).
In this tutorial, you will correlate calculated properties with measuredequilibrium constants for carbonyl hydration. The purpose is toillustrate the use of Spartan’s linear regression analysis tool.
1. Build the compounds* listed above. Use Carbonyl (Ringsmenu) as a starting point for each to ensure consistent atomnumbering. Put all in the same list; select New Moleculefollowing construction of each molecule, i.e., build andminimize acetophenone, select, New Molecule, build andminimize acetone, select New Molecule, etc. Click on .
2. Enter the Calculations dialog and specify calculation ofequilibrium geometry using the Hartree-Fock 3-21G model.**
* Keep the phenyl ring and the carbonyl group coplanar for benzaldehyde, acetophenone andtrifluoroacetophenone.
* * You can save computer time by specifying calculation of single-point energy using theHartree-Fock 3-21G model, and then selecting AM1 from the menu to the right of “Startfrom”. This requests a semi-empirical AM1 geometry in place of the 3-21G geometry. Asall of these molecules are in SMD, you can save even more time by bringing up the SMDPreview dialog (click on at the bottom right of the screen), clicking on the yellow squareto the left of 3-21G and then clicking on Replace All at the bottom of the dialog. In thiscase, skip the calculation step as all the results you require are already available.
30 mins
Chapter 4.2 12/30/03, 4:06 PM62

63
Make certain that Global Calculations is checked. Click onSubmit. Name the job “carbonyl compounds_3-21G”.
3. While you are waiting for the calculations to complete, bringup the spreadsheet. Click inside the header cell of an emptycolumn, type “Log(Keq)” and press the Enter key. Then enterthe experimental equilibrium constants (see box on the previouspage) into the appropriate cells. You need to press the Enterkey following each data entry. Sort the list according to thevalue of Log(Keq). Click inside the header cell “LogKeq” andthen click on Sort at the bottom of the spreadsheet. If you like,replace the “labels” in the spreadsheet (“M001”, ...) by correctnames (“acetophenone”, ... ).
4. After the calculations have completed, click inside the headercell for an empty column, and then click on Add... at the bottomof the spreadsheet. Select (click on) the following “properties”in the window at the top of the dialog: E LUMO, E HOMO,Dipole, CPK Volume and Molecular Weight. Click on OK.
5. Select Properties (Display menu) and click on the oxygenatom for whatever compound is displayed. Click on to theleft of Electrostatic (under “Charges”) in the Atom Propertiesdialog (which has replaced the Molecular Properties dialog),to place oxygen charges into the spreadsheet.
6. Click on Add... at the bottom of the spreadsheet, and then clickon the Linear Regression tab at the top of the dialog whichresults. This brings up the Add Regression dialog.
Chapter 4.2 12/30/03, 4:06 PM63

64
Select Log(Keq) from the Fit menu and Electrostatic (O2)*
from the Using list. Click on OK. Two new rows will be addedat the bottom of the spreadsheet. With a Properties dialog onscreen, click anywhere on the row in the spreadsheet startingwith “Fit1”. The Regression Properties dialog appears.
This provides information about the fit of Log(Keq) to thecharge on oxygen, in particular, the value of R2. This will tendto unity as the quality of the fit improves.
7. Inside the Regression Properties dialog, try fitting to different(single) properties in the Using list. (The entries toggle “on”and “off” with repeated clicking.) Maximize the value of R2.Next, try all combinations of two properties. The combinationof E LUMO and Electrostatic (O2) should give the highestvalue of R2. With this combination selected, bring up the Plotsdialog (Display menu) and select Log(Keq) from the X Axismenu, and FitVals (Fit1) from the Y Axes list and click onOK. Next, click on the curve (not on the axes) to bring up theCurve Properties dialog (which replaces the RegressionProperties dialog). Select Linear LSQ (to replace CubicSpline) from the Fit menu. The resulting plot should showgood correlation.
8. Close “carbonyl compounds_3-21G” and remove anyremaining dialogs from the screen.
* Your atom numbering may be different, but the reference is to the carbonyl oxygen.
Chapter 4.2 12/30/03, 4:06 PM64

65
Acidities of Carboxylic Acids
Acid strength is among the most catalogued of molecular properties.It is readily available from calculation, either in terms of absolutedeprotonation energy,
AH A– + H+
or, more commonly, as the deprotonation energy relative to that ofsome “standard” acid (A°H).
AH + A°– A– + A°H
A reasonable alternative measure of (relative) acid strength may bethe value of the electrostatic potential in the vicinity of the “acidichydrogen” in the neutral acid. This offers the advantage over a reactionenergy calculation of having to look at only one molecule. It is clearthat electrostatic potential maps uncover gross trends, for example,the acidic hydrogen in a strong acid, such as nitric acid, is morepositive than that in a weak acid, such as acetic acid, which in turn ismore positive than that in a very weak acid, such as ethanol.
ethanol acetic acid nitric acid
In this tutorial, you will explore to what extent electrostatic potentialmaps may be used to quantify changes in acid strength due to subtlevariations in structure. You will also use the tutorial to illustrate howthe Spartan Molecular Database of calculated structures, energies andproperties may be used to shorten the time required for an investigation.
1. One after the other, build trichloroacetic, dichloroacetic,chloroacetic, formic, benzoic, acetic and pivalic acids. Put allinto the same list (New Molecule from the File menu followingthe first molecule). Click on when you are done.
10 mins
Chapter 4.2 12/30/03, 4:06 PM65

66
2. All the molecules which you have built are available in theSpartan Molecular Database. Click on to the left of thename of the presently selected molecule at the bottom of thescreen. The SMD Preview dialog will appear which displaysthe structure of the selected molecule on the left and a list oftheoretical models for which calculated results are availableon the right. Check the yellow square to the left of “3-21G”and click on Replace All at the bottom of the dialog.Structures obtained from Hartree-Fock 3-21G calculationswill replace those you have built. You need to calculate awavefunction for each of the molecules in order to produceelectrostatic potential maps.
3. Enter the Calculations dialog (Setup menu). Check to makecertain that a single-point-energy, Hartree-Fock 3-21Gcalculation has been requested. Also make certain that GlobalCalculations at the bottom of the dialog is checked. Click onOK to remove the dialog. Enter the Surfaces dialog (Setupmenu). First, make certain that Global Surfaces at the bottomof the dialog is checked. Click on Add... at the bottom of thedialog, select density from the Surface menu and potentialfrom the Property menu (medium from the Resolution menu)in the Add Surface dialog which appears and then click on OK.Leave the Surfaces dialog on screen. Submit the job (Submitfrom the Setup menu). Name it “carboxylic acids_3-21G”.
4. While you are waiting for the calculations to complete (a fewminutes), bring up the spreadsheet (Spreadsheet from theDisplay menu). Expand it so that you can see all sevenmolecules, and that three data columns are available. Clickinside the header cell for a blank column. Click on Add... at thebottom of the spreadsheet, select Name from the list of entriesand click on OK. The name of each molecule will appear. Next,click inside the header cell of the next available data column,type “pKa” and press the Enter key. Enter the individual(experimental) pKa’s into the appropriate cells under thiscolumn. You need to press the Enter key following each entry.
Chapter 4.2 12/30/03, 4:06 PM66

67
acid pKa acid pKa
Cl3CCO2H 0.7 C6H5CO2H 4.19Cl2CHCO2H 1.48 CH3CO2H 4.75ClCH2CO2H 2.85 (CH3)3CCO2H 5.03HCO2H 3.75
Experimental data from: E.P. Sargeant and B. Dempsey, Ionization Constantsof Organic Acids in Aqueous Solution, IUPAC no. 23, Permagon Press, 1979.
Finally, click inside the header cell of the next available datacolumn and type “potential”. Press the Enter key.
5. After all calculations have completed, arrange the sevenmolecules on screen such that you can clearly see the “acidichydrogen” on each. To display all molecules at once, checkthe box to the right of the “Label” column (in the spreadsheet)for each entry. To manipulate them independently of each other,select Coupled from the Model menu.
6. Click on the line “density . . .” inside the Surface dialog toturn on the electrostatic potential map for each molecule. Bringup the Properties dialog (Display menu) and click on the areaof “maximum blue” (most positive electrostatic potential) foreach molecule in turn. The value of the potential will bedisplayed to the right of the Value in the Surface Propertiesdialog. Enter this value into the appropriate cell of thespreadsheet (in the column titled “potential”). You need to pressthe Enter key following each data entry.
7. Plot experimental pKa vs. calculated potential. Bring up thePlots dialog (Display menu), select pKa under the X Axismenu and potential from the Y Axes list, and click on OK.The data points are connected by a smooth curve (a so-calledcubic spline). To get a least squares fit, select Properties fromthe Display menu, click on the curve, and select Linear LSQfrom the Fit menu in the Curve Properties dialog.
8. Close “carboxylic acids_3-21G” and remove any remainingdialogs from the screen.
Chapter 4.2 12/30/03, 4:06 PM67

68
30 mins
Stereochemical Assignments from 13C NMR(cannot be completed with the Essential Edition)
NMR spectroscopy, in particular 13C spectroscopy, is without doubtthe method of choice to establish the three-dimensional structure oforganic molecules. Only X-ray diffraction provides more definitiveresults, although the requirement of a crystalline sample severelylimits its application. It is now practical to calculate the NMR spectraof “real” organic molecules. The availability of a “virtual NMRspectrometer” will in time offer the organic chemist an entirely newparadigm for structure determination, that is direct comparison of ameasured spectrum with calculated spectra for one or more chemicallyreasonable candidates.
Here, you will obtain 13C chemical shifts for cis and trans stereoisomersof 2-hexene and endo and exo stereoisomers of 2-methylnorbornane,and compare these to experimental shifts. The Hartree-Fock 6-31G*model will be employed, but you will get all structures from the SpartanMolecular Database. You will establish the extent to which thecalculations are able to reproduce differences in chemical shifts as afunction of stereochemistry.
1. Build cis-2-hexene. Click on at the bottom of the screen (tothe left of the molecule name), check the box to the left of the“6-31G*” in the SMD Preview dialog which appears and clickon Replace. Do not minimize. Select New Molecule from theFile menu, build trans-2-hexene, check the box to the left of“6-31G*” in the preview dialog and click on Replace. Do notminimize. Click on .
2. Enter the Calculations dialog and specify a single-pointHartree-Fock calculation using the 6-31G* basis set. CheckNMR to the right of “Compute”. Submit the job with the name“2-hexene_6-31Gs”.
3. When completed, examine the 13C chemical shifts, either fromthe Atom Properties dialog or as atom labels (Configure...under the Model menu and check Chem Shift under “Atom”in the dialog which results). Compare them to measured values
Chapter 4.2 12/30/03, 4:06 PM68

69
with particular attention to the difference in shifts between cisand trans stereoisomers.
cis trans ∆C1 11.4 16.5 5.1C2 122.8 123.9 1.1C3 129.7 130.6 0.9C4 28.2 34.1 5.9C5 21.4 22.1 0.7C6 12.5 12.5 0.0
Do the calculations distinguish between the two isomers?
4. Close “2-hexene_6-31Gs”.
5. Build endo-2-methylnorbornane. As you did for 2-hexene,replace your structure with the (6-31G*) structure in the SpartanMolecular Database. Select New Molecule (File menu) andrepeat the process for the exo isomer. Click on .
6. Inside the Calculations dialog, specify a single-point Hartree-Fock 6-31G* calculation, and check NMR (to the right of“Compute”). Submit the job with the name “2-methylnorbornane_6-31Gs”.
7. When completed, compare the 13C chemical shifts withexperimental values with particular attention to differencesbetween endo and exo stereoisomers.
endo exo ∆C1 43.5 42.2 -1.3C2 36.8 34.6 -2.2C3 40.2 40.7 0.5C4 37.3 38.2 0.9C5 30.3 30.6 0.3C6 29.0 22.4 -6.6C7 35.0 38.9 3.9CH3 22.3 17.4 -4.9
Do the calculations distinguish between the two isomers?
8. Close “2-methylnorbornane_6-31Gs”.
CH3
4
1 2
35
6
7
CH3 CH CH
CH2CH2CH3
Chapter 4.2 12/30/03, 4:06 PM69

70
Favoring One Tautomer Over Another
2-hydroxypyridine is in equilibrium with its tautomer, 2-pyridone.
NHO NOH
2-hydroxypyridine 2-pyridone
The relative abundance of the two is given by the Boltzmann equationand depends both on their relative energies and on the temperature.
A search of the Cambridge Structural Database uncovers fewer “hits”for derivatives of 2-hydroxypyridine than for derivatives of 2-pyridone.While this does not establish that the latter is a more stable tautomer, itsuggests that this is the case.
In this tutorial, you will use the Spartan Molecular Database first toestablish whether 2-hydroxypyridine or 2-pyridone is lower in energyand then to look for substituents which reverses this preference. Noquantum chemical calculations are involved.
1. Build 2-hydroxypyridine. Click on at the bottom of the screen(to the left of the molecule name) to bring up the SMD Previewdialog, check 3-21G and click on Replace. Select NewMolecule from the File menu, build 2-pyridone (start withAmide from the Groups menu), check 3-21G in the previewdialog and click on Replace. Dismiss the preview dialog (clickon ) and then click on .
2. Bring up the spreadsheet (which should contain entries for both2-hydroxypyridine and 2-pyridone), click on an empty columnheader and click on Add.... Select (click on) both Name(molecule name) and rel.E from the list, choose an appropriateset of units, and click on OK. Which molecule is lower inenergy according to the calculations? Is your result consistentwith or at odds with information in the Cambridge StructuralDatabase (see text box above)?
Chapter 4.2 12/30/03, 4:06 PM70

71
3. Select 2-hydroxypyridine, click on and then click on theSMD tab in the Database dialog. The SMD dialog appears.
Click on to the right of the Search button at the bottom ofthe SMD dialog to bring up the Search Options dialog.
Check 3-21G (only) under “Method Filters” and click on OK.Next, click on the free valence on the 4 position (across thering from nitrogen). An orange cone will cover the free valence.(If you click on the wrong valence, click again and then clickon the correct valence.) What you have done is to requestHartree-Fock 3-21G entries in the Spartan Molecular Databasefor all 4-substituted 2-hydropyridines. Click on the Search
Chapter 4.2 12/30/03, 4:06 PM71

72
button at the bottom of the dialog. “Hits” will begin to appearat the right of the dialog. After the search has completed, clickon to the right of the Retrieve button at the bottom of thedialog to bring up the Retrieve Options dialog.
Click on New Document under “Retrieve to” and click on OK.Next, select all entries in the list of hits in the SMD dialog byfirst clicking on the top entry and, while holding down on theShift key, clicking on the bottom entry. Finally, click on theRetrieve button.
Click on , and name the file where the hits are stored“substituted 2-hydroxypyridines”. Bring up a spreadsheet forthis file and expand to include all of the entries and to haveroom for one data column. Click on an empty column header,click on Add... at the bottom of the spreadsheet, select E fromthe list of quantities in the resulting dialog (au from the Energymenu under “Units”) and click on OK.
4. Repeat the process for 2-pyridone, and title the file containingthe database hits “substituted 2-pyridones”. When you are done,place both spreadsheets side-by-side on screen and look forcommon (same substituent) entries. Can you identifysubstituents which enhance the energetic preferences seen forthe parent compound? Can you identify substituents whichreverse this preference? Elaborate.
5. Close all molecules and any open dialogs.
Chapter 4.2 12/30/03, 4:06 PM72

73
Chapter 5Organic Reactions
This chapter outlines and illustrates “strategies” for locating andverifying transition states for organic reactions as well as forexploring changes in product distributions as a function of substituentsand reactant stereochemistry.
The treatment of chemical reactions adds an entirely new dimensionto the application of quantum chemical models. Whereas uniquevalence structures may generally be written for “normal” moleculesand, based on these structures, reasonable guesses at bond lengthsand angles may be made, it is often difficult to designate appropriatevalence structures for transition states, let alone specify detailedgeometrical parameters. This is, for the most part, due to a completeabsence of experimental data on the structures of transition states.However, calculated transition-state geometries are nowcommonplace. Spartan’04 provides both an extensive library ofcalculated transition states and a facility for matching as closely aspossible entries in the library with the reaction at hand.*
Spartan’04 also provides a procedure for “driving” user-definedcoordinates. Aside from conformational analysis (see discussion inprevious chapter), the major application of this is to “force” reactions,thereby permitting identification of transition states.
The tutorials in this chapter illustrate procedures for “guessing”transition states of organic reactions, and then actually locating andverifying them. They also illustrate a procedure to “drive” a reactionthrough a transition state. Finally, they address strategies for collectinginformation on related reactions to assign kinetic product distributions.
* Where a reaction is unknown to Spartan’04’s library, a fallback technique which “averages” reactantand product geometries (similar to the so-called linear synchronous transit method) is invoked.
Chapter 5 12/30/03, 4:09 PM73

Chapter 5 12/30/03, 4:09 PM74

Ene Reaction of 1-Pentene
C
CC
C
C C
CH
HC
CHH
HH
1-pentene ethylene propene
H
C
H
H
∆ +
H H
H HH
H
H
HH
H H
The proposed mechanism of the ene reaction involves simultaneoustransfer of a hydrogen atom along with CC bond cleavage. Here, youwill obtain the transition state for the ene reaction of 1-pentene from3-21G Hartree Fock calculations, and you will examine the reactioncoordinate for evidence that hydrogen transfer and CC bond breakingoccur in concert. Optionally, you will perform B3LYP/6-31G* single-point energy calculations, based on Hartree-Fock 3-21G geometries,to obtain an estimate of the activation energy for the ene reaction.Also, optionally you will produce an intrinsic reaction coordinatewhich provides a smooth sequence of structures connecting reactantand product through the transition state.
1. Bring up the entry model kit and build 1-pentene in aconformation in which one of the terminal hydrogens on theethyl group is “poised” to transfer to the terminal methylenegroup. Minimize (click on ) and click on .
2. First, save 1-pentene as “1-pentene_B3LYP_6-31Gs” forpossible use later ( ). Also make a copy for immediateuse; name it “ene reaction 1-pentene_3-21G”.
3. Select Transition States from the Search menu (or click onthe icon from the Search toolbar). Click on bond “a” in thefigure on the following page and then click on bond “b”.
A curved arrow from bond “a” to bond “b” will be drawn (asshown in the figure). Next, click on bond “c” and then on bond“d”. A second curved arrow from bonds “c” to “d” will be drawn.Finally, click on bond “e” and, while holding down the Shiftkey, click on the (methyl) hydrogen to be transferred and on theterminal (methylene) carbon to receive this hydrogen. A third
75
10 mins/20 mins
Chapter 5 12/30/03, 4:09 PM75

76
curved arrow from bond “e” into the “space” between thehydrogen and oxygen will be drawn.
C
CC
C
C
HHH
H H
HHH
H H
a
bc
d
e
If you make a mistake, you can remove “arrows” using .(You will need to select to continue.) Alternatively, use theDelete key. With all three arrows in place, click on at thebottom right of the screen. Your structure will be replaced by aguess at the ene transition state. If the resulting structure is“unreasonable”, then you have probably made an error in theplacement of the “arrows”. In this case, select Undo from theEdit menu to return to the model with the “arrows” and modifyaccordingly.
4. Enter the Calculations dialog (Setup menu), and specifycalculation of transition-state geometry using the 3-21G Hartree-Fock model. Select Transition State Geometry from the topmenu to the right of “Calculate” and Hartree-Fock and3-21G(*) from the two bottom menus. Also, check IR to theright of “Compute”. This requests a vibrational analysisfollowing the optimization*, and is needed both to confirm thatyou have found a transition state, and to ensure that thistransition state smoothly connects reactant and product.
5. Submit the job. When it has completed, animate the motion ofatoms along the reaction coordinate. Select Spectra from theDisplay menu and click on the IR tab. Click on the top entryin the list in the IR dialog which results. It corresponds to animaginary frequency, and will be designated with an “i” infront of the number. Is the vibrational motion consistent withthe reaction of interest and not with some other process?
* Vibrational frequencies need to be calculated using optimized equilibrium or transition-state geometries. Otherwise, their values are meaningless.
Chapter 5 12/30/03, 4:09 PM76

77
6. Controls at the bottom of the IR dialog allow for changingboth the amplitude of vibration (Amp) and the number of stepswhich make up the motion (Steps). The latter serves as a “speedcontrol”. Change the amplitude to “0.3” (type “0.3” in the boxto the right of Amp and press the Enter key). Next, click onMake List at the bottom of the dialog. This will give rise to agroup of structures which follow the reaction coordinate downfrom the transition state both toward reactant and product. Toavoid confusion, remove the original transition state from thescreen. Click on “ene reaction 1-pentene_3-21G” (the vibratingmolecule) and close it, along with the IR dialog.
7. Enter the Calculations dialog and specify a single-point energycalculation using the 3-21G Hartree-Fock model (the samelevel of calculation used to obtain the transition state andcalculate the frequencies). Make certain that GlobalCalculations is checked before you exit the dialog. Next, enterthe Surfaces dialog and specify evaluation of two surfaces: abond density surface and a bond density surface onto whichthe electrostatic potential has been mapped. Click on Add . . .,select density (bond) for Surface and none for Property andclick on OK. Click on Add . . . again, select density (bond)for surface and potential for Property and click on OK. Makecertain that Global Surfaces is checked.
8. Submit for calculation. Name it “ene reaction 1-pentenesequence_3-21G”. Once the job has completed, enter theSurfaces dialog and, one after the other, select the surfaceswhich you have calculated. For each, step through the sequenceof structures ( and ) keys at the bottom of the screen) oranimate the reaction ( ). Note, in particular, the changes inbonding revealed by the bond density surface. Also payattention to the “charge” on the migrating atom. Is it bestdescribed as a “proton” (blue color), hydrogen atom (greencolor) or “hydride anion” (red color)?
9. Close “ene reaction 1-pentene sequence_3-21G” as well asany remaining dialogs.
Chapter 5 12/30/03, 4:09 PM77

78
10 to 14 optional (cannot be completed with the Essential Edition)
Methods which account for electron correlation are generally neededto furnish accurate estimates of absolute activation energies. Performsingle-point energy calculations using the B3LYP/6-31G* densityfunctional model on both 1-pentene and on the ene reaction transitionstate (using the 3-21G geometries).
10. Open “ene reaction 1-pentene_3-21G” ( ) and make a copy( ). Name it “ene reaction 1-pentene_B3LYP_6-31Gs”.
11. Enter the Calculations dialog, and specify a single-point energyusing the B3LYP/6-31G* density functional model. Removethe checkmark from IR. Submit the job.
12. Open “1-pentene_ B3LYP_6-31Gs” ( ). Specify a single-point energy calculation using the B3LYP/6-31G* model. Alsoselect 3-21G(*) from the menu to the right of “Start from”.This designates that a 3-21G equilibrium structure is to be used.Submit the job.
13. Obtain the activation energy (difference in total energiesbetween 1-pentene and the ene reaction transition state).
14. Remove any molecules and dialogs from the screen.
15 and 16 optional (cannot be completed with the Essential Edition)
To obtain a reaction coordinate smoothly connecting reactant andproduct through the transition state, use Spartan’s intrinsic reactioncoordinate (IRC) procedure.
15. Open “ene reaction 1-pentene_3-21G” ( ). Enter theCalculations dialog, and check IRC at the top right. Submitthe job. When completed, the results (a list of molecules) willbe placed in a file “ene reaction 1-pentene_3-21G.IRC1”. Bringup the file. Using the step ( , ) and play ( ) keys at thebottom left of the screen, show the motions of the atoms duringthe course of reaction.
16. Remove any molecules and dialogs from the screen.
Chapter 5 12/30/03, 4:09 PM78

79
Thermodynamic vs. Kinetic Control
Chemical reactions may yield different products depending on theconditions under which they are carried out. High temperatures andlong reaction times favor the most stable (“thermodynamic”) products,while low temperatures and short reaction times favor the most easilyformed (“kinetic”) products. For example, the kinetic product in Diels-Alder cycloaddition of cyclopentadiene and maleic anhydride is theendo adduct, whereas it seems likely that the less-crowded exo adductis the thermodynamic product.
O
O
O
H
H
O
O
O
O
O
O
H+
∆+
endo exo
H
b b
aa
Here you will first obtain pathways for reactions leading to both endoand exo adducts using the PM3 semi-empirical model and then(optionally) follow these by single-energy 3-21G Hartree-Fockcalculations to get a better estimate of the difference in activationenergies.
1. Build the endo Diels-Alder adduct of cyclopentadiene andmaleic anhydride and minimize (to CS symmetry).
2. Select Constrain Distance from the Geometry menu (or clickon the icon from the Geometry toolbar), and one after theother, click on bonds “a” and “b” in the figure above. For each,click on the icon at the bottom right of the screen (it willthen turn to ).
3. Select Properties from the Display menu, and click on theconstraint marker for bond “a”. The Constraint Propertiesdialog appears, with the value of the constraint for bond distance“a” (1.54Å) given in a box to the right of Value. Change this to1.5Å by typing “1.5” inside the box and then pressing the Enterkey. Check Dynamic inside the dialog. This leads to an
5 mins
Chapter 5 12/30/03, 4:09 PM79

80
extended form of the Constraint Properties dialog, whichallows the single constraint value to be replaced by a sequenceof constraint values. Type “2.7” (2.7Å) into the box to the rightof to and press the Enter key. Steps should be set to “10”. (Ifit is not, type “10” and press the Enter key.) What you havenow specified is that bond “a” will be constrained first to 1.5Å,then to 1.633Å, then to 1.767Å, etc. and finally to 2.7Å.
You need to repeat the process for bond “b”. Click on thisbond (the Constraint Properties dialog will now refer to theconstraint on bond “b”), and type “1.5” and “2.7” for Valueand to, respectively. Be certain to press the Enter key followingeach. What you have done is to request that bonds “a” and “b”both be constrained from 1.5Å to 2.7Å in 10 equal steps. Closethe Constraint Properties dialog.
4. Bring up the Calculations dialog and select Energy Profilefrom the top menu to the right of “Calculate”, and Semi-Empirical and PM3 from the two bottom menus. Click onSubmit at the bottom of the dialog to submit the job. Name it“cyclopentadiene+maleic anhydride endo_PM3”.
5. When completed the job will give rise to a new file“cyclopentadiene+maleic anhydride endo_PM3.Profile1”containing the 10 steps which make up the energy profile. Openthis file.*
6. Bring up the Spreadsheet, and click on Add... at the bottom.Select E from among the entries, kcal/mol from the Energymenu, and click on OK. Next, click on and click on one ofthe two CC bonds varied in the energy profile.** Click on atthe bottom right of the screen. Click on . Finally, bring upthe Plots dialog, and select Length (Bond8)*** from among
* To avoid confusion, it is a good idea to close the original file “cyclopentadiene+maleicanhydride endo_PM3”.
** Alternatively, you could have selected (instead of ), clicked on one of the two constraintmarkers, and then clicked on .
*** Most likely the bond you select will not be called “Bond8”.
Chapter 5 12/30/03, 4:09 PM80

81
the items in the X Axis menu and E (kcal/mol) from the YAxes list. Click on OK.
Identify both the reactant and transition state from the plot andestimate the activation energy for the cycloaddition reaction.
7. Repeat steps 1 to 6 for the exo adduct. Compare the activationenergy for exo addition to that for endo addition (above). Whatshould be the kinetic product?
8. Remove all molecules and dialogs from the screen.
9 to 11 optional
9. Open “cyclopentadiene+maleic anhydride endo_PM3.Profile1” ( ) and make a copy ( ). Name it “cyclopentadiene+maleic anhydride endo_3-21G”. Enter the Calculationsdialog and specify a single-point energy calculation using theHartree-Fock 3-21G model. Submit. When completed, performthe same spreadsheet and plot operations you did for the PM3calculations.
10. Repeat the above procedure for the exo adduct and comparethe two activation energies. What is the kinetic product?
11. Remove all molecules and dialogs from the screen.
Chapter 5 12/30/03, 4:09 PM81

82
Stereospecific Diels-Alder Reactions
XH
CN
CN
XH HX HX
CN
CN
CN
anti exoanti endosyn exo
+
syn endo
X
H
Diels-Alder cycloaddition of 5-substituted cyclopentadienes withacrylonitrile can lead to four stereoproducts, in which the X group issyn or anti to the dienophile, and the nitrile is endo or exo. Anti productsare preferred when X is alkyl (in line with obvious steric dictates),while syn products are favored when X is halogen or alkoxy. In general,endo adducts are kinetically favored over exo adducts (see previoustutorial). In this tutorial, you will first use AM1 semi-empiricalcalculations to obtain both syn and anti transition states for endoaddition of both 5-methylcyclopentadiene and 5-fluorocyclopentadieneand acrylonitrile, and then use Hartree-Fock 3-21G calculations toestimate relative activation energies. As the four transition states arelikely to be very similar to the transition state for the “parent”cycloaddition (cyclopentadiene and acrylonitrile), you will first obtaina transition state for the parent reaction, and then to use it as a startingpoint for locating transition states for the substituted systems.
1. Construct the following substituted norbornene (the productof endo addition of cyclopentadiene and acrylonitrile).
a
CN
b
cd
e
f
2. Click on . Click on bond “a” (see figure above) and then onbond “b”. A curved arrow will be drawn from “a” to “b”. Next,click on bond “c” and then on bond “d”; a second curved arrowfrom “c” to “d” be drawn. Finally, click on bond “e” and thenon bond “f”, leading to a third curved arrow. The model onscreen should now appear as follows.
5 mins/10 mins
Chapter 5 12/30/03, 4:09 PM82

83
CN
Click on at the bottom right to produce a guess at thetransition state.
3. Inside the Calculations dialog, specify calculation of transitionstate geometry using the semi-empirical AM1 model. CheckIR (to the right of “Compute”) to specify calculation ofvibrational frequencies. This will allow you to verify that youhave indeed located a “reasonable” transition state.
4. Submit the job. Name it “cyclopentadiene+acrylonitrile_AM1”. When it has completed, examine the resulting structureand calculated frequencies. Make certain that there is one andonly one imaginary frequency. Animate the motion associatedwith the imaginary frequency (Spectra under the Displaymenu, click on the IR tab and check the box to the left of theimaginary frequency in the dialog which results) to verify thatit corresponds to motion along the reaction coordinate.
5. Place the transition-state structure onto the clipboard. Positionthe cursor slightly above and slightly to the left of the model,then, with both buttons depressed, drag the mouse to a positionslightly below and slightly to the right of the model, and finallyrelease both buttons. Dotted lines will enclose the model.Select Copy from the Edit menu. Close “cyclopentadiene+acrylonitrile_ AM1” ( ).
6. Enter the builder ( ). Click on Clipboard (at the bottom ofthe model kit) and then click anywhere on screen. Thetransition-state structure will appear. Add a fluorine to themethylene group of the “cyclopentadiene fragment” of thetransition state either syn or anti. Do not minimize. Your startingstructure should provide an excellent guess at the transitionstate for the substituted system.
Chapter 5 12/30/03, 4:09 PM83

84
7. Select New Molecule from the File menu. The screen willclear. Click on Clipboard and then click anywhere on screen.Add fluorine to the other methylene group position.
Repeat the process two more times (starting with NewMolecule), to add methyl both syn and anti on the methylenegroup. When you are done (four substituted transition states intotal), click on .
8. Enter the Calculations dialog and specify calculation oftransition state geometry using the semi-empirical AM1 model.Check IR (to the right of “Compute”). Finally, make certainthat Global Calculations is checked before you exit the dialog.Submit the job (name it Diels-Alder stereochemistry_AM1”.When it has completed, verify that all four structures correspondto transition states (using Spectra from the Display menu).
9. Make a copy of “Diels-Alder stereochemistry” ( ). Name it“Diels-Alder stereochemistry_3-21G”. Enter the Calculationsdialog with this copy and specify a single-point energycalculation using the 3-21G Hartree-Fock model. Make certainthat you remove the checkmark on IR and that GlobalCalculations is checked before you exit the dialog.
10. Submit the job. When it completes, bring up the spreadsheet(Display menu) and enter the total energies. Click on the headercell of a blank column and then on Add . . . at the bottom ofthe spreadsheet. Select E from the menu of available quantitiesand au (atomic units) from the Energy menu. Click on OK.Are your results consistent with the observed syn/antiselectivity in these reactions?*
11. Remove all molecules and any remaining dialogs from thescreen.
* You might find it convenient to have the spreadsheet calculate relative energies. Select(click on) the label for one of the fluorine substituted transition states in the spreadsheet,then click on Add... and select rel. E from the menu of available quantities. Click on OK.Repeat for the methyl substituted transition states.
Chapter 5 12/30/03, 4:09 PM84

85
Carbene Additions to Alkenes
C CHH
H H
C
C C
X
H H
X
H H
+ :CX2
Singlet carbenes add to alkenes to yield cyclopropanes. Since a singletcarbene possesses both a high-energy filled molecular orbital in theplane of the molecule, and a low-energy, out-of-plane unfilledmolecular orbital, this reaction presents an interesting dilemma.Clearly it would be more advantageous for the low-lying vacant orbitalon the carbene, and not the high-lying filled orbital, to interact withthe olefin π system during its approach.
C
C CHH
H H
However, this leads to a product with an incorrect geometry, and thecarbene must “twist” by 90° during the course of reaction.
C
C C
XX
H HH H
C
C C
XX
H HH H
C
C C
XX
H HH H
In this tutorial, you will use the Hartree-Fock 3-21G model to findthe transition state and to analyze the motion of the fragments.
1. Bring up the entry model kit and build ethylene.
2. Select from the model kit. Click on the Insert button at thebottom right of the screen (or press the Insert key) and thenclick anywhere on screen. Next, select from the model kitand click on two of the free valences on the sp3 carbon. Next,
5 mins/15 mins
Chapter 5 12/30/03, 4:09 PM85

86
click on and, one after the other, click on the remaining twofree valences on the sp3 carbon. Finally, click on . You areleft with two fragments, ethylene and difluorocarbene. Orientthe two as to be poised for reaction.*
C
C C
FF
Translations and rotations normally refer to the complete setof fragments, but that they can be made to refer to an individualfragment. Click on a fragment to identify it, and then hold downthe Ctrl key while manipulations are being carried out.
3. Click on . Click on the carbon on the CF2 fragment and then,while holding down the Shift key, click first on the CF2 carbonand then on one of the carbons on the ethylene fragment. Acurved arrow will be drawn.
C
C C
FF
Next, click on the CC double bond and then, while holdingdown the Shift key, click on the other ethylene carbon andthen on the CF2 carbon. A second arrow is added to the structure.
C
C C
FF
With both arrows in place, click on at the bottom right ofthe screen. Your structure will be replaced by a guess at thetransition state.
* Proper orientation of the two fragments is not crucial in this case, but is primarily to allowthe user to associate the “arrows” with the intended reaction. Proper orientation is, however,essential where different stereochemical outcomes are possible.
Chapter 5 12/30/03, 4:09 PM86

87
4. Enter the Calculations dialog, and specify calculation of atransition-state geometry using the 3-21G Hartree-Fock model.Check IR to the right of “Compute”. This will allow you toexamine the motion along the reaction coordinate. Click onSubmit inside the dialog. Name the job “difluorocarbene+ethylene_3-21G”.
5. When the job is complete, examine the geometry of thetransition structure. In light of considerations regarding theorientation of filled and empty molecular orbitals on the carbeneand the π orbital on ethylene, would you describe your structureas corresponding to an “early” or “late” transition state? Animatethe vibrational mode corresponding to the reaction coordinate.Bring up the IR dialog (Spectra under the Display menu andclick on the IR tab). Click on the imaginary frequency at thetop of the list of frequencies (this corresponds to motion alongthe reaction coordinate). Does the animation show reorientationof the carbene as it approaches the double bond? When you arefinished, turn “off” the animation by again clicking on theimaginary frequency.
6. Select Properties (Display menu) and, in turn, click on eachof the four hydrogens in the transition state. Change the valuein the Mass Number menu in the Atom Properties dialogfrom “1” to “2 Deuterium”. When you are done, resubmit thejob. When complete, examine the new set of vibrationalfrequencies. Note that they are uniformly smaller than thosefor the undeuterated system, and that the largest changes arefor vibrational motions where hydrogens are involved.
7 to 10 optional
7. Make a copy of “difluorocarbene+ethylene_3-21G” name it“difluorocarbene+cyclohexene_3-21G”.
8. Bring up the entry model kit with the copy (click on ). SelectFreeze Center from the Geometry menu (or click on the icon from the Geometry toolbar). One after the other, click onall atoms and free valences in your transition state except two
Chapter 5 12/30/03, 4:09 PM87

88
of the free valences on one side of the “ethylene fragment”.*
Each of the atoms on which you clicked will be given a magentacolored marker, indicating that it is to be “frozen” (not movedduring optimization).** Using sp3 carbon from the model kitand then , connect the two free valences which you have not“frozen” by a chain of four “methylene groups” to make acyclohexene ring. Click on . Note that the only four methylenegroups which you have just added “move” and not theunderlying transition state. You have produced an excellent guessat the transition state for difluorocarbene addition to cyclohexenebased on your previous transition state for the simpler process.
9. Enter the Calculations dialog. It should already specifycalculation of transition-state geometry using the 3-21GHartree-Fock model. Remove the checkmark on IR (to theright of “Compute”). Click on Submit.
10. When completed, compare the geometries of the two transitionstates (corresponding to addition of difluorocarbene toethylene and cyclohexene, respectively). To do this, first putthe two transition states into the same group. Select AppendMolecule(s)... from the File menu and double click on“difluorocarbene+ethylene” in the browser which results. Thenbring up the spreadsheet (Spreadsheet from the Display menu)and check each of the boxes to the right of the molecule names.Click on and, one after the other, click on the three carbonswhich make up the “cyclopropane ring”. Finally, click on Alignat the bottom right of the screen, and then click on . Are thetwo transition states very similar as expected?
11. Remove all molecules and any remaining dialogs from thescreen.
* You could do this more quickly by first clicking on , then drawing a selection box aroundall atoms to be frozen, and then clicking inside this box.
** You can remove the “frozen atom” markers from the model by bringing up the MoleculeProperties dialog (Display menu), clicking on at the bottom right of the dialog and thenremoving the checkmark from Frozens in the Molecule Utilities dialog which results.
Chapter 5 12/30/03, 4:09 PM88

89
SN2 Reaction of Bromide and Methyl Chloride
Br– + C Cl
H
H
H+ Cl-CBr
H
H
HC
H
H H
ClBr
1. The SN2 reaction passes through a transition state in whichcarbon is in a trigonal bipyramid geometry and the enteringand leaving groups are colinear. To build it, first construct methylchloride. Then click on the Insert button at the bottom right ofthe screen (or press the Insert key), select bromine from thepalette of icons in the model kit and click anywhere on screen.Two detached fragments, “methyl chloride” and “hydrogenbromide”, appear on screen. Click on and then click on thefree valence on bromine (immediately click on to get out of“delete mode”). Alternatively, hold down the Delete key andclick on the free valence on bromine. You are left with methylchloride and bromine atom (“bromide”). Manipulate the twosuch that “bromide” is poised to “attack” methyl chloride fromthe backside (as in the transition state above). (Recall thattranslations and rotations normally refer to both fragments, butcan be made to refer to a single fragment by first clicking on thefragment and then holding down on the Ctrl key while carryingout the manipulations.) Do not minimize. Click on .
2. Click on . Click on “bromide” and, while holding down theShift key, click again on “bromide” and then on carbon. Anarrow will be drawn from “bromide” into the “space” betweenbromine and carbon. Next, click on the CCl bond and thenclick on the chlorine. A second arrow from the carbon-chlorinebond to the chlorine will be drawn.
Br C Cl
Click on at the bottom right of the screen. Your structurewill be replaced by a “guess” at the transition state.
2 mins/5 mins
Chapter 5 12/30/03, 4:09 PM89

90
3. Click on and then on the CBr bond. Replace the currentCBr distance in the box at the bottom right of the screen by 3.8(3.8Å) and press the Enter key. You have now made a“complex” representing the “reactant”.
4. Click on . Click on the CBr bond, and then click on at thebottom right of the screen. The icon will change to indicatinga constraint is to be applied to this distance. Next, bring up theProperties dialog and click on the constraint marker. TheConstraint Properties dialog appears. Click on Dynamic.Leave the value “3.8” (3.8Å) in the box to the right of Valuealone, but change the number in the box to the right of to to“1.9” (1.9Å) and press the Enter key. You have requested 10(the default number) structures with CBr bond lengths from3.8Å (the starting point) to 1.9Å (the ending point). Theseshould pass through the transition state. Dismiss the ConstraintProperties dialog.
5. Enter the Calculations dialog, and select Energy Profile, Semi-Empirical and AM1 from the appropriate menus to the rightof “Calculate”. You need to change Total Charge to Anion.
6. Submit the job. Name it “bromide+methyl chloride_AM1”.When completed, it will give rise to a sequence of calculationsplaced in “bromide+methyl chloride_AM1.Profile1”. Open thisfile, and align the molecules. Click on , then in turn on thethree hydrogens, and finally press the Align button at thebottom right of the screen. Click on .
7. Bring up the Spreadsheet and click on Add.... Select E fromamong the quantities listed at the top of the dialog, kcal/molfrom the Energy menu, and click on OK. Next, enter the CBrdistances and bromine charges in the spreadsheet. Click on
, select the CBr distance and click on at the bottom rightof the screen. Click on . Bring up the Properties dialog.Click on bromine and click on to the left of “Electrostatic”under “Charges” in the Properties dialog. Finally, bring upthe Plots dialog, and select Distance (C1,Br1) from the X
Chapter 5 12/30/03, 4:09 PM90

91
Axis menu, and both E (kcal/mol) and Electrostatic (Br1)from the Y Axes list. Click on OK.
One plot gives the energy as the reaction proceeds and theother gives charge on bromine. Are the two related? Explain.
SN2 reactions involving charged species normally need to becarried out in highly-polar media, e.g., water. Spartan providestwo different approaches to account for the solvent: the SM5.4model of Cramer and Truhlar (see Appendix A) in which thesolvent is represented by a “reaction field”, and a mixedquantum mechanics/molecular mechanics approach, in whichthe solute is immersed in a “bath” of solvent and moleculardynamics simulation performed. The first approach isillustrated here while the second is illustrated for zwitterionicand non-zwitterionic forms of triglycine in the next chapter.
8. Add “aqueous phase” data to the spreadsheet. Click on an emptycolumn header, click on Add..., select E SM5.4 from the listof available quantities (kcal/mol from the Energy menu), andclick on OK. Bring up the Plots dialog and select Distance(C1,Br1) from the X Axis and E SM5.4 (kcal/mol) from the YAxes list. Click on OK.
Chapter 5 12/30/03, 4:09 PM91

92
9 to 12 optional
9. With “bromide+methyl chloride_AM1_Profile1” enter theCalculations dialog. Specify Single Point Energy (AM1should be selected) and click on OK.
10. Enter the Surfaces dialog. Click on Add.... Select density(bond) from the Surface menu and none from the Propertymenu and click on OK. Again click on Add... and again selectdensity (bond) from the Surface menu, but this time potentialfrom the Property menu. Click on OK.
11. Submit the job. When completed, click on the line “density...”inside the Surfaces dialog. Click on at the bottom left of thescreen to animate the display. Note, the smooth way in whichbonds are broken and formed during the course of reaction.Click on at the bottom of the screen when you are done.
12. Reenter the Surfaces dialog. Turn “off” display of the bonddensity (click on the line “density...”), and turn “on” display ofthe electrostatic potential mapped onto the bond density (clickon the line “density potential...”). Click on . Relate themigration of negative charge during reaction as indicated bycolors in the electrostatic potential map to the “charge” plotyou constructed in step 5 above. Recall, that colors near redindicate maximum negative potential.
13. Remove all molecules and any remaining dialogs from thescreen.
Chapter 5 12/30/03, 4:09 PM92

93
Chapter 6Biologically Interesting
MoleculesThis chapter illustrates applications involving “biologicallyinteresting” molecules, introduces the peptide model kit and showshow a structure from the Protein Data Bank (PDB) may be broughtinto Spartan’04 for further analysis.
At present time, calculations on “real” biopolymers (proteins andRNA/DNA strands) are limited to molecular mechanics models.However, large classes of organic molecules of biological interest,among them steroids, prostaglandins and vitamins, are amendable toinvestigation using quantum chemical models. The first three tutorialsgive examples of such applications, and the last of these also providesa bridge between small molecules and biopolymers.
Polypeptides and polynucleotides are considered in the last twotutorials. The peptide model kit, intended primarily to construct smallpolypeptide strands in “idealized” geometries, is used to build helicalpolyglycine, and comparisons are made between zwitterionic andnon-zwitterionic forms both in and out of water. The structures of asmall molecule - DNA complex and a protein-RNA complex, obtainedfrom the protein databank (PDB), are used in the two final tutorials,the first as the basis of a graphical modeling study, and the second toillustrate display of hydrogen bonds.
Chapter 6 12/30/03, 4:15 PM93

Chapter 6 12/30/03, 4:15 PM94

Vitamin E
HO
O
Vitamin E may play an active role in defending cells from attack byreacting quickly with oxidizing agents to give stable products that canthen be safely excreted. While the mechanism of the vitamin’s actionis not completely certain, it seems likely that it might directly transfera hydrogen to another free radical leading to its “destruction” and tothe formation of a stable “Vitamin E radical”. Graphical models canhelp to account for this biological function, as well as suggest whyVitamin E incorporates a long hydrocarbon chain.
1. Build vitamin E. Start with Benzene from the Rings menu. Adda sequence of three sp3 carbons ( ) and an sp3 oxygen ( ) tothe ring and then join them ( ) to form the bicyclic skeleton.Click on to produce a refined (intermediate) structure.
2. Add the saturated carbon chain (the “•” is a free valence).*
Don’t worry about its conformation.
•
Finally, add the four methyl groups and the hydroxy group atthe appropriate ring positions. Click on to produce a finalstructure.
3. Enter the Calculations dialog (Setup menu) and specifycalculation of equilibrium geometry using the AM1 semi-empirical model. Click on OK. Next, enter the Surfaces dialog
* You could save time by first building the five-carbon fragment (the “•’s” are free valences),
••
then placing it on the clipboard, and finally using this fragment (instead of sp3 carbon) asthe building block. You need to add one sp3 carbon at the end.
95
15 mins
Chapter 6 12/30/03, 4:15 PM95

96
(Setup menu). Click on Add... and select density from theSurface menu and potential from the Property menu. Submitthe job; name it “vitamin E_AM1”.
4. When completed, examine the electrostatic potential map.Inside the Surfaces dialog, click on the line “density potential. . .”. Note that the potential map suggests that the greaterportion of the molecule (the hydrocarbon chain) is non polar.This facilitates its incorporation into lipids.
5. Make a copy of “vitamin E_AM1” (click on ). Name it“vitamin E radical_AM1”. Select Delete from the Build menu(or click on ), and click on the hydroxyl hydrogen. Do notminimize. You already have an excellent starting structure.
6. Enter the Calculations dialog and change Multiplicity fromSinglet to Doublet. Click on OK. Enter the Surfaces dialog.First, remove the request for the electrostatic potential map(click on the line: “density potential . . .” and then click onDelete at the bottom of the dialog). Next, make a request for aspin density surface. Click on Add..., select spin from theSurface menu and none from the Property menu, and clickon OK. Submit the job.
7. When completed, enter the Surfaces dialog and click on theline: “spin . . .”. Note that the unpaired electron is not localizedon oxygen, but rather is delocalized over the benzene π system.This is why vitamin E forms a stable radical and is able to actas an effective “radical scavenger”.
8. Remove all molecules and any remaining dialogs from thescreen.
Chapter 6 12/30/03, 4:15 PM96

97
Androsterone
H3C
H
HH
HHO
H3C
O
A
B
CD
Androsterone illustrates the steps involved in building a complexorganic molecule with fused rings and several stereocenters. It alsoprovides a good opportunity to compare space-filling models andelectron density surfaces as measures of molecular size and shape.
1. Click on . Select Cyclohexane from the Rings menu, andclick anywhere on screen.
2. Cyclohexane is still selected in the Rings menu. Make certainthat the associated icon (at the top of the model kit) indicates“eq” rather than “ax” (meaning that attachment is to be madeusing an equatorial ring position). If not, click on the icon andit will switch from “ax” to “eq”. Click on one of the equatorialfree valences of the cyclohexane ring on screen. The two six-membered rings will be joined through their equatorial valences.
3. Rotate around the bond connecting the two cyclohexane ringssuch that the axial free valences on the connecting carbons areantito each other . This bond was the last bond formed andshould be encircled by a red marker. (If it is not, click on thebond.) Then drag the mouse up and down while holding downboth the Alt key and the left button). Orient the molecule suchthat the equatorial free valences on the cyclohexane carbonsone position removed from those which are already bondedare in front of you and “poised” to form a third cyclohexanering (in a chair geometry).
4. Select sp3 carbon from the model kit and, click on equatorialfree valences facing each other on both of the six-memberedrings you have just joined. The resulting structure should beas follows.
1 min/2 mins
Chapter 6 12/30/03, 4:15 PM97

98
CH3
CH3
H
H
Click on and, one after the other, click on free valences onthe two methyl groups you have just added which are in closestproximity. This will lead to a third six-membered ring. Clickon . All three six-membered rings should now be in chairgeometries and the stereochemistry should be as in the figureabove. If not, you need to start over (select Clear from theEdit menu), or “undo” the last operation (select Undo fromthe Edit menu).
5. Click on C(sp3) in the model kit. Click on equatorial freevalences on two appropriate positions of one of the externalsix-membered rings (the “C ring”). Two methyl groups willbe added, from which the “D ring” is to be formed.
6. sp3 carbon is still selected. Click on a free valence on one of themethyl groups added in the previous step to make it an ethylgroup. By appropriate bond rotations, position the “methyl”and “ethyl” groups such that two free valences are in proximity.
7. Click on . One after the other, click on the two free valenceswhich have been made nearly coincident in the previous step.A bond will be drawn forming a five-membered ring. Click on
; another refined (intermediate) structure will appear. Allthat now remains is to add a carbonyl group on the “D ring”,and to place the hydroxy and methyl substituents.
8. Click on C(sp3) in the model kit. Click on the appropriateaxial free valence involving the “C” and “D” rings, and then onthe proper axial free valence involving the “A” and “B” rings.
9. Click on the O(sp3) in the model kit. Add hydroxy to theappropriate equatorial position on the “A ring”, and to thecarbon on the “D ring” which is to become the carbonyl carbon.
Chapter 6 12/30/03, 4:15 PM98

99
Click on . Click on free valences on carbon and on oxygenassociated with the hydroxy group just added to the “D ring”.A (distorted) carbonyl group will be formed. Click on andthen on .
10. Androsterone incorporates several chiral centers. To assignthem as R or S, select Configure... (Model menu) and checkR/S under “Atom” in the dialog which appears. Click on OK.R/S labels are attached to each of the chiral centers. (You canremove them by selecting Labels from the Model menu.)
11. Select Calculations... from the Setup menu. Inside the dialog,specify calculation of an equilibrium geometry at the AM1semi-empirical level. Exit the dialog and submit the job. Nameit “androsterone_AM1”. Once completed, examine the output.Note the large number of geometrical variables and the smallnumber of optimization cycles required.
12 to 14 optional
Compare the volume of a space-filling model to that obtained froman electron density surface.
12. Select Properties (Display menu). This leads to the MoleculeProperties dialog. Note the surface area and the volume of aspace-filling (CPK) model.
13. Select Surfaces (Setup or Display menu). Click on Add....Select density from the Surface menu and none from theProperty menu, and click on OK
14. Submit the job. When it has completed, enter the Surfacesdialog and click the line “density . . .”. Enter the Propertiesdialog, and click on any portion of the density surface. Boththe surface area and the volume of the electron density surfaceappear. How do these compare with the correspondingquantities based on the CPK model?
15. Remove androsterone and any remaining dialogs from thescreen.
Chapter 6 12/30/03, 4:15 PM99

100
Tautomers of Nucleotide Bases
Protons bound to heteroatoms in heterocyclic compounds are likelyto be very mobile in solution and, where two or more heteroatomsare present in a structure, different isomers (tautomers) may be inequilibrium. As a case in point, consider the nucleotide base cytosine(where a methyl group has replaced the sugar-phosphate backbone).
N
N
O
CH3
NH2
N
NH
O
CH3
NH
N
N
OH
CH3
NH
The existence of a low-energy tautomer could have far-reachingconsequences, given that cytosine is one of the nucleotide bases andits valence structure is key to hydrogen bonding in DNA. In thistutorial, you will examine the possible tautomers of 1-methylcytosinefor evidence of low-energy structures.*
1. Bring up the entry model kit ( ) and build 1-methylcytosine.Start with Amide from the Groups menu. Select planar trigonalnitrogen (instead of pyramidal nitrogen) for the external aminogroup. Minimize and click on .
2. Note that the word “Tautomer” appears at the bottom right ofthe screen. This indicates that tautomers exist for the structureyou have built. Select Tautomers from the Search menu (orclick on the icon in the Search toolbar). Step through thetautomers using the and keys at the bottom right of thescreen. To put the tautomers in a group, click on to the rightof the step keys, and then click on OK in the dialog which results.
3. Enter the Calculations dialog with this group.** Specify asingle-point energy calculation using the 3-21G Hartree-Fock
* Note, however, that were the energy of an alternative tautomer only 3 kcal/mol higher thanthat for the “normal” structure, this would translate into a relative abundance of only about1% at room temperature. Thus, any alternative tautomers would need to be very close inenergy to the lowest-energy tautomer to have noticeable effect.
** 1-cytosine which you built remains on screen. Close it.
5 mins/30 mins
Chapter 6 12/30/03, 4:15 PM100

101
model. Also, select AM1 from the menu to the right of “Startfrom” to indicate that semi-empirical geometries will beemployed.* Make certain that Global Calculations is checkedbefore you click on Submit at the bottom of the dialog. Namethe job “1-methylcytosine tautomers_3-21G”.
4. After the three calculations have completed, bring up thespreadsheet and click on the line corresponding to the “normal”structure for 1-methylcytosine (the one that you originally built).Next, click on the header cell corresponding to the leftmostblank column, then click on Add..., then select rel. E from theavailable properties and kcal/mol from the Energy menu, andfinally, click on OK. Tautomer energies (relative to the “normal”form) appear in the spreadsheet. Are either of the alternativesclose in energy to the normal form of 1-methylcytosine?
5 and 6 optional (cannot be completed with the Essential Edition)
To get a better estimate of relative tautomer energies, perform single-point calculations using the localized MP2 (LMP2) model.
5. Make a copy of “1-methylcytosine tautomers_3-21G” ( ).Name it “1-methylcytosine tautomers_LMP2_6-31Gs”. Enterthe Calculations dialog with this copy and specify Single PointEnergy from the menu to the right of “Calculate” and MøllerPlesset, MP2 and 6-31G* from the three bottom menus. CheckLocalized to the far right of “Calculate”. Also, reset the menuto the right of “Start from” to Initial. Finally, make certainthat Global Calculations is checked. Submit the job.
6. When it completes, bring up the spreadsheet (it should containthe relative tautomer energies). Does the use of the correlatedLMP2 model change any of the earlier conclusions regardingthe likelihood of alternative tautomers?
7. Close whatever molecules and dialogs that remain on screen.
* This is done to save computer time. If you wish to use 3-21G geometries instead, selectEquilibrium Geometry (instead of Single Point Energy) from the menu to the immediateright of “Calculate” and Initial (instead of AM1) from the menu to the right of “Start from”.
Chapter 6 12/30/03, 4:15 PM101

102
Polyglycine
Triglycine and (optionally) decaglycine will be used to illustrateconstruction of simple amino acid sequences using Spartan’04’speptide model kit, as well as to investigate the role of aqueous mediain altering the equilibrium between “neutral” and zwitterionic formsand to show the utility of electrostatic potential maps in conveyinginformation about overall charge distribution.
1. Bring up the peptide model kit by clicking on , and thenclicking on the Peptide tab at the top of the entry model kit.
2. Make certain that Sequence is checked, and then click threetimes on “gly” (glycine) from the selection of amino acid codes.The sequence “gly-gly-gly” will appear in the box at the topof the model kit.
3. α α α α α Helix near the bottom of the model kit should be selected. Ifit is not, click on it. The backbone ψ and φ angles which definean α helix will appear at the right. Click anywhere on screen.Triglycine will appear, although it will not be properlyterminated.
5 mins/10 mins
Chapter 6 12/30/03, 4:15 PM102

103
4. First consider the non-zwitterionic structure. Click onTerminate in the model kit. The Terminate dialog will appearallowing you to specify “C” and “N” terminating groups.
Select CO2H for the C terminating group (click on the icon tocycle between groups), and NH2 for the N terminating group.Click on OK.
Amino acids replace atomic fragments, functional groups, ringsand ligands as the basic building blocks in the peptide model kit,and these other building blocks are missing. Therefore, mostmodifications of peptides, aside from modifications in sequenceof amino acids and in overall conformation, need to be carriedout using either the entry or expert model kits.
5. Select Freeze Center from the Geometry menu (or click on). Click on Freeze Heavy at the bottom right of the screen.
This indicates that all heavy (non-hydrogen) atoms are not tobe moved during molecular mechanics minimization.* Clickon to produce a refined structure (subject to the restrictionthat heavy atoms are kept in place).
6. Select New Molecule from the File menu. Click anywhere onscreen. Click on Terminate inside the model kit and this timeselect CO2
– and NH3+ for “C” and “N” terminating groups,
respectively. Click on OK. Click on and then click on FreezeHeavy at the bottom of the screen. Finally, click on .
7. Dismiss the model kit by clicking on . Both forms oftriglycine now occupy the same group. Enter the Calculationsdialog and specify a single-point energy calculation using the
* This is necessary to maintain the idealized helix structure.
Chapter 6 12/30/03, 4:15 PM103

104
Hartree-Fock 3-21G model. Do not change Total Charge (fromNeutral) for the zwitterionic form of triglycine. Even thoughits Lewis structure incorporates formal “+” and “-” charges,the molecule is neutral. Also make certain that GlobalCalculations is checked. Click on Submit at the bottom of thedialog. Name the job “triglycine_3-21G”.
8. After the calculations complete, bring up the spreadsheet, clickon the header cell of an empty column, and click on Add... atthe bottom of the spreadsheet. Select E from the list of availableproperties at the top of the dialog which appears, and kcal/mol from the Energy menu, and then click on OK.
Which form of triglycine, zwitterion or non-zwitterion, isfavored in the gas phase?
9 to 10 optional (cannot be completed with the Essential Edition)
9. Make a copy of “triglycine_3-21G” ( ). Name it “triglycinein water_3-21G”. Enter the Calculations dialog with this copy,and again specify a single-point energy calculation using theHartree-Fock 3-21G model. Select Water for Solvent (to theright of “Compute”). Submit the job. When completed (twocalculations), bring up a spreadsheet and enter the energies ofthe two forms.
Which form of triglycine, zwitterion or non-zwitterion, isfavored in water? Rationalize any changes in relative energiesover the gas-phase results.
10. Remove “triglycine in water_3-21G” and remaining dialogsfrom the screen.
11 to 15 optional
An electrostatic potential map for the zwitterionic form of a biggerpolypeptide, decaglycine, clearly shows charge separation to“explain” why such a structure is not favored in the gas phase.
Chapter 6 12/30/03, 4:15 PM104

105
11. Bring up the peptide model kit.* Click seven times on “gly”(glycine) from the selection of amino acid codes. A sequenceof ten glycines has now been requested. Click anywhere onscreen. Click on Terminate in the model kit and select CO2
–
and NH3+ for “C” and “N” terminating groups, respectively,
and then click on OK. Click on and then click on FreezeHeavy at the bottom of the screen. Click on , and then clickon to dismiss the model kit.
12. Enter the Calculations dialog and specify a single-point energyAM1 calculation. Check Converge (near the bottom right ofthe dialog). Semi-empirical calculations on molecules of thiscomplexity often have trouble converging and this optioninvokes a number of special convergence techniques.
13. Bring up the Surfaces dialog and request calculation of anelectrostatic potential map. Click on Add..., select density fromthe Surface menu and potential from the Property menu, andclick on OK.
14. Submit the job. Name it “decaglycine zwitterion_AM1”.Execution will take several minutes due primarily to calculationof the graphic. When completed, again enter the Surfacesdialog. Click on the line “density potential . . .”. Examine theelectrostatic potential map. Recall that colors near redcorrespond to areas on the surface which are negatively charged(attracted to a point-positive charge), while colors toward bluedesignate regions of positive charge. Intermediate colors(greens) represent neutral regions. What do you conclude aboutthe environment in which decaglycine wishes to exist?
15. Remove decaglycine and any remaining dialogs from thescreen.
* The following instructions assume that this section follows the building of triglycine, i.e.,that the box at the top of the peptide model kit already contains a sequence of three glycines.If you are starting from scratch, first make certain that Sequence is checked, then click tentimes on “gly”, then click on ααααα Helix and finally click anywhere on screen.
Chapter 6 12/30/03, 4:15 PM105

106
Propamidine DNA Complex
Small molecules are known to be able to insert themselves into thegrooves of DNA. Binding may lead to changes in the structure of theDNA strand (for example, changes in the spacing and orientation ofbase pairs) and may act to inhibit DNA replication.
This tutorial serves to illustrate how “small molecules” may bemanipulated and examined in the presence of “big molecules”. Youwill first examine the structure of a known complex, specifically thatof propamidine binding in the “minor groove” of a dodecamer. Thiscomplex originates from the Protein Data Bank (PDB)*, but the PDBfile originally brought into Spartan’04 has been parsed into twocomponents of a list (the short strand of DNA and propamidine).Additionally, water molecules have been eliminated. Finally, anelectrostatic potential map has been obtained for propamidine. Theparsed file (read only) has been written on the distribution mediaunder the name “propamidine DNA complex”.**
1. Locate and open “propamidine DNA complex” and make acopy with the same name in your working directory. Then, bringup the spreadsheet and reduce it to minimal size in order to seeonly the names of the individual molecules “DNA strand” and“propamidine”. Check both boxes to the right of the moleculenames such that both are simultaneously displayed on screen.
2. At the outset, both molecules are displayed as ball-and-spokemodels, and it is difficult to locate propamidine inside the DNAstrand. Select propamidine (click on its name in the spreadsheet)and then select Space Filling from the Model menu. The twocomponents are now clearly distinguished and you can seehow closely they interlock.
Experiment with different model styles for each of these models.To see how tight the fit really is, display both as space-fillingmodels. Another interesting display is to represent propamidine
* PDB designation 102D. C.M. Nunn and S. Neidle, to be published.** Under the directory: Program Files/Wavefunction/Spartan04vXYZ/Tutorials
Chapter 6 12/30/03, 4:15 PM106

107
as a space-filling model and the DNA strand using “ribbons”.Select Hide and then Ribbons from the Model menu.
3. Another way to differentiate the components is by color. Bringup both as space-filling models and, while holding down theAlt key, click on any portion of the propamidine model. Thewhole model will be selected (indicated by all atoms beingtinted “gold”). Select Properties from the Display menu,giving rise to the “Selected” Style dialog.
“Paint” propamidine such that it can be easily distinguishedfrom the DNA strand and click anywhere on the (propamidine)model to lose the gold tint. Experiment with differentcolorations. When you are done, reselect propamidine, and clickon Reset inside the “Selected” Style dialog.
4. Display the DNA strand as a space-filling model andpropamidine as a tube or ball-and-spoke model. Selectpropamidine and then bring up the Surfaces dialog (Setup orDisplay menu). Note that an electrostatic potential map hasbeen requested but is marked “Pending” (meaning that it hasyet to be calculated). Make certain that Global Surfaces atthe bottom of the dialog is unchecked. Submit the job. Whencompleted, turn “on” the electrostatic potential map bychecking the yellow box in the dialog. These kinds of displaysmay be used to supplement conventional models and provideinsight into the possible relevance of charge-charge interactionson binding.
5. Remove “propamidine DNA complex” and any remainingdialogs from the screen.
Chapter 6 12/30/03, 4:15 PM107

108
* PDB designation 1A1T. R.N. de Guzman, Z.R. Wu, C.C. Stalling, L. Pappalardo, P.N. Borerand M.F. Summers, Science, 279, 384 (1998).
** Under the directory: Program Files/Wavefunction/Spartan04vXYZ/Tutorials
Hydrogen Bonding in Biopolymers
Hydrogen bonding is known to be a decisive factor in determiningthe three-dimensional structures of biopolymers. The base pairs incomplementary strands which make up DNA are “held together” byhydrogen bonds. Helical structures in proteins are also maintainedby hydrogen bonds as are neighboring strands in so-called β sheets.
This tutorial shows how different molecular models may be employedto visualize an unusual protein-RNA complex*. In particular, itillustrates the display of hydrogen bonds. No calculations are involved.
1. Locate and open “protein RNA complex”** and make a copy.The structure, which comes up as a ribbon display (only),determined from NMR, and several “alternative” conformershave been provided. Step through them ( and ) to see wherethey are similar and where they differ.
2. Select Configure... from the Model menu and click on theRibbons tab. Select By Residue under “Coloring” in theConfigure Ribbons dialog and click on OK. The model isnow colored according to amino acid/nucleotide base. Clickon the various “color bands” to see what they are.
3. Select Hydrogen Bonds (Model menu). Single “dotted lines”represent hydrogen bonds throughout the “protein part” of thecomplex, and “sets” of dotted lines in the “RNA” part. Thelatter form the connections between nucleotide bases and thenumber of lines in each set actually allows you to identify whatthe bases are.
4. Select Tube (Model menu). Also, uncheck Hydrogens fromthis menu. You can now see in greater detail the structure ofthe complex and the positions of the hydrogen bonds.
5. Close “protein RNA complex”.
Chapter 6 12/30/03, 4:15 PM108

109
Chapter 7Inorganic and
Organometallic MoleculesThis chapter shows how to construct inorganic and organometallicmolecules using Spartan’04’s expert model kit. It also describesquantum chemical models suitable for use where transition metalsare involved.
The majority of organic molecules are made up of a relatively fewelements and obey conventional valence rules. They may be easilybuilt using the entry model kit. However, many molecules incorporateother elements, or do not conform to normal valence rules, or involveligands. Most important among them are inorganic and organometalliccompounds involving transition metals. These need to be constructedusing the expert model kit.
Transition-metal inorganic and organometallic compounds may alsorequire different quantum chemical methods from those which aresatisfactory for organic molecules. In particular, Hartree-Fock modelshave proven not to be suitable where transition metals are involved.The PM3 semi-empirical model, which has been parameterized formost transition metals, generally provides a good account ofequilibrium geometries, as do density functional models. The latterare also believed to provide a satisfactory account of thethermochemistry of reactions involving transition-metal systems,although there is very little experimental data with which to compare.
The tutorials in this chapter illustrate construction of inorganic andorganometallic molecules, as well as the selection of suitable quantumchemical models.
Chapter 7 12/30/03, 4:32 PM109

Chapter 7 12/30/03, 4:32 PM110

Sulfur Tetrafluoride
SF
F
F
F
Sulfur tetrafluoride cannot be constructed using Spartan’04’s entrymodel kit. This is because sulfur is not in its “normal” bent dicoordinategeometry, but rather in a trigonal bipyramid geometry with one of theequatorial positions vacant. However, the molecule can easily be madeusing the expert model kit.
1. Bring up the expert model kit by clicking on and thenclicking on the Expert tab at the top of the model kit.
The expert model kit comprises a Periodic Table* followed bya selection of “atomic hybrids”, then bond types, and finally
* Not all methods are available for all elements listed. Elements for which a specific method(selected in the Calculations dialog) are available will be highlighted in the Periodic Tableif Element Overlay in the Miscellaneous Preferences dialog (Preferences... under theOptions menu; see Chapter 16) is turned “on”. Note also that elements beyond those listedin the Periodic Table may be specified. For a discussion, see Atom Properties under theDisplay menu (Chapter 14).
111
1 min
Chapter 7 12/30/03, 4:32 PM111

112
Rings, Groups and Ligands menus (the first two of whichare the same as found in the entry model kit).
2. Select (click on) S in the Periodic Table and the five coordinatetrigonal bipyramid structure from the list of atomic hybrids.Click on screen. A trigonal bipyramid sulfur will appear.
3. Select F in the Periodic Table and the one-coordinate entry from the list of atomic hybrids. One after the other, click
on both axial free valences of sulfur, and two of the threeequatorial free valences.
4. It is necessary to delete the remaining free valence (on anequatorial position); otherwise it will become a hydrogen. Clickon and then click on the remaining equatorial free valence.
5. Click on . Click on to remove the model kit.
6. Select Calculations... from the Setup menu. Specifycalculation of equilibrium geometry* using the Hartree-Fock3-21G model.**
7. Submit the job. Name it “sulfur tetrafluoride_3-21G”.Whencompleted, select Properties (Display menu) and click on anatom, e.g., sulfur. The charge on that atom will appear in the(Atom Properties) dialog. Are the charges consistent withcovalent or ionic bonding?
8. Remove sulfur tetrafluoride and any remaining dialogs fromthe screen.
* It should be noted that were an “incorrect geometry” specified at the outset, optimizationwould lead to the correct structure, as long as the starting geometry possessed no symmetry(C1 point group). Thus, square planar SF4 in D4h symmetry would remain square planar,while an “almost” square planar structure (distorted only slightly from D4h symmetry to C1
symmetry) would “collapse” to the proper structure.** The 3-21G(*) basis set, which incorporates a set of unoccupied d-type functions, is used in
place of 3-21G for the sulfur atom.
Chapter 7 12/30/03, 4:32 PM112

113
Benzene Chromium Tricarbonyl
CrOC CO
CO
Comparison of electrostatic potential maps for this system and thatof free benzene will allow you to classify Cr(CO)3 as an electrondonor or an electron acceptor “substituent”.
1. Click on and bring up the expert model kit. Select Cr fromthe Periodic Table and the four-coordinate tetrahedral structure
from the list of atomic hybrids. Click anywhere on screen.
2. Click on Ligands in the model kit, select Benzene from themenu of available ligands.
Click on one of the free valences on the four-coordinatechromium center.
3. Select Carbon Monoxide from the Ligands menu, and clickon the remaining (three) free valences on chromium. Click on
to produce a refined structure.
4. Select New Molecule from the File menu. The screen willblank. Build benzene and click on . Click on .
5. Select Calculations... (Setup menu). Specify calculation ofequilibrium geometry with the semi-empirical PM3 model.Make certain that Global Calculations (at the bottom of thedialog) is checked. You want the calculations to apply to bothbenzene chromium tricarbonyl and benzene. Click on OK.
2 mins/30 mins
Chapter 7 12/30/03, 4:32 PM113

114
6. Select Surfaces (Setup or Display menu). Click on Add....Specify density from the Surface menu, and potential fromthe Property menu, and click on OK. Make certain that GlobalSurfaces is checked.
7. Submit the job (two separate calculations). Name it “benzenechromium tricarbonyl_PM3”. When completed bring up thespreadsheet (Spreadsheet from the Display menu), and checkthe box to the right of the label for both entries. This allowsthe two molecules to be displayed simultaneously on screen.If Coupled (Model menu) is checked, remove the checkmarkby selecting it. This allows the two molecules to be movedindependently. Orient each molecule so that you can clearlysee the benzene face (exposed face in the case of theorganometallic).
8. Inside the Surfaces dialog, click on the line “density potential. . .”. Compare electrostatic potential maps for both free andcomplexed benzene, with attention to the “exposed face” onbenzene.* Is the effect of the Cr(CO)3 group to donate or towithdraw electrons from the ring? Would you expect thearomatic ring in benzene chromium tricarbonyl to be more orless susceptible to electrophilic attack than free benzene? Moreor less susceptible to nucleophilic attack?
9 optional (cannot be completed with the Essential Edition)
9. Repeat the two calculations using density functional theory.Make a copy of “benzene chromium tricarbonyl_PM3” ( );name it “benzene chromium tricarbonyl_BP_6-31Gs”. Insidethe Calculations dialog, specify a single-point energycalculation using the BP/6-31G* model. Submit. Whencompleted, examine the electrostatic potential maps. Are theyqualitatively similar to those from the PM3 calculations?
10. Remove all molecules and any remaining dialogs from thescreen.
* Electrostatic potential maps (as well as other maps) for molecules in a group will be put onto the same(color) scale. This allows comparisons to be made among different members.
Chapter 7 12/30/03, 4:32 PM114

115
Ziegler-Natta Polymerization of Ethylene
Ziegler-Natta polymerization involves a metallocene. This firstcomplexes an olefin, which then inserts into the metal-alkyl bond.
Cp2Zr+R Cp2Zr+RH2C CH2 Cp2Zr+CH2CH2R
H2C CH2 H2C CH2
RCp2Zr+
In this tutorial, you will use PM3 calculations to obtain a transitionstate for insertion of ethylene into Cp2ZrCH3
+ and, (optionally),estimate the activation energy using density functional calculations.
1. Bring up the expert model kit. Select Zr and , and click onscreen. Select C ( is still selected), and click on one of thefree valences on zirconium. Select Cyclopentadienyl from theLigands menu and, one after the other, click on two of the freevalences on zirconium. Select Ethylene (Ligands menu) andclick on the remaining free valence on zirconium.
2. Orient the methyl and ethylene as shown below.
Zr
C
C
CCpCp
d
cb
a
3. Constrain the four distances a, b, c, d to 2.35Å, 2.05Å, 2.60Åand 2.35Å, respectively. Click on , and repeat the followingsteps for each of the four “bonds”. Click on the bond (or pairof atoms) and then click on at the bottom right of the screen.The icon will change to . Type in the appropriate distanceand press the Enter key. When you are done, click on .
4. Bring up the Calculations dialog, and specify calculation ofequilibrium geometry using the PM3 model. You will need tochange Total Charge to Cation. Check Constraints to theright of “Subject to”. Click on Submit at the bottom of thedialog and name the job “Cp2ZrMe cation+ ethylene_PM3”.
5 mins/90 mins
Chapter 7 12/30/03, 4:32 PM115

116
5. When the job has completed, again bring up the Calculationsdialog. Change Equilibrium Geometry to Transition StateGeometry. Remove the checkmark on Constraints and checkIR to the right of “Compute”. Click on Submit.
6. When the job has completed, bring up the IR dialog (Spectrafrom the Properties menu and click on the IR tab) and clickon the imaginary frequency. Would you describe the processas “concerted” or occurring in discrete steps?
7 to 9 optional (cannot be completed with the Essential Edition)
7. Perform single-point BP/6-31G* density functionalcalculations to obtain an estimate for the energy barrier forethylene insertion. Make a copy of “Cp2ZrMe cation+ethylene_PM3” ( ); name it “Cp2ZrMe cation+ethylene_BP_6-31Gs”. Enter the Calculations dialog with this copy,and specify calculation of a single-point energy using theBP/6-31G* density functional model. Check Pseudopotentialat the far lower right of “Calculate” to specify use of apseudopotential for Zr associated with the 6-31G* basis set.Remove the checkmark on IR (to the right of “Compute”).Total Charge should still be set to Cation. Click on Submit.
8. Build both ethylene and Cp2ZrCH3+ (name them “ethylene_BP_
6-31Gs” and “Cp2ZrMe cation_BP_6-31Gs”, respectively).For Cp2ZrCH3
+, start with three-coordinate trigonal Zr, andthen add two cyclopentadienyl ligands and a four-coordinatetetrahedral carbon. For each, enter the Calculations dialog,and specify a single-point energy with the BP/6-31G* densityfunctional model. Select PM3 from the menu to the right of“Start From”. For “Cp2ZrMe cation_ BP_6-31Gs” (only) checkPseudopotential, and set Total Charge to Cation.
9. Submit both jobs. When they (and the transition-statecalculation) have completed, calculate an activation energy forthe insertion reaction.
10. Remove all molecules and any remaining dialogs from thescreen.
Chapter 7 12/30/03, 4:32 PM116

117
Section IIIFeatures and Functions
This section describes the functions available under the menusincorporated into Spartan’04, and is intended to serve as a generalreference to the program. Available molecular mechanics and quantumchemical methods are enumerated, but no commentary is providedas to their performance or computational requirements. Similarly,available graphical displays are enumerated but no description oftheir use is provided. These issues are treated in detail in “A Guideto Molecular Mechanics and Quantum Chemical Calculations”.
Section III 12/31/03, 11:48 AM117

Section III 12/31/03, 11:48 AM118
119
The File MenuThis section describes operations under the File menu. This providesmodel kits for building new molecules as well as access to the filesystem to read and write Spartan files. It also provides input andoutput of a variety of commonly-employed “external” file types,including input of 2D structures (drawings). Operations under thismenu also allow construction of custom databases and provideprinting of text and on-screen graphics.
The File menu controls reading and writing of the file system, providesinitial access to model kits for molecule building, and allows forprinting of text and graphical displays.
New ( )
Brings up the entry model kit and clears the screen. Use of the entryand other model kits is discussed in Chapter 12.
Open... ( )
Opens a file which contains all information associated with a particularmolecule (or list of molecules). Displays the molecular structure(s),as well as any graphical surfaces and/or plots which were displayed
Chapter 8
Chapter 8 12/31/03, 8:07 AM119

120
prior to the last save operation. Open... leads to a file browser fromwhich a single molecule (or list of molecules) needs to be selected.
Spartan can read several different types of files. These include severalfile types which are “native” to Spartan.
.spartan Spartan’04 document
.spinput Spartan input (included in .spartan)
.sparchive Spartan archive (included in .spartan)
.spproparc Spartan property archive (included in .spartan)
.sxf Spartan exchange (use with molecule viewers)
.col Spartan collection (use with molecule viewers)
It can also read several “non-native” files containing 3D structureinformation,
.mac MacroModel
.mol SYBYL Mol
.mol2 SYBYL Mol2
.pdb PDB
files containing 2D information (chemical structures),
.sdf MDL SDF
.skc MDL SKC
.tgf MDL TGF
and files containing 1D information.
.smi SMILES
Note that the Cartesian coordinates from any of these files may bereplaced by coordinates generated on the basis of atomic connectivityalone. This is especially useful for “2D” input (structure drawing),where the Z coordinate in the original file may be zero. Coordinatereplacement is accomplished using the Replace Coords. button inthe Molecule Properties dialog (Display menu; see Chapter 14).
Chapter 8 12/31/03, 8:07 AM120

121
In addition, several graphics file formats are supported.
.bmp bitmap
.jpg JPEG
.avi AVI
.png PNG
Except for .spartan files, these are all normally hidden from view,and may be seen by selecting “All Files” under the Files of typemenu at the bottom of the browser.
Close ( )
Closes the selected molecule (or list of molecules to which the selectedmolecule belongs), as well as the spreadsheet and any associatedgraphical surfaces and/or plots and molecule specific dialogs. A promptfor a name is provided if the molecule has not previously been saved.Notification is also provided if a previously-saved molecule has beenaltered and verification requested that any changes are to be saved.
Save
Saves the selected molecule (or list of molecules to which the selectedmolecule belongs) exactly as it appears on screen, that is, rendered interms of a specific structure model and optionally with one or moregraphical surfaces, spectra and/or plots displayed. Opening the moleculewill bring it on screen exactly as it was last saved. If the molecule haspreviously been named, Save does not lead to any further requests orinformative dialogs. Otherwise, Save behaves as Save As... (see below).
Save As... ( )
Saves the selected molecule (or list of molecules to which the selectedmolecule belongs) exactly as it appears on screen, that is, renderedin terms of a specific structure model and optionally with one ormore graphical surfaces, spectra and/or plots displayed under a user-specified name. Files may be either be saved in “native” Spartan’04format (the default) or in any of the formats listed under Open.Selection is made under the Save as type menu in the Save As dialog.
Chapter 8 12/31/03, 8:07 AM121

122
Save As can also be used to create custom databases of molecularstructures, energies and properties, supplementing the SpartanMolecular Database provided with Spartan’04 (see Chapter 15).In this case, the “.spentry” suffix needs to be specified. Full detailsrelating to database preparation are provided in Appendix H.
New Molecule
Brings up the entry model kit and clears the screen. This function isidentical to New, except that the resulting molecule is appended to theend of the list associated with the molecule which is presently selected.*
Delete Molecule
Deletes from a list of molecules the molecule (or molecules) whichis (are) presently selected.
* Examples are provided in the tutorials Dienophiles in Diels-Alder Cycloadditions andHydration of Carbonyl Compounds in Chapter 4, Stereospecific Diels-Alder Reactions inChapter 5, Polyglycine in Chapter 6 and Benzene Chromium Tricarbonyl in Chapter 7.
Chapter 8 12/31/03, 8:07 AM122

123
Append Molecule(s)...
Appends a file which contains all information associated with aparticular molecule (or list of molecules) onto the end of a list ofmolecules associated with the molecule which is presently selected.*
Append Molecule(s)... leads to a file browser from which one ormore molecules (or lists of molecules) needs to be selected.**
Print...
Causes whatever is presently displayed on screen to be printed(according to the specifications made in the Print Setup dialog; seebelow). An output file as well as the contents of a spreadsheet mayalso be printed. To print output, bring up and select an output window(Output under the Display menu) and select Print Output... (whichhas replaced Print...) from the File menu. To print the contents ofthe spreadsheet, bring up and select a spreadsheet (Spreadsheet underthe Display menu) and select Print Spreadsheet... (which hasreplaced Print...) from the File menu.
* An example is provided in the tutorial Carbene Additions to Alkenes in Chapter 5.** Alternatively, molecules may be appended onto existing lists either by copy/paste operations
using the clipboard or by dragging from an external (to Spartan’04) window. Both requirethat the destination list and its associated spreadsheet be open on screen.
Copy a molecule open on screen into the clipboard by first selecting (clicking on) it, andthen selecting Copy from the Edit menu. Alternatively, click on its entry (“molecule name”)in its spreadsheet, and then select Copy from the Edit menu. The latter permits severalmolecules to be selected (and copied) at once using the Shift and Ctrl keys in the usualmanner. (Note, however, that the clipboard holds only a single “copy”, and that anysubsequent copy operation overwrites the first.) Once on the clipboard, the molecule ormolecules may be moved to the destination list by clicking on an empty row header in thespreadsheet (for the destination list), and then selecting Paste from the Edit menu.
Copy a molecule from an external (to Spartan’04) window, by first selecting the molecule,and then dragging it from the external window onto the open spreadsheet (associated withthe destination list) inside of Spartan’04. Several molecules can be selected (and dragged)at once using the Shift and Ctrl keys in the usual manner.
Chapter 8 12/31/03, 8:07 AM123

124
Print Setup...
Results in a dialog specific to the available printer.
Specification usually involves designation of paper size, layout andorientation, in addition to degree of enlargement. Color printers mayrequire additional information.
Exit
Exits Spartan’04, i.e., clears the screen and closes all molecules inthe window. A prompt for a name is provided for each molecule whichhas not previously been saved.
Chapter 8 12/31/03, 8:07 AM124

125
The Edit MenuThis section describes operations under the Edit menu. These providefor “undoing” commands, copying screen images to and from theclipboard, finding text and graphics, centering molecules on screenand clearing the screen of the selected molecule.
Entries under the Edit menu serve a variety of functions.
Undo
This function “undoes” the last operation (only) from the Build menu:Add Fragment, Delete, Make Bond, Break Bond, Minimize. Also,“undoes” Clear from the Edit menu and from Transition States(Search menu). Undo may also be used to undo replacement of amolecule or a set of molecules from the Spartan Molecular Database(see Chapter 15). Otherwise, Undo is unavailable (dehighlighted).
Cut, Copy, Paste
These three functions transfer items to and from the clipboard. Cutmoves the selected item to the clipboard. The selected item is deleted.Copy copies the selected item to the clipboard. The selected item isunaffected. Paste transfers the contents of the clipboard to thedesignated location. The contents of the clipboard are unaffected.Only one snapshot at a time may be placed in the clipboard; selectingCut or Copy again will replace a previous snapshot with a new image.
Chapter 9
Chapter 9 12/31/03, 8:09 AM125

126
There are four important uses of the clipboard within Spartan’04.
(i) Transferring on-screen graphics into other applications suchas Microsoft Word® and PowerPoint®.
(ii) Transferring data from a spreadsheet into other applicationssuch as Microsoft Excel®.
(iii) Temporary storage of a molecular structure for use inmolecule building. This is illustrated in the tutorial VitaminE in Chapter 6.
(iv) Making lists and/or transferring molecules between lists.
Cut and Copy operations for the first three require drawing a “selectionbox”. To do this, first position the cursor slightly above and slightlyto the left of the item to be transferred. Then, while holding downboth buttons, drag the mouse to a location slightly below and slightlyto the right of the item to be transferred. Finally, release both buttons.
Further discussions relating to use of the clipboard in molecule buildingis provided in Chapter 12 and for list operations in Chapter 14.
Find..., Find Next
Find locates a text string defined in the Find dialog if an Outputwindow is selected, or a structure sequence defined on the clipboardif an on-screen model is selected. Find Next locates the nextoccurrence of a text string or a structure sequence.
Center
Centers the selected molecule on screen, i.e., places the center ofgeometry at the center of the screen.
Clear
Clears (deletes) all structures and other information for the selectedmolecule, and brings up a model kit (if one is not already present). Ifthe molecule had previously been saved, no information is actuallyremoved from the file system until the molecule is again saved.
Chapter 9 12/31/03, 8:09 AM126

127
The Model MenuThis section describes structure models available under the Modelmenu: wire, ball-and-wire, tube, ball-and-spoke and space-filling(CPK) models, with or without hydrogens, with or without hydrogenbonds indicated and with or without atom labels, as well as ribbondisplays for polypeptides and polynucleotides, with or without labelsand with or without hydrogen bonds indicated. It also describesfunctions for configuring atom labels to display element name, R/Schirality, mass number, charge or chemical shift, and for specifyingcolor coding and display style for ribbon labels, as well as for turning“on” and “off” a variety of other labels. Finally, it describes functionswhich allow model style to be applied globally (to all members in alist) and for models to be manipulated in concert.
Designation of model display style and model attributes are by wayof the Model menu.
Only one model style Wire, Ball and Wire, Tube, Ball and Spoke,Space Filling or Hide) may be selected. The selected model isdesignated by a “•” in front of its entry in the menu. Global Model,Coupled, Hydrogens, Labels, Ribbons and Hydrogen Bondsoperate as “toggle” switches. A “ ” in front of the entry in the menuindicates that it is turned “on”.
Chapter 10
Chapter 10 12/31/03, 8:10 AM127

128
All of the available structure models, as well as any graphical surfaces,may be displayed either in orthogonal or perspective projections. Thelatter may be valuable in helping to visualize large molecules. Selectionis done in the Miscellaneous Preferences dialog under Preferences...in the Options menu (see Chapter 16). Both structure models andgraphical displays may be presented in 3D stereo. This is also controlledfrom the Miscellaneous Preferences dialog, or from the keyboard (seeKeyboard Functions in Chapter 2).
Wire
This display represents the molecule as a wire model where thevertices represent the atoms.
The bonds are drawn in two colors, one for each of the atoms makingup the bond. Default atom colors are given in Table 10-1. Theseapply globally (to all atoms of given type), and may be changed usingColors under the Options menu (see Chapter 16). Colors ofindividually selected atoms may be set using the Atom Style dialog(under Properties in the Display menu; see Chapter 14). All modelsuse the same color scheme for atoms, and provide for the samemechanism of changing colors globally or individually.
Ball and Wire
This display represents atoms by small balls and bonds by wires.
Ball-and-Wire Model
Wire Model
Chapter 10 12/31/03, 8:10 AM128

129
Scandium-Zinc greenYttrium-Cadnium greenLanthanum-Mercury green
Helium orangeNeon orangeArgon orangeKrypton orangeXenon yellow
main group main group (con’t)
Hydrogen white Bromine orangeLithium tan Rubidium redBeryllium green Strontium redBoron tan Indium tanCarbon gray Tin grayNitrogen blue-gray Antimony tanOxygen red Tellurium tanFluorine green Iodine tanSodium yellowMagnesium blue transition metalsAluminum purpleSilicon grayPhosphorus tanSulfur sky blueChlorine tan noble gasesPotassium redCalcium redGallium orangeGermanium grayArsenic orangeSelenium orange
Table 10-1: Default Atom Colors
Chapter 10 12/31/03, 8:10 AM129

130
Tube Model
The balls are color coded according to atom type, and the wiresrepresenting bonds are drawn in two colors (as in wire models).
Tube
This display is similar to the wire model, except that tubes instead ofwires are used to represent bonds.
Tubes may either be cylinders or be “split” to represent multiple bondsdepending on whether Split Tubes in the Miscellaneous Preferencesdialog (Preferences... under the Options menu; see Chapter 16) is“off” or “on”. As in the wire representations, the bonds are drawn intwo colors.
Ball and Spoke
In this display, atoms are represented by balls (the size and color ofwhich depends on atom type), and bonds by spokes.
Spokes may either be cylinders or be “split” to represent multiple bondsdepending on whether Split Tubes in the Miscellaneous Preferencesdialog (Preferences... under the Options menu; see Chapter 16) is“off” or “on”. Bond (spoke) color is gray by default but it may bechanged using Colors under the Options menu (see Chapter 16).Colors of individually selected bonds may be set using the Bond Styledialog (under Properties in the Display menu; see Chapter 14).
Ball-and-Spoke Model
Chapter 10 12/31/03, 8:10 AM130

131
Space Filling
This represents the molecule as a composite of spheres, the size andcolor of which depend on the atom type. Also known as CPK models,space-filling models portray overall molecular size, the sphere radiibeing chosen as approximating van der Waals contact distances. Theseradii may be changed in the VDW Radii Preferences dialog underPreferences... in the Options menu (see Chapter 16).
The volume and surface area displayed in the Molecule Propertiesdialog (available under Properties in the Display menu; see Chapter14) correspond to a space-filling model.
Hide
This removes the structure model from the screen where its displaymay lead to unnecessary crowding, e.g., proteins. A model may berestored by selecting it from the Model menu. Caution: Hide mayresult in “loss of a molecule”. It can be “recovered” using the Page Upor Page Down keys (see Keyboard Functions in Chapter 2) until itsname appears in the window title bar, followed by switching on a model.
Spartan’04 allows different parts of a molecule to be rendered in termsof different model styles and colors. This is useful as a means to focusattention on specific “interesting” regions while drawing attention awayfrom “less-interesting” regions. Regions may be individual atoms and/or bonds or any collection of atoms and/or bonds connected or not. Theyare selected in the usual manner, either by clicking on an individual atomor bond or, with the aid of the Shift, Ctrl and Alt keys, by clicking on aset of atoms and/or bonds, or by defining a selection box. Discussion hasalready been provided in Chapter 2.
Space-Filling Model
Chapter 10 12/31/03, 8:10 AM131

132
Once a region has been defined, control of model style and color is by wayof the “Selected” Style dialog under Properties in the Display menu.This is described in Chapter 14, and an example is provided in the tutorialPropamidine DNA Complex in Chapter 6.
Global Model
If checked, this signifies that all molecules in a list will share attributes.These include presentation of hydrogens, atom and other labels,hydrogen bonds and ribbon displays. Global model style is controlledfrom the Molecule Preferences dialog (Preferences... under theOptions menu; Chapter 16) Global Model acts in a toggle manner,i.e., repeated selection switches between “global” and “local” display.
Coupled
If checked, this signifies that all molecules in a list selected forsimultaneous display will be moved together. Coupled is turned “on”following molecule alignment (see Align Molecules under theGeometry menu; Chapter 11). Coupled acts in a toggle manner,i.e., repeated selection couples and decouples the molecules.
Hydrogens
If checked, this signifies that hydrogens are to be included in themodel. Hydrogen removal is useful to simplify the displays of largemolecules e.g., polypeptides. Note that some structures, e.g., fromthe Cambridge Structural Database or from PDB files, may lackhydrogens. These then need to be “grown” before they can bedisplayed (see discussion under Molecule Properties in Chapter14). Hydrogens acts in a toggle manner, i.e., repeated selection turns“on” and “off” the display of hydrogens.
Labels
If checked, this signifies that labels associated with atoms, ribbonsand bonds as well as with other attributes (points, planes, constraintsand frozen markers) specified in Configure... (see below) are to bedisplayed in the model. Labels acts in a toggle manner, i.e., repeated
Chapter 10 12/31/03, 8:10 AM132

133
selection turns “on” and “off” display of labels. Labels isautomatically turned “on” following selection of Apply or OK in theConfigure dialog (see below).
Ribbons
If checked, this signifies that ribbons are to be displayed along withthe selected model. (If only ribbons are desired, e.g., in proteins,select Hide for the model.) Ribbons acts in a toggle manner, i.e.,repeated selection turns “on” and “off” display of ribbons.
Hydrogen Bonds
If checked, this signifies that hydrogen bonds are to be drawn as partof the model. Hydrogen bonds are defined as non-bonded contactsbetween a nitrogen, oxygen, phosphorous or sulfur and a hydrogenattached to nitrogen, oxygen, phosphorous or sulfur separated by adistance ranging from 1.6 to 2.1Å and making an X–H--Y (X,Y = N,O, P, S) angle of >120°. Hydrogen Bonds acts in a toggle manner,i.e., repeated selection turns “on” and “off” display of hydrogen bonds.
Configure...
This selects the types of labels attached to atoms and ribbons, as wellas turns “on” and “off” labels on bonds, points, planes and constraintmarkers. (Atom and ribbon labels are turned “on” and “off” usingLabels and Ribbons controls, respectively; see above.) Upon initialentry, the Configure Labels dialog will appear.
Chapter 10 12/31/03, 8:10 AM133

134
Atom labels may be selected from among the following (only oneselection is allowed): Labels (the default, a unique element/numbercombination, may be changed; see Atom Properties in Chapter 14),Element, Mass Number, R/S (chirality), Mulliken Charge,Electrostatic Charge, Natural Charge, Chem Shift, orStrand:Residue:Label (polypeptides and polynucleotides).
Check boxes allow turning “on” Bond Labels, Point Labels, PlaneLabels, Constraint Labels and Residue Labels.
Clicking on the Ribbons tab leads to the Configure Ribbons dialog.
Ribbon coloring may be selected from among the following (only oneselection is allowed): Monochrome, By Secondary Structure, ByStrand or By Residue. Ribbon style may be selected from among thefollowing (only one selection is allowed): Ribbons, Beads or Lines.
The dialog is removed from the screen with all selections maintainedby clicking on OK. Clicking on Cancel or on removes the dialogbut selections are lost. Clicking on Apply maintains the selectionsand leaves the dialog on screen. Note, that Labels (from the Modelmenu) will be turned “on” following either clicking on OK or on Apply.
Chapter 10 12/31/03, 8:10 AM134

135
The Geometry MenuThis section describes functions available under the Geometry menu.These provide information about geometrical parameters (bondlengths, angles and dihedral angles), as well as provision for definingpoints and planes, for setting geometrical constraints, for freezingatomic centers, for altering default bond and ring assignments andintroducing NOEs in conformational searching and for aligningmolecules in a list.
Information about the geometry of the selected molecule, as well asprovision for setting geometrical parameters, is available under theGeometry menu. Functions under this menu also provide for definingpoints and planes, for setting up geometrical constraints, for alteringdefault bond and ring assignments for conformational searching aswell as incorporating NOE data, and for aligning molecules in a list.
All functions under the Geometry menu require selection of one ormore atoms, points, or bonds, or a previously-defined constraint. Thisis accomplished by clicking on the atom or bond or constraint. Asatoms are selected, each will be identified by a small gold sphere. Asbonds are selected, the two atoms connected by the bond will beidentified by small gold spheres. Selection of a distance constraint
Chapter 11
Chapter 11 12/31/03, 8:13 AM135

136
results in two atoms being identified by gold spheres, an angleconstraint in three atoms identified, and a dihedral constraint in fouratoms being identified.
Measure Distance ( )
This obtains and displays the distance (in Ångstroms) between twoatoms, whether or not they are bonded, or the length of a bond (inÅngstroms). Selection results in a message at the bottom left of thescreen.
Clicking on two atoms (points) displays the distance.
Alternatively, clicking on a bond or on a distance constraint displaysthe bond or constraint length.
Measure Distance may also be used for distances involving user-defined points (see Define Point in this chapter) and/or user-definedplanes (see Define Plane in this chapter). In addition, it may be usedto alter the distance between atoms (as long as both atoms are notincorporated into the same ring), by altering the contents of the boxto the right of Distance (A,B) = or Length (A)=, and then pressingthe Enter key. The distance (length) may be entered into thespreadsheet by clicking on to the right of its display.
Note that the altered distance will not be maintained duringoptimization. If this is what is desired, Constrain Distance shouldbe used (see discussion following).
Measure Angle ( )
This obtains and displays the angle (in degrees) involving three atoms,or two connected bonds or a constraint. Selection results in a messageat the bottom left of the screen.
Chapter 11 12/31/03, 8:13 AM136

137
Clicking on three atoms, or on two adjacent bonds, or on an angleconstraint, displays the angle at the bottom right of the screen.
Measure Angle may also be used for angles involving user-definedpoints (see Define Point in this chapter) and/or user-defined planes(see Define Plane in this chapter). In addition, it may be used to alteran angle. This applies only where all three atoms are contiguous andare not incorporated into the same ring. The angle may be changedby altering the contents of the box to the right of Angle (A,B,C) =,and then pressing the Enter key. The angle may be entered into thespreadsheet by clicking on to its right.
Note that the altered angle will not be maintained duringoptimization. If this is what is desired, Constrain Angle shouldbe used (see discussion following).
Measure Dihedral ( )
This obtains and displays the dihedral angle (in degrees) involvingfour atoms, three connected bonds or a dihedral constraint. Note thatthe dihedral angle is defined as the angle between the plane made bythe first three atoms (or the first two bonds) specified, and the planemade by the last three atoms (or the second two bonds) specified.Selection results in a message below the menu bar at the bottom leftof the screen.
Clicking on four atoms, or on three adjacent bonds, or on a constraint,displays the dihedral angle at the bottom right of the screen.
Measure Dihedral may also be used for dihedral angles involvinguser-defined points (see Define Point in this chapter) and/or user-defined planes (see Define Plane in this chapter). In addition, it maybe used to alter a dihedral angle. This applies only where no morethan two atoms are incorporated into a single ring. The dihedral anglemay be changed by altering the value inside the box to the right of
Chapter 11 12/31/03, 8:13 AM137

138
Dihedral (A,B,C,D) = , and then pressing the Enter key. The dihedralangle may be entered into the spreadsheet by clicking on to its right.
Note that the altered dihedral angle will not be maintained duringoptimization. If this is what is desired, Constrain Dihedral shouldbe used (see discussion following).
Freeze Center ( )
This allows “freezing” of one or more atoms during structureminimization (in build mode) or (optionally) during equilibrium ortransition-state geometry optimization, or during a conformationalsearch, or generation of an energy profile using methods under theCalculations dialog. Freezing inside the Calculations dialog needsto be explicitly indicated (see Chapter 13).
Atom freezing is especially useful in a number of situations, amongthem “guessing” transition-state geometries for reactions which areclosely related to those for which transition states are already available.For example, a good guess at the transition state for pyrolysis ofcyclohexyl formate might be obtained by modifying the transitionstate for pyrolysis of ethyl formate, freezing all but the modifiedsections (designated in bold in the figure below) and then minimizing.*
H2C CH2
H
OC
O
HC CH
H
OC
O
H2C
H2C CH2
CH2
HC CH
H
OC
O
H2C
H2C CH2
CH2
H H H
modify
structure
freeze minimize
transition structure for ethyl formate
approximate transition structure for cyclohexyl formate
Selection of Freeze Center leads to a message at the bottom left ofthe screen.
Clicking on an atom, or on a free valence**, “freezes” it; clickingagain “thaws” the atom (or free valence). Buttons at the bottom right
* An example of this is presented in the tutorial Carbene Additions to Alkenes in Chapter 5.** The bond distance in this case is that appropriate for hydrogen being added to the free valence.
Chapter 11 12/31/03, 8:13 AM138

139
of the screen allow for freezing all atoms (Freeze All), freezing allheavy (non-hydrogen) atoms (Freeze Heavy) and for thawing allatoms (Thaw All).
Another important use of frozen atoms is in conjunction with data resultingfrom a search of the Cambridge Structural Database (see Databases underthe Search menu; Chapter 15). Hydrogen positions are more often thannot poorly located in X-ray structures, and X–H bond lengths arecommonly as much as 0.1 to 0.2Å shorter than they should be. Structuresincorporating such bond lengths are clearly inappropriate for energy andproperty calculations and may also be problematic as starting geometriesin quantum chemical calculations. One solution is to “freeze” all heavy(non-hydrogen) atoms (Freeze Heavy) and then to carry out molecularmechanics minimization using either Minimize from the Build menu(see discussion in Chapter 12) or from the Calculations dialog underthe Setup menu (see discussion in Chapter 13).
Frozen atoms are indicated by magenta colored markers ( ). Whetheror not these are included with the model (outside of “Freeze Center”mode) for an individual molecule is controlled from the MoleculeUtilities dialog available under the Display menu (see Chapter 14).Global settings are controlled from the Molecule Preferences dialogunder Preferences... in the Options menu (see Chapter 16).
Set Torsions ( )
Spartan’04 automatically identifies bonds and rings forconformational searching and specifies default step sizes. SetTorsions allows these defaults to be altered. Selection results inflexible bonds each being marked by a gold cylinder, and flexiblerings each being marked by a gold circle around one or more atoms,and a message appears at the bottom left of the screen.
Clicking on a bond or an atom contained in a ring selects it for rotation.In the case of a ring, “rotation” means that the atom is to be “puckered-up” and “puckered-down” (restricted rotation). The default rotationis provided in a box to the right of Fold at the bottom right of thescreen. This is typically 2 or 3 for a single bond (step size of 180°
Chapter 11 12/31/03, 8:13 AM139
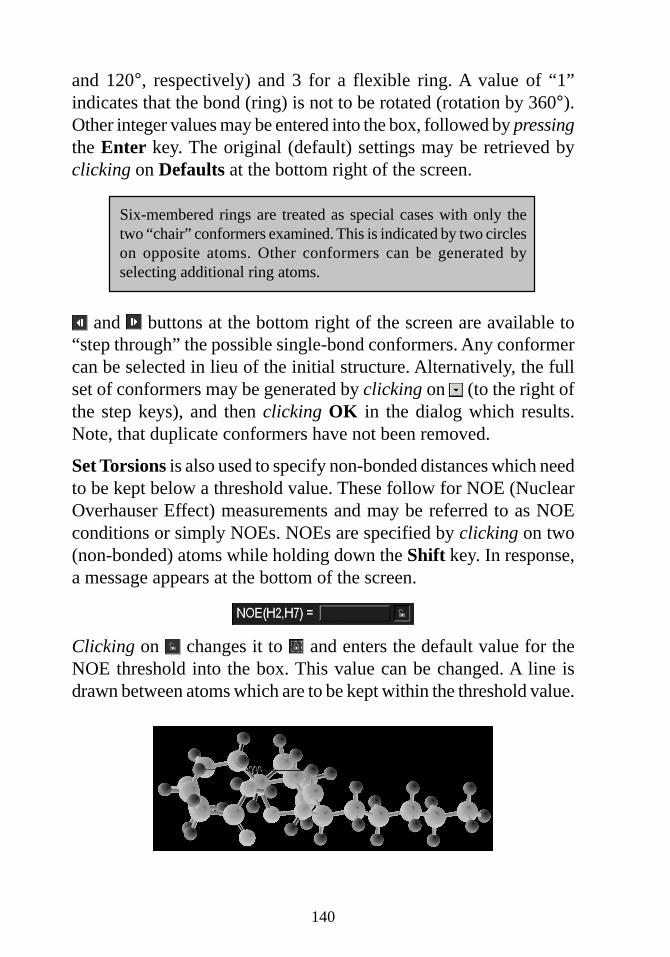
140
and 120°, respectively) and 3 for a flexible ring. A value of “1”indicates that the bond (ring) is not to be rotated (rotation by 360°).Other integer values may be entered into the box, followed by pressingthe Enter key. The original (default) settings may be retrieved byclicking on Defaults at the bottom right of the screen.
Six-membered rings are treated as special cases with only thetwo “chair” conformers examined. This is indicated by two circleson opposite atoms. Other conformers can be generated byselecting additional ring atoms.
and buttons at the bottom right of the screen are available to“step through” the possible single-bond conformers. Any conformercan be selected in lieu of the initial structure. Alternatively, the fullset of conformers may be generated by clicking on (to the right ofthe step keys), and then clicking OK in the dialog which results.Note, that duplicate conformers have not been removed.
Set Torsions is also used to specify non-bonded distances which needto be kept below a threshold value. These follow for NOE (NuclearOverhauser Effect) measurements and may be referred to as NOEconditions or simply NOEs. NOEs are specified by clicking on two(non-bonded) atoms while holding down the Shift key. In response,a message appears at the bottom of the screen.
Clicking on changes it to and enters the default value for theNOE threshold into the box. This value can be changed. A line isdrawn between atoms which are to be kept within the threshold value.
Chapter 11 12/31/03, 8:13 AM140

141
Once set, NOEs are used in conformational searching without furtheruser intervention.
Constrain Distance ( )
Constrain Angle ( )
Constrain Dihedral ( )
These allow introduction of one or more geometrical constraintsduring structure minimization (in “build mode”), and (optionally)during equilibrium or transition-state geometry optimization usingany of the available methods under the Calculations dialog (Chapter13). The introduction of constraints is useful in a number of situations:
(i) constructing conformational energy profiles where one or moredihedral angles need to be fixed while other geometricalvariables are optimized,
(ii) optimizing molecular structures where the values of certainkey parameters are known, for example, optimizing thegeometry of a molecule with an intramolecular hydrogen bondor a disulfide linkage, and
(iii) building molecules with “unusual” geometrical parameters,e.g., very long bonds, as for example required in theconstruction of transition states* and intermolecular complexes.
Selecting Constrain Distance results in a message at the bottom leftof the screen.
Clicking on two atoms, or a bond results in a message at the bottomright of the screen.
Clicking on changes it to and shows the current distance.
* An example of this is provided in the tutorial Ziegler-Natta Polymerization of Ethylene inChapter 7.
Chapter 11 12/31/03, 8:13 AM141

142
This (constraint) distance can now be changed by altering the contentsof the box and then pressing the Enter key. Alternatively, the existingdistance may be used as the constraint distance. If the selected distancehad previously been constrained, the icon would have been initiallydisplayed. In this case, clicking on turns “off” the constraint andreturns the icon to the . Finally, the value of the constraint, whichmay be different from the value of the current distance, may be enteredinto the spreadsheet by clicking on to its right.
This sequence of operations (bond identification followed by turning“on” and “off” the constraint) can be repeated as many times asnecessary. Any bonds or non-bonded distances on which constraintsare to be imposed are indicated by magenta colored markers. Anyconstraints introduced are automatically enforced only upon energyminimization in build mode ( ), but are optional using methods underthe Calculations dialog (Chapter 13).
Angle and dihedral angle constraints are handled in a similar manner.Note that points and planes may not be used to define constraints.
Constraints may also be modified as well as posted to the spreadsheetfrom the Constraint Properties dialog (available under Propertiesin the Display menu; see Chapter 14). In addition, a sequence ofconstraints may be defined (from some initial value to some finalvalue in a given number of steps). This allows generation of an energyprofile along a predefined set of coordinates* (see Calculations inChapter 13).
Whether or not constraint markers are included with the model (outsideof “Constraint Distance, etc. mode”) for an individual molecule iscontrolled from the Molecule Utilities dialog available under theDisplay menu (see Chapter 14). Global settings are controlled fromthe Molecule Preferences dialog (Preferences... under the Optionsmenu; see Chapter 16).
* Examples of this are provided in the tutorial Internal Rotation in Dimethylperoxide inChapter 5, and the tutorials Thermodynamic vs. Kinetic Control and SN2 Reaction of Bromideand Methyl Chloride in Chapter 6.
Chapter 11 12/31/03, 8:13 AM142

143
Define Point, Define Ligand Point ( )
This defines a point as the geometric (unweighted) center of selectedatoms (or points) previously defined. Selection results in display of amessage at the bottom left of the screen.
Clicking on atoms (or points) in any order, and clicking a secondtime on any one of the atoms (or points) defines a point (small sphere).As many points as desired can be defined and these are treated as anyother “atom” in defining distances, angles, etc. Points “move” withthe molecule as its geometry is altered.
Selecting Define Point (or clicking on ) while holding down onthe Shift key, followed by clicking on the appropriate atoms, leads toa “ligand point”. This shares all the characteristics of a “normal”point, but may also be used to bond to atomic fragments, functionalgroups, etc. See Make Bond under the Build menu (Chapter 12)for a discussion.
Delete from the Build menu ( ) or the Delete key may beused to remove a point or ligand point.
Whether or not points are included with the model for an individualmolecule is controlled from the Molecule Utilities dialog availableunder the Display menu (see Chapter 14). Global settings arecontrolled from the Molecule Preferences dialog (Preferences...under the Options menu; see Chapter 16).
Define Plane ( )
This defines and displays a reference plane. Selection results in displayof a message at the bottom left of the screen.
Clicking on three atoms or points defines a plane. As many planes asdesired may be defined, and these may be used in defining distances,angles, etc. Planes “move” with the molecule as its geometry changes.
Chapter 11 12/31/03, 8:13 AM143

144
Delete from the Build menu ( ) or the Delete key may beused to remove a point.
Whether or not planes are included with the model for an individualmolecule is controlled from the Molecule Utilities dialog availableunder the Display menu (see Chapter 14). Global settings arecontrolled from the Molecule Preferences (Preferences... under theOptions menu; see Chapter 16).
Align Molecules ( )
This allows for alignment of molecules in a list by best matching thecoordinates (and optionally atom type) of selected atoms. Selectionresults in a message at the bottom left of the screen.
Atoms may be selected by clicking on them, at which time they aremarked by a red circle. Clicking a second time also selects the atom(marking them with two concentric circles) but instructs the alignmentprocedure to ignore the atom type (atomic number). Clicking a thirdtime deselects (and unmarks) the atom. Selected atoms are markedby a single red circle if atom type is to be considered, and by twoconcentric red circles if atom type is to be ignored. At least three(non-colinear) atoms need to be selected for alignment to bemeaningful, and it is recommended that no more than five atoms beselected. Following selection of atoms, clicking on the Align buttonat the bottom right of the screen aligns the molecules. Note that atomselection is not lost, and molecules can be “realigned” by againselecting Align Molecules and clicking on Align.
Note that the motions of different molecules in a list are automaticallycoupled following molecule alignment. They can be decoupled byselecting Coupled from the Model menu (see Chapter 10).
Chapter 11 12/31/03, 8:13 AM144

145
The Build MenuThis section describes functions available under the Build menu.These include model kits and associated tools for building organic,inorganic and organometallic molecules as well as polypeptides andpolynucleotides, in addition to a molecular mechanics procedure forpreliminary structure refinement.
Functions required for building and refining molecules are collectedunder the Build menu.
Selection of Add Fragment results in display of one of four modelkits: an entry model kit for most organic molecules, an expert modelkit for organic molecules not easily represented in terms of classicalvalence structures, as well as inorganic and organometallic molecules,and specialized model kits for polypeptides and polynucleotides. Theentry and expert model kits utilize “atomic fragments”, functionalgroups and rings (and ligands in the expert model kit), while thepeptide model kit uses the set of natural amino acids as buildingblocks, and the nucleotide model kit the set of nucleotide bases. Onceselected, a model kit remains on screen until View is selected.
Molecule construction in all four model kits proceeds much in thesame manner as a chemist would assemble a structure from a modelkit, i.e., pieces are taken from the “kit” one at a time and addedsequentially to the molecule under construction.
Chapter 12
Chapter 12 12/31/03, 8:14 AM145

146
Entry Model Kit
Spartan’04’s entry model kit contains a suite of molecule building/editing tools specifically designed to construct most organic molecules.
In the center of the model kit are a selection of “atomic fragments”displayed as icons.
From left to right and then top to bottom, these correspond to:
C(sp3) N(sp3) P(sp3) HC(sp2) N(sp2) O(sp3) FC(sp) N(sp) O(sp2) ClC(aromatic) N(aromatic) S(sp3) BrSi(sp3) N(planar) S(sp2) I
Chapter 12 12/31/03, 8:14 AM146

147
An “atomic fragment” is chosen by clicking on its icon, followingwhich this icon is displayed at the top of the dialog. Once selected, theatomic fragment can be used to initiate building, to add alongside ofan existing structure or appended onto an existing molecular fragment.To initiate building, click anywhere on screen. To add alongside of anexisting structure, first click on Insert at the bottom right of the screen(or press the Insert key), and then click anywhere on screen. To bondto an existing fragment, click on a free valence. Selection of bondtype, i.e., single, double, triple or aromatic, in the case of atomicfragments with multiple bond types, e.g., sp2 carbon, occursautomatically depending on the nature of the free valence selected.
Three menus inside the entry model kit provide access to a numberof pre-built fragments corresponding to common functional groups(Groups) and rings (Rings), and to additional libraries of functionalgroups, rings and ligands (as well as any user-defined structures)stored in the file system (Custom). The entry model kit also hasaccess to the clipboard (Clipboard).
(i) GroupsClicking on Groups brings up a menu of availablefunctional groups, and results in an icon of onegroup from this menu being displayed at the top of themodel kit.
A different group may be selected from the menu (itsicon will be displayed). Once selected, a functional groupmay then be used to initiate building by clicking anywhereon screen, to add alongside of an existing structure onscreen by clicking on Insert at the bottom right of thescreen (or pressing the Insert key), and then clicking
Chapter 12 12/31/03, 8:14 AM147

148
anywhere on screen, or to add to an existing structure byclicking on the appropriate free valence.
The amide and carboxylic acid groups have two differenttypes of atoms with free valences. The amide groupactually has three different free valences, one on carbonand two on nitrogen. The free valence which will beused to connect these groups to a molecule underconstruction is marked with a “•” (in the icon). Themarked position circulates among the possible positionswith repeated clicking on the icon.
C N
O
•
C N
O •
C N
O
•
C
O
• OC
O
O•
click
click
click
click
Additional functional groups are found in a libraryaccessible from Custom (see discussion following).
(ii) RingsClicking on Rings brings up a menu of available rings,and results in an icon of one ring from this menu beingdisplayed at the top of the model kit.
A different ring may be selected from the menu (and itsicon displayed). Once selected, a ring may then be usedto initiate building by clicking anywhere on screen, to
Chapter 12 12/31/03, 8:14 AM148

149
add alongside of an existing structure on screen byclicking on Insert at the bottom right of the screen (orpressing the Insert key), and then clicking anywhereon screen, or to add to an existing structure by clickingon the appropriate free valence.
Cyclohexane, napthalene, anthracene and phenanthrenerings have more than one kind of free valence. The freevalence which is used to connect these rings to themolecule under construction is marked with a “•” (inthe icon). As with groups, the marked position circulatesamong the available positions with repeated clicking onthe icon. Selection of an axial or equatorial free valencein the cyclohexane ring is indicated by the label “ax” or“eq” appearing alongside the icon.
••
••
•
• •
clickeq
click
ax
click
click
click
click
click
•
•
•
•
•
click click
clickclick
click
Note that all rings in this menu are hydrocarbons.Heteroatoms may be substituted using the atom
Chapter 12 12/31/03, 8:14 AM149

150
replacement feature available in conjunction with theentry and expert model kits (see discussion of GeneralMolecule Building Functionality following).
Additional rings are found in a library accessible fromCustom (see discussion following).
(iii) CustomCustom is used to select any molecule or molecularfragment which has been previously saved inSpartan’04’s file system for use in molecule building.To access the file system, click on the rightmost downarrow key to the right of the Custom menu. This givesrise to the usual file browser. Select (click on) an entryand click on Open (or double click on the entry). Theselected molecule is identified by its name (or by“M001”, etc. if no name has previously been supplied)in the menu immediately to the right of Custom. Selectit and a ball-and-wire model will appear at the top ofthe model kit. This may be manipulated (rotated,translated, zoomed) using the usual mouse/keyboardcommands (you need to position the cursor inside thebox containing the model). Once selected, the moleculeor molecular fragment may be used to initiate buildingby clicking anywhere on screen, to add alongside of anexisting structure by clicking on Insert at the bottomright of the screen (or pressing the Insert key), and thenclicking anywhere on screen, or to add to an existingstructure by clicking on the appropriate free valence. Inthe latter case, the attachment point (on the molecule inthe clipboard) needs to be identified by clicking on theappropriate free valence.
Only one entry from the file system is allowed, andselection of a new entry will overwrite the previous entry.However, in the event that the selected entry is a list ofmolecules, each of the individual members (as identifiedby their names or by “M001”, “M002”, etc.), may be
Chapter 12 12/31/03, 8:14 AM150

151
selected in turn (by selecting different entries from themenu to the right of Custom).
Upon installation, Spartan’04 is setup for Custom topoint to a directory “Program Files/Wavefunction/Spartan04vXYZ/Library”. This contains (among otherthings) a selection of “rings” and “ligands”.
(iv) ClipboardClicking on Clipboard accesses the clipboard (see Cutand Copy under the Edit menu in Chapter 9 fordiscussion of adding to the clipboard). A ball-and-wiremodel of whatever is on the clipboard is displayed atthe top of the model kit. This may be manipulated usingthe usual mouse/keyboard commands (you need toposition the cursor inside the box containing the model).Once selected, the molecule or molecular fragment maybe used to initiate building by clicking anywhere onscreen, to add alongside of an existing structure byclicking on Insert at the bottom right of the screen (orpressing the Insert key), and then clicking anywhereon screen, or to add to an existing structure by clickingon the appropriate free valence. In the latter case, theattachment point needs to be identified by clicking onthe appropriate free valence in the clipboard.
An “empty” clipboard will be signaled by:
Expert Model Kit
Spartan’04’s expert model kit allows construction of a much widerclass of molecules (including inorganic and organometallic species)than permitted using the entry model kit. Structures which violateconventional bonding rules may also be constructed, as this model kitpurposefully provides no checking. The expert model kit is reachedby clicking on the tab marked Expert which is located at the top of theentry (or peptide or nucleotide) model kit. (Return to the entry, peptide
Chapter 12 12/31/03, 8:14 AM151

152
or nucleotides model kit is accomplished by clicking on the Entry,Peptide or Nucleotide tab, respectively, in the expert model kit).
At the top of the model kit is a Periodic Table covering the first fourrows of main-group elements, and all three rows of transition metals.*
Main-group elements appear at the top and transition metals at thebottom.
If Element Overlay (Miscellaneous Preferences dialog underPreferences... in the Options menu; see Chapter 16) is checked,elements which are available for the selected level of calculation(Calculations dialog under the Setup menu; see Chapter 13) willbe highlighted. Immediately below is a selection of atomic hybrids.
* The remaining elements may be specified using the Atom Properties dialog under theDisplay menu (see Chapter 14) although computational models may not be available.
Chapter 12 12/31/03, 8:14 AM152

153
Following this, is a selection of bond types.
Further down the model kit below the buttons marked Groups, Ringsand Ligands (the first two of which are the same as found in the entrymodel kit).
Selection of atom type is effected by clicking on the appropriateelement in the Periodic Table. The entry will be highlighted.
Selection of an atomic hybrid follows by clicking on the appropriateicon which will then be highlighted. Once fully specified, the “atom”(atom type + atomic hybrid) can be used to initiate building, to addalongside of an existing structure or to append onto an existingmolecular fragment. To initiate building, click anywhere on screen.To add alongside of an existing structure, first click on Insert at thebottom right of the screen (or press the Insert key), and then clickanywhere on screen. To bond to an existing fragment, click on theappropriate free valence.
Two of the hybrids (trigonal bipyramidal and square-based pyramidal)may bond either axially or equatorially. Selection of the appropriatebonding point, marked by a “•”, is effected by repeatedly clicking onthe icon; the bonding point alternates between the two sites.
• Xclick
X
•
X
•
X•click
click
click
All atoms are initially connected with single linkages. Bond types(partial single, single, aromatic, double, triple or quadruple) may bechanged by first selecting the appropriate bond type from thoseavailable, then clicking on the bond to be changed, and then clickingagain to institute the change, i.e., double clicking on the bond. Bondtypes have no impact on quantum chemical calculations, but do affectmolecular mechanics calculations (including structure minimizationin the builder; see discussion following).
Chapter 12 12/31/03, 8:14 AM153

154
Unlike the entry model kit, no valence checking is performed in theexpert model kit. The user is free to construct any arrangement ofatoms. Note, that molecular mechanics parameters may be poor, and“unreasonable” minimized geometries may result.
Three fragment collections are located inside the expert model kit:
(i) GroupsThis contains the same groups as in the entry model kit.
(ii) RingsThis contains the same rings as in the entry model kit.
(iii) LigandsThis provides access to a number of pre-built ligands, usefulin the construction of inorganic and organometallic molecules.Its operation is analogous to that for the Groups and Ringsmenus. Clicking on Ligands brings up a menu of availableligands, and results in an icon of one ligand from this menubeing displayed at the top of the model kit.
A different ligand may be selected from the menu (and its icondisplayed), and then used to initiate building by clicking anywhere onscreen, to add alongside an existing structure on screen, by clickingon Insert at the bottom right of the screen (or pressing the Insertkey), followed by clicking anywhere on screen, or may be added to anexisting structure by clicking on the appropriate free valence.
Additional ligands are found in a library accessible from Custom inthe entry model kit. Ligands may also be built with the help of DefinePoint under the Geometry menu (Chapter 11).
Chapter 12 12/31/03, 8:14 AM154

155
Peptide Model Kit
Spartan’04 provides a model kit for construction of polypeptides. It isreached by clicking on the tab marked Peptide which is located at thetop of the entry, expert and nucleotide model kits. (Return to the entry,expert or nucleotide model kit is accomplished by clicking on the Entry,Expert or Nucleotide tab, respectively, in the peptide model kit.)
At the middle of the peptide model kit are icons designating the aminoacids (specified by their usual three-letter codes).
An amino acid is selected by clicking on its three-letter code, followingwhich either an icon of the amino acid is displayed in the box at thetop of the model kit, or the three-letter code for the amino acid isappended to the sequence of codes in the box. Amino acids replace“atoms”, functional groups, rings and ligands as the building blocksin the peptide model kit. Because these other building blocks aremissing, modifications of peptides, aside from modifications insequence and in overall conformation, need to be carried out usingthe entry or expert model kits.
Chapter 12 12/31/03, 8:14 AM155

156
There are two different modes of operation: single amino acid modeand polypeptide mode. The former is used to initiate building with asingle amino acid, to add a single amino acid alongside of an existingstructure or to add a single amino acid to an existing structure, whilethe latter is used to construct amino acid sequences (polypeptides).Sequence “off” (unchecked) corresponds to single amino acid mode,and “on” (checked) corresponds to polypeptide mode.
Peptide construction (Sequence “on”) is accomplished in three steps:
(i) Specification of an amino acid sequence. This isaccomplished by clicking in the desired order on theamino acid codes. Building occurs from the “N” end tothe “C” end of the peptide. In response to each selection,the three-letter code is appended to the sequence of codesin the box at the top of the model kit. The stereochemicalconfiguration of the amino acid is by default the lconfiguration; this can be changed to the d configurationprior to selection of the amino acid, by checking d to theright of “stereoisomer” in the model kit. (It can bechanged back to l by checking l). d amino acids areindicated by “.d” following the code in the box.
The sequence can be altered by changing the text in thebox. Existing amino acid codes can be deleted orchanged or new codes can be added. The entire sequencecan be specified in this way if desired. Specification ofa non-existent code will result in an error message. Thesequence can be cleared by clicking on Clear.
(ii) Specification of macroscopic structure. Once sequencingis complete, macroscopic structure (ψ and φ angles), isspecified by clicking on one of α α α α α Helix, β β β β β Sheet orOther. In the case of the first two, preset angle valuesare displayed on the right. In the case of specification ofOther, boxes appear, into which the desired dihedralangles need to be entered.
Chapter 12 12/31/03, 8:14 AM156

157
(iii) Termination. The peptide is not yet terminated, and thetwo ends are still set up for addition of further aminoacids, i.e.,
O
C
*
C end
N
H
*
N end
where the “*” indicates a free valence. Clicking onTerminate at the bottom of the model kit leads to theTerminate dialog.
C and N terminating groups may be selected by repeatedclicking on the C and N icons, respectively. Selectionwill rotate among the available terminating groups.Clicking on OK removes the dialog and terminates thepolypeptide. Clicking on Cancel or on removes thedialog but does not terminate the polypeptide.
The peptide (or single amino acid) may now be used either to initiatebuilding, by clicking anywhere on screen or added alongside of anexisting structure, by first clicking on Insert at the bottom right ofthe screen (or pressing the Insert key), followed by clicking anywhereon screen. If unterminated, it may also be joined onto an existingstructure by clicking on a free valence. In the latter case, attachmentis made from the “N end”, unless the free valence corresponds to an“unterminated” peptide fragment, in which case the appropriate endrequired to make an amide bond is used.
Chapter 12 12/31/03, 8:14 AM157

158
Nucleotide Model Kit
Finally, Spartan’04 provides a model kit for construction ofpolynucleotides. It is reached by clicking on the tab marked Nucleotidewhich is located at the top of the entry, expert and peptide modelkits. (Return to the entry, expert or peptide model kit is accomplishedby clicking on the Entry, Expert or Peptide tab, respectively, in thenucleotide model kit.)
At the middle of the model kit is a menu designating the type ofpolynucleotide.
DNADNA (single strand)DNA-RNARNARNA (double strand)RNA-DNA
Immediately below this menu are icons, designating the nucleotidebases. Selection of DNA, DNA (single strand) or DNA-RNA fromthe menu leads to one set of icons.
Chapter 12 12/31/03, 8:14 AM158

159
Selection of RNA, RNA (double strand) or RNA-DNA leads to asecond set, the only difference is that uracil (U) has been substitutedfor thymine (T).
A nucleotide base is selected by clicking on its letter, following whicheither an icon of the base is displayed in the box at the top of themodel kit, or the letter for the base is appended to the sequence ofletters in the box. Nucleotide bases replace “atoms”, functional groups,rings and ligands as the building blocks in the nucleotide model kit.Because these other building blocks are missing, modifications ofnucleotides, aside from modifications in sequence and helical structure,need to be carried out using either the entry or expert model kits.
There are two different modes of operation: single base mode andpolynucleotide mode. The former is used to place a single base or basepair on screen, to add a single base or base pair alongside of an existingstructure, or to add a single base or base pair to an existing structure,while the latter is used to construct strands of DNA or RNA (or mixedstrands). Sequence “off” (unchecked) corresponds to single base (basepair) mode and “on” (checked) corresponds to polynucleotide mode.
Polynucleotide construction (Sequence “on”) is accomplished in twosteps:
i) Specification of base sequence. This is accomplished byclicking in order on the base codes. In response to eachselection, the letter code is appended to the sequence of codesin the box at the top of the model kit. The sequence can bealtered by editing the contents of the box. Existing base codescan be deleted or changed or new codes added. The entiresequence can be specified in this way if desired. The sequencecan be cleared, by clicking on Clear.
ii) Specification of helical structure. Once sequencing is complete,a helical structure may be specified by clicking on A, B or Z.These correspond to “standard” A, B and Z helices, respectively.Selecting Other allows user modification of the rise (in Å) perbase (Rise/Base) and twist (in degrees) per base (Twist/Base).
Chapter 12 12/31/03, 8:14 AM159

160
Note that the polynucleotide is not yet terminated, and the two endsare still set up for addition of further bases or base pairs.
O
O
CH2OPO2Base *
“*” indicates a free valence. Hydrogens occupy all free valences(except the *’ed positions at the two ends of the chain).
The polynucleotide (or single base pair) can now be used to eitherinitiate building, by clicking anywhere on screen, added alongside ofan existing structure, by first clicking on Insert at the bottom right ofthe screen (or pressing the Insert key) followed by clicking on screen,or joined onto an existing structure by clicking on a free valence. Inthe latter case, attachment is made from the “phosphate” end.
General Molecule Building Functionality
Bond Rotation/Bond Stretching
In addition to molecule rotation, translation and scaling, the mouseis used to rotate about and stretch bonds not incorporated into rings.This is accomplished via the following sequence of operations:
(i) Clicking on the desired bond. The selected bond is marked bya red cylinder. (The bond connecting the last “atom”, functionalgroup or ring added to the molecule is automatically selected.)
(ii) Simultaneously pressing the Alt key and the left mouse buttonwhile dragging the mouse, for bond rotation, or the Alt key andthe right mouse button for bond stretching.
Atom/Fragment Replacement
Another function of the mouse is atom replacement. Double clickingon an atom (not a free valence) while an atomic fragment in the entrymodel kit or an atom icon in the expert model kit is highlighted,replaces this atom by the selected atom icon. Atom replacement
Chapter 12 12/31/03, 8:14 AM160

161
functions differently in the entry and expert model kits. In the entrymodel kit, free valences are adjusted to accommodate the replacement,e.g., replacement of sp3 carbon by sp3 oxygen results in two freevalences being removed. Atom replacements which violate valencerules or which would disrupt substituents are not permitted. In theexpert model kit, atom replacement merely changes the atomicnumber. No changes in the number or arrangement of free valencesis made, and no checking is done. Atom replacement is not presentlyavailable in the peptide and nucleotide model kits.
Chirality Inversion
Finally, double clicking on a chiral atom with the Ctrl key depressedinverts the chirality of the atom (R→S or S→R). This function isavailable in all four model kits, but may not be used in some ringsystems where its use might lead to unacceptable structures. Wherethere is only a single chiral center, chirality inversion has the effectof changing enantiomer.
View ( )
This exits build mode, and removes the model kit from the screen (ifit was previously displayed). Selection permits display of more thana single molecule on screen. Features available in build mode whichactually alter molecular geometry are unavailable.
Initial entry into build mode is by way of New under the Filemenu (see Chapter 8). Add Fragment, Delete, Make Bond,Break Bond and Minimize are for modifying existing structures.
Add Fragment ( )
This allows access to the libraries of atomic fragments, functionalgroups, rings and ligands* as well as the clipboard. If a model kit isalready on screen, clicking on an atomic fragment, atom, etc., icon,or on the Groups, Rings, Ligands, Custom or Clipboard button
* Replaced by amino acids in the peptide model kit and nucleotide bases in the nucleotidemodel kit.
Chapter 12 12/31/03, 8:14 AM161

162
leads to “add fragment” mode. If a model kit is not on screen, selectionof Add Fragment results in a model kit being placed on screen. Thisaccomplished, a fragment may be used to initiate building by clickinganywhere on screen, to add alongside an existing structure on screenby clicking on Insert at the bottom right of the screen (or pressingthe Insert key) followed by clicking anywhere on screen, or be addedto an existing structure by clicking on the appropriate free valence.
Fragment addition can be terminated by selection of any other function.
Delete ( )
This allows both atom and/or free valence removal from a structure,as well as deletion of points, planes and/or constraints.* Selectionresults in a message at the bottom left of the screen.
Subsequent clicking on an atom, free valence, a point, a plane or aconstraint results in its deletion. Deletion of an atom results in deletionof all of its associated free valences. Free valences for any atoms towhich the deleted atom was previously connected are restored. Notethat atom deletion may result in one or more detached fragments.See Using the Mouse in Chapter 2 for a discussion of how tomanipulate detached fragments independently or in concert.
Selection of Delete does not bring up a model kit nor does it removea model kit which is present on screen.
Atom deletion can be terminated by selection of any other function.
Deletion may also be accomplished by holding down on the Deletekey while clicking on the atom, free valence, etc.
* Delete is also used to delete spectral plots (see Spectra under the Display menu, Chapter14) as well as individual curves in a plot or entire plots (see Plots under the Display menu,Chapter 14).
Chapter 12 12/31/03, 8:14 AM162

163
Make Bond ( )
This allows bonding between free valences and/or atoms on differentcenters. Selection results in a message at the bottom left of the screen.
Subsequent clicking on two free valences (on two different atoms)will cause these atoms to be linked by a single bond. Alternatively,double clicking on each of two atoms will bond them, and clickingon a free valence on one atom and double clicking on a differentatom will bond the two atoms. If the two atoms involved in theselection are already bonded, this will result in the bond order beingincreased by one, i.e., single → double, double → triple. An atomcannot be bonded to itself, and any attempt to do so will lead to anerror message.
Where available, free valences are consumed as a result of bondformation, irrespective of whether free valences or atoms are selected.
• •
Note, however, that in the absence of available free valences a bondwill still be made between atoms.
••F F
FFF
F
F
F
F
F F
F FFF
FFFF
• •F F F F
This is particularly useful for constructing hypervalent arrangements.Note that free valences can be “protected” without altering themolecule by adding hydrogens to them ( from the entry model kit).
Selection of Make Bond does not bring up a model kit nor does itremove a model kit which is already present on screen.
Bond creation can be terminated by selection of any other function.
Chapter 12 12/31/03, 8:14 AM163

164
Break Bond ( )
This allows breaking an existing bond resulting in free valences.Selection results in a message at the bottom left of the screen.
Subsequent clicking on a bond will result in its breaking; the freevalences on the respective atoms will automatically be restored. Notethat bond breaking may result in detached fragments. See Using theMouse in Chapter 2 for a discussion of how to manipulate detachedfragments independently or in concert.
Selection of Break Bond does not bring up a model kit nor does itremove a model kit which is present on screen.
Bond deletion can be terminated by selection of any other function.
Minimize ( )
The molecular geometry resulting from building may be refined usingmolecular mechanics based on the MMFF force field. Selection resultsin a message at the bottom left of the screen.*
The strain energy as it is commonly known, displayed at the bottomright of the screen, is continually updated during the minimizationprocess. At any time, minimization may be stopped by clicking onthe icon at the bottom right of the screen.
Any geometrical constraints imposed on the structure (see ConstrainDistance, Constrain Angle, Constrain Dihedral in Chapter 11)are enforced during minimization. Also, any frozen atoms (see FreezeCenter in Chapter 11) remain “frozen”. NOEs are not taken intoaccount.
With a model kit already on screen, Minimize reverts back to AddFragment following completion. With no model kit on screen,Minimize does not revert to Add Fragment.
* Outside of “build mode”, and if there are results which will be destroyed as a result ofstructure minimization, selection leads to a warning message.
Chapter 12 12/31/03, 8:14 AM164

165
Chapter 13The Setup Menu
This chapter describes functions available under the Setup menu.These specify molecular mechanics calculations, semi-empiricalcalculations, Hartree-Fock molecular orbital calculations, andcorrelated calculations, including local density calculations, densityfunctional calculations, Møller-Plesset calculations and coupledcluster calculations for ground-state species, and configurationinteraction calculations, local density calculations and (timedependent) density functional calculations for excited-state species.Tasks include calculation of energy, equilibrium structure andconformation, transition-state structure and constructing energyprofiles, although not all tasks are available for some methods. Awide variety of all-electron Gaussian basis sets are supported forHartree-Fock and correlated calculations as are pseudopotentialsfor calculations on molecules incorporating heavy elements.
Functions under the Setup menu also permit inclusion of solvent byway of molecular dynamics, specify calculation of IR, NMR and UV/visible spectra, calculation and printing of a variety of molecularproperties, and designation of graphical surfaces, including electronand spin densities, electrostatic potentials, local ionization potentialsand molecular orbitals, for later display as surfaces, property mapsand contour plots. Also provided under the Setup menu is a facilityfor submitting jobs for calculation.
The Setup menu provides access to dialogs for specifying molecularmechanics and quantum chemical calculations, as well as specifyinggraphical displays and for submitting jobs for calculation.
Chapter 13 12/31/03, 8:16 AM165

166
Calculations...
Calculations modules perform: molecular mechanics calculationsusing the SYBYL and MMFF force fields; MNDO (MNDO/d wheresecond-row and heavier elements are involved), AM1 and PM3 semi-empirical calculations, including PM3 calculations on transition-metalinorganic and organometallic systems; Hartree-Fock molecular orbitalcalculations; local density calculations; BP, BLYP, EDF1 and B3LYPdensity functional calculations; Møller-Plesset calculations throughfourth order and localized MP2 (LMP2) calculations; coupled clustercalculations; configuration interaction calculations (for excited-statespecies). A wide selection of basis sets is available, ranging from theSTO-3G minimal basis set (Hartree-Fock models only), to the 3-21Gsplit-valence basis set (Hartree-Fock models only), to 6-31G*,6-31G** and cc-pVDZ polarization basis sets to the more extensive6-311G*, 6-311G**, cc-pVTZ and cc-pVQZ basis sets. In addition,pseudopotentials for “heavy elements” are available. All basis sets,except for STO-3G and 3-21G may be supplemented with additionalpolarization functions and/or diffuse functions.
The “Essential Edition” of Spartan’04 for Windows permitscalculations on ground-state species only, and with molecularmechanics, semi-empirical and Hartree-Fock models only.STO-3G, 3-21G, 6-31G* and 6-311G* basis sets only, withextensions for additional polarization functions and/or diffusefunctions are supported. These and other differences are dealtwith at the end of this section.
Discussion of molecular mechanics and quantum chemical methodsin general, and of the specific methods available in Spartan’04 isprovided in “A Guide to Molecular Mechanics and QuantumChemical Calculations”. This guide also provides a brief discussionof ways in which the different methods may be effectively andefficiently combined, and a description of graphical models andmodeling techniques.
Chapter 13 12/31/03, 8:16 AM166

167
Quantum chemical calculations, in particular, also result in a varietyof atomic and molecular properties as well as infrared, UV/visibleand NMR spectra. These are available for selected models. Finally,solvent effects on molecular energies and properties may be obtainedby way of a procedure in which the system is “immersed” in a box ofsolvent and a molecular dynamics simulation performed.
Selection of Calculations... results in the Calculations dialog.
This contains a number of pull-down menus, buttons and text boxes:
(i) CalculateThis section contains a series of menus and check boxeswhich, taken together, specify the task to beaccomplished, the electronic state (“ground” or “excited”)the type of calculation, method and basis set to beemployed and details specific to each calculation type.
Specification of Task is by way of a pull-down menu:
Chapter 13 12/31/03, 8:16 AM167

168
Single Point Energy applies to all methods. EquilibriumGeometry, Equilibrium Conformer, ConformerDistribution and Energy Profile apply to all methodsexcept MP3, MP4, CCSD, CCSD(T), G3(MP2), G3,CIS(D) and excited-state density functional methods.Transition State Geometry applies to all methods exceptmolecular mechanics methods and MP3, MP4, CCSD,CCSD(T), G3(MP2), G3, CIS(D) and excited-statedensity functional methods. Additionally, MP2 methodsbased on localized orbitals are available for single-pointenergy calculations only. Finally, note that EquilibriumConformer and Conformer Distribution revert toEquilibrium Geometry in the event that the moleculehas only a single conformer.
Specification of State (electronic state) is by way of apull-down menu. The default setting Ground may bechanged to Excited by clicking on to the right of thebox and back again to Ground by clicking on . Differentmethods are available to handle ground and excited statespecies. Hartree-Fock, Møller-Plesset as well as a varietyof advanced correlated methods are available only forground-state species, while configuration interactionmethods are available only for excited-state species.Density functional methods are available for both groundand excited state species. State is ignored for molecularmechanics and semi-empirical calculations.
Specification of Type of Calculation is by way of apull-down menu. Selections in the menu depend onelectronic state. For ground-state species:
For excited-state species:
Chapter 13 12/31/03, 8:16 AM168

169
All calculation types except for Hartree-Fock requirespecification of additional information:
Molecular Mechanics
Semi-Empirical
Density Functional
Møller-Plesset
Advanced Correlated*
Configuration Interaction
Except for molecular mechanics and semi-empiricalmethods, either restricted or unrestricted methods canbe used. By default, singlets are described usingrestricted methods and non-singlets are described usingunrestricted methods. The default selections may beoverridden using the Scf keyword (see Appendix C).
Except for molecular mechanics and semi-empiricalmethods, a basis set needs to be specified.** For Hartree-Fock methods:
* A number of other advanced correlated methods are available, and may be entered directlyinto the Options box: CCSD(2), OD, OD(T), QCCD, QCCD(2), QCISD, QCISD (T) and G2.
** A number of other basis sets are available, and may be entered directly into the Optionsbox: 6-31G or 6-311G followed by: (d), (d,p), (2d), (2d,2p), (2df, 2pd), (3d, 3p), (3df, 3pd);6-31G or 6-311G with “++” inserted before G; cc-pVDZ and cc-pVQZ.
Chapter 13 12/31/03, 8:16 AM169

170
3-21G refers to use of the 3-21G representation for first row,main-group elements as well as for transition metals, but useof the 3-21G(*) basis set which incorporates a set of d-typefunctions for second-row and heavier main-group elements.
For all other methods:
The combination of a method, e.g., B3LYP, and a basis set,e.g., 6-31G*, constitutes a theoretical model or more simplya model. The nomenclature is to separate method and basisset by a “/”, e.g., B3LYP/6-31G*. By convention, specificationof Hartree-Fock (HF) as a method is optional and specificationof basis set alone refers to Hartree-Fock models, e.g., bothHF/6-31G* and 6-31G* refer to combination of the Hartree-Fock method and the 6-31G* basis set. Methods without basissets, e.g., MMFF (molecular mechanics) and PM3 (semi-empirical) are themselves models.
An additional control, Localized, appears only where asingle-point energy using the MP2 model has beenrequested. If checked, Localized signifies that an MP2calculation is to be based on Hartree-Fock orbitals thathave been localized. This reduces computation time bya small amount (the reduction becomes greater withincreasing molecular size), but leads to significantreduction in required memory and disk. The resultingmethod is referred to as localized MP2 or LMP2.
An additional control, Density, appears only where asingle-point energy using either MP2 or CIS models hasbeen requested. If checked, Density signifies that thepost-Hartree-Fock density matrix is to be evaluated (inaddition to the energy). This leads to a significantincrease in computation time, but is required if properties
Chapter 13 12/31/03, 8:16 AM170

171
(dipole moments, charges, etc.) or graphical surfacesare to be based on the post-Hartree-Fock wavefunction(rather than on the Hartree-Fock wavefunction). Post-Hartree-Fock density matrix evaluation is required (andis performed automatically) for equilibrium andtransition-state geometry determination. The control isnot available for localized MP2 models.
If checked, Pseudopotential signifies that apseudopotential is to replace the all-electron basis set forheavy elements. In effect, this limits description of heavyelements to valence electrons only.* Pertains to Hartree-Fock, density functional, Møller-Plesset and advancedcorrelated (except G3(MP2) and G3) calculations only,and only for third-row and heavier elements. Does notpertain to STO-3G and 3-21G basis sets. For availabilityand description of pseudopotentials in Spartan’04, consultthe on-line help facility (Chapter 17).
An additional control, IRC (Intrinsic ReactionCoordinate), appears when a transition-state geometryhas been requested using Hartree-Fock, densityfunctional or MP2 models. If checked, IRC signifies thatthe resulting transition state will be used to generate apathway (an intrinsic reaction coordinate) leading firstto reactant and then to product. (It is advisable, althoughnot necessary, to compute the IR spectrum prior tocalculation of an intrinsic reaction coordinate.) The fullsequence of steps: reactant → transition state → product,will be placed in a file “xxx.IRCn” where “xxx” is thename given to the molecule and “n” is a number (1, 2...).The default number of steps in the sequence (40) may bechanged using the keyword “IRCSteps” (see AppendixC). IRC is not presently available for semi-empiricalmodels. IRC is not available in the Essential Edition.
* Some pseudopotentials also take account of electrons occupying the shell immediately belowthe valence shell.
Chapter 13 12/31/03, 8:16 AM171

172
(ii) Start fromSpartan’04 allows calculations from one model to bepreceded by equilibrium geometry calculations atanother (simpler) model, for example, Hartree-Fockcalculations to be preceded by semi-empirical geometrycalculations. (This feature does not apply to transition-state geometry calculations.) Available choices dependon the method selected:
molecular mechanics not available
semi-empirical
Hartree-Fock
density functional, Møller-Plesset,advanced correlated
In addition, geometry optimization may be preceded bya search for the lowest-energy MMFF conformer. In thiscase, selection leads to an additional menu specifyingthe level of calculation to be employed for geometryoptimization. The contents of this menu depend on themethod selected:
molecular mechanics not available
semi-empirical not available
Hartree-Fock
density functional, Møller-Plesset,advanced correlated
Chapter 13 12/31/03, 8:16 AM172

173
(iii) Subject to
Spartan’04 allows calculations to be carried out in thepresence of geometrical constraints or with atoms whichhave been frozen in place. In addition, Spartan’04attempts to make full use of symmetry.
If checked, Constraints signifies use of any previouslydefined constraints on distances, angles and dihedralangles into equilibrium and transition-state geometryoptimization, conformation searching and generation ofenergy profiles. Does not apply to single-point energycalculations. See Chapter 11 for information aboutconstraining geometrical parameters.
NOE data are not treated as constraints by Spartan, but ratheras “post-calculation filters” in establishing conformerdistributions.
If checked, Frozen Atoms signifies that the coordinatesof any atoms that have previously been “frozen” willnot be moved during equilibrium and transition-stategeometry optimization, conformation searching andgeneration of energy profiles. Does not apply to single-point energy calculations. See Chapter 11 forinformation about freezing atoms. See also discussionin Chapter 15 regarding the freezing of heavy atoms instructures resulting from a search of the CambridgeStructural database.
If checked, Symmetry signifies that molecular symmetryis to be employed wherever possible to simplify thecalculation. By default Symmetry is checked.
(iv) Compute
Entries under this section request calculation of a numberof “important” spectral quantities, as well as solvent
Chapter 13 12/31/03, 8:16 AM173

174
effects using a molecular dynamics model*. Otherquantities such as the dipole moment and LogP** whichare “less costly” are calculated automatically, whereascalculation of still others may be requested from theOptions box (see discussion following).
Solvent (not yet implemented as of version 1.01)
This accesses a menu which either specifies none (gas-phase calculation) or the name of a solvent into whichthe system is to be immersed, in preface to a moleculardynamics calculation.
The mixed mechanics/quantum mechanics molecular dynamicsprocedure employed by Spartan’04 to estimate solvent effectson energies and properties comprises the following steps:
1. “Immerse” the system (“substrate”) in a box of the selectedsolvent such as to maintain the normal density (of thesolvent) at room temperature. The box typically containson the order of 200-300 solvent molecules.
2. Perform a “preliminary” molecular dynamics simulationusing “gas-phase” substrate charges, dipole moment, etc.This simulation, as well as the “full” simulation performedin step 4, assumes that both the substrate and the solventare rigid, and that only intermolecular geometrical variablesare explored. Solvents with two or more conformers aretreated as (Boltzmann-weighted) collections of the differentconformers.
3. Calculate a solvent term to be added to the one-electronHamiltonian (of the substrate) based on electrostatic
* For gas-phase calculations, the aqueous solvation energy is estimated using the SM5.4procedure of Cramer, Truhlar and co-workers (C.C. Chambers, G.D. Hawkins, C.J. Cramerand D.G. Truhlar, J. Phys. Chem., 100, 16385 (1996)). This is added to the “gas phase”total energy and written to the output. This sum is also available in the spreadsheet (seeChapter 14).
** LogP is estimated both according to the method of Ghose, Pritchett and Crippen (J.Computational Chem., 9, 80 (1988)), and of Villar (J. Computational Chem., 6, 681 (1991);Int. J. Quantum Chem., 44, 203 (1992)), and written to the output. Both Ghose-Crippen andVillar LogP values may also be brought into the spreadsheet (see Chapter 14).
Chapter 13 12/31/03, 8:16 AM174

175
interactions involving the solvent charges and averagedover 20-50 molecular dynamics configurations. Perform aquantum chemical calculation one the substrate using thisadditional term and obtain a new set of atomic charges, anew dipole moment, etc.
4. Perform a “full” simulation using the new set of charges, etc.
5. As in step 3, calculate a solvent term to be added to theone-electron Hamiltonian and, using this term, perform aquantum chemical calculation on the substrate.
The result is a wavefunction appropriate for the substrateimmersed in solvent, from which a total energy* as wellas molecular properties and graphical surfaces may beobtained. These take the place of the corresponding gas-phase quantities in the molecule archives, and allreferences to these archive (from dialogs, thespreadsheet, etc.) refer to the “solvated” system.
Solvent calculations are presently restricted to water andare applicable to all calculation methods which producea wavefunction. Molecular mechanics calculations, inparticular, are excluded.
UV/vis
If checked, specifies that a single-point excited-statecalculation will be performed (following a ground-statecalculation) and that state-to-state energy differences willbe reported.
UV/vis calculations are presently restricted to Hartree-Fock models (when the CIS model is used for the excitedstate) and to local density and density functional models(where the corresponding time-dependent densityfunctional models are used for the excited state).
* The total energy also includes a van der Waals term to account for direct solute-solventinteractions. This is based on an average of representative molecular dynamics configurations.
Chapter 13 12/31/03, 8:16 AM175

176
IR
If checked, calculates vibrational frequencies andcorresponding normal modes of vibration. These are thenavailable in the output (Output under the Display menu,see Chapter 14) along with selected thermodynamicproperties (entropies* and free energies). Vibrationalmodes may be animated and an IR spectrum displayedfrom the IR dialog accessible from Spectra under theDisplay menu (see Chapter 14).
Second derivatives required for frequency calculationare evaluated analytically for molecular mechanics,semi-empirical, Hartree-Fock, local density and densityfunctional models. Other models involve numericaldifferentiation of analytical first derivatives.
NMR
If checked, specifies that NMR chemical shifts will becalculated. These are then available in the output(Output under the Display menu, see Chapter 14) aswell as from the Atom Properties dialog (Displaymenu). 13C (proton decoupled) and 1H (shifts only)spectra may be displayed from the NMR dialogaccessible from Spectra under the Display menu (seeChapter 14). In both cases, line intensities are assumedto be proportional to the number of equivalent carbonsor hydrogens. Coupling constants are not presentlyavailable and only Hartree-Fock models are supported.
(v) Total ChargeTotal charge. The default setting Neutral may bechanged either by clicking on to the right of the box,and selecting Anion, Dianion, -3, etc. from the menuwhich appears, or by replacing any menu entry by a
* Note that the vibrational contribution to the entropy goes to ∞ as frequency goes to 0. This isa consequence of the linear harmonic oscillator approximation and is incorrect. Vibrationalentropy contributions from frequencies below 300 cm-1 should be treated with caution.
Chapter 13 12/31/03, 8:16 AM176

177
numerical value. Total Charge is ignored for molecularmechanics calculations.
(vi) MultiplicitySpin multiplicity. The default setting Singlet may bechanged either by clicking on to the right of the box,and selecting instead Doublet or Triplet from the menuwhich appears, or by replacing any menu entry by anumerical value. Multiplicity is 1 for singlets, 2 fordoublets, 3 for triplets, 4 for quartets, etc. Multiplicityis ignored for molecular mechanics calculations.
(vii) PrintEntries under this section, request printing of a numberof common quantities. Printing of additional quantitiesmay be requested from the Options box (see below).
Orbitals & EnergiesIf checked, writes the molecular orbitals and orbitalenergies to the output. HOMO and LUMO energies arealso available from the Molecule Properties dialogunder the Display menu (see Chapter 14), as well as inthe spreadsheet (Chapter 14).
ThermodynamicsIf checked, writes thermodynamic quantities tothe output. Requires that vibrational frequencies (IRunder “Compute”) have been calculated. Selectedthermodynamic quantities are also available in thespreadsheet (Chapter 14).
Vibrational ModesIf checked, writes vibrational frequencies and normalmodes to the output. Requires that vibrationalfrequencies (IR under “Compute”) have been calculated.
Atomic ChargesIf checked, writes Mulliken, natural and electrostatic-fitcharges to the output. Atomic charges are also available
Chapter 13 12/31/03, 8:16 AM177
178
from the Atom Properties dialog (Display menu;Chapter 14) and in the spreadsheet (Chapter 14).
(viii) OptionsAdditional features affecting calculations are invokedusing keywords entered into the box to the right ofOptions. Keywords may be either single words orexpressions. Keyword=N indicates an integer argument,and keyword=F indicates a real argument. Appendix Ccontains a listing of commonly-used keywords. A morecomplete up-to-date listing is found under on-line help.
(ix) ConvergeIf checked, invokes procedures to assist in convergence.Use of Converge will generally increase computationtime. Converge does not apply to molecular mechanicscalculations.
(x) Global CalculationsIf checked, signifies that settings in the Calculationsdialog are to be applied to all members of the list.
The Calculations dialog may be exited by clicking on Submit,Cancel or OK at the bottom right of the dialog, or on at the topright. (Submit and OK will be deactivated if the job is alreadyexecuting.) Clicking on OK or on Submit overwrites any previousinformation. Additionally, Submit enters the job in the executionqueue (see discussion later this chapter). Clicking on Cancel or on
exits the Calculations dialog without saving any changes.
The Calculations dialog in the Essential Edition of Spartan’04for Windows differs primarily in the “Calculate” section.
The Task menu is the same but the Type of Calculation menu isrestricted to molecular mechanics, semi-empirical and Hartree-Fock models.
Chapter 13 12/31/03, 8:16 AM178

179
The Basis Set menu (Hartree-Fock models only) is identicalexcept that pseudopotentials are not available.
Additionally, intrinsic reaction coordinate (IRC) calculations,molecular dynamics solvent calculations (Solvent under“Compute”) and UV/visible and NMR spectra (UV/vis and NMRunder “Compute”) are not available in the Essential Edition. IRspectra (IR under “Compute”) are available, but the requiredsecond-derivative calculations are performed numerically ratherthan analytically and are significantly slower.
Surfaces
Spartan’04 provides for graphical display of the molecular orbitals, theelectron density, the spin density for open-shell systems (the differencein electron densities arising from the α and β spin manifolds), theelectrostatic potential (the energy of interaction of a point positive chargewith the nuclei and electrons of a molecule), and the local ionizationpotential (a measure of the ease with which electrons are detached froma region of space). These may be represented as a surface of constantvalue (an isosurface), and displayed as an “arrangement of dots”, a mesh,or a fully-lighted opaque or translucent solid. Some examples of graphicaloutput in orthogonal projection are reproduced in grayscale in Figure13-1. Surfaces (like other graphical objects) may also be rendered inperspective (see Chapter 10) and in stereo (see Chapter 2).
Additionally, any one of the quantities listed above (except the electrondensity) may be mapped onto any surface (except a molecular orbitalsurface). In practice, the only maps which have received widespreadattention are those based on the electron density surface (depictingoverall molecular size and shape). For example, the electrostaticpotential may be mapped onto a surface of electron density, yieldingan electrostatic potential map, which portrays both steric andelectrostatic characteristics. Mapping is via the use of color; colorstoward blue represent one extreme value of a property and colorstoward red represent the other extreme.
Chapter 13 12/31/03, 8:16 AM179

180
showing the lone pairs on nitrogen andoxygen, respectively.
showing bonding in the transition state.
showing hydrogen bonding. showing accessibility for nucleophilic attack.
showing interaction of the HOMO of1,3-butadiene and the LUMO of ethylene.
showing overall molecular size and shape.
Frontier orbitals for a symmetry-allowedDiels-Alder reaction,
Space-filling model and electron densitysurface (0.002 electrons/au3) of cyclohex-anone,
Electron density surface (0.08 electrons/au3)of transition structure for pyrolysis of ethylformate,
Electrostatic potential surfaces (-10 kcal/mol)of trimethylamine (left) and dimethyl ether(right),
Electron density slice for acetic acid dimer, Simultaneous display of the LUMO and theelectron density surfaces of cyclohexanone,
Figure 13-1: Examples of Graphical Displays Available in Spartan’04
Chapter 13 12/31/03, 8:16 AM180

181
Finally, calculated quantities may also be displayed as two dimensionalcontour plots (“slices”). Unlike surfaces and maps, these can bemanipulated (translated and rotated) independently of the molecularskeleton. An example of a slice display is provided in Figure 13-1.
Several different surfaces, maps and slices may be simultaneouslydisplayed. This allows visual comparison of different surfaces, ofdifferent properties or both. In addition, any of the usual structurerepresentations (skeletal, ball-and-wire, tube, ball-and-spoke andspace-filling models) may be displayed along with the encodedsurfaces. The total graphical display can become very complex, andselective use of meshes and/or translucent solids (as opposed toopaque solids) may be needed to facilitate visualization.
Discussion of the utility of graphical models for describing molecularstructure and chemical reactivity, including numerous examples, isprovided in “A Guide to Molecular Mechanics and QuantumChemical Calculations”.
The following are among the most useful graphical surfaces andproperty maps:
HOMO demarks electron-rich areas such as lone pairs
LUMO demarks regions susceptible to nucleophilic attack
density demarks chemical bonds and indicates overallmolecular size and shape
spin density demarks location of unpaired electrons (radical sites)
electrostatic quantifies electron-rich/electron-poor regions, forpotential map example, as related to acid and base sites
LUMO map quantifies regions accessible to nucleophilic attack,for example, regio and stereochemical differences
local ionization quantifies regions accessible to electrophilic attack,potential map for example, regio and stereochemical differences
Selection of Surfaces from the Setup menu results in display of theSurfaces dialog.
Chapter 13 12/31/03, 8:16 AM181

182
The box at the top of the dialog identifies graphical surfaces for latercalculation and display. The Add... button at the bottom of the dialogis used to specify new graphical surfaces. Clicking on it leads to theAdd Surface dialog which contains three menus and a check box:
(i) Surface
Available surface types appear in a menu to the right ofSurface.
Available surfaces are the electron density at isosurfacevalues which provide indication of overall molecularsize (density) and of location of chemical bonds (density(bond)), the molecular orbitals (HOMO{-}, HOMO,LUMO, LUMO{+}, SOMO), the electrostatic potential(potential), the local ionization potential (ionization)and the spin density (spin).
Chapter 13 12/31/03, 8:16 AM182

183
The local ionization potential does not go to zero farremoved from the molecule. This makes its use as a surfaceproblematic, although it does not affect its value as aproperty mapped onto a density surface.
Selection of “HOMO{-}” and “LUMO{+}” results indisplay of a box alongside of the entry, e.g.
This contains a decrement value from the HOMO andincrement value from the LUMO, allowing anymolecular orbital to be specified.
Selection of Slice designates that the surface will be a2D plane (a slice) cut through the graphic defined byProperty (see below).
(ii) Property
Properties available for mapping onto surfaces appearin a menu to the right of Property.
Available properties are the electron density (density),the molecular orbitals (HOMO{-}, HOMO, LUMO,LUMO{+}, SOMO), the electrostatic potential(potential), the local ionization potential (ionization)and the spin density (spin). none indicates that noproperty is to be mapped onto the surface). As withSurface above, selection of “HOMO{-}” and“LUMO{+}” leads to a decrement (increment) box.
In addition, a “spin button” will be displayed in the eventthat Multiplicity (in the Calculations dialog) is set to a
Chapter 13 12/31/03, 8:16 AM183

184
value other than Singlet, or if “Scf=unrestricted” hasbeen specified under Options in the Calculationsdialog. Then it will be available (highlighted) only ifHOMO{-}, HOMO, LUMO or LUMO{+} has beenselected for Surface or for Property. Clicking on thebutton toggles it between Alpha and Beta. Alphadesignates that the molecular orbital either to bedisplayed as a surface or mapped as a property onto asurface will come from the α spin manifold; Betadesignates that the molecular orbital will come from theβ spin manifold.
(iii) ResolutionSelection of surface resolution is from the menu to theright of Resolution.
Medium resolution generally is of sufficient quality forroutine work, low resolution is used to get rough imagesvery quickly, while intermediate and high resolution maybe employed to obtain graphics suitable for publication.Both calculation time and disk storage requirementsincrease significantly with increasing resolution.
(iv) IsoValue
This allows a fixed (single-valued) isosurface to begenerated in place of a three-dimensional grid of points(from which different isosurfaces, slices and/or propertymaps can be constructed). While this is less flexible, itis entirely sufficient in the majority of cases, in particular,in dealing with property maps which are nearly alwaysbased on a density surface representing overall molecularsize and shape. Fixed isosurfaces and property mapsbased on fixed isosurfaces are much less costly than non-fixed isosurfaces (maps), both in terms of computer timeand disk space.
Chapter 13 12/31/03, 8:16 AM184

185
* Actually, the job is submitted to a job queue and will be submitted for execution only whenreleased from this queue. See Monitor under the Options menu (Chapter 16) for discussion.
Checking the box to the left of Fixed leads to display ofthe isovalue (0.002 in the case of density). This valuemay be changed. Fixed may not be specified inconjunction with Slice as a Surface.
Following Surface, Property, Resolution and(optionally) spin selection, clicking on OK adds therequested graphic to the list and removes the (AddSurface) dialog. Clicking on Cancel does not add agraphic to the list but removes the (Add Surface) dialog.
The process (clicking on Add..., surface and propertyselection, clicking on OK) may be repeated as required.
An existing graphic may be deleted from the list by firsthighlighting (clicking on) it and then clicking on Delete.
Global Surfaces, if checked, signifies that the requestedsurfaces will be calculated for all members of the list.
Only one copy of the Surfaces dialog may appear on screen, and anyactions relate to the currently selected molecule. The dialog may beremoved by clicking on .
Submit
Following setup of a molecular mechanics or quantum chemicalcalculation, and/or request for generation of graphics files, the requiredcalculations are actually performed using Submit under the Setupmenu. If the job has not previously been named, selection of Submittriggers a request for a name (see Save As...; Chapter 8). After aname has been provided (or if a name already exists) a dialog appearsindicating that the job has actually been submitted.*
Chapter 13 12/31/03, 8:16 AM185

186
Click on OK to remove it. After a job has started, and until it hascompleted, all associated files will be designated “read only”.
Another dialog appears following completion of a calculation.
Click on OK to remove it.
Chapter 13 12/31/03, 8:16 AM186

187
Chapter 14The Display Menu
This chapter describes functions available under the Displaymenu. These provide for text, dialog, spreadsheet and graphicaldisplays following molecular mechanics or quantum chemicalcalculations. Functions are also available to query a variety of on-screen objects (molecules, atoms, surfaces, etc.), to display infraredand NMR spectra, to animate vibrational motions and to prepare 2Dand 3D plots from spreadsheet data.
A variety of output from molecular mechanics and quantum chemicalcalculations is accessible by way of the Display menu.
Output
Selection of Output opens a window.
Chapter 14.1 12/31/03, 8:18 AM187

188
A menu at the top left of the window selects the type of output fordisplay.
Output provides normal output, Verbose Output provides extendedoutput, Archive and Property Archive provide the contents ofSpartan’04’s archive and properly archive files*, respectively, CSDData provides the literature reference and other information for datain the Cambridge Structural Database (CSD), and Error Logdocuments execution errors.
The contents of the window may be scrolled in the usual manner andmay be “paged up” or “paged down” by clicking above or below thescroll bar. The contents may be printed by selecting Print Output...from the File menu (which has replaced Print... when an outputwindow is selected), or copied to the clipboard by selecting Copyfrom the Edit menu when an output is selected. Find... and FindNext functions from the Edit menu are also available.
An output window is associated with each molecule (or each list ofmolecules), and as many output windows as desired may besimultaneously open on screen (although only one may be selected).The selected window may be closed by clicking on at the top right.
Except for CSD data, output from jobs which are currentlyexecuting is unavailable from the Display menu. The content ofthe normal output window (“Output”) can be viewed using theMonitor under the Options menu (see Chapter 16).
* Entries from the property archive may be brought into the spreadsheet using @prop (propertyname), where “ property name” is the name of the property in the archive. See Spreadsheetin this chapter.
Chapter 14.1 12/31/03, 8:18 AM188

189
Properties
Spartan’04 provides specialized dialogs for reporting and (in somecases) changing the properties of molecules, atoms, bonds, graphicalsurfaces and geometrical constraints. They also allow for changingdefault plot styles and limits, as well as for altering the nature of“fitting functions”. Only one Properties dialog is permitted on screen,and this dialog refers either to the selected molecule (MoleculeProperties), or to the selected component (atom, bond, etc.) or attribute(spectra, graphical surface, etc.) of the selected molecule (AtomProperties, Bond Properties, Surface Properties, etc.), or to a plotconstructed from data in a spreadsheet (Plot Properties, CurveProperties, etc.), or to a fitting function (Regression Properties).Selection of a different molecule (with a Properties dialog on screen)leads to the Molecule Properties dialog for the newly selectedmolecule. Dialogs which refer to components or attributes of the (newlyselected) molecule follow by clicking on the component or attribute.
Dialog selection operates in “toggle” mode, with the MoleculeProperties dialog being in the “neutral” or “off” position. In thisposition (with the Molecule Properties dialog on screen), clickingon a component or attribute (of the currently selected molecule) bringsup the appropriate Properties dialog. For example, clicking on anatom brings up the Atom Properties dialog. Clicking on a differentcomponent or attribute brings up the Properties dialog for thiscomponent or attribute. However, clicking a second time on the samecomponent reverts back to the Molecule Properties dialog.
Each of the Properties dialogs has an associated Utilities or Styledialog. For example, associated with the Molecule Properties dialogis a Molecule Utilities dialog. These access additional informationabout the molecule and its components or attributes, or provide styleand color controls unique to the selected molecule, component orattribute. This is useful for highlighting (or dehighlighting) a particularmolecule, component or attribute. Utilities/Style dialogs are reachedby clicking on at the bottom right of the appropriate Propertiesdialog. Return to the Properties dialog follows from clicking on at the bottom right of the associated Utilities/Style dialog. Clicking
Chapter 14.1 12/31/03, 8:18 AM189
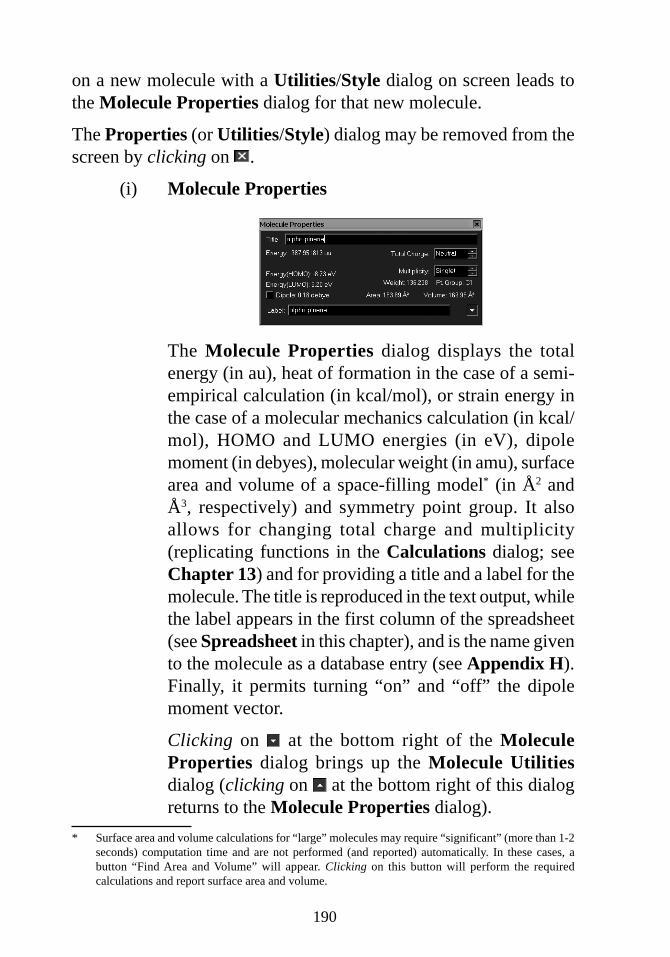
190
on a new molecule with a Utilities/Style dialog on screen leads tothe Molecule Properties dialog for that new molecule.
The Properties (or Utilities/Style) dialog may be removed from thescreen by clicking on .
(i) Molecule Properties
The Molecule Properties dialog displays the totalenergy (in au), heat of formation in the case of a semi-empirical calculation (in kcal/mol), or strain energy inthe case of a molecular mechanics calculation (in kcal/mol), HOMO and LUMO energies (in eV), dipolemoment (in debyes), molecular weight (in amu), surfacearea and volume of a space-filling model* (in Å2 andÅ3, respectively) and symmetry point group. It alsoallows for changing total charge and multiplicity(replicating functions in the Calculations dialog; seeChapter 13) and for providing a title and a label for themolecule. The title is reproduced in the text output, whilethe label appears in the first column of the spreadsheet(see Spreadsheet in this chapter), and is the name givento the molecule as a database entry (see Appendix H).Finally, it permits turning “on” and “off” the dipolemoment vector.
Clicking on at the bottom right of the MoleculeProperties dialog brings up the Molecule Utilitiesdialog (clicking on at the bottom right of this dialogreturns to the Molecule Properties dialog).
* Surface area and volume calculations for “large” molecules may require “significant” (more than 1-2seconds) computation time and are not performed (and reported) automatically. In these cases, abutton “Find Area and Volume” will appear. Clicking on this button will perform the requiredcalculations and report surface area and volume.
Chapter 14.1 12/31/03, 8:18 AM190

191
This contains controls for resetting model color and style(see Selected Properties below), for adding missinghydrogens to the model, for adding “missing” bonds andfor providing information about amino acids inpolypeptides and for replacing coordinates by thosebased on atomic connectivities. The dialog also allowsturning “on” and “off” display of constraint, frozen atomand reaction markers as well as user-defined points andplanes. The dialog provides a second access point toGlobal Model, which, if “on”, forces a common modelfor all molecules in a list.
(ii) Atom Properties
Selection of an atom with a Properties dialog on screen,or selection of Properties from the Display menufollowing selection of an atom, leads the AtomProperties dialog.
This displays the element name and allows for changingof element type, R/S chirality, Mulliken, electrostatic-fit and natural charges (in electrons) and chemical shifts(in ppm relative to the appropriate standards; seeAppendix E) if the NMR spectrum has been requested.It also allows the atom to be Frozen (see Freeze Center
Chapter 14.1 12/31/03, 8:18 AM191

192
in Chapter 11), for changing its Mass Number, FormalCharge and for changing the default atomic Label.
Clicking on at the bottom right of the Atom Propertiesdialog brings up the Atom Style dialog (clicking on at the bottom right of this dialog returns to the AtomProperties dialog).
This contains controls for selecting atom color.
(iii) Bond Properties
Selection of a bond with a Properties dialog on screen,or selection of Properties from the Display menufollowing selection of a bond leads to the BondProperties dialog.
This displays the bond length (in Å). It also providesfor changing bond Type (also available in the expertmodel kit; see Chapter 12) and the default bond Label.
Clicking on at the bottom right of the Bond Propertiesdialog brings up the Bond Style dialog (clicking on at the bottom right of this dialog returns to the BondProperties dialog).
Chapter 14.1 12/31/03, 8:18 AM192

193
This contains controls for selecting bond color.
(iv) Constraint Properties
Selection of a constraint marker with a Properties dialogon screen, or selection of Properties from the Displaymenu following selection of a constraint marker, leadsto the Constraint Properties dialog.
This allows setting the Value of the selected constraint,posting the constraint value to the spreadsheet, as wellas for changing the default constraint Label. CheckingDynamic leads to an expanded dialog.
This allows specification of a series of constraints in orderto generate an energy profile (see Calculations... in
Chapter 14.1 12/31/03, 8:18 AM193

194
Chapter 13). The value of the constraint for the firstmember of the series is given in the lefthand box to theright of Value, and the value of the constraint for the lastmember of the series is given in the righthand box to theright of Value. The number of members in the series isgiven in the box to the right of Steps. Upon initial entry,the numbers in both boxes to the right of Value will bethe same, and Steps will be set to 1. These may be alteredas required by typing the desired numbers into theappropriate boxes and then pressing the Enter key. Note,that an energy profile may involve constraints on morethan a single geometrical variable, that is, may involveseveral variables changed in “lock-step” with oneanother. In this case, the constraint ranges for theindividual variables need to selected. Note, however, thatthe number of steps must be the same for each variable.
Clicking on at the bottom right of the ConstraintProperties dialog brings up the Constraint Style dialog(clicking on at the bottom right of this dialog returnsto the Constraint Properties dialog).
This contains controls for selecting the color of theconstraint marker.
(v) Point and Plane Properties
Selection of a user-defined point or plane (see Chapter11 with a Properties dialog on screen, or selection ofProperties from the Display menu following selectionof a point or plane, leads to the Point Properties or Plane
Chapter 14.1 12/31/03, 8:18 AM194

195
Properties dialog (not shown). These allow changes topoint or plane labels. Clicking on at the bottom rightof the Point (Plane) Properties dialog gives rise to thePoint (Plane) Style dialogs (not shown), which containcontrols for adjusting point and plane colors, respectively.
(vi) Surface Properties
Selection of graphical surfaces (isosurface, slice orproperty map) with a Properties dialog on screen, orselection of Properties from the Display menufollowing selection of a graphical surface, leads to theSurface Properties dialog.
This displays the area (in Å2) and volume (in Å3) of theselected surface. It also allows for turning “on” and “off”and setting the range of a Property map (on top of anisosurface), for changing IsoVal the isovalue (exceptwhere a “fixed” isovalue has been requested) and foraltering display Style. It also provides a second accesspoint to Global Surface (also available in the Surfacesdialog under the Setup or Display menu, see Chapter13) which, if “on”, forces common property ranges forproperty map displays for all molecules in a list. Finally,the dialog reports the “value” of the property at the cursorposition on a property map. (To obtain the property valueat another position, move the cursor and click twice.)
In the event that the selected graphical surface is a slice,a different Surface Properties dialog appears.
Chapter 14.1 12/31/03, 8:18 AM195

196
The IsoVal setting in the previous dialog has beenreplaced by a Frame menu which allows choosing thetype of slice (plane, cylinder or sphere).
Clicking on at the bottom right of the SurfaceProperties dialog brings up the Surface Style dialog(clicking on at the bottom right of this dialog returnsto the Surface Properties dialog).
This contains controls for selecting surface color.
(vii) Curve and Plot Properties
Plots created using data from the spreadsheet (seediscussion under both Spectra and Plots... later in thischapter) may be edited using a set of closely-relateddialogs. These refer to “curves”, meaning a singlerelationship between variables, and “plots” meaning aset of relationships which share one variable (or twovariables in the case of a 3D plot).
Selection of a plot frame with a Properties dialog onscreen, or selection of Properties from the Displaymenu following selection of a plot frame, leads to thePlot Properties dialog (2D XY plot case shown).
Chapter 14.1 12/31/03, 8:18 AM196

197
The X Axis menu and the Y Axes list duplicatefunctionality under the Plots dialog (see Plots... later inthis chapter). They allow specification of a molecularproperty to serve as the X axis of the plot and one ormore properties to serve as the Y axes. Initial selectionsmay be altered as desired (by selecting a new propertyfrom the X Axis menu and/or adding or deleting propertiesfrom the Y Axes list). In addition, a Grid can be added tothe plot, and the default Label can be changed.
The scale along the X axis (horizontal axis) may be alteredfrom default settings (from the minimum to maximumvalue of the “X variable”) by clicking on the X Sca. tabat the left of the dialog. This brings up the Plot X-ScaleProperties dialog (clicking on the Plot tab at the left ofthis dialog returns to the Plot Properties dialog).
To alter the scale, type in new values inside the Rangeboxes. You need to press the Enter key following eachentry. Controls are also available to alter characteristicsof labels associated with the X axis, Tics (the numberof “tic marks”), Label Size and Precision.
Chapter 14.1 12/31/03, 8:18 AM197

198
Clicking on at the bottom right of either the PlotProperties or Plot X-Scale Properties dialog bringsup the Plot Style dialog (clicking on at the bottomright of this dialog returns to either the Plot Propertiesor Plot X-Scale Properties dialog).
This contains controls for selecting the color of the plotframe, as well as the Label associated with the X axis.
The Style menu in the Plot Properties dialog allowsshifting between 2D (XY) and 3D (XYZ) plots. Selectionof XYZ Plot leads to an extended Plot Properties dialog.
This is identical to the previous (“XY Plot”) PlotProperties dialog, except that it includes an additionalmenu (Y Axis) from which one property needs to beselected. In addition, the Y Axes list in the “XY Plot”dialog has been renamed to Z Axes.
Scales along X and Y axes may be independentlyadjusted by clicking on X Sca. and Y Sca. tabs to theleft of the dialog. This leads to either the Plot X-Scaleor Plot Y-Scale Properties dialog (clicking on the Plot
Chapter 14.1 12/31/03, 8:18 AM198

199
tab at the left of either of these dialogs returns to thePlot Properties dialog). These are analogous to the (PlotX-Scale Properties) dialog discussed for XY plots.
The same Plot Style dialog available for XY plots maybe accessed here (by clicking on at the bottom of theappropriate dialog).
Selection of an individual curve in a plot with aProperties dialog on screen, or selection of Propertiesfrom the Display menu following selection of anindividual curve, leads to the Curve Properties dialog.
This allows for change in the presentation format for theselected curve (or any other curve in the overall plot asspecified from the Axis menu). This includes designationof the kind of Markers for the individual data points,request for Marker Labels (molecule names associatedwith the data points), designation of the kind of Fit tothe data points and the Line Width of the fitting curve.Also optional is a Sphere showing the selected point(selected molecule in the list) on the curve. Provision isalso made for including Error bars on the individualdata points (drawn from a column on the spreadsheet).
The scale along the Y axis (vertical axis) in the case of a2D XY plot (or Z axis in the case of a 3D XYZ plot)may be altered from default settings (from the minimumto maximum value of the “Y or Z variable”) by clickingon the Scale tab at the left of the dialog .This brings upthe Curve Scale Properties dialog (clicking on the
Chapter 14.1 12/31/03, 8:18 AM199

200
Curve tab at the left of this dialog returns to the CurveProperties dialog).
To alter the scale, type in new values inside the boxesunderneath “Range”. You need to press the Enter keyfollowing each entry. Controls are also available to altercharacteristics of labels associated with the Y or Z axis:Tics (the number of “tic marks”), Label Size andPrecision.
Clicking on at the bottom right of either the CurveProperties or Curve Scale Properties dialog brings upthe Curve Style dialog (clicking on at the bottomright of this dialog returns to either the Curve Propertiesor Curve Scale Properties dialog).
This contains controls for selecting the color of the curve(and the Label associated with the Y (or Z) axis).
(viii) Regression Properties
After performing a linear regression analysis on data inthe spreadsheet (see discussion later in this chapter), a
* More precisely, a fit row will be written for each fit, and labelled Fit1, Fit2, . . .”.
Chapter 14.1 12/31/03, 8:18 AM200

201
new row, labelled “Fit1”*, appears at or near the bottomof the spreadsheet. This contains information about thefit. Clicking on this line with a Properties dialog onscreen, or selecting Properties from the Display menuafter clicking on the “fit line” in the spreadsheet, leadsto the Regression Properties dialog.
This reports “RMSD” and “R2” error statistics relatedto the fit, as well as allows for changing “what is to befit” (Fit menu) and “what it is to be fit to” (list to theright of Using). Following selection of either or both,the error statistics will update, allowing the userimmediate feedback.
(ix) “Selected” Style
In addition to “Style” dialogs associated with each ofthe Properties dialogs, there is “Selected” Style dialog(for which there is no corresponding Properties dialog).This is accessed either by defining a selection box (seediscussion in Chapter 2) with a Properties dialog onscreen, or by selecting Properties from the Displaymenu after defining a selection box.
Chapter 14.1 12/31/03, 8:18 AM201

202
This dialog contains controls for changing the color andmodel type of whatever is included in the selection box.
Surfaces
This accesses the same dialog already described in Chapter 13.
Spectra
Spartan’04 provides for display of infrared, UV/visible and NMRspectra. (All of these need to have been previously requested fromthe Calculations dialog under the Setup menu; see Chapter 13.)Access is via a series of tabbed dialogs under Spectra.
IR
Clicking on the IR tab leads to the IR Spectra dialog which not onlyprovides for display of an infrared spectrum, but also allows foranimated display of the vibrational modes as well as for generationof a sequence of structures along a vibrational coordinate.
This contains an ascending list of frequencies (in cm-1) together with(infrared) intensities and symmetry labels. Imaginary frequencies,e.g., corresponding to the reaction coordinate for a transition state,will appear first in the list, and will be designated by the letter “i” infront of the frequency value. A frequency is selected for display byclicking on it. Clicking again deselects it.
The amplitude of vibrational motion (the maximum displacementaway from “equilibrium” of any pair of atoms) may be changed from
Chapter 14.1 12/31/03, 8:18 AM202

203
the default amplitude (0.5Å which is much larger than appropriatefor vibrational motion at room temperature) by altering the contentsof the box to the right of Amp. The default number of steps whichmake up the display (11 frames) may be changed by altering thecontents of the box to the right of Steps*. The greater the number offrames, the slower will be the vibration.
Make List creates a list containing a sequence of “Steps” structurescorresponding to motion along the selected normal mode. The originalmolecule is not closed, and several sequences (corresponding todifferent vibrations) can be created.
A spectrum may be drawn by clicking on Draw IR Spectrum.
The default range, from 4000 cm-1 to 500 cm-1, corresponds to thatcommonly obtained experimentally, and may be changed by bringingup the Properties dialog (Display menu), clicking on the horizontalaxis to bring up the Plot Properties dialog, clicking on the X Sca.tab at the left of the dialog and editing the values under Range. Thespectrum is treated like any other graphical object, and may betranslated and scaled using the appropriate mouse operations. It maynot be rotated. The spectrum may be removed from the screen byclicking on (or alternatively by holding down the Delete key) andthen clicking on the spectrum.
* It is recommended that the number of steps be odd ensuring that the center point correspondsto the actual equilibrium or transition-state structure.
Chapter 14.1 12/31/03, 8:18 AM203

204
UV/vis
Clicking on the UV/vis tab leads to the UV/vis Spectra dialog.
This lists excitation energies (from lowest to highest) together withintensities. A UV/visible spectrum may be drawn by clicking on DrawUV Spectrum.
The default range, from 200 nm to 700 nm, corresponds to thatcommonly obtained experimentally, and may be changed by bringingup the Properties dialog (Display menu), clicking on the horizontalaxis to bring up the Plot Properties dialog, clicking on the X Sca.tab at the left of the dialog and editing the values under Range. Thespectrum is treated like any other graphical object, and may betranslated and scaled using the appropriate mouse operations. It maynot be rotated. The spectrum may be removed from the screen byclicking on (or alternatively by holding down the Delete key) andthen clicking on the spectrum.
Chapter 14.1 12/31/03, 8:18 AM204

205
NMR
Clicking on the NMR tab leads to the NMR Spectra dialog whichprovides for display of 1H and 13C NMR spectra.
These are drawn by clicking on Draw 1H Spectrum/Draw 13CSpectrum inside the dialog.
1H and 13C spectral plots are treated like any other graphical object,and may be translated and scaled using the appropriate mouseoperations. They may not be rotated. Spectral plots may be removedfrom the screen by clicking on (or alternatively by holding downthe Delete key) and then clicking on the spectrum.
Only a single copy of one of the dialogs under Spectra may appearon screen, and any actions relate to the currently selected molecule.The dialog may be removed by clicking on .
Chapter 14.1 12/31/03, 8:18 AM205

206
Spreadsheet
Associated with each list of molecules (including “lists” comprisingonly a single molecule) is a spreadsheet. This may be displayed byselecting Spreadsheet.
The spreadsheet comprises a series of rows (corresponding to thedifferent molecules in the list) and columns (corresponding to differentmolecular properties). This gives rise to a series of “cells”, the numberof which is given by the number of rows (molecules) times the numberof columns (molecular properties). The spreadsheet can be expandedor contracted as required for display of all relevant information bypositioning the cursor at any corner of the spreadsheet, pressing theleft mouse button and dragging the mouse.
Only one molecule from one list may be selected. Molecule selectionfollows either by clicking on the spreadsheet cell containing the label,or by using the and buttons or the scroll bar at the bottom left ofthe screen. Molecules may be animated (stepped through in rapidsuccession) using the button. Molecule selection (for members ofa list) results in deselection of the previously selected molecule.However, it does not need to result in its removal from view. Amolecule (in a list) may be designated for “permanent” display bychecking the button to the right of its “Label” in the spreadsheet.This also selects the molecule, and deselects the previously selectedmolecule (but does not remove it from view if it were previously“checked”). The molecules in a list may either be translated and rotatedin concert or manipulated independently. This is controlled byCoupled under the Model menu (see Chapter 10). The default is
Chapter 14.2 12/31/03, 8:20 AM206
207
that molecules move in concert. Select Coupled to designateindependent motion.
Upon initial entry into the spreadsheet, all columns except the leftmostcolumn, are blank. The leftmost column (“Label”) contains a labelof the molecule. It may be changed from the default (“M001”,“M002”, etc.) either by directly typing a new label into the spreadsheetor into the Label box in the Molecule Properties dialog. The labelsupplied will be used as the “molecule name” in a user-defineddatabase (see Appendix H).
Information may be added to the spreadsheet in several different ways:
(i) Molecular properties from the Add dialog: A variety of“important” molecular properties may be easily entered intothe spreadsheet by first clicking on the header cellcorresponding to an “empty” column, and then clicking onAdd... at the bottom of the spreadsheet. An alternative is tohold down the right mouse button (following clicking onthe header cell) and then to select Add... from the menuwhich results.
Either leads to the Add Columns dialog.
Chapter 14.2 12/31/03, 8:20 AM207

208
Columns (molecular properties) are added to the spreadsheetby clicking on one or more entries in the window at the topof the dialog, then specifying appropriate units from theEnergy and Length menus, and finally clicking on OK oron Apply. In the former case, the dialog is dismissed and inthe latter it is left on screen. Clicking on Cancel or on removes the dialog without affecting the contents of thespreadsheet.
Column totals and averages, as well as information relatingto the extent to which the data in the different columns are“correlated”, may be accessed by clicking on theSummaries tab. This leads to the Add Summaries dialog.
Clicking on “Totals”, “Averages” and/or “Correlations”(which have replaced molecular properties in the windowat the top of the dialog) then clicking on OK or Apply,leads to the requested summaries as rows at the bottom ofthe spreadsheet, identified as “Totals”, “Averages” and“Correlations” (one row for each molecular property),respectively. Note, that the Add Summaries dialog can bebrought up directly by clicking on an empty row header(instead of an empty column header) inside the spreadsheetprior to clicking on Add....
Finally, a linear regression analysis may be performed onthe data in the spreadsheet. To access this functionality, click
Chapter 14.2 12/31/03, 8:20 AM208

209
on the Linear Regression tab to bring up the Add LinearRegression dialog.
Select one entry from the Fit menu and one or more entriesfrom the list under Using. Clicking on OK or Applyperforms the linear regression analysis and places the resultsin a row at the bottom of the spreadsheet identified by “Fit”.As many analyses as desired may be performed on the datain the spreadsheet. These will each be entered as separaterows in the spreadsheet, with names “Fit1”, “Fit2”, etc.Additional information about the regression analyses isavailable from the Regression Properties dialog (seediscussion earlier in this chapter).
(ii) Direct entry of numerical data: Numerical data may beentered by typing directly into the spreadsheet. A columnheader first needs to be specified. Click on an empty columnheader cell, type in a name and press Enter. Then, type thedata into individual cells of the new column (press Enterfollowing each data entry).
(iii) User-defined expressions: An expression may be enteredeither into a header cell (in which case it refers to all entriesin a column) or into an individual cell (in which case it refersonly to a single entry). Expressions in the column headertake the form “name=formula”, where “formula” is madeup of arithmetic operations (Table 14-1), specialty functions(Table 14-2), quantities resulting from molecular mechanics
Chapter 14.2 12/31/03, 8:20 AM209

210
Table 14-1: Arithmetic and Boolean Operations and MathematicalFunctions
arithemetic operations boolean operations+ addition > greater than_ subtraction >= greater than or equal to* multiplication < less than/ division <= less than or equal to^ raise to a power == equal to
!= not equal to| or& and
mathematical functionsABS(x) absolute value LN(x) natural logarithmACOS(x) inverse cosine LOG(x) log (base 10)ASIN(x) inverse sine SIN(x) sineATAN(x) inverse tangent SQRT(x) square rootCOS(x) cosine TAN(x) tangentEXP(x) exponential
Table 14-2: Specialty Functions
AVG (column name) average of values in column
FITVAL (fit name) column of “fit” values from regression analysis
MIN (column name) minimum of values in column
MAX (column name) maximum of values in column
NUM (column name) number of “defined” entries in column
ROW the number of the row in the spreadsheet
ROW(molecule name) the number of the row of molecule
REF(i, x) the value of the x referenced to row i
STDEV (column name) standard deviation of values in column
SUM (column name) sum of values in column
Chapter 14.2 12/31/03, 8:20 AM210

211
or quantum chemical calculations* (Table 14-3), conversionfactors and constants (Table 14-4) in addition to numericalvalues. References to specialty functions, molecularmechanics and quantum chemical functions and conversionfactors and constants need to be preceded by @. Forexample, “mu = @DIPOLE” typed into a header cell givesthe dipole moment. Some quantities have arguments, forexample, “c1” and “c2” in the expression “c12=@DISTANCE (c1,c2)” refer to atoms c1 and c2, while “3”in the expression “orbitalE= @HOMO(-3)” designates theenergy of the molecular orbital three orbitals below theHOMO. It is necessary to press Enter following entry ofthe expression into a cell. The leading “name=” is optionalfor entries in an “individual” (non-header) cell. Examplesof user-defined expressions are provided in Table 14-5.
(iv) Molecular and atomic properties from “Post” ( ) buttons:A number of properties which require user specificationmay be entered into the spreadsheet from “Post” buttons.These include individual bond distances, angles and dihedralangles (available from Measure Distance, Measure Angleand Measure Dihedral under the Geometry menu; seediscussion in Chapter 11), bond distance, angle anddihedral angle constraints (available from ConstrainDistance, Constrain Angle and Constrain Dihedral underthe Geometry menu; see discussion in Chapter 11), andatomic charges and chemical shifts (available from theAtom Properties dialog; see discussion earlier in thischapter). “Post” generates an entire column of values basedon atom labels for the selected molecule in the list. Only
* Additionally, any quantity available in the “property archive” (viewable from the Outputwindow; see discussion earlier in this chapter) may be accessed in an expression using the“@prop(argument 1, argument 2, . . .)”. Among the different argument lists are the following:The name of the property (in the “property archive”), e.g., “SYM_STRING” for the symmetrylabel. The name of the property followed by the (serial) number of the atom in the list ofatoms, e.g., “MM_CHARGE, 6” for the MMFF (molecular mechanics) charge on the sixthatom in the list of atoms. The name of the property followed by a number to indicate thedesired member in the list of all members,e.g., “FREQ_VAL, 1” for the lowest vibrationalfrequency in the list of frequencies.
Chapter 14.2 12/31/03, 8:20 AM211

212
Table 14-3: Quantities from Molecular Mechanics or Quantum ChemicalCalculations
ANGLE(i, j, k) angle involving atoms i, j, k (degrees)AREA area of a user-defined planeCPKAREA surface area of a space-filling model (Å2)CPKVOLUME volume of a space-filling model (Å3)PAREA (i, j, . . .) partial surface area of a space-filling model due
to all atoms of type i, j, ..., where i, j, ... are eitheratomic numbers or elemental symbols. i:, j:, ...signifies that attached hydrogens are alsoincluded. (the surface area due to nitrogen,oxygen and any bonded hydrogen is commonlyreferred to as the polar surface area) (Å2)
PVOLUME (i, j, . . .) partial volume of a space-filling model due toall atoms of type i, j, ..., where i, j, ... are eitheratomic numbers or elemental symbols. i:, j:, ...signifies that attached hydrogens are alsoincluded (Å3)
DIHEDRAL(i, j, k, l) dihedral angle involving atoms i, j, k, l (degrees)DIPOLE dipole moment (debyes)DISTANCE(i, j) distance involving atoms i, j (Å)ELECTROSTATIC (i) electrostatic charge on atom i (electrons)ENERGY energy (hartrees)ENERGYAQ energy including SM5.4 aqueous solvent
correction (hartrees)ENTROPY entropy (cal/mol degree)FREEENERGY free energy (kcal/mol)HOMO(-n) energy of nth orbital below the HOMO (hartrees)HOMOBETA(-n) energy of the nth orbital below the HOMO in the
β spin manifold (hartrees)ISOTOPE(i) mass number of atom iLENGTH (i) length of bond i (Å)LOGPC LogP from Crippen modelLOGPV LogP from Villar modelLUMO(+n) energy of the nth orbital above the LUMO
(hartrees)LUMOBETA(+n) energy of the nth orbital above the LUMO in the
β spin manifold (hartrees)MULLIKEN(i) Mulliken charge on atom i (electrons)NATURAL(i) natural charge on atom i (electrons)ZEROPOINT zero-point energy (kcal/mol)WEIGHT molecular weight (amu)
Chapter 14.2 12/31/03, 8:20 AM212

213
Table 14-4: Conversion Factors and Constants
ANGS2AU Ångstroms to atomic units
AU2ANGS atomic units to Ångstroms
EV2HART eV to hartrees
EV2KCAL eV to kcal/mol
EVTOKJ eV to kJ/mol
HART2KCAL hartrees to kcal/mol
HART2EV hartrees to eV
HART2KJ hartrees to kJ/mol
KCAL2EV kcal/mol to eV
KCAL2HART kcal/mol to hartrees
KCAL2KJ kcal/mol to kJ/mol
KJ2EV kJ/mol to eV
KJ2HART kJ/mol to hartrees
KJ2KCAL kJ/mol to kcal/mol
PI π
Table 14-5: User Defined Expressions
E/area = @ENERGY/@AREA energy divided by surfacearea
RelE = @ENERGY-@REF (6,@ENERGY) energy relative to energy ofmolecule in row 6
Eq = @EXP (-@ENERGY/592.1) equilibrium constant at roomtemperature
EnergyFilter = @ENERGY<-99.43 “true” (≠0) for all energies <-99.43
RowFilter = @ROW>10 “true” (≠0) all entries pastrow 10
Chapter 14.2 12/31/03, 8:20 AM213

214
where the molecules in the list are closely related, forexample, molecules resulting from a conformational searchor from “driving” a particular geometrical coordinate, orwhere labels have been explicitly reassigned*, is Post likelyto lead to the desired result.
(v) Molecular and atomic properties from the clipboard:Properties of individual molecules in a list may be copiedinto the clipboard and then pasted into individual spreadsheetcells. These include bond distances, angles and dihedralangles (Measure Distance, Measure Angle and MeasureDihedral under the Geometry menu), bond distance, angleand dihedral angle constraints (Constrain Distance,Constrain Angle and Constrain Dihedral under theGeometry menu), atomic charges and chemical shifts(Atom Properties dialog), infrared frequencies andchemical shifts (IR Spectra and NMR Spectra dialogs,respectively) and the value of a property on a property map(Surface Properties dialog). First, highlight the numericalvalue of the property in the appropriate screen location(distances, etc.) or dialog (charges, etc.), then select Copyfrom the Edit menu, then click on the appropriate(destination) cell in the spreadsheet, and finally select Pastefrom the Edit menu.
Each row in a spreadsheet corresponds to a molecule in a list, andnew rows may be added by adding new molecules to the list. Thismay be accomplished either by building a new molecule (NewMolecule from the File menu; Chapter 8), or by appending one ormore existing molecules (see Append Molecule(s)... from the Filemenu; Chapter 8), or using the clipboard, or by dragging from anexternal window. Copy a molecule into the clipboard by first selecting(clicking on) it, and then selecting Copy from the Edit menu.Alternatively, click on its entry (“Label”) in its spreadsheet, and thenselect Copy from the Edit menu. The latter permits several molecules
* Label reassignment is accomplished through the Atom Properties dialog (see discussionearlier in this chapter).
Chapter 14.2 12/31/03, 8:20 AM214

215
to be selected (and copied) at once using the Shift and Ctrl keys inthe usual manner. Move the contents of the clipboard to its destinationby clicking on an empty row header in the spreadsheet (for thedestination list), and then selecting Paste from the Edit menu. Copya molecule from an external (to Spartan’04) window, by first selectingthe molecule, and then dragging it from the external window onto theopen spreadsheet (associated with the destination list) inside ofSpartan’04. Several molecules can be selected (and dragged) at onceusing the Shift and Ctrl keys in the usual manner.
A row may be deleted from a spreadsheet (causing the correspondingmolecule to be deleted form a list), either by first selecting the moleculeand then selecting Delete Molecule from the File menu, or by firstclicking on its “Label” in the spreadsheet (leftmost column) and theneither clicking on the Delete button at the bottom of the spreadsheet,or by selecting Delete Selected from the menu which appears whenthe right mouse button is pressed (with the cursor over thespreadsheet). In all cases, a warning is provided prior to deletion. Anentire column in the spreadsheet may be deleted by first clicking onthe column header (the title) and then clicking on the Delete button(or Delete Selected from the menu).
Rows in the spreadsheet may be sorted according to the numericalvalues in any column by first clicking on the column header and theneither clicking on the Sort button at the bottom of the spreadsheet orby selecting Sort from the menu which appears when the right mousebutton is pressed (with the cursor over the spreadsheet). The rowsare placed in ascending order, the smallest (least positive) value ofthe selected property at the top, largest (most positive) value at thebottom. To sort in descending order, hold down the Shift key beforeyou click on the Sort button.
Totals and averages of column values may be obtained by firstselecting new (blank) row header, then clicking on Add... and finallyselecting “Totals” and/or “Averages” from the (Add Summaries)dialog which results.
A button at the bottom right of the spreadsheet toggles betweennumerical representation of data “f(x)” and formula presentation “=?”.
Chapter 14.2 12/31/03, 8:20 AM215

216
The spreadsheet may be printed by selecting Print Spreadsheet...from the File menu (which has replaced Print... when a spreadsheetis selected). It may be removed by clicking on .
Plots...
Plots may be constructed from data in a spreadsheet and a variety ofsimple “curves” fit to these data. Selection of Plots... from the Displaymenu leads to the Plots dialog.
This has two variants depending on the tab at the top of the dialog“XY Plot” (two dimensions) or “XYZ Plot” (three dimensions). Atthe outset, XY Plot will be selected.
The “XY Plot” variant incorporates an X Axis menu designating themolecular property to be displayed among the X axis, and a list ofproperties to be displayed along the Y axis. These properties correspondone to one to the columns in the associated spreadsheet. To constructa 2D plot, select an item from the X Axis menu, then click on one ormore items from the Y Axes list and finally click on OK. (Repeatedclicking on a property in the Y Axes list turns it “on” and “off”.) Thedialog is removed from the screen and a plot appears.
Chapter 14.2 12/31/03, 8:20 AM216

217
The plot can be moved about the screen. Select (click on) either theframe or on one of the curves (it will turn gold in response), thenhold down the right mouse button and drag the mouse. The plot mayalso be scaled (expanded or shrunk) by first selecting either the frameor one of the curves and dragging the mouse while holding downboth the right button and the Shift key. The plot may not be rotated.
The “XYZ Plot” variant is reached by clicking on the XYZ Plot tabat the top of the dialog. This leads to a new dialog.
This is very similar to the “XY Plot” variant, except that it incorporatesX Axis and Y Axes menus to designate quantities to be displayedalong the X and Y axes, respectively, as well as a list of properties tobe displayed along the Z axis. To construct a 3D plot, select one itemfrom each of the X Axis and Y Axis menus, then click on one or moreitems from the Z Axes list and finally click on OK. A plot appears.
Chapter 14.2 12/31/03, 8:20 AM217

The plot can be moved about the screen. Select (click on) either theframe or on one of the curves (it will turn gold in response), thenhold down the right mouse button and drag the mouse. The plot mayalso be scaled (expanded or shrunk) by first selecting either the frameor one of the curves and dragging the mouse while holding downboth the right button and the Shift key. Finally, 3D plots (unlike 2Dplots discussed earlier) may be rotated, by first selecting either theframe or one of the curves and dragging the mouse while holdingdown the left button.
Plots initially presented to the user draw smooth curves (cubic splines)through the data points. Different types of “curve fits” as well as avariety of different presentation formats are available under the PlotProperties and associated dialogs (see Properties earlier in thischapter).
A plot may be deleted by first selecting (clicking on) Delete from theBuild menu, or clicking on , or holding down the Delete key, andthen clicking on either the plot frame or on an individual curve.Clicking on the frame removes it and all associated curves, whileclicking on a curve removes only this curve. However, the last curvedeleted also deletes the frame.
218
Chapter 14.2 12/31/03, 8:20 AM218

219
Chapter 15The Search Menu
This chapter describes functions available under the Search menu.These provide substructure searching of the Cambridge StructuralDatabase of experimental X-ray crystal structures, both replacementfrom and substructure searching of the Spartan Molecular Databaseof calculated structures, energies and properties, a facility forguessing transition states for “new” reactions based on theirsimilarity to transition states in an extensive reaction database, anda procedure for identifying tautomers.
The Search menu provides access to the Cambridge Structural Databaseof experimental X-ray crystal structures, as well as the SpartanMolecular Database of calculated molecular structures, energies andproperties, a facility for guessing transition state geometries and aprocedure for identifying tautomers.
Databases ( )
Access to two databases is provided under this heading; theCambridge Structural Database (CSD) of experimental X-ray crystalstructures and the Spartan Molecular Database (SMD) of calculatedstructures, energies and molecular properties. Both databases maybe searched on the basis of a “substructure”. In addition, SMD isaccessed automatically (and its results made available) whenever anentry is selected on screen.
Chapter 15 12/31/03, 8:22 AM219

220
Cambridge Structural Database (CSD)
The Cambridge Structural Database (CSD) is a collection of morethan 300,000 experimental X-ray crystal structures for organic andorganometallic molecules. It is maintained by the CambridgeCrystallographic Data Centre (CCDC) and grows approximately 10%per year.* CSD not only contains information about the moleculargeometry, but also about crystal packing and, more generally, aboutintermolecular interactions. However, Spartan’04’s interface to CSDpermits access only to “molecular” information**. Even with thislimitation, the CSD represents a “gold mine” of detailed experimentalstructural information (bond lengths and angles as well asconformations), and also serves to identify molecules which can be(and have been) synthesized and purified through crystallization.
Access to the data in CSD is via a substructure searching procedure.A molecule is first constructed in the usual way, identifying one ormore free valences in places where the structure is to be “grown”.For example, to search for all molecules related to camphor, i.e.,with different substituents on the sp3 carbon occupying the bridgeheadposition adjacent to the carbonyl group, the following “substructure”would be constructed, and a growth point (a free valence on the *’edcarbon) designated.
OC*
Access to CSD is provided by clicking on the CSD tab at the top ofthe Database dialog. This gives rise to the CSD dialog.
* CSD is not included with Spartan‘04 but is available by subscription from CCDC or one of itsdistributors. Contact Wavefunction for information. For installation instructions, see Appendix G.
** This additional information may be accessed using CCDC’s Windows’ program “ConQuest”, whichis supplied as part of the CSD subscription.
Chapter 15 12/31/03, 8:22 AM220

221
This contains a window at the left for previewing structures, a box atthe right for listing “hits” on CSD as well as examining the text outputfrom the search, and buttons at the bottom to control various aspectsof the search and subsequent transfer of CSD data into Spartan’04’sfile system. A substructure search is set up by specifying one or moreof the following*:
(i) Attachment Points
Free valences are designated as attachment points by clickingon them in the structure model. The “free valences” will bereplaced by orange cones. Clicking again will remove thedesignation and return the free valences. As many attachmentpoints as desired may be specified. Anything may be “grown”off an attachment point (including hydrogen). The coordinationof the atom where attachment is made is maintained. Note,that free valences which are not identified as attachment pointsare assumed to be hydrogens.
In the case of a search for camphor derivatives resulting fromsubstitution on the sp3 carbon at the bridgehead position adjacent
* If nothing is specified, a search for an “exact” match is carried out (all free valenes are assumed to behydrogens).
Chapter 15 12/31/03, 8:22 AM221

222
to the carbonyl group, it is necessary to click on the free valenceat this position. The structure display will now appear as follows,with an “orange cone” replacing the free valence.
The camphor search requires no further specifications ofsubstructure, although two other aspects of substructuredesignation may be required to carry out other searches.
(ii) Wild-Card Atoms
An atom may be designated as a “wild card” (no checking ofatom type) by clicking on it. The ball in the model (designatinga specific atom type) will turn orange (designating any atomtype). Clicking on a wild-card atom removes the wild carddesignation. As many wild-card atoms as desired may bespecified.
Use of wild card atoms will result in structures whichincorporate variants of the original substructure with differentatoms at designated positions. For example, use of a phenylether substructure with one of the ring atoms designated as awild card (*) could result in “hits” with pyridyl ethers.
O
N
O
*
substructure CSD "hit"
Note, that coordination around a wild-card atom is notmaintained.
Chapter 15 12/31/03, 8:22 AM222

223
(iii) Wild-Card Bonds
A bond may be designated as a “wild card” by clicking on it. Aorange cylinder will be drawn around it. Clicking on this cylinderremoves it and reverts designation of bond type back to theoriginal. As many wild-card bonds as desired may be specified.
Wild-card bonds are often essential in dealing with heteroatom-containing molecules, in particular, heterocycles.* Their useimplies change in coordination.
After a substructure has been fully specified, search of CSD is carriedout by clicking on the Search button at the bottom right of the dialog.If there are “hits” to be found, these will begin to appear in the box atthe right of the dialog after a few seconds. The entire search willrequire between a few seconds and one or two minutes, dependingon the query (and on the speed of the computer). It can be terminatedat any time by clicking on to the right of the Search button at thebottom right of the dialog. Once completed (or stopped), the “CSDref codes” and the names for the “hits” are displayed in the box andthe number of “hits” is indicated immediately below. Actual structuraldata are available only for entries preceded by a filled yellow circle(the vast majority of entries). Other entries (designated by opencircles) for which structure data are not available are provided forcompleteness only. A 3D structure for any entry for which it isavailable (yellow circle) may be seen by clicking on its name in thebox. The ball-and-wire model is displayed in the window at the leftof the dialog, and its name appears immediately below the window.
* This is closely related to identification of tautomers. See discussion later in this chapter.
Chapter 15 12/31/03, 8:22 AM223

224
The model can be manipulated (rotated, translated, scaled) inside thewindow with the usual mouse/keyboard commands (you need toposition the cursor inside the window), but the model style cannot bechanged, nor can geometrical measurements be made. These requirethat selected entries be transferred to the file system (see below).
Note, that the information available for preview is exactly as it appearsin CSD. In particular, it may contain two or more different molecules,two or more different conformations of the same molecule and/orextraneous molecules (most commonly solvent molecules andcounterions). Hydrogens will be shown only where they have beenassigned in the experimental structure. Finally, the preview may containerrors in bonding due to uncertainties in the original data and/or crystalimperfections. “Filters” are available to address some of these issuesprior to transfer of one or more hits to Spartan’04’s file system. Inaddition, the destination of the retrieved data may be specified.Available retrieval options are found in the Retrieve Options dialogaccessed by clicking on to the right of the Retrieve button at thebottom of the CSD dialog.
Chapter 15 12/31/03, 8:22 AM224
225
(i) Retrieve to:Selection toggles between New Document and CurrentDocument. Selection of the former results in request for afile name; selection of the latter results in the retrievedmolecules being appended to the end of the current moleculelist.
(ii) Delete Extraneous FragmentsIf checked, this deletes any “detached molecules” whichdo not contain the original substructure. These will mostcommonly be trapped solvent molecules or counterions.
(iii) Repair BondsIf checked, this attempts to “fix” obvious bond typing errorsbased on the actual geometry in the CSD entry, and onnormal rules of valence.
(iv) Grow HydrogensIf checked, this “grows” hydrogens wherever they are (orappear to be) missing. “Growth” is based on the actual 3Dstructure and on normal valence rules. This is the samefunction that is available under Grow Hydrogens in theMolecule Utilities dialog (see Chapter 14).
(v) Freeze Heavy AtomsIf checked, this “freezes” all atoms except for hydrogens.This allows experimental X-ray hydrogen positions, whichare typically much too short, to later be refined using
Chapter 15 12/31/03, 8:22 AM225

226
molecular mechanics or quantum chemical methods, whilemaintaining the heavy atom skeleton.*
The Retrieve Options dialog is dismissed with all changes to existingsettings maintained by clicking on OK. Clicking on Cancel or on also dismissed the dialog but any changes to settings are lost.
Retrieval is accomplished by first selecting (clicking on) one or more“hits” in the box and then pressing the Retrieve button at the bottomof the CSD dialog. The Shift and Ctrl keys may be used to specifyretrieval of multiple hits. A block of entries may be specified by clickingon the top (or bottom) entry, then holding down the Shift key andfinally clicking on the bottom (or top) entry. Multiple entries may bespecified by clicking on each in turn while holding down the Ctrl key.The retrieve process can be stopped at any time by clicking on tothe right of the Retrieve button at the bottom of the CSD dialog.
If Implicit Search in the Miscellaneous Preferences dialog(Preferences... under the Options menu; see Chapter 16) has beenset, a search of CSD is performed in “build mode” each time a changeis made to the molecular structure.** This search assumes that all freevalences are attachment points, insuring the maximum number ofhits. The CSD dialog does not need to be open on screen (but may beopened at any time to examine the resulting “hits”). However, runningtotal of hits is provided at the bottom right of the screen wheneverimplicit search has been invoked.
* Hydrogen positions may be refined using the MMFF molecular mechanics model usingMinimize from the Build menu ( button). Refinement using quantum chemical models isspecified in the Calculations dialog (Setup menu) by way of Frozen Atoms. See discussionin Chapter 13.
** Use of implicit search may seriously degrade graphics performance during molecule buildingand should be switched off unless desired.
Chapter 15 12/31/03, 8:22 AM226

227
Spartan Molecular Database (SMD)
The Spartan Molecular Database (SMD) is a collection of more than50,000 molecules, the structures, energies, and selected properties ofwhich have been obtained from up to five different theoretical models:Hartree-Fock models with 3-21G and 6-31G* basis sets, EDF1/6-31G*and B3LYP/6-31G* density functional models and the MP2/6-31G*model. An entry is specified by a three-dimensional connectivityencoded as a one-dimensional (SMILES like) character string togetherwith a theoretical model. Structural isomers, e.g., cis-trans isomers aredistinguished as are diasteromers, but enantiomers are not distinguished.
SMD is open-ended and users may construct parallel databases withadditional molecules and/or results from additional theoretical modelson existing molecules (see Appendix H). Future extensions of SMDwill include transition-metal inorganic and organometallic compoundsand transition states as well as calculations using higher-level models.
While the majority of entries are represented in terms of a single“lowest-energy” conformer (see text box below), some entries arerepresented in terms of two or more conformers. In these cases, theavailable conformers will be ranked according to energy, and theuser needs to choose among them.
The individual entries supplied in SMD have been obtained according tothe following “recipe”.
1. Identify the lowest-energy conformer using molecular mechanics andthe MMFF (Merck) force field. Systems with only a few degrees ofconformational freedom are searched systematically “guaranteeing”location of the global minimum, while a Monte-Carlo search is appliedto more complicated systems. The latter does not guarantee locationof the global minimum.
2. Starting from the best conformer located, perform a geometryoptimization using the appropriate quantum chemical model. Thisgenerally means that all quantum chemical calculations for a particularmolecule will refer to the same conformer.
Chapter 15 12/31/03, 8:22 AM227

228
At the present time, SMD may be accessed in one of two ways: “exact”replacement of a structure with a database entry corresponding to aparticular quantum chemical model, and location of entries in thedatabase (corresponding to one or more quantum chemical models)which contain a particular substructure. The latter is strictly analogousto the way in which Spartan’04 accesses the Cambridge StructuralDatabase (see previous discussion).
Replacement
The existence of one or more database entries (corresponding todifferent quantum chemical models) for the selected molecule isindicated by its name being displayed at the bottom of the screen.
Details are provided by clicking on to the immediate left of themolecule name (it then changes to ). This brings up a dialog whichcomprises a viewing screen on the left and a list of quantum chemicalmodels for which database entries exist on the left.
Upon initial entry, the topmost entry in the list is checked and a ball-and-spoke model corresponding to its structure appears in the viewingscreen. This model can be rotated, translated and scaled using theusual mouse/keyboard commands (you need to position the cursorinside the viewing area). The model may be made to “tumble”automatically by checking the box to the left of Replace All at thebottom of the dialog. Model style may not be changed. A differentdatabase entry (corresponding in this case to a different quantumchemical model) may be selected by checking the box to the left ofthe name of the quantum chemical model in the dialog.
The selected (on-screen) molecule may be replaced by the selecteddatabase entry by clicking on Replace at the bottom of the dialog.
Chapter 15 12/31/03, 8:22 AM228

229
(Replacement can be “undone” by selecting Undo from the Editmenu; see Chapter 9). Note that replacement destroys anyinformation associated with the molecule being replaced.
Some database entries also comprise information on higher-energyconformers (in addition to that on the “presumed” ground-stateconformer). These entries are designated by a icon to the left of thecheck box. Checking this icon leads to an expanded entry which allowsaccess to these higher-energy conformers, as well as provides theirrelative energies (in kcal/mol).
Entries are selected as before, at which time they may be examinedin the viewing screen or used to replace the on-screen molecule.
In the event that the selected (on-screen) molecule is a member of alist, it is possible to replace all members of the list for which databaseentries are available. This is accomplished as above except that ReplaceAll instead of Replace is used. A warning message is provided priorto replacement. Note that the lowest-energy conformer for all other(non-selected) molecules in the list is used even though a higher-energyconformer may be indicated for the selected molecule. (Replacementof list entries with non lowest-energy conformations may be done oneby one using Replace instead of Replace All.) Also note that moleculesin the list for which there are no database entries are not affected.
Substructure Searching
Substructure searching from SMD is very similar to that from CSDdescribed previously, in that all that is required is specification ofone or more “growth points”. It differs in that SMD contains multiplesets of results (corresponding to different theoretical models), and it
Chapter 15 12/31/03, 8:22 AM229

230
is necessary to specify which model (or which set of models) is to beemployed.
Access to SMD is provided by clicking on the SMD tab at the top ofthe Database dialog. This gives rise to the SMD dialog.
Like the CSD dialog, the SMD dialog contains a window on the leftfor previewing structures and a box on the right for listing “hits” onSMD, as well as buttons at the bottom to control various aspects ofthe search and subsequent transfer of data into Spartan’04’s filesystem.
A substructure search is set up by specifying one or more attachmentpoints, in the same manner as for CSD (see previous discussion).“Wild-card” atoms and bonds are not available.
Prior to starting the actual search, it is necessary to specify whichtheoretical model or set of models is to be included. Modelspecification as accomplished by clicking on to the right of theSearch button at the bottom right of the dialog. This brings up theSearch Options dialog.
Chapter 15 12/31/03, 8:22 AM230

231
Checking the appropriate boxes specifies the appropriate model(s).
In general, SMD contains more data for the simpler models (3-21G and6-31G*) than for the more complicated models (EDF1/6-31G*, B3LYP/6-31G* and MP2/6-31G*). In fact, only a few thousand entries areavailable with the MP2/6-31G* model in the initial release of the database.
Specification of Other provides access to data with theoretical modelsother than those explicitly mentioned in the dialog. Clicking on OKremoves the dialog. (Clicking on Cancel or on also removes thedialog, but selections are not made.)
Following specification of attachment points and designation of theorylevel(s), a search on SMD is carried out by clicking on the Searchbutton at the bottom right of the dialog. If there are hits to be found,these will begin to appear in the box at the right of the dialog after afew seconds. The entire search will require between a few secondsand one or two minutes, depending on the query (and on the speed ofthe computer). It can be terminated at any time by clicking on tothe right of the Search button at the bottom right of the dialog.Database hits are displayed in the box at the right of the dialog*. A 3Dstructure for a particular hit may be previewed by clicking on its namein the box. The ball-and-wire model is displayed in the window at theleft of the dialog, and its name appears immediately below the window.
* Normally, only the name of the molecule is visible, but molecular weight and basis set may also bedisplayed by appropriately sliding the header cells at the top of the box.
Chapter 15 12/31/03, 8:22 AM231

232
The model can be manipulated (rotated, translated, scaled) inside thewindow in the usual way, but the model style cannot be changed, norcan geometrical measurements be made. These require that selectedentries be transferred to the file system (see below).
Prior to retrieval of one or more database hits, it is necessary to specifya destination. This is accomplished with the Retrieve Options dialog,brought up by clicking on to the right of the Retrieve button at thebottom center of the dialog.
Selection of destination is accomplished by toggling between NewDocument and Current Document. Selection of the former resultsin request for a file name; selection of the latter results in the retrievedmolecules being appended to the end of the current molecule list.
Chapter 15 12/31/03, 8:22 AM232

233
The Retrieve Options dialog is dismissed by clicking on OK.Clicking on Cancel or on also dismissed the dialog but any changesto settings are lost.
Retrieval is accomplished by first selecting (clicking on) one or morehits in the box and then pressing the Retrieve button at the bottom ofthe SMD dialog. The Shift and Ctrl keys may be used to specifyretrieval of multiple hits. A block of entries may be specified by clickingon the top (or bottom) entry, then holding down the Shift key andfinally clicking on the bottom (or top) entry. Multiple entries may bespecified by clicking on each in turn while holding down the Ctrl key.The retrieve process can be stopped at any time by clicking on tothe right of the Retrieve button at the bottom of the SMD dialog.
Transition States ( )
Spartan’04 provides a facility for guessing transition state geometriesbased on the similarity of the reaction of interest with one or moreentries in Spartan’s reaction database. An exact hit is possible, inwhich case the guess will be the “exact transition state”*. Morecommonly, this will not be the case, and Spartan will attempt toprovide as close a match as possible with a database entry. This willgenerally involve a less substituted system or one in which substituentsdiffer. Here, Spartan will use those parts of the structure of thetransition state in the database which are common, and will optimizethe remaining parts (using molecular mechanics). No conformationalsearching is performed, and it is essential that the reactants be properlyoriented to reflect the desired stereochemical outcome of the reaction.In this regard, whenever a reaction involves a change in themolecularity, i.e., A + B → C, it will generally be easier to start fromthe “unimolecular side” (the product in the above).
Where a reaction is completely unknown to the database, a fallbacktechnique similar to the linear synchronous transit method isautomatically invoked.
* More precisely, the transition state supplied in this case will be exact for the particular theoreticalmodel entered in the database. At the present time, the majority of database entries derive from verysimple (semi-empirical and Hartree-Fock) quantum chemical models.
Chapter 15 12/31/03, 8:22 AM233

234
Input to Spartan’04’s transition-state guessing procedure will be veryfamiliar to (organic) chemists, in that it is based on “arrow pushing”.The reaction is specified using curved arrows, where each arrowidentifies the movement of one electron pair. The direction of electronflow follows customary practice:
source of electron pair
destination ofelectron pair
There are only two possible “sources” of an electron pair and only threepossible destinations, leading to six combinations:
lone pair → lone pair move lone pair
lone pair → bond use lone pair to increase bond order
lone pair → “space” use lone pair to create new (single) bond
bond → lone pair decrease bond order to make lone pair
bond → bond decrease order of one bond to increase orderof another bond
bond → “space” decrease order of one bond to make a new(single) bond
Note that the first of these is a “null” operation, and its inclusion isoptional.
Selecting Transition States results in a message at the bottom left ofthe screen.
The “tail” of the arrow corresponds to the source of the electron pair.If the source is a lone pair, then select the appropriate atom. If thesource is a bond, then select the appropriate bond. Clicking on anatom or bond highlights (colors gold) the atom or bond and leads toa new message at the bottom left of the screen.
The “head” of the arrow corresponds to the destination of the electronpair. If the destination is an atom (leading to a lone pair), then select
Chapter 15 12/31/03, 8:22 AM234

235
this atom. If the destination is an existing bond (leading to an increasein bond order from single → double → or double → triple), thenselect the appropriate bond. If no bond presently exists at thedestination, press the Shift key and select the two atoms that willbecome bonded. All of these operations lead to a curved arrow beingdrawn on the reactant structure, and to the original message at thebottom left of the screen.
The process (tail selection followed by head selection) is repeatedas necessary to fully define the reaction. Incorrect reaction arrowsmay be removed by selecting Delete from the Build menu ( )followed by clicking on the arrow to be deleted. In the latter case,you need to again select Transition States ( ) in order to continuearrow selection. Alternatively, click on the arrow(s) to be deletedwhile holding down the Delete key
After all reaction arrows have been designated, clicking on at thebottom right of the screen replaces the “reactant” with a “guess” at thetransition state. In the event that the guess is “unreasonable”, this lastoperation may be “undone” by selecting Undo (Edit menu). This allowsyou to review your assignment of arrows and make changes as needed.
Tautomers ( )
Spartan’04 provides a facility for automatically identifying isomersarising from (rapid) transfer of hydrogens among heteroatoms, thatis, so-called tautomers. Tautomer identification is especially importantin dealing with heterocyclic compounds where two or more differenttautomers may exist in equilibrium and the identity of the dominanttautomer may not be apparent, e.g.
NHN OOH
2-hydroxypyridine 2-pyridone
Chapter 15 12/31/03, 8:22 AM235

236
Having the “correct” tautomer may be essential in searches of theCambridge Structural Database (CSD). For example, a search of the currentCSD for derivatives of 2-hydroxypyridine yields no “hits” whatsoever,whereas a search for derivatives of 2-pyridone yields multiple hits.
The procedure incorporated into Spartan’04 is limited to tautomersinvolving nitrogen, oxygen, phosphorous and sulfur. Tautomersinvolving carbon, in particular, have been excluded. Within theselimits, the procedure attempts to locate all possible tautomers, butmakes no attempt either to remove duplicates or to remove tautomerswhich are likely to be highly unfavorable.*
The existence of tautomers is automatically sensed by Spartan’04and is signaled by the word “Tautomer” being displayed at the bottomright of the screen. (No further action needs to be taken if tautomeridentification is not of interest.) If tautomers exist, individualstructures may be examined or a complete list of structures generatedby selecting Tautomers from the Search menu (or clicking on the
icon from the Search toolbar). Following this, clicking on and buttons at the bottom right of the screen moves backwards and
forwards through the list of tautomers. Clicking on (at the bottomright of the screen) leads to an informative dialog.
Clicking on OK dismisses the dialog and leads to a new (unnamed)file containing the full list of tautomers. (The original file isunaffected.) Clicking on either Cancel or dismisses the dialogwithout a tautomer list being generated.
* Of course, once a complete list of tautomers has been generated it is straightforward to calculate theirrelative energies using any of Spartan’04’s quantum chemical models.
Chapter 15 12/31/03, 8:22 AM236

237
Chapter 16The Options Menu
This chapter describes functions under the Options menu. These setcolors and user preferences and monitor jobs.
Functions under the Options menu provide information and allowfor setting user preferences.
About...
Provides information about the user’s release of Spartan‘04.
Chapter 16 12/31/03, 8:24 AM237

238
A menu at the bottom of the dialog provides version numbers andrelease dates for specific components of Spartan’04. The dialog isremoved by clicking on OK.
Preferences...
This sets up a number of preferences relating to the graphical userinterface in general (Miscellaneous), to molecule displays (Molecules),and to the change of van der Waals radii (VDW Radii). It also specifiesthe locations of a user-defined molecule database (Paths).
Selection results in one of four dialogs, depending on whether theMiscellaneous, Molecule, VDW Radii or Paths tab (at the top ofthe dialog) has been selected in the previous entry.
Miscellaneous
Upon first entry, the Miscellaneous tab will be selected, and theMiscellaneous Preferences dialog displayed
(i) View: Orthogonal/PerspectiveControls the view of structural models and graphics.
(ii) Global Rotate: Screen Centered/Molecule CenteredScreen Centered provides a single center for rotation
Chapter 16 12/31/03, 8:24 AM238

239
of all molecules on screen, while Molecule Centeredrotates each molecule about its individual center.
(iii) JPEG QualityA slider bar controls the resolution of JPEG output.
(iv) Toolbar StyleControls presentation (text vs. icons) and size of the icons.
(v) Element OverlayIf checked, this highlights elements in the expert modelkit for which the model specified in the Calculationsdialog are available.
(vi) Fast RotateIf checked, this lowers the resolution of structure models(only) during rotation. This is used to improve graphicsperformance for displays of larger molecules.
(vii) Split-TubesIf checked, the “tubes” in tube and ball-and-spokemodels will be split to designate multiple bonds.
(viii) StereoIf checked, this turns “on” stereo. The viewer must wearred/blue glasses. Also turned “on” with the “3” key (seeKeyboard Functions in Chapter 2).
(ix) CSD InterfaceIf checked, this displays the CSD tab in the Databasedialog (Search menu). Turn “off” if CSD is not installed.
(x) Implicit SearchIf checked, this performs a search of CSD every time achange is made to the molecular structure, assuming thatall free valences are attachment points.
(xi) Classic Builder StyleIf checked, this reverts to the builder style used in earlierversions of Spartan.
Chapter 16 12/31/03, 8:24 AM239

240
(xii) Animation SpeedA slider bar controls the maximum speed for vibrationsand animations.
(xiii) PDB Water FilterIf checked, removes water molecules from importedPDB files.
Molecule
Clicking on the Molecule tab leads to the Molecule Preferencesdialog.
This specifies global default settings for model and label types aswell as specification of whether or not constraint and frozen atommarkers are shown, whether or not points, planes and reaction arrowsare shown and whether or not labels for bonds, points, planes,constraints, amino acid residues and reaction arrows are shown. Thesesettings may be overridden for a specific molecule (or list ofmolecules) using entries under the Model menu and for specificportions of a molecule using entries associated with Properties underthe Display menu.
Chapter 16 12/31/03, 8:24 AM240

241
VDW Radii
Clicking on the VDW Radii tab leads to the VDW Radii Preferencesdialog.
This provides as list of van der Waals radii for elements ordered eitherby element name (click on “Element”) or by atomic radius (click on“VDW Radius”). Individual entries can be changed from defaultvalues by first clicking on the entry and then entering a new value.The currently selected entry can be returned to its default radius byclicking on Reset Selected at the bottom of the dialog, and the fullset of radii may be returned to their default values by clicking onReset All at the bottom of the dialog.
Chapter 16 12/31/03, 8:25 AM241

242
Paths
Clicking on the Paths tab leads to the Paths Preferences dialog.
This allows the path to be set for a user-defined database (seeAppendix H).
To exit the Preferences dialog click on OK; clicking on Cancel oron exits the dialog without instituting any changes.
Colors
This is used to alter the default colors of most graphical objects.Selection leads to the Colors dialog.
Chapter 16 12/31/03, 8:25 AM242

243
An object first needs to be selected by clicking on it, after which itscolor may be set by adjusting the Red, Green and Blue slider bars.The default color (which depends on the object) may be selected byclicking on Default. Color selection may be performed for as manyobjects as desired, and applies to all objects of the same type, e.g.,carbon atoms, and not just to the selected object. Further control ofcolors is available under Properties in the Display menu (seeChapter 14). Clicking on removes the dialog.
Fonts...
This allows user selection of fonts, style and size of labels attachedto molecules (see Labels and Configure... under the Model menu;Chapter 10), and attached to plots (Plots... under the Display menu;Chapter 14). Selection leads to the Fonts dialog.
Selections need to be made from the Font, Font Style and Size menus.Clicking on OK dismisses the dialog with selections kept. Clickingon Cancel or on dismisses the dialog but selections are lost.
Chapter 16 12/31/03, 8:25 AM243

244
Monitor
Results in the Monitor dialog which lists all jobs which are presentlyexecuting or are queued for execution.
The box at the top gives the name of the job and the job status, i.e,either the name of the module presently executing or the word“queued”. To see accumulated output for an executing job, click onits name. To kill a job, click on its name, and then select Kill Selectedfrom the Edit menu at the top of the Monitor dialog. To start a queuedjob (irrespective of the imposed queue limits; see below), click on itsname and then select Start Selected from the Edit menu.
Queue limits as well as limits on memory and disk for an individualprocess may be set using Limits under the Options menu at the topof the Monitor dialog.
Maximum Concurrent Jobs sets the maximum number of jobs thatcan be run at one time and Memory and Disk Space set maximum
Chapter 16 12/31/03, 8:25 AM244

245
amounts of memory and disk for a single job. The dialog is dismissedwith changes instituted by clicking on OK. Clicking on Cancel or on
dismisses the dialog but changes are lost.
Hartree-Fock calculations (only) will automatically make use of a fast“in memory” algorithm if sufficient memory is available. 100 basisfunctions can be accommodated with 110MB, 110 basis functions with150MB, 120 basis functions with 200MB and 130 basis functions with300MB. In this case, it may be advantageous to limit the number ofmaximum concurrent jobs to 1 in order to maximize available memory.
The Monitor may be removed either by selecting Exit from the Filemenu or by clicking on at the top of the dialog.
Calculator
Selection brings up a Calculator.
This functions the same way as a normal “pocket calculator”. TheCalculator is removed by clicking on .
Model Kit
If checked, this signifies that a model kit (entry, expert, peptide ornucleotide) is to remain on screen.
Chapter 16 12/31/03, 8:25 AM245

246
File Toolbar, Build Toolbar, Geometry Toolbar, Search Toolbar
If checked, this provides display of toolbars which access functionscontained in the File, Build, Geometry and Search menus, respectively.
Cascade, Tile
Arranges open windows in a cascade or as tiles on top of Spartan’04’S
main window.
Arrange Icons
Arranges icons at bottom of Spartan’04’S main window.
Chapter 16 12/31/03, 8:25 AM246

247
Chapter 17The Help Menu
This chapter describes on-line help.
Spartan’04’s on-line help facilities are available under the Help menu..
On-Line Help
This provides information relating to application of computationalmethods in general, and to methods available in Spartan’04 inparticular, as well as technical details regarding the program’soperation.
The following topics make up on-line help:
Using the MouseKeyboard FunctionsCalculation Options
Relative Computation TimesGeneral Operating Features
Selecting a ModelMemory Usage
The Spartan’04 Tutorial and User’s Guide (this document) is alsoavailable under On-Line Help. Help files are HTML documents andrequire that Internet Explorer be installed.
Finally, note that several of Spartan’s dialogs incorporate imbeddedhelp messages. These dialogs contain at the upper right (to theimmediate left of ). Clicking on , followed by clicking on a menu,button, etc. in the dialog gives rise to a brief informative messageabout the menu, button, etc.
Chapter 17 12/31/03, 8:26 AM247

Chapter 17 12/31/03, 8:26 AM248

249
Appendix ACapabilities and Limitations
Essential Edition of Spartan’04 for Windows
Spartan’04 for Windows is available in two versions: a “full” versionwhich is referred to as Spartan’04 and a lower-cost version, which isreferred to as the “Essential Edition”. The latter shares the samegraphical user interface as the full version, but lacks a number of the“more advanced” quantum chemical models as well as the ability tofollow an intrinsic reaction coordinate, to calculate UV/visible andNMR Spectra and to perform molecular dynamics solvent calculations.
Molecular Mechanics Models1
The molecular mechanics module provides for the calculation ofequilibrium geometries, strain energies and vibrational frequencies,as well as for conformational searching. SYBYL (Tripos, Inc.) andMMFF94 (Merck Pharmaceuticals) force fields are available. Thereare no atom limits for molecular mechanics calculations.
Molecular mechanics parameters are read from a set of files:SYBYL.spp (SYBYL parameters) and MMFF94.spp (MMFFparameters). New parameters may be added or existing parametersmodified by accessing these files.
Semi-Empirical Models1
The semi-empirical module provides for calculation of heats offormation, wavefunctions, equilibrium and transition-state geometriesand vibrational frequencies, as well as for conformational searching.MNDO, AM1 and PM3 models are supported. MNDO/d replacesMNDO for second-row (and heavier) main-group elements, and PM3parameterizations for transition metals are available. MNDO has beenparameterized for H, He, Li-F, Al-Cl, Ca, Zn, Ge, Br, Cd, Sn, I, Hg
Appendix A 12/31/03, 7:47 AM249

250
and Pb; AM1 for H, B-F, Al-Cl, Zn, Ge, Br, Sn and I; PM3 for H-Ne,Mg-Ar, Ca, Ti-Br, Zr, Mo-Pd, Cd-I, Hf-Pt and Hg-Bi and Gd.
Preset limits for semi-empirical calculations are enumerated below.
maximum number of atoms (any type) 300
Semi-empirical parameters are read from a set of files: MNDO.spp(MNDO parameters), MNDOD.spp (MNDO/d parameters), AM1.spp(AM1 parameters), PM3.spp (PM3 parameters) and PM3D.spp (PM3parameters for metals). New parameters may be added or existingparameters modified by accessing these files.
Hartree-Fock Models1-3
The Hartree-Fock module provides for calculation of energies andwavefunctions, equilibrium and transition-state geometries andvibrational frequencies, as well as for conformational searching. Bothclosed-shell and open-shell (either ROHF or UHF) calculations aresupported with minimal (STO-3G), split-valence (3-21G) andpolarization (6-31G*, 6-311G*, cc-pVDZ4, cc-pVTZ4 and cc-pVQZ4)basis sets supplemented by additional polarization and/or diffusefunctions. Also available are pseudopotentials for calculations onmolecules incorporating heavy atoms.4
Preset limits for Hartree-Fock calculations are enumerated below.
maximum number of atoms 200maximum number of basis functions 2000
Density Functional Models1,2,4
The density functional module provides for calculation of energiesand wavefunctions, equilibrium and transition-state geometries andvibrational frequencies, as well as for conformational searching. Themodule supports local density calculations and BP, BLYP, EDF1,B3LYP density functional calculations. The same basis sets andpseudopotentials supported for Hartree-Fock calculations are
Appendix A 12/31/03, 7:47 AM250

251
available, although use of the minimal STO-3G and split-valence3-21G basis sets is strongly discouraged.
Preset limits for density functional calculations are enumerated below.
maximum number of atoms 200maximum number of basis functions 2000
Møller-Plesset Models1,2,4
The Møller-Plesset module provides MP2, MP3 and MP4, as well as“local” MP2 (LMP2) energy calculations. In addition, the MP2 model(only) may be used for calculating equilibrium and transition-stategeometries and vibrational frequencies, as well as for conformationalsearching. The same basis sets and pseudopotentials supported forHartree-Fock calculations are available, although use of the minimalSTO-3G and split-valence 3-21G basis sets is strongly discouraged.
Preset limits for MP2 calculations are enumerated below.
maximum number of atoms 200maximum number of basis functions 2000
MP3 and MP4 calculations increase in cost very rapidly withincreasing molecular size and are presently practical only for smallmolecules.
Advanced Correlated Models1,2,4
The advanced correlated module provides for calculation of energiesusing the CCSD, CCSD(T), CCSD(2), OD, OD(T), QCISD,QCISD(T), QCCD and QCCD(2) correlated models. The same basissets and pseudopotentials supported for Hartree-Fock calculationsare also available, although use of the minimal STO-3G and split-valence 3-21G basis sets is strongly discouraged. Energy calculationsare also supported with the G2, G3, and G3(MP2) models, whichcomprise a series of different models and are intended to provideaccurate thermochemical data.
Appendix A 1/14/04, 1:37 PM251

252
Advanced correlated calculations increase in cost very rapidly withincreasing molecular size, and are presently practical only for verysmall molecules.
Excited-State Models
Two classes of models are available for calculations of excited states:configuration interaction (CI) models and time dependent densityfunctional (TDDFT) models. The former comprises two models: CIS(configuration interaction singles) and CISD (configurationinteraction singles with doubles correction), while the latter supportsthe local density model as well as BP, BLYP, EDF1 and B3LYP densityfunctional models. At the present time, only the CIS model is availablefor geometry optimization and frequency calculations, all othermodels being restricted to single-point energy calculations.
Preset limits for excited-state calculations are enumerated below.
maximum number of atoms 200maximum number of basis functions 2000
Properties and Spectra
The properties module (which is automatically called from themolecular mechanics module or one of the quantum chemicalmodules) provides for text output printing, population analyses(Mulliken, natural bond orbital and based on fits to electrostaticpotentials), evaluation of thermodynamic quantities (enthalpy, entropyand free energy), and calculation of the dipole moment. Aqueoussolvation energies, may be estimated using the SM5.4 model ofCramer and Truhlar5 (available for H, C-F, S-Cl, Br and I), and addedto gas-phase total energies obtained at other levels of calculation.Additionally, solvent effects on energies as well as molecularproperties and graphical surfaces, may be obtained from a moleculardynamics procedure in which the solvent-solute electrostaticinteractions are incorporated into the Hamiltonian for the solute.4
Appendix A 1/14/04, 1:37 PM252

253
1. For discussion and original references, see: W.J. Hehre, A Guide to Molecular Mechanicsand Quantum Chemical Calculations, Wavefunction, Irvine, 2003
2. For a review of the quantum chemical methods used in Spartan’04 (except for semi-empiricalmethods), see: J. Kong, C.A. White, A.I. Krylov, C.D. Sherrill, R.D. Adamson, T.R. Furlani,M.S. Lee, A.M. Lee, S.R. Gwaltney, T.R. Adams, C. Ochsenfeld, A.T.B. Gilbert, G.S.Kedziora, V.A. Rassolov, D.R. Maurice, N. Nair, Y. Shao, N.A. Besley, P.E. Maslen, J.P.Dombroski, H. Daschel, W. Zhang, P.P. Korambath, J. Baker, E.F.C. Byrd, T. Van Voorhis,M. Oumi, S. Hirata, C.-P. Hsu, N. Ishikawa, J. Florian, A. Warshel, B.G. Johnson, P.M.W.Gill, M. Head-Gordon, and J.A. Pople, J. Computational Chem., 21, 1532 (2000).
3. For an older account see: W.J. Hehre, L. Radom, P.v.R. Schleyer and J.A. Pople, Ab InitioMolecular Orbital Theory, Wiley, New York, 1986.
4. Not available in Essential Edition.5. C.C. Chambers, G.D. Hawkins, C.J. Cramer and D.G. Truhlar, J. Phys. Chem., 100, 16385
(1996).
The properties module is also responsible for providing data for laterplotting of vibrational (infrared) spectra (all models except MP3, MP4and advanced correlated models), UV/visible spectra4 (Hartree-Fock,local density and density functional models only) and NMR spectra4
(chemical shifts only and only for Hartree-Fock models).
Graphics
The graphics module provides for data preparation associated withthe display as surfaces, property maps and slices of molecular orbitals,electron densities, spin densities, electrostatic potentials and localionization potentials.
Appendix A 1/14/04, 1:37 PM253

Appendix A 12/31/03, 7:47 AM254

255
MenusFile
New Brings up a model kit for molecule buildingOpen... Opens (imports) a moleculeClose Closes a moleculeSave Saves (exports) a moleculeSave As... Saves a molecule under a user-specified nameNew Molecule Adds a molecule to an existing list; brings up
a model kit for molecule buildingDelete Molecule Deletes a molecule (or molecules) from a listAppend Molecule(s)... Appends a molecule (or molecules) to an
existing listPrint... Prints on-screen displayPrint Setup... Setup for printingExit Exits Spartan’04
Edit
Undo Undoes previous operationsCut Moves the current molecule or contents of the
selection box to the clipboardCopy Copies the current molecule or contents of the
selection box to the clipboardPaste Pastes contents of the clipboard to the screenFind... Locates a text string in the output dialog or an
on-screen molecular fragmentFind Next Locates next occurrence of a text string or
molecular fragmentCenter Centers the molecule on screenClear Clears the screen (build mode only)
Appendix B
Appendix B 12/31/03, 7:49 AM255

256
Model
Wire Displays structure as wire-frame modelBall and Wire Displays structure as ball-and-wire modelTube Displays structure as tube modelBall and Spoke Displays structure as ball-and-spoke modelSpace Filling Displays structure as space-filling modelHide Hides structure model from viewGlobal Model Applies model type and labels of current
molecule to all molecules in the listCoupled Couples motions of all molecules in the listHydrogens Toggles hydrogens “on” and “off”Labels Toggles labels “on” and “off”Ribbons Toggles ribbons “on” and “off”Hydrogen Bonds Toggles hydrogen bonds “on” and “off”Configure... Specifies labels for atoms, bonds, points,
planes, etc., in addition to information aboutindividual residues in polypeptides andpolynucleotides and ribbon displays
Geometry
Measure Distance Displays and/or sets bond distanceMeasure Angle Displays and/or sets bond angleMeasure Dihedral Displays and/or sets dihedral angleFreeze Center Freezes selected atomic positionsSet Torsions Selects bonds and rings for conformational
searchingConstrain Distance Constrains bond distanceConstrain Angle Constrains bond angleConstrain Dihedral Constrains dihedral angleDefine Point Defines a point as a geometric mean of a set
of atomsDefine Plane Defines a plane made by three atomsAlign Molecules Aligns molecules in a list
Appendix B 12/31/03, 7:49 AM256

257
Build
View Removes the model kitAdd Fragment Adds atomic fragment, functional group, ring,
ligand or custom fragmentDelete Deletes atoms, bonds, points, planes, etc.Make Bond Makes a bond between two free valences, two
atoms or a free valence and an atomBreak Bond Breaks a bondMinimize Performs molecular mechanics energy
minimization
Setup
Calculations... Sets up molecular mechanics and quantumchemical calculations
Surfaces Sets up generation of and displays graphicalsurfaces
Submit Submits job to the execution queue
Display
Output Displays text outputProperties Displays molecule, bond and atom properties
as well as information about geometricalconstraints, graphical surfaces, plots andstatistical analyses
Surfaces Sets up generation of and displays graphicalsurfaces (same as entry in Setup menu)
Spectra Displays IR, NMR and/or UV/visible spectraand animates vibrational modes (associatedwith IR spectra).
Spreadsheet Displays spreadsheet
Plots... Creates plots from the data in the spreadsheet
Appendix B 12/31/03, 7:49 AM257

258
Search
Databases Performs substructure search on theCambridge Structural Database (CSD) and/orthe Spartan Molecular Database (SMD)
Transition States Provides guess at transition states based onreaction database or, in the absence of asuitable database entry, based on the linearsynchronous transit method
Tautomers Identifies tautomers
Options
About... Provides information about Spartan’04,Wavefunction and Q-Chem
Preferences... Sets various run-time preferences
Colors Sets screen and model colors
Fonts... Sets fonts for molecule labels and plot displays
Monitor Monitors and allows for “killing” executingjobs as well as control job queue
Calculator “Pocket” calculator
Model Kit Keeps a model kit on screen
File Toolbar Toggles File toolbar “on” and “off”
Build Toolbar Toggles Build toolbar “on” and “off”
Geometry Toolbar Toggles Geometry toolbar “on” and “off”
Search Toolbar Toggles Search toolbar “on” and “off”
Cascade Arranges open windows in a cascade
Tile Arranges open windows as tiles
Arrange Icons Arranges icons at bottom of screen
Help
On-Line Help Provides information about computationalmethods in Spartan’04 and details aboutprogram usage.
Appendix B 12/31/03, 7:49 AM258

259
Appendix CCommonly-Used Program Options
This appendix describes a number of commonly-used programoptions. These are specified using keywords input into the Optionsbox in the Calculations dialog (Setup menu). Keywords are caseinsensitive. An equals sign (“=”) separates a keyword from its integer,real or character string value. Keywords may either be single wordsor expressions. Keyword=N indicates an integer argument,keyword=C indicates a character argument, and keyword=F indicatesa floating point argument. Real values can optionally include an “e”floating point power of ten. Default values for keywords are indicatedin bold, and alternative values in italics.
Conformational Search
Keywords associated with conformational searching are as follows:
keyword value description
SearchMethod C conformational searching method employed;overrides default choice which depends oncomplexity of system may be overridden withone of the following:Systematic use systematic methodMonteCarlo use Monte-Carlo method
MaxConfs N set maximum number of conformers to N; theprogram attempts to select the most diverseset representing the entire population; defaultis 100
Window F sets the maximum energy (in kcal/mol) atwhich a conformer will be kept to (minimumenergy + F), where minimum energy is the
Appendix C 12/31/03, 7:50 AM259

260
energy of the lowest energy conformerencountered at that point in the search; defaultis 10 kcal/mol
MaxItr N sets the number of iterations allowed for aMonte Carlo search (only) to N; default is afunction of the number of bonds and ringsinvolved in the search
StartTemperature F sets initial “temperature” (in K) for a MonteCarlo search (only) to F; high temperatureswill result in the molecule further “exploring”global space, while low temperatures willresult in the molecule further “exploring” localspace; default is 5000K
Geometry Optimization
Keywords associated with equilibrium geometry optimization (allmethods) and transition-state geometry optimization (quantumchemical methods only) are as follows:
keyword value description
GeometryCycle N set maximum number of equilibrium andtransition-state geometry optimization cyclesto N; default is number of independentvariables +20 for equilibrium geometryoptimization and 3x number of independentvariables for transition-state geometryoptimization
GradientTolerance F set convergence criterion in equilibrium andtransition-state) geometry optimization for themaximum gradient component (in hartrees/bohr) to F; default is 4.5 x 10⁻⁴
DistanceTolerance F set convergence criterion in equilibrium andtransition-state geometry optimization for themaximum change in a bond length (in Å) toF; default is 1.8 x 10⁻³
Hess C Choose Hessian (matrix of second derivatives)for start of geometry (transition-state geometry)optimization (in the absence of a Hessian froma previous calculation, the default is MMFF
Appendix C 12/31/03, 7:50 AM260

261
molecular mechanics for geometryoptimization and PM3 semi-empirical fortransition-state geometry optimization; may beoverridden with one of the following:
unit unit matrixMMFF MMFF molecular mechanicsAM1 AM1 semi-empiricalSTO-3G STO-3G Hartree-Fock3-21G 3-21G Hartree-Fock6-31G* 6-31G* Hartree-Fock
Quantum Chemical Calculations
Keywords associated with all quantum chemical calculations are asfollows:
keyword value description
Diis N switch on diis all the time in SCF procedure.N is the size of the iterative subspace; it shouldbe an integer between 2 and 10; default is 5
NoDiis turn off diis SCF convergence accelerator
Energy F set SCF energy convergence criterion (inhartrees) to F; default is 1.0 x 10⁻⁶
ScfCycle N set maximum number of SCF iterations to N;default is 50
Guess C choose initial wavefunction guess; in theabsence of a guess from a previous calculation,the default is either sad or PM3 depending onthe calculation type, and may be overriddenwith one of the following:
core diagonalize the core Hamiltoniansad superposition of atomic densitiesPM3 PM3 semi-empirical
Scf C SCF procedure; default is restricted for closed-shell systems and unrestricted for open-shellsystems, either of which may be specified forboth closed and open-shell systems
Core C use of frozen core approximation in Møller-Plesset and advanced correlated calculations;
Appendix C 12/31/03, 7:50 AM261

262
default is frozen which may be changed tothawed
ScfTolerance C control of all tolerances in SCF procedure;default is normal which may be changed tohigh or veryhigh
F set SCF energy convergence criterion (inhartrees) to F; default is 1.0 x 10⁻⁶
BigGrid – uses very large grid in density functionalcalculations
Mix – specifies that α and β HOMO’s in the guesswavefunction should be constructed accordingto:
useful for generating a guess wavefunction forsinglet diradical
SmallMemory, – forces use of direct methods in Hartree-FockBigMolecule calculations
SmallMolecule – attempts to use in-core methods in Hartree-Fock calculations
PrintCoords – prints Cartesian coordinates
PrintLev C print level; default is normal which may bechanged to verbose or debug
Semi-Empirical Calculations
Keywords unique to semi-empirical calculations are as follows:
keyword value description
NoPseudo – turns “off” pseudodiagonalization in responseto convergence difficulties
NoAmideFix – turns “off” molecular mechanics amidecorrection in PM3 calculations
hhOff – turns “off” hydrogen-hydrogen repulsion termin PM3 calculations; default only where no
HOMOα =HOMO + LUMO
√2
HOMOβ =HOMO - LUMO
√2
Appendix C 12/31/03, 7:50 AM262

263
transition metals are involved for compatibilitywith “standard” PM3
hhOn – turns “on” hydrogen-hydrogen repulsion termin PM3 calculations; default where transitionmetals are involved
Property and Spectra Calculations
Keywords associated with properties calculations are as follows:
keyword value description
NBO C specify details of NBO population analysis;default is normal which may be overriddenfor ionic and 3C (three center) systems
NoElCharge – turns “off” calculation of electrostatic charges
NoMulCharge – turns “off” calculation of Mulliken charges
NoNatCharge – turns “off” calculation of NBO charges
ElCharge N adjusts size of grid used to calculate chargefrom electrostatic potential; default is 1 point/atomic unit
Temperature F temperature (in K) used in calculation ofthermodynamic properties; default is 298°K
Pressure F pressure (in atm) used in calculation ofthermodynamic properties; default is 1 atm
Moments – calculates and prints principal moments ofinertia
NoSolvent – turns “off” calculation of aqueous solvationenergy using SM5.4 model
FScale F scales calculated vibrational frequencies by F;default is 1
DynamicsTime N time (in fs) for molecular dynamics simulationfor solvent calculations; default is 1500 fs
SampleTime N time (in fs) between sample points inmolecular dynamics simulation for solventcalculations; default is 50 fs
MaxSamples N maximum number of sample configurationsin molecular dynamics simulation for solventcalculations; default is 10
Appendix C 12/31/03, 7:50 AM263

264
Cutoff F maximum solute-solute distance (in Å) forinteractions to be explicitly treated inmolecular dynamics simulations for solventcalculations; default is 14.0Å
IRCSteps N maximum number of steps allowed inconstructing IRC; default is 40
IRCStepSize N maximum step size (in mass-weighted atomicunits x 100) for IRC; default is 150
Appendix C 12/31/03, 7:50 AM264

265
Appendix DUnits
Geometries
Cartesian coordinates are typically given in Ångstroms (Å), but arealso available in atomic units (au).
Bond distances are typically given in Å but are also available in au.Bond angles and dihedral angles are given in degrees (°).
Surface areas are typically given in Å2 and volumes in Å3, but arealso available in au2 (au3).
1 Å = 0.1 nm=1.889762 au
Energies, Heats of Formation and Strain Energies
Total energies from Hartree-Fock, local density, density functionaland correlated calculations are typically given in au, but are alsoavailable in kcal/mol, kJ/mol and electron volts (eV).
Heats of formation from semi-empirical calculations are typicallygiven in kcal/mol, but are also available in au, kJ/mol and eV.
Strain energies from molecular mechanics calculations are typicallygiven in kcal/mol, but are also available in au, kJ/mol and eV.
Orbital Energies
Orbital energies are typically given in eV, but are also available inkcal/mol, kJ/mol and au.
Appendix D 12/31/03, 7:56 AM265

266
Energy Conversions
au kcal/mol kJ/mol eV
1 au - 627.5 2625 27.211 kcal/mol 1.593 (-3) - 4.184 4.337 (-2)1 kJ/mol 3.809 (-4) 2.390 (-1) - 1.036 (-2)1 eV 3.675 (-2) 23.06 96.49 -a) exponent follows in parenthesis, e.g., 1.593 (-3) = 1.593 x 10⁻³
Electron Densities, Spin Densities, Dipole Moments, Charges,Electrostatic Potentials and Local Ionization Potentials
Electron densities and spin densities are given in electrons/au3.
Dipole moments are given in debyes.
Atomic charges are given in electrons.
Electrostatic potentials are given in kcal/mol.
Local ionization potentials are given in eV.
Vibrational Frequencies
Vibrational frequencies are given in wavenumbers (cm-1).
Chemical Shifts
Chemical shifts are given in parts-per-million (ppm) relative toappropriate standards: proton, tetramethylsilane; carbon,tetramethylsilane. See Appendix E for numerical values.
UV/visible Spectra
λmax is given in wavenumbers (cm-1).
Appendix D 12/31/03, 7:56 AM266

267
Appendix ENMR Chemical Shift Standards
Listed below are calculated absolute chemical shifts for 1H, 13C, 15N,19F, 29Si and 31P from Hartree-Fock models with the following basissets for the usual “reference” compounds.
nuclei reference compound 3-21G 6-31G* 6-31G**
1H tetramethylsilane 33.61 32.89 32.33
13C tetramethylsilane 213.15 201.67 203.10
15N nitromethane 251.02 169.28 160.43
19F fluorotrichloromethane 279.76 269.48 269.48
29Si tetramethylsilane 508.94 450.14 448.39
31P phosphoric acid 504.17 423.64 423.16
nuclei reference compound 6-31+G* 6-311G* 6-311+G**
1H tetramethylsilane 32.82 32.83 32.78
13C tetramethylsilane 201.85 195.92 195.87
15N nitromethane 159.64 177.41 184.80
19F fluorotrichloromethane 260.87 247.02 246.38
29Si tetramethylsilane 446.69 395.43 396.84
31P phosphoric acid 415.38 368.32 363.65
Chemical shift values reported by Spartan’04 for these nuclei withthese Hartree-Fock models are in ppm relative to these standards.Chemical shift values for Hartree-Fock models with other basis setsare reported as absolute values.
Appendix E 12/31/03, 7:58 AM267

Appendix E 12/31/03, 7:58 AM268

269
Appendix FCitation
The proper citation for Spartan’04 is as follows:
Spartan’04Wavefunction, Inc.
Irvine, CA
Except for molecular mechanics and semi-empirical models, thecalculation methods used in Spartan’04 have been documented in: J.Kong, C.A. White, A.I. Krylov, C.D. Sherrill, R.D. Adamson, T.R.Furlani, M.S. Lee, A.M. Lee, S.R. Gwaltney, T.R. Adams, C.Ochsenfeld, A.T.B. Gilbert, G.S. Kedziora, V.A. Rassolov, D.R.Maurice, N. Nair, Y. Shao, N.A. Besley, P.E. Maslen, J.P. Dombroski,H. Daschel, W. Zhang, P.P. Korambath, J. Baker, E.F.C. Byrd, T. VanVoorhis, M. Oumi, S. Hirata, C.-P. Hsu, N. Ishikawa, J. Florian, A.Warshel, B.G. Johnson, P.M.W. Gill, M. Head-Gordon, and J.A. Pople,J. Computational Chem., 21, 1532 (2000).
A discussion and assessment of commonly-used calculation methodsis found in: W.J. Hehre, A Guide to Molecular Mechanics andQuantum Chemical Calculations, Wavefunction, Irvine, 2003.
Appendix F 12/31/03, 8:01 AM269

Appendix F 12/31/03, 8:01 AM270

271
Appendix GInstalling the
Cambridge Structural DatabaseAccess to the Cambridge Structural Database (CSD) from Spartan’04should be “automatic”, following successful installation of theConQuest program (supplied with CSD) according to the detailedinstructions provided. If access is denied, the following steps need tobe taken:
(i) Click on the square box immediately to the left of the Retrievebutton at the bottom of the CSD dialog. This brings up theConfigure CSD dialog,
This will list any files which are “missing”. Click on Setup Pathsat the bottom of the dialog to bring up the CSD File Paths dialog,
Appendix G 12/31/03, 8:03 AM271
272
This dialog should show one or more “red lights”.
(ii) Make certain that the path to ConQuest is correctly specified.The most common error will be that the version number is notcurrent. (At the time of writing, the current version is 1.5.) Youcan get the current version number from your installation ofConQuest.
(iii) Given the proper version number for ConQuest, update the filenames in the boxes below “MSK file”, “TCD file”, “IND file”and “INV file”. You can get the current file names from yourinstallation of ConQuest. As you enter the current file names,the “red lights” should turn to “green lights”. When all lightsare “green”, click on OK to dismiss the CSD File Paths dialogand then click on OK to dismiss the Configure CSD dialog.
Appendix G 12/31/03, 8:03 AM272

273
Appendix HConstructing Custom Databases
The user is free to add molecules to the Spartan Molecular Database,or to add different calculation levels for molecules which alreadyexist. These new entries will not actually supplement (or replace)existing SMD entries, but rather will go into one or more (user defined)directories which will be accessed in addition to the existing SMDdirectory. At the present time, database information (abstracted fromthe original calculations) is limited to geometry, total energy, HOMOand LUMO energies, dipole moment, Mulliken, NBO andelectrostatic-fit atomic charges, chemical shifts and vibrationalfrequencies. Future versions of the database may extend this list.
Creation of new database entries follows by saving a molecule (orlist of molecules) as a Spartan Entry (.spentry) file (Save As underthe File menu with Save as type set to Spartan Entry). The filename is not important, but the path to the directory must be enteredinto the Paths Preferences dialog (under Preferences... in theOptions menu; see Chapter 16). This will typically follow the nameof the default (SMD) directory “.\Standard Names” and be precededby a semicolon “;”. As many user-defined directories as desired maybe defined (separated by semicolons).
Note that a “name” for each molecule needs to be specified. This isdone as a Label either in the Molecule Properties dialog (seeProperties under the Display menu in Chapter 14) or in thespreadsheet (see Spreadsheet under the Display menu in Chapter14).
IT IS IMPORTANT THAT ALL ORIGINAL DATA BE SAVED.ACCESS INFORMATION (SMILES-LIKE STRINGS) WILLBE EXTENDED AND/OR CHANGED TO INCLUDE NEWDATA TYPES (IN PARTICULAR, TRANSITION METAL
Appendix H 12/31/03, 8:05 AM273

274
SYSTEMS AND TRANSITION STATES). PROCEDURESWILL BE SUPPLIED WITH FUTURE RELEASES TOCREATE UPDATED ACCESS INFORMATION BASED ONYOUR DATA.
Appendix H 12/31/03, 8:05 AM274

275
Appendix IInstalling a Network HASP
Spartan’04 requires a hardware license key which is normally installedon each machine. However, a network hardware key can be obtainedfrom Wavefunction and installed on a server. This allows Spartan’04to be run on a specified number of “client” machines on the network.A one-time installation is required.
On the Server:
1. Install Spartan and HASP device driver on the server. The servermust be running Windows 98 or higher (Wavefunction stronglyrecommends Windows NT/2000 or higher).
2. Copy Lmsetup.exe from the Spartan CD ROM onto the server’shard drive and install the program by double-clicking on the icon.
3. When the program is finished installing, restart the server andverify that the NetHASP license manager has loaded thenecessary protocols for your network.
On Each Client Computer:
4. Install software on the network clients that will access the NetHASPthrough the network. The HASP device driver is not required forinstalling the program on client computer. DO NOT install theNetHASP license manager.This is typically an auto-install.
5. Verify that the license manager is functioning correctly by tryingto access Spartan from a network client computer (computerwithout the NetHASP hardware).
Appendix I 12/31/03, 8:06 AM275

276
Additional:
6. If you want to run Spartan locally on the server, you must alsoinstall Spartan on the server.If client computers are on a dif ferentsubnet from the license server, a Nethasp.ini file must be createdand included in the directory with the Wavefunction program files.
Need additional help? Please visit our “Network InstallationFrequently Asked Questions” (FAQ) page:
http://www.wavefun.com/support/pc/faqpcnetwork1.html
Appendix I 12/31/03, 8:06 AM276

277
A
About; Options menu, about ....... 237
Absorption maximum (λmax),units ............................................. 266
Add Columns dialog ............... 52,207
Add Fragment; Build menu,add fragment ........................... 33,161
Add Linear Regression dialog 63,209
Add Summaries dialog ................ 208
Add Surface dialog ................. 28,182
Align Molecules; Geometrymenu, align molecules ............ 56,144
Alt key, use of ........................ 11,12ff
AM1 ............................................. 249
AM1 calculations, onacrylonitrile .............................. 51allyl vinyl ether ........................ 56androsterone............................. 993-cyano-4-methylcyclohexenylradical ...................................... 38decaglycine ............................ 1051,1-dicyanoethylene ................. 511,2-dicyanoethylene ................. 51SN2 reaction of bromide andmethyl chloride ........................ 90
tetracyanoethylene ................... 51transition state for Diels-Aldercycloaddition ofcyclopentadiene andacrylonitrile .............................. 83transition state for Diels-Aldercycloaddition of5-fluorocyclopentadiene andacrylonitrile .............................. 84transition state for Diels-Aldercycloaddition of5-methylcyclopentadiene andacrylonitrile .............................. 84tricyanoethylene....................... 51vitamin E ................................. 95vitamin E radical ...................... 96
AM1 parameters .......................... 250
Amino acids, in peptide builder ... 155
Anglesconstraining ........................... 141measuring .............................. 136“posting” to spreadsheet ........ 137units ....................................... 265
Append Molecule(s); Filemenu, append molecule(s) ...... 88,122
Archive ........................................ 188
Area ...................................... 195,212
Arrange Icons; Options menu,arrange icons ................................ 246
Note: Items in bold type refer to entries in Spartan‘04 menus.
Index
Index 12/31/03, 8:27 AM277
278
Atomic chargesdisplaying ....................... 134,191electrostatic ............................ 252for SN2 reaction of bromideand methyl chloride ................. 90for sulfur tetrafluoride ........... 112Mulliken ................................ 252natural .................................... 252units ....................................... 266
Atomic fragments, in entrymodel kit ...................................... 146
Atomic hybrids, in expertmodel kit ...................................... 153
Atomic radii,used in space filling models... 131changing ................................ 241
Atomic weight ........................ 87,191
Atom colors .......................... 129,192
Atom labels ............................. 23,132
Atom Properties dialog ........... 28,191
Atom replacement................... 30,160
Atom Style dialog ........................ 192
AVI............................................... 120
B
B3LYP/6-31G* calculations ondimethylperoxide ..................... 611-pentene ................................. 78transition state for ene reactionof 1-pentene ............................. 78
Ball and Spoke; Model menu,ball and spoke ......................... 22,130
Ball-and-spoke model ............. 22,130
Ball and Wire; Model menu,ball and wire ........................... 22,128
Ball-and-wire model ............... 22,128
Bitmap ......................................... 120
Boltzmann equation ....................... 70
Bond density, forSN2 reaction of bromide andmethyl chloride ........................ 91transition state for enereaction 1-pentene.................... 77
Bond distancesconstraining ........................... 141measuring .............................. 136“posting” to spreadsheet ........ 136units ....................................... 265
Bond Properties dialog ................ 192
Bondsrotation ................................... 160stretching ............................... 160
Bond Style dialog ........................ 193
BP/6-31G* calculations, onbenzene .................................. 114benzene chromium tricarbonyl.114bis(cyclopentadienyl)(methyl)zirconium cation .................... 116ethylene .................................. 116
Index 12/31/03, 8:27 AM278

279
transition state for ethyleneinsertion intobis (cyclopentadienyl) (methyl)zirconium cation .................... 116
Break Bond; Build menu,break bond ................................... 163
Builders .................................145-164
Buildingacetaldehyde ............................ 62acetic acid ................................ 65acetone ..................................... 62acetophenone ........................... 62acrylonitrile .............................. 19allyl vinyl ether ........................ 55androsterone............................. 97benzaldehyde ........................... 62benzene .................................. 113benzene chromium tricarbonyl.113benzoic acid ............................. 65benzyne .................................... 41bis(cyclopentadienyl) (methyl)zirconium cation .................... 116tert-butylaldehyde .................... 622-butyne ................................... 42camphor ................................... 33chloroacetic acid ...................... 653-cyano-4-methylcyclohexenylradical ....................................... 38cyclohexane ............................. 44cyclohexanone ......................... 30decaglycine ............................ 104decalin ...................................... 44dichloroacetic acid ................... 651,1-dicyanoethylene ................. 501,2-dicyanoethylene ................. 50Diels-Alder cycloadditionof cyclopentadiene andMaleic anhydride ..................... 79dimethylcyclohexane ............... 44
dimethylperoxide ..................... 58ethinamate ................................ 36ethylene .................................. 116formaldehyde ........................... 62formic acid ............................... 65hexafluoroacetone .................... 622-hexene................................... 682-hydroxypyridine ................... 701-methylcytosine ..................... 692-methylnorbornane................. 691-pentene ................................. 75pivalic acid ............................... 652-pyridone ................................ 73SN2 reaction of bromide andmethyl chloride ........................ 89sulfur tetrafluoride ................. 111tetracyanoethylene ................... 50transition state for Diels-Aldercycloaddition of cyclopentadieneand acrylonitrile ....................... 82transition state for Diels-Aldercycloaddition of5-fluorocyclopentadiene andacrylonitrile .............................. 83transition state for Diels-Aldercycloaddition of5-methylcyclopentadiene andacrylonitrile .............................. 84transition state fordifluorocarbene addition tocyclohexene ............................. 87transition state fordifluorocarbene addition toethylene .................................... 85transition state for enereaction of 1-pentene ............... 75transition state for ethyleneinsertion intobis(cyclopentadienyl)(methyl) zirconium cation ..... 115trichloroacetic acid .................. 65tricyanoethylene....................... 50
Index 12/31/03, 8:27 AM279

280
trifluoroacetaldehyde ............... 62trifluoroacetone ........................ 62trifluoroacetophenone .............. 62triglycine ................................ 102vitamin E ................................. 95vitamin E radical ...................... 96
Build menuadd fragment ..................... 33,161break bond ............................. 163delete ................................. 38,162make bond ........................ 33,162minimize ........................... 21,164view .................................. 21,161
Build Toolbar; Options menu,build toolbar ................................. 246
C
13C chemical shifts, forcyclohexane ............................. 44decalin ...................................... 44dimethylcyclohexane ............... 442-hexene................................... 682-methylnorbornane................. 69
13C spectrum, of decalin ................. 44
Calculate ................................. 24,167
Calculation options ...................... 177
Calculations; Setup menu,calculations ...................... 24,166,167
Calculations dialog ................. 24,167
Calculations dialog, essentialedition .......................................... 178
Calculator; Options menu,
calculator ..................................... 245
Calculator dialog.......................... 245
Cambridge Structural Database..............................................219-226
Cambridge Structural Databasedialog .......................... 34,35,221,224
Carbonyl compoundshydration of ............................. 62nucleophilic reactivity ............. 30
Carboxylic acids, acidities of......... 65
Cascade; Options menu, cascade .246
CCSD, CCSD(T), CCSD(2)models .......................................... 251
Center; Edit menu, center ........... 126
Charge .......................................... 176
Chemical shiftsdisplaying ....................... 134,191standards ................................ 267units ....................................... 266
Chiralitydisplaying .................. 34,134,191inverting ................................... 13
CIS, CIS(D) models ..................... 252
Clear; Edit menu, clear .......... 20,126
Clipboardcopying to ............................... 50,use of in entry builder ....... 50,151
Index 12/31/03, 8:27 AM280
281
Close; File menu, close .......... 29,120
Colors; Options menu, colors ..... 129
Colorsatom ................................ 129,192bond ................................ 128,193constraint ............................... 194curve ...................................... 200plane ...................................... 195plot ......................................... 198point ....................................... 195setting .................................... 242surface .................................... 196
Colors dialog ............................... 242
Compute ................................. 42,173
Configure; Model menu,configure ................................. 22,133
Configure CSD dialog ................. 271
Configure Labels dialog ......... 22,133
Configure Ribbons dialog ............ 134
Conformational search, onallyl vinyl ether ........................ 553-cyano-4-methylcyclohexenylradical ...................................... 38ethinamate ................................ 37
Conformer distribution .................. 55
ConQuest ..................................... 220
Constrain Angle; Geometrymenu, constrain angle .................. 141
Constrain Dihedral; Geometry
menu, constrain dihedral......... 58,141
Constrain Distance; Geometrymenu, constrain distance......... 71,141
Constraint Properties dialog .. 59,193
Constraints, turning on ................ 173
Constraint Style dialog ................ 194
Control key, use of ...................... 12ff
Convergence difficulties .............. 178
Copy; Edit menu, copy........... 50,125
Copyright information ................. 237
Correlated models available inSpartan’04
CCSD, CCSD(T), CCSD(2) .. 251OD, OD(T) ............................ 251QCISD, QCISD(T) ................ 251QCCD, QCCD(2) .................. 251
Coupled; Model menu,coupled ................................... 67,132
CPK models ................................. 130
CSD ............................34,35,219-226
CSD data ...................................... 188
CSD dialog ................. 34,35,221,224
CSD file paths dialog ................... 272
Cubic spline .............................. 53,60
Curve Properties dialog .......... 54,199
Index 12/31/03, 8:27 AM281

282
Curve Scale Properties dialog...... 200
Curve Style dialog ....................... 200
Cut; See Edit menu, cut
D
d and l amino acids, in peptidebuilder .......................................... 156
Databases; Search menu,databases ...............................219-233
Define Ligand Point; Geometrymenu, define ligand point ............ 143
Define Plane; Geometrymenu, define plane ....................... 143
Define Point; Geometrymenu, define point ....................... 143
Delete; Build menu, delete ..... 38,162
Delete key, use of ...................... 14,41
Delete Molecule; File menu,delete molecule ....................... 56,122
Density .................................. 170,266
Density functional calculations;See B3LYP/6-31G* calculations,BP/6-31G* calculations
Density functional modelsavailable in Spartan’04
B3LYP ................................... 250BLYP ..................................... 250BP .......................................... 250EDF1...................................... 250
local ....................................... 250range of applications .............. 251
Density functional models ........... 250
Dialogs, in Spartan’04 ................... 15
Dihedral anglesconstraining ........................... 141measuring .............................. 137“posting” to spreadsheet ........ 138units ....................................... 265
Dipole momentsdisplay of .......................... 27,190for acrylonitrile ........................ 27units ....................................... 265
Dipole moment vector ............ 27,190
Display menuoutput ................................ 26,187plots .................................. 53,215properties .......................... 27,189
atom properties ................... 191bond properties ................... 192constraint properties ........... 193curve properties .................. 196molecule properties............. 190plane properties................... 194plot properties ..................... 196point properties ................... 194regression properties ........... 200selected style ....................... 201surface properties ................ 195Spectra ........................... 42,202
IR ..................................... 202UV/vis .............................. 204NMR ................................ 205
spreadsheet........................ 51,206surfaces ............................. 28,202
Index 12/31/03, 8:27 AM282

283
E
Edit menucenter ..................................... 126clear .................................. 20,126copy .................................. 50,125cut .......................................... 125find ......................................... 126find next ................................. 126paste ....................................... 125undo .................................. 20,125
Edit menu (monitor)kill selected ............................ 244start selected .......................... 244
Electron densityfor androsterone ....................... 99units ....................................... 266
Electrostatic charges .................... 252
Electrostatic potential map, foracrylonitrile .............................. 28benzene .................................. 114benzene chromium tricarbonyl 114decaglycine ............................ 105SN2 reaction of bromideand methyl chloride ................. 91transition state for enereaction of 1-pentene ............... 77vitamin E ................................. 96
Element overlay .................... 159,239
Element symbol, display of ......... 191
Ending jobs .................................. 144
End key, use of ............................... 14
Energyconversions ............................ 266display of ............................... 190units ....................................... 265
Energy profile ................................ 59
Entropy ........................................ 175
Entry model kit ....................... 19,146
Equilibrium conformer .................. 37
Equilibrium geometry .................... 24
Error log ....................................... 188
Excited-state models availablein Spartan’04
CIS, CIS(D) ........................... 252TDDFT .................................. 252
Expert model kit ................... 111,151
Exit; File menu, exit; Filemenu (monitor) exit ................ 11,123
F
File formatsAVI......................................... 121Bitmap ................................... 121JPEG ...................................... 121MacroModel .......................... 120PDB ....................................... 120PNG ....................................... 121SDF ........................................ 120SKC ....................................... 120SMILES ................................. 120Spartan collection .................. 120SPARTAN exchange .................. 120SYBYL MOL and MOL2 ........ 120
Index 12/31/03, 8:27 AM283

284
TGF........................................ 120
File menuappend molecule(s) ........... 88,122close .................................. 29,120delete molecule ................. 56,122exit .................................... 11,123new ................................... 19,119new molecule .................... 50,122open .................................. 33,119print ........................................ 122print output ............................ 123print setup .............................. 122print spreadsheet .................... 123save ........................................ 121save as ............................... 33,121
File menu (monitor)exit ......................................... 245
File Toolbar; Options menu,file toolbar ................................... 246
Find; Edit menu, find .................. 126
Find Next; Edit menu, find next . 126
Fonts; Options menu, fonts ......... 243
Fonts dialog ................................. 243
Force fields .................................. 249
Fourier fit ....................................... 60
Fourier series, for describingtorsional potential .......................... 58
Free valence ............................ 20,147
Freeze Center; Geometrymenu, freeze center ................. 87,138
Freezing atoms, for output fromthe Cambridge StructuralDatabase................................ 139,225
Frequenciesdisplaying .............................. 202units ....................................... 266
Frozen atoms, turning on ........ 87,173
G
G2, G3, G3(MP2) models ........... 251
Geometry menualign molecules ................. 56,144constrain angle ....................... 141constrain dihedral ............. 58,141constrain distance ............. 79,141define plane............................ 143define point ............................ 143freeze center ...................... 87,138measure angle ................... 23,136measure dihedral ............... 23,137measure distance ............... 23,136set torsions ............................. 139
Geometry Toolbar; Optionsmenu, geometry toolbar ............... 246
Global calculations ................. 51,178
Global minimum .......................... 227
Global Model; Model menu,global model ................................ 132
Global rotate .................................. 12
Global surfaces ....................... 77,185
Graphics module .......................... 253
Index 12/31/03, 8:27 AM284

285
Graphical surface selection ..... 32,195
H
Hartree-Fock calculations; SeeHF/3-21G(*) calculations,HF/6-31G* calculations
Hartree-Fock models, rangeof application ............................... 250
Heat of formationdisplaying ............................... 190units ........................................ 265
Help, in dialogs ............................. 247
Help menu, on-line help ................ 247
Help menu (monitor) ..................... 244
HF/3-21G calculations, onacetaldehyde ............................. 62acetic acid ................................. 66acetone ..................................... 62acetophenone ............................ 62acrylonitrile .......................... 24,51benzaldehyde ........................... 62benzoic acid ............................. 66benzyne .................................... 41tert-butylaldehyde .................... 622-butyne ................................... 42chloroacetic acid ...................... 663-cyano-4-methylcyclohexenylradical ...................................... 38cylohexanone ........................... 31dichloroacetic acid ................... 661,1-dicyanoethylene ................. 511,2-dicyanoethylene ................. 51formaldehyde ........................... 62formic acid ............................... 66hexafluoroacetone .................... 62
1-methylcytosine ................... 1001-pentene ................................. 78pivalic acid ............................... 66tetracyanoethylene ................... 51transition state for Diels-Aldercycloaddition of5-fluorocyclopentadieneand acrylonitrile ....................... 84transition state for Diels-Aldercycloaddition of5-methylcyclopentadieneand acrylonitrile ....................... 84transition state fordifluorocarbene addition tocyclohexene ............................. 88transition state fordifluorocarbene addition toethylene .................................... 87transition state for ene reactionof 1-pentene ............................. 76trichloroacetic acid .................. 66tricyanoethylene....................... 51trifluoroacetaldehyde ............... 62trifluoroacetone ........................ 62trifluoroacetophenone .............. 62triglycine ................................ 104sulfur tetrafluoride ................. 112
HF/6-31G* calculations, onallyl vinyl ether ........................ 56cyclohexane ............................. 44decalin ...................................... 44dimethylcyclohexane ............... 441,2-dimethylperoxide ............... 592-hexene................................... 682-methylnorbornane................. 69
Hide; Model menu, hide .............. 131
Home key, use of ........................... 14
HOMO energy, displaying ........... 190
Index 12/31/03, 8:27 AM285

286
HOMO-LUMO gap ....................... 49
Hydrogen Bonds; ModelMenu, hydrogen bonds ................ 133
Hydrogen bonds, displaying . 108,133
Hydrogensgrowing .................................. 191removing from model;See Model menu, hide
Hydrogens; Model menu,hydrogens .................................... 132
I
Iconifying Spartan’04 .................... 16
Imaginary frequency ...................... 76
Implicit search of CSD ......... 226,239
Infrared spectrum, forbenzyne .................................... 432-butyne ................................... 43
Insert key, use of ....................... 14,89
Intrinsic reaction coordinate ... 78,171
IRC ......................................... 78,171
IR Spectra dialog .................... 42,202
IR Spectrum, requesting .............. 176
Isotopes ................................... 87,191
Isovalue, fixed ............................. 184
J
Job queue ..................................... 185
JPEG ..................................... 120,239
K
Keystroke equivalents............. 11,255
Killing jobs .................................. 244
Kill Selected; Edit menu(monitor), kill selected ................. 244
Kinetic product .............................. 79
L
Labels; Model menu, labels ... 23,132
Labelsatoms ...................................... 134bonds ...................................... 134charges ................................... 134chemical shifts .................. 45,134constraints .............................. 134planes ..................................... 134points ..................................... 134residue .................................... 134ribbons ................................... 134R/S .................................... 34,134strand ..................................... 134
Least squares........................ 53,64,67
Ligand points, defining ................ 143
Ligands ................................. 113,154
Limits; Options menu(monitor), limits ........................... 244
Index 12/31/03, 8:27 AM286

287
Limits dialog ................................ 244
Linear synchronous transit ............. 73
LMP2/6-31G* calculations,on 1-methylcytosine .................... 101
Local ionization potential ............ 182
Local ionization potential map,utility ............................................ 181
Localized ..................................... 170
LogP ............................................ 174
LUMO, for cyclohexanone ............ 31
LUMO energy, foracrylonitrile .............................. 521,1-dicyanoethylene ................. 521,2-dicyanoethylene ................. 52tetracyanoethylene ................... 52tricyanoethylene....................... 52
LUMO energy, displaying ........... 190
LUMO mapfor cyclohexanone.................... 31utility of ................................. 181
M
MacroModel ................................ 120
Make Bond; Build menu,make bond .............................. 33,162
Mass numberchanging ........................... 87,191displaying .............................. 191
Measure Angle; Geometrymenu, measure angle .............. 23,136
Measure Dihedral; Geometrymenu, measure dihedral .......... 23,137
Measure Distance; Geometrymenu, measure distance .......... 23,136
Mechanics models inSpartan’04 .. 249
Menus ............................................ 11
Minimize; Build menu,minimize ................................. 21,164
MNDO ......................................... 249
MNDO/d ...................................... 249
MNDO parameters ...................... 249
MMFF.......................................... 249
MMFF calculations,allyl vinyl ether ........................ 553-cyano-4-methylcyclohexenylradical ...................................... 38ethinamate ................................ 37
MMFF parameters ....................... 249
Model ........................................... 170
Model kit; Options menu,model kit ...................................... 245
Model menuball and spoke ................... 22,130ball and wire ..................... 22,128configure ........................... 22,133coupled ............................. 67,132
Index 12/31/03, 8:27 AM287

288
global model .......................... 132hide ........................................ 131hydrogen bonds ..................... 133hydrogens .............................. 132labels ................................. 23,132ribbons ................................... 133space filling ...................... 22,128tube ................................... 22,128wire ................................... 22,128
MOL, MOL2 ............................... 120
Molecular dynamics, use insolvation calculations ........... 104,174
Molecular mechanics calculations;See MMFF calculations
Molecular mechanics models,range of application ..................... 249
Molecular models3D ....................................... 14,16atom colors ............................ 129ball-and-spoke ......................... 22ball-and-wire ............................ 22bond colors ............................ 128coupling of motions ............... 132CPK ....................................... 130global model style .................. 132hiding ..................................... 131hydrogen bonds ..................... 133hydrogens .............................. 132labels ................................. 28,132orthogonal projections ........... 128perspective projections .......... 128ribbons ................................... 133rotation of ........................... 12,13scaling ................................. 12,13space filling ............................. 22split tubes ........................ 130,239translation ........................... 12,13
tube .......................................... 22wire .......................................... 22
Molecular size.............................. 190
Molecular volume ........................ 190
Molecule buildersamino acids ............................ 155atomic fragments ................... 146atomic hybrids ....................... 153atom/hybrid replacement .. 30,160bond rotation .......................... 160bond stretching ...................... 160bond types .............................. 153breaking bonds; See Buildmenu, break bondchirality inversion .................. 161clipboard ........................... 50,151custom.................................... 150delete; See Build menu, deleteentry model kit .................. 19,146expert model kit .............. 111,151going between builders................................. 151,155,158groups ............................... 20,147ligands ............................. 113,154making bonds; See Buildmenu, make bondmanipulating molecularfragments ............................ 13,86minimizing; See Buildmenu, minimizenucleotide bases ..................... 158nucleotide model kit .............. 158peptide model kit ............ 102,155Periodic Table... ..................... 152rings .................................. 30,148sequencing polypeptides/polynucleotides ............... 156,159terminating polypeptides ....... 157
Index 12/31/03, 8:27 AM288

289
Molecule centered rotation ............ 12
Molecule names ............................. 66
Molecule Properties dialog ..... 27,190
Molecule selection ......................... 14
Molecule Utilities dialog ............. 191
Møller-Plesset models available inSpartan’04
LMP2 ..................................... 251MP2 ....................................... 251MP3 ....................................... 251MP4 ....................................... 251
Monitor; Options menu, monitor.244
Monitor dialog ............................. 244
Mouse ......................................... 12ff
Mulliken charges ......................... 252
Multiplicity ............................. 38,177
N
Names ............................................ 66
New; File menu, new .............. 19,119
New Molecule; File menu,new molecule .......................... 50,122
NMR chemical shifts ..................... 44
NMR Spectra dialog .................... 205
NMR spectraplotting ................................... 205
requesting .............................. 176
NOEs, setting ............................... 140
Normal modes of vibration ... 202,266
O
OD, OD(T) models ...................... 251
On-Line Help; Help menu,on-line help .................................. 247
Open; File menu, open ........... 33,119
Open valence .......................... 20,147
Options menuabout ...................................... 237arrange icons .......................... 246build toolbar ........................... 246calculator ............................... 245cascade ................................... 246colors ..................................... 242file toolbar ............................. 246fonts ....................................... 243geometry toolbar .................... 246model kit ................................ 245monitor .................................. 244preferences ............................. 228
miscellaneous ..................... 238molecule ............................. 240paths .................................... 242VDW radii .......................... 241
search toolbar ......................... 246tile .......................................... 246
Options menu (monitor)limits ...................................... 244
Orbital energies, units .................. 265
Index 12/31/03, 8:27 AM289

290
Output; Display menu, output .26,187
Output window ....................... 26,187
P
Page Up/Down keys ...................... 14
Partial surface area....................... 212
Partial volume .............................. 212
PDB ............................................. 120
PDB files, removing watermolecules ..................................... 240
Paste; Edit menu, paste............... 125
Peptide model kit .................. 102,155
Periodic Table ....................... 159,239
Picking ...................................... 12,13
Plot Properties dialog ........... 197,198
Plots; Display menu, plots ..... 53,216
Plots dialog ............... 53,215,216,217
Plot Style dialog .......................... 198
Plot X-Scale (Y-Scale)Properties dialog .......................... 197
PM3 ............................................. 249
PM3 calculations, onbenzene .................................. 113benzene chromium tricarbonyl.113bis(cyclopentadienyl) (methyl)
zirconium cation .................... 116Diels-Alder cycloaddition ofcyclopentadiene and maleicanhydride ................................. 80ethylene .................................. 116transition state for ethyleneinsertion intobis(cyclopentadienyl)(methyl) zirconium cation ..... 115
PM3 parameters ........................... 250
PNG ............................................. 120
Polar surface area......................... 212
Post buttons ..................... 136ff,140ff
Preferences; Options menu,preferences ................................... 278
Preferences dialog(miscellaneous) ............................ 238
Preferences dialog (molecule) ..... 240
Preferences dialog (paths) ........... 242
Preferences dialog (VDW Radii) . 241
Preferences, setting ...................... 238
Print; File menu, print ......... 122,123
Print Output; File menu,print output ........................... 122,123
Print Setup; File menu,print setup .................................... 122
Print Setup dialog ........................ 122
Index 12/31/03, 8:27 AM290

291
Print Spreadsheet; Filemenu, print spreadsheet ........ 122,123
Printingatomic charges ....................... 177on-screen graphics;See File menu, printorbitals and orbital energies ... 177thermodynamic quantities...... 177vibrational modes .................. 177
Properties; Display menu,properties .........................27,189-200
Property archive ........................... 188
Pseudopotential ............................ 171
Q
QCCD, QCCD(2) models ............ 251
QCISD, QCISD(T) models ......... 251
Quitting Spartan’04 ................ 11,123
R
Regression Properties dialog .. 64,201
Retrieve Options dialog .......... 72,232
Rotation about single bonds ........ 160
Rotation, of molecules on screen..12,13
R/S Chirality ............... 13,34,134,191
S
Save; File menu, save .................. 121
Save As; File menu, save as ... 33,121
Save As dialog ........................ 25,121
Scaling ...................................... 12,13
Screen centered rotation ................ 12
SDF .............................................. 120
Search menudatabases ........................... 34,219
Cambridge StructuralDatabase (CSD) ............. 34,219Spartan MolecularDatabase (SMD)..................... 37,66,68,70,226ff
tautomers ........................ 100,235transition states ................. 75,233
Search Options dialog ............. 71,230
Search Toolbar; Optionsmenu, search toolbar .................... 246
Selection box .......................... 50,126
“Selected” Style dialog ......... 107,201
Semi-empirical calculations;See AM1 calculations; PM3calculations
Semi-empirical modelsavailable in Spartan’04 .......... 249range of application ............... 250
Set Torsions; Geometry menu,set torsions ................................... 139
Setup menucalculations ....................... 24,166
Index 12/31/03, 8:27 AM291

292
submit ............................... 24,185surfaces ............................. 28,179
Shift key, use of .......................... 12ff
Single-point energy........................ 38
Size restrictions in Spartan’04advanced correlated models... 252density functional models ...... 251excited state models ............... 252Hartree-Fock models ............. 250molecular mechanics models . 249Møller-Plesset models ........... 251semi-empirical models ........... 250
SKC ............................................. 120
SM5.4 ................................... 174,252
SM5.4, calculations forreaction coordinate for SN2addition of bromide tomethyl chloride ........................ 91
SM5.4, parameters ....................... 252
SMD; See Spartan MolecularDatabase
SMD dialog .. 71,72,228,229,230,232
SMD preview dialog ...................... 37
SMILES ................................ 120,227
Solvationfor decaglycine ...................... 104for SN2 addition of bromideto methyl chloride .................... 91molecular dynamics model .... 174SM5.4 model .................. 174,252
SOMO, for 3-cyano-4-methylcyclohexenyl radical........ 40
Space-Filling; Model menu,space-filling ............................ 22,128
Space-filling model................. 22,128
Spartan’04advanced correlated models... 251density functional models ...... 250dialogs ...................................... 15essential edition ..................... 249excited state models ............... 252graphics .................................. 253Hartree-Fock models ............. 250iconifying ................................. 16keyboard functions .................. 14keystroke equivalents .............. 11keywords ................................ 178killing jobs ............................. 244mechanics models .................. 249menus ....................................... 11molecule selection ................... 14Møller-Plesset models ........... 251monitor .................................. 244monitoring jobs ...................... 244options ................................... 178properties ............................... 252quitting .............................. 11,123semi-empirical models ........... 249spectra .................................... 252starting ..................................... 11submitting jobs ...................... 185toolbars .................................... 12using the mouse .................... 12ff
Spartan Molecular Databasecontent ................................... 226generation of .......................... 227replacement from .... 37,66,68,228substructure search of ....... 70,229
Index 12/31/03, 8:27 AM292

293
user-defined entries ................ 273
Spartan MolecularDatabase dialog...........71,72,228-230
Spectra; Display Menu,spectra ..............................42,202-204
Spin density, for3-cyano-4-methylcyclohexenylradical ...................................... 39vitamin E radical ...................... 96
Spin density map, for3-cyano-4-methylcyclohexenylradical ...................................... 39
Spin multiplicity ..................... 38,177
Spreadsheet; Display menu,spreadsheet.............................. 51,205
Spreadsheetadding columns ................... 207ffdeleting columns .................... 215deleting rows (molecules) ...... 215entering numerical data.63,66,209expressions ............................ 209printing .................................. 216regression analyses ................ 208sorting ............................... 63,215summarizing columns ............ 208using the clipboard ................ 215
Spreadsheet dialog ............. 51,52,206
Start from ................................ 38,172
Starting jobs ................................. 244
Starting Spartan’04 ........................ 11
Start Selected; Edit menu(monitor), start selected ............... 244
Stereo display ................................ 14
Stopping jobs ............................... 144
Strain energydisplay of ............................... 190units ....................................... 265
Subject to ..................................... 173
Submit; Setup menu, submit .. 24,185
Submit dialog ............................... 185
Submitting jobs ............................ 185
Surface areaof CPK model ........................ 212of graphical surface ............... 195partial ..................................... 212polar ....................................... 212units ....................................... 265
Surface Properties dialog . 32,195,196
Surfaces; Display menu,surfaces; Setup menu,surfaces ............................ 28,179,202
Surfaces dialog .................. 28,29,182
Surface Style dialog ..................... 196
SYBYL ........................................ 249
Symmetry, using .......................... 173
Index 12/31/03, 8:27 AM293

294
T
Tautomers; Search menu,tautomers .............................. 100,235
TDDFT (time-dependentdensity functional) models........... 252
Terminate dialog ................... 103,157
TGF.............................................. 120
Theoretical model ........................ 170
Thermodynamic product................ 79
Thermodynamic properties,printing .................................. 177requesting .............................. 176
Three key, use of in stereodisplays .......................................... 14
Tile; Options menu, tile ............... 246
Toolbars ......................................... 12
Total charge ................................. 176
Transition state geometry .............. 76
Transition States; Searchmenu, transition states ............ 75,233
Transition states, guessing ...... 75,233
Translation, of moleculeson screen ................................... 12,13
Tube; Model menu, tube ........ 22,128
Tube model .............................. 22,128
U
Undo; Edit menu, undo .......... 20,125
Units ............................................ 265Units, conversion factors ...... 213,266
UV/vis spectra dialog .................. 204
UV/vis spectrumplotting ................................... 204requesting .............................. 175
V
Valence checking ......................... 160
Van der Waals radiiuse in space-filling models .... 131changing ................................ 241
Verbose output ............................. 188
Vibrational frequenciesdisplaying .............................. 202units ....................................... 266
Vibrational frequencies, forbenzyne .................................... 422-butyne ................................... 43transition state for Diels-Aldercycloaddition ofcyclopentadiene andacrylonitrile .............................. 83transition state fordifluorocarbene additionto ethylene ............................... 87transition state for ene reactionof 1-pentene ............................. 76transition state for ethyleneinsertion into
Index 12/31/03, 8:27 AM294

295
bis(cyclopentadienyl)(methyl) zirconium cation ..... 116
View; Build menu, view ......... 21,161
Volumeof CPK model ........................ 212of graphical surface ............... 195partial ..................................... 212units ....................................... 265
W
Wire; Model menu, wire ........ 22,128
Wire model ............................. 22,128
Z
Zooming ................................... 12,13
Index 12/31/03, 8:27 AM295

Index 12/31/03, 8:27 AM296