turning the challenge of quantum biology on its head
TRANSCRIPT
Faraday DiscussionsCite this: Faraday Discuss., 2019, 216, 57
PAPER
Ope
n A
cces
s A
rtic
le. P
ublis
hed
on 2
5 M
arch
201
9. D
ownl
oade
d on
3/2
1/20
22 1
2:19
:42
AM
. T
his
artic
le is
lice
nsed
und
er a
Cre
ativ
e C
omm
ons
Attr
ibut
ion
3.0
Unp
orte
d L
icen
ce.
View Article OnlineView Journal | View Issue
Turning the challenge of quantum biologyon its head: biological control of quantumoptical systems
Anna Lishchuk, a Cvetelin Vasilev,b Matthew P. Johnson,b
C. Neil Hunter, b Paivi Torma c and Graham J. Leggett *a
Received 16th December 2018, Accepted 24th January 2019
DOI: 10.1039/c8fd00241j
When light-harvesting complex II (LHCII), isolated from spinach, is adsorbed onto arrays of
gold nanostructures formed by interferometric lithography, a pronounced splitting of the
plasmon band is observed that is attributable to strong coupling of the localised surface
plasmon resonance to excitons in the pigment–protein complex. The system is
modelled as coupled harmonic oscillators, yielding an exciton energy of 2.24 � 0.02 eV.
Analysis of dispersion curves yields a Rabi energy of 0.25 eV. Extinction spectra of the
strongly coupled system yield a resonance at 1.43 eV that varies as a function of the
density of nanostructures in the array. The enhanced intensity of this feature is
attributed to strong plasmon–exciton coupling. Comparison of data for a large number
of light-harvesting complexes indicates that by control of the protein structure and/or
pigment compliment it is possible to manipulate the strength of plasmon–exciton
coupling. In strongly coupled systems, ultra-fast exchange of energy occurs between
pigment molecules: coherent coupling between non-local excitons can be manipulated
via selection of the protein structure enabling the observation of transitions that are not
seen in the weak coupling regime. Synthetic biology thus provides a means to control
quantum-optical interactions in the strong coupling regime.
Introduction
Organic semiconductors, produced from earth-abundant elements via low-energypathways, are attractive for the sustainable production of devices and materialsfor many new and emerging technologies, including consumer electronics, solarenergy capture, quantum computing, quantum communications and photo-catalysis. However, molecular systems are intrinsically disordered; dephasingrates are thus high,1,2 and excitons are transported via incoherent hopping
aDepartment of Chemistry, University of Sheffield, Brook Hill, Sheffield S3 7HF, UK. E-mail: Graham.Leggett@
sheffield.ac.ukbDepartment of Molecular Biology and Biotechnology, University of Sheffield, Western Bank, Sheffield S10 2TN,
UKcDepartment of Applied Physics, Aalto University, School of Science, P.O. Box 15100, 00076 Aalto, Finland
This journal is © The Royal Society of Chemistry 2019 Faraday Discuss., 2019, 216, 57–71 | 57

Faraday Discussions PaperO
pen
Acc
ess
Art
icle
. Pub
lishe
d on
25
Mar
ch 2
019.
Dow
nloa
ded
on 3
/21/
2022
12:
19:4
2 A
M.
Thi
s ar
ticle
is li
cens
ed u
nder
a C
reat
ive
Com
mon
s A
ttrib
utio
n 3.
0 U
npor
ted
Lic
ence
.View Article Online
processes and have small diffusion lengths, typically �10 nm but rising to�50 nm in exceptional cases.2 Design rules for the efficient transport of excitonsacross long distances are lacking, placing signicant constraints on devicearchitecture and impeding the development of these technologies.2
The importance of coherence as a design concept for molecular photonicmaterials has thus been recognised.3–5 Theory6–9 and measurements by ultra-fastspectroscopy10–14 have suggested that quantum coherent excitations of multiplepigment molecules in photosynthetic light-harvesting complexes (LHCs) facilitateefficient energy transfer, leading to the delocalisation of excitation around indi-vidual complexes and also to more efficient transfer of energy between complexesvia Forster resonance energy transfer (FRET).15 There has thus been a resurgenceof interest in quantum biology, and it has been suggested that photosyntheticmechanisms provide a model for the design of molecular photonic structures toachieve efficient transport of excitons.5,16
However, the idea remains controversial.17,18 For example, Miller and co-workers recently argued that decoherence rates in light harvesting proteins areso fast under physiological conditions that electronic coherence could notcontribute to photosynthesis.19Moreover, while it is thought that intra-membraneFRET transfers are efficient and enable excitonic transport across distances of atleast several 10s of nm, a direct experimental determination of the excitondiffusion length is still lacking.
Here we describe a different approach based on the strong coupling of plas-mon modes to excitons in light harvesting proteins. In contrast to the electroniccoherence posited to occur in LHCs, strong plasmon–exciton coupling does notrely upon achieving a superposition of excitonic wavefunctions; instead, pigmentmolecules exchange energy coherently via a conned electromagnetic mode.
Plasmons are collective oscillations of surface electrons.20,21 Their character-istic frequencies are typically in the visible region of the electromagnetic spec-trum, and resonant coupling of a plasmon to incident electromagnetic radiationyields a surface plasmon polariton. When the plasmon is formed at the surface ofa nanostructure the polariton mode is conned – it is a localised surface plasmonresonance (LSPR). In strong plasmon–exciton coupling,22–27 light and matterstates exchange energy faster than their respective decay channels, giving rise tonew quasiparticles called plasmon–exciton polaritons (“plexcitons”) in which theelectronic states of the plasmon and exciton are mixed to form hybrid light-matterstates.27 The coupling is a collective phenomenon: the plasmon is hybridised toan array of emitters.28 The properties of the plexcitons are thus determined by thearrangement of the emitters as well as the properties of the plasmon and exciton.An important consequence of this is that all of the emitters coupled to a particularnanostructure – which may be 200–300 nm in size – are coherent.27
Recently we reported the rst example of strong coupling of a plasmon modeto a biological molecule.28 Gold nanostructure arrays were found to exhibitsurface plasmon resonances that split aer attachment of light harvestingcomplexes 1 and 2 (LH1 and LH2) from purple bacteria. The splitting wasattributed to strong coupling between the localized surface plasmon resonancesand excitons in the light-harvesting complexes, and the coupling was modelled ascoupled harmonic oscillators.
Here we show that plasmon modes are strongly coupled to excitons in plantlight-harvesting complexes. Furthermore we show that there is enhanced
58 | Faraday Discuss., 2019, 216, 57–71 This journal is © The Royal Society of Chemistry 2019

Paper Faraday DiscussionsO
pen
Acc
ess
Art
icle
. Pub
lishe
d on
25
Mar
ch 2
019.
Dow
nloa
ded
on 3
/21/
2022
12:
19:4
2 A
M.
Thi
s ar
ticle
is li
cens
ed u
nder
a C
reat
ive
Com
mon
s A
ttrib
utio
n 3.
0 U
npor
ted
Lic
ence
.View Article Online
evanescent coupling between nanostructures in arrays of gold nanostructures asa result of this strong coupling. Data from a wide range of natural and syntheticlight-harvesting complexes demonstrate that the energies of plexcitonic states canbe controlled via selection of the protein structure and the spatial arrangement ofemitters, and that coherent ultra-fast exchange of energy between non-localpigments occurs via the plasmon mode.
ExperimentalMaterials and chemicals
Microscope coverslip slides (22 mm � 50 mm, no. 1.5 thickness) were obtainedfrom Menzel-Glaser, Germany. Gold wire (99.997% trace metals basis) andchromium chips (99.5% trace metals basis) used for the thermal evaporation werepurchased from Sigma-Aldrich. The 30% hydrogen peroxide solution and 95%concentrated sulfuric acid used for preparation of the piranha solution weresupplied by VWR Chemicals, UK. For preparation of the gold etchant solution,32% ammonia solution, HPLC purity ethanol, and cysteamine, obtained fromSigma-Aldrich, were used. 1-Octadecanethiol (98%) and HEPES were also ob-tained from Sigma-Aldrich. Chemicals used for the gold nanostructures func-tionalization, i.e. 11-amino-1-undecanethiol hydrochloride, glutaraldehyde(25%), Na,Na-bis(carboxymethyl)-L-lysine triuoroacetate salt (AB-NTA), andnickel sulfate were supplied by Sigma-Aldrich. All chemicals were used asreceived.
Fabrication of gold nanostructures
All glassware, i.e. the microscope coverslip slides and vials used, were cleanedinitially by submersion in piranha solution, a mixture of hydrogen peroxide andconcentrated sulfuric acid in the ratio 3 : 7, for 40–60 min, until the solution hasstopped bubbling and cooled down to room temperature. The glassware wasrinsed thoroughly with deionized water and sonicated for 10 min before beingplaced in the oven (ca. 90 �C) to dry.
Gold substrates were prepared by evaporating a 3–5 nm thick chromium lmfollowed by a 20–22 nm (unless otherwise is stated) thick gold layer. Chromiumand gold were both deposited by thermal evaporation using an Edwards Auto 306bell jar vacuum coating system under pressure of 8 � 10�7 mbar. Evaporationrates of 0.1 nm s�1 for Cr and 0.1–0.2 nm s�1 for Au were used. It should be notedthat the above-stated thickness values were taken from the evaporator QCMthicknessmonitor. Theymay differ (by up to 8%) from the actual thickness values,which were determined later on by spectroscopic ellipsometry.
Chromium/gold coated glass slides were immersed in a 1 mM solution of 1-octadecanethiol (ODT) in ethanol for at least 24 h to form closely packed self-assembled monolayers (SAMs). SAMs of ODT on gold were photopatterned byinterferometric lithography (IL) using a Lloyd’s mirror two-beam interferometerin conjunction with the frequency-doubled argon ion laser emitting at 244 nm(Innova FreD 300C, Coherent, UK). The angle between the mirror and the samplein the interferometer was 30 � 2.5�. Samples were patterned using IL with a doseof 34 J cm�2. Subsequently, samples were rotated by different angles on thesample stage and exposed again, to a dose of 20 J cm�2.29
This journal is © The Royal Society of Chemistry 2019 Faraday Discuss., 2019, 216, 57–71 | 59

Faraday Discussions PaperO
pen
Acc
ess
Art
icle
. Pub
lishe
d on
25
Mar
ch 2
019.
Dow
nloa
ded
on 3
/21/
2022
12:
19:4
2 A
M.
Thi
s ar
ticle
is li
cens
ed u
nder
a C
reat
ive
Com
mon
s A
ttrib
utio
n 3.
0 U
npor
ted
Lic
ence
.View Article Online
Photopatterned ODT monolayers on gold were etched by immersion in 2 mMcysteamine with an added 8% v/v of ammonia in HPLC ethanol. Aer etching, thesamples were then rinsed with ethanol, dried under a steam of nitrogen andannealed in a chamber furnace (Carbolite, UK) at 500–550 �C for 60–90 min. Theheating rate was ca. 7 �Cmin�1 and the annealed samples were le to cool in air toroom temperature. Highly crystalline structures and strong plasmon bands wereobserved in extinction spectra aer annealing.
Samples were cleaned for re-use by immersion in piranha solution (which wasallowed to cool down to room temperature) for 5–7 min, washed thoroughly withdeionized water and blown dry with nitrogen.
Surface functionalization and protein adsorption
Arrays of gold nanostructures were functionalized with 11-amino-1-undecanethiol (AUT) by immersion in a 2 mM solution of the adsorbate inethanol for 18 h, washed with ethanol and dried with nitrogen. The samples werethen immersed in LHCII in 20 mM HEPES buffer, 0.03% BDDM, pH 7.5. Thesurfaces were immersed in the protein/buffer solution overnight in a humidchamber in a fridge. Finally, the samples were then gently washed with HEPESbuffer and deionized water and dried under a steam of nitrogen.
Characterization
Morphology of the as-fabricated and annealed gold nanostructures was deter-mined with atomic force microscopy (AFM). AFM images were acquired in airusing a Nanoscope Multimode 8 atomic force microscope (Bruker, Germany)operated in a tapping mode. Tapping mode probes used were OTESPA-R3 model(Bruker), with a resonance frequency of ca. 300 kHz and a nominal tip radius of7 nm. Image analysis was performed with the Bruker NanoScope Analysis (v.1.5)soware.
UV-visible absorption spectra at normal incidence were recorded in air usinga Cary50 spectrophotometer (Agilent Technologies, USA). The wavelength scanrange was 350–850 nm (unless otherwise stated). The samples were placed ina special holder enabling absorption measurements of the same spot on thesample during all experimental stages.
Results and discussionExtinction spectra
LHCII is the most abundant antenna protein in the photosynthetic apparatus ofhigher plants, and its primary function is to funnel energy into the photosystem IIreaction centre. It is a trimeric protein,30 containing 7–8 chlorophyll (Chl) a, 5–6Chl b and 3–4 carotenoids (Crt),31 the latter being a mixture of lutein, neoxanthinand violaxanthin. Fig. 1 shows the extinction spectrum for LHCII isolated fromspinach and dissolved in buffer (green trace). The Chl a and Chl b Qy transitionsare observed at 1.83 and 1.90 eV, respectively. The Chl b Soret band is observed at2.84 eV, and a broad feature peaking at 2.63 eV results from overlapping bandsdue to the Chl Soret transitions and the S0 / S2 transitions in the Crt.
Macroscopically extended (�1 cm2) arrays of gold nanostructures were fabri-cated using interferometric lithography in a double-exposure process, as
60 | Faraday Discuss., 2019, 216, 57–71 This journal is © The Royal Society of Chemistry 2019

Fig. 1 Normalized extinction spectra of LHCII in buffer solution (green), clean goldnanostructures (blue) and gold nanostructures after adsorption of LHCII (red).
Paper Faraday DiscussionsO
pen
Acc
ess
Art
icle
. Pub
lishe
d on
25
Mar
ch 2
019.
Dow
nloa
ded
on 3
/21/
2022
12:
19:4
2 A
M.
Thi
s ar
ticle
is li
cens
ed u
nder
a C
reat
ive
Com
mon
s A
ttrib
utio
n 3.
0 U
npor
ted
Lic
ence
.View Article Online
described previously.32 An advantage of fabricating nanostructures over largeareas is that spectroscopic measurements can be made with a simple bench-topspectrophotometer with illumination at low light intensities. The blue trace inFig. 1 is the extinction spectrum of an array of clean gold nanostructures. Thenanostructures were approximately disc-shaped with a height of 60 � 10 nm anddiameter 140.5 � 17.5 nm at a pitch of 296 � 16 nm. A strong feature is observedat 2.06 eV corresponding to the localised surface plasmon resonance (LSPR) of thegold nanostructures. The LSPR energy, ELSPR, can be controlled by varying theangle 2q between the sample and mirror in the spectrophotometer, the angle ofrotation between exposures and the etch conditions.
Fig. 1 also shows an extinction spectrum of the same array aer adsorption ofa monolayer of light-harvesting complex II (LHCII) (red trace). It can be seen thataer adsorption of LHCII onto the gold nanostructures there is a dramatic changein the spectrum. The plasmon mode is split to yield a broad feature at 1.98 eV anda narrow feature at 2.27 eV. This type of splitting is characteristic of a type ofasymmetric Fano resonance in which a broad mode (the plasmon mode) iscoupled to a narrow one (the exciton).
Modelling
Gallinet andMartin provided a rst-principles analysis of strong plasmon–excitoncoupling.33 They demonstrated that in the case of a broad resonance coupled toa narrow one, the coupling may be modelled as coupled harmonic oscillators. Inour previous work we described the application of such a model to the strongcoupling of LSPRs to excitons in bacterial light-harvesting complexes. The sameapproach was used here to model the extinction spectra obtained aer adsorptionof LHCII onto arrays of metal nanoparticles. Fig. 2 shows the region of theextinction spectrum from 1.7 to 2.35 eV, containing the plasmon band (redsymbols) together with a spectrum tted using our coupled oscillator model. Itcan be seen that the t is very good. The model yields an exciton energy of 2.22 �0.01 eV and a coupling strength of 0.27 � 0.015 eV. These data are consistent withstrong plasmon–exciton coupling.
This journal is © The Royal Society of Chemistry 2019 Faraday Discuss., 2019, 216, 57–71 | 61

Fig. 2 Extinction spectrum showing the plasmon band at higher resolution afteradsorption of LHCII onto gold nanostructure arrays (red symbols) and a fitted spectrumobtained by modelling the system as coupled harmonic oscillators (black line).
Faraday Discussions PaperO
pen
Acc
ess
Art
icle
. Pub
lishe
d on
25
Mar
ch 2
019.
Dow
nloa
ded
on 3
/21/
2022
12:
19:4
2 A
M.
Thi
s ar
ticle
is li
cens
ed u
nder
a C
reat
ive
Com
mon
s A
ttrib
utio
n 3.
0 U
npor
ted
Lic
ence
.View Article Online
To test this hypothesis further, measurements were made for a series of arraysof nanostructures with different LSPR energies aer adsorption of LHCII. Thespectra were modelled and the energies of the upper and lower polaritonbranches of the coupled system were determined. The data are shown in Fig. 3.The data were tted to yield dispersion curves using the relationship:34
EUB;LBplexitonðħuLSPRÞ ¼ ħuLSPR þ ħumol
2� 1
2
ffiffiffiffiffiffiffiffiffiffiffiffiffiffiffiffiffiffiffiffiffiffiffiffiffiffiffiffiffiffiffiffiffiffiffiffiffiffiffiffiffiffiffiffiffiffiffiffiffiffiffiffiffiffiffiffiffiðħURÞ2 þ ðħuLSPR � ħumolÞ2
q(1)
where ħuLSPR and ħumol are the energies of the uncoupled LSPR and exciton, andħUR is the Rabi splitting, the separation between the upper (UB) and lower (LB)polariton branches at resonance (uLSPR ¼ umol). The Rabi splitting (the couplingenergy) is determined as the difference between the energies of the upper andlower polariton branches at resonance, when ħuLSPR ¼ ħumol. It was not possible
Fig. 3 Dispersion curves for the plexcitonic states determined from experimental data(circles and squares) together with curves fitted using eqn (1). The dotted lines representthe energies of the uncoupled exciton and LSPR states.
62 | Faraday Discuss., 2019, 216, 57–71 This journal is © The Royal Society of Chemistry 2019

Paper Faraday DiscussionsO
pen
Acc
ess
Art
icle
. Pub
lishe
d on
25
Mar
ch 2
019.
Dow
nloa
ded
on 3
/21/
2022
12:
19:4
2 A
M.
Thi
s ar
ticle
is li
cens
ed u
nder
a C
reat
ive
Com
mon
s A
ttrib
utio
n 3.
0 U
npor
ted
Lic
ence
.View Article Online
to fabricate arrays of nanostructures with LSPR energies greater than Emol (2.24eV), thus the dispersion curves were tted using only data for which ELSPR < Emol.However, it is still possible to estimate the Rabi energy as 0.25 eV. Using this valuewe can test whether the system has entered the strong coupling regime. There area number of criteria for this. One widely used measure is ħUR $
ffiffiffiffiffiffiffiffiffiffiffiffiffiffiffiffiffiffiffiffigmolgLSPR
p,27
where gLSPR and gmol are the linewidths of the uncoupled LSPR and exciton states.In the present case, gLSPR is� 0.6 eV and gmol is� 0.1 eV, hence the Rabi splittingshould be greater than 0.24 eV, a condition that is satised here.
Modelling of the spectra yields the exciton energy Emol. Fig. 4 shows the vari-ation in Emol with the plasmon energy. As expected, the value of Emol remainsinvariant within experimental error at a mean value of 2.24 eV. However, thisvalue does not match the energy of any of the main transitions in the LHCIIpigment molecules. In our previous work on bacterial photosynthetic proteins,the calculated value of Emol was found to be equal to that of the Crt S0 / S2transition for Crt-containing LHCs, and that of the bacteriochlorophyll (BChl) Qxtransition for a Crt-free mutant of LH1. In the present study the value of Emol liesclose to the energy of the Crt S0 / S2 transitions between 2.5 and 2.6 eV, but issmaller in magnitude. We hypothesise that this reects the fact that the plasmonmode couples strongly to an ensemble of emitters.
The coupling energy depends on the square root of the density of excitons, butis proportional to the transition dipole moment:27
EC ¼ffiffiffiffiffiffiffiffiffiffiffiffiffiffiffiffiffiffiffiffiffiffiffiffiffiffiffiffiffiffiffiffiffim2Emol
2
303bELSPR
N
VLSPR
s(2)
In LH2, there are 3 BChl for each Crt and the Crt S0 / S2 transition dipolemoment is �10 � that of the BChl Qx transition dipole moment. Given that thecoupling energy is ECf
ffiffiffiffiffiffiffiffiffiffiN=V
pbut that EC f m, it seems reasonable that plasmon–
exciton coupling for LH2 is dominated by coupling to the Crt S0 / S2 transition.However, in LHCII there are �4 Chl for each Crt and, moreover, the transitiondipole moment for the S0 / S2 transition in lutein is �3� the magnitude of that
Fig. 4 Variation in the exciton energy (triangles) and scaled coupling energy (circles) asa function of the LSPR energy for a monolayer of LHCII attached to gold nanostructures.
This journal is © The Royal Society of Chemistry 2019 Faraday Discuss., 2019, 216, 57–71 | 63
Faraday Discussions PaperO
pen
Acc
ess
Art
icle
. Pub
lishe
d on
25
Mar
ch 2
019.
Dow
nloa
ded
on 3
/21/
2022
12:
19:4
2 A
M.
Thi
s ar
ticle
is li
cens
ed u
nder
a C
reat
ive
Com
mon
s A
ttrib
utio
n 3.
0 U
npor
ted
Lic
ence
.View Article Online
for the Qy transition dipole moments of the Chl.35 Thus the situation is morecomplicated and one might not expect the coupling to simply be dominated bycoupling to the Crt S0 / S2 transition. Our current model is unable to separatethe couplings to different excitons, but instead models the ensemble behaviour.In the future it is expected that more sophisticated models may be capable ofanalysing the separate contributions to the plasmon–exciton coupling.
In the coupled harmonic oscillator model, the coupling constant g has thedimensions of frequency squared. When scaled to be expressed in units of energy,the coupling constant is G and the coupling energy (equal to the splitting betweenthe normal modes) is EC ¼ G/ELSPR, where ELSPR is the energy of the LSPR. Thevariation in EC with ELSPR is shown in Fig. 4 (red circles). It can be seen that as theLSPR energy is decreased below 2.24 eV, the coupling gradually increases to reachvalues close to 0.3 eV. This behaviour is consistent with that predicted usingeqn (2).
Plasmonic coupling in arrays
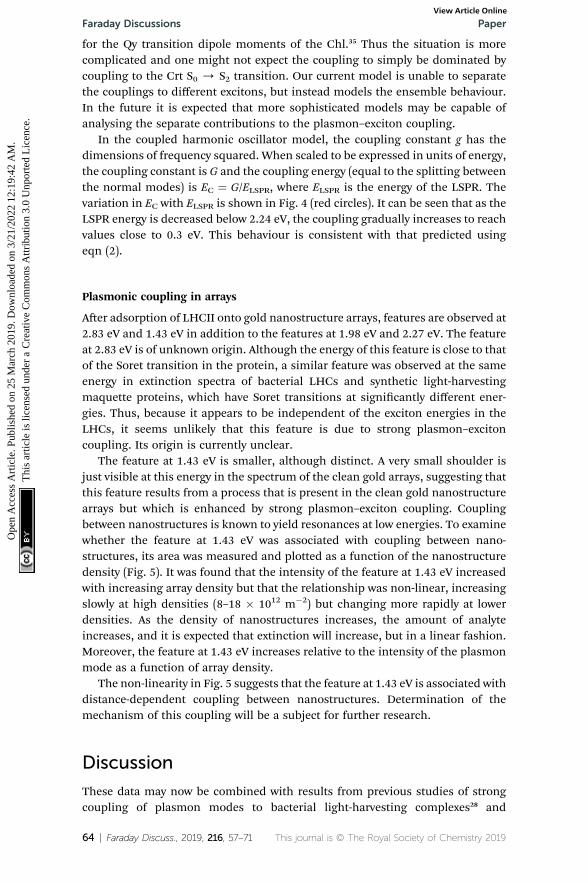
Aer adsorption of LHCII onto gold nanostructure arrays, features are observed at2.83 eV and 1.43 eV in addition to the features at 1.98 eV and 2.27 eV. The featureat 2.83 eV is of unknown origin. Although the energy of this feature is close to thatof the Soret transition in the protein, a similar feature was observed at the sameenergy in extinction spectra of bacterial LHCs and synthetic light-harvestingmaquette proteins, which have Soret transitions at signicantly different ener-gies. Thus, because it appears to be independent of the exciton energies in theLHCs, it seems unlikely that this feature is due to strong plasmon–excitoncoupling. Its origin is currently unclear.
The feature at 1.43 eV is smaller, although distinct. A very small shoulder isjust visible at this energy in the spectrum of the clean gold arrays, suggesting thatthis feature results from a process that is present in the clean gold nanostructurearrays but which is enhanced by strong plasmon–exciton coupling. Couplingbetween nanostructures is known to yield resonances at low energies. To examinewhether the feature at 1.43 eV was associated with coupling between nano-structures, its area was measured and plotted as a function of the nanostructuredensity (Fig. 5). It was found that the intensity of the feature at 1.43 eV increasedwith increasing array density but that the relationship was non-linear, increasingslowly at high densities (8–18 � 1012 m�2) but changing more rapidly at lowerdensities. As the density of nanostructures increases, the amount of analyteincreases, and it is expected that extinction will increase, but in a linear fashion.Moreover, the feature at 1.43 eV increases relative to the intensity of the plasmonmode as a function of array density.
The non-linearity in Fig. 5 suggests that the feature at 1.43 eV is associated withdistance-dependent coupling between nanostructures. Determination of themechanism of this coupling will be a subject for further research.
Discussion
These data may now be combined with results from previous studies of strongcoupling of plasmon modes to bacterial light-harvesting complexes28 and
64 | Faraday Discuss., 2019, 216, 57–71 This journal is © The Royal Society of Chemistry 2019

Fig. 5 Variation in the intensity of the feature at 1.43 eV in the extinction spectra ofnanostructure arrays coupled to LHCII as a function of the density of nanostructures in thearray.
Paper Faraday DiscussionsO
pen
Acc
ess
Art
icle
. Pub
lishe
d on
25
Mar
ch 2
019.
Dow
nloa
ded
on 3
/21/
2022
12:
19:4
2 A
M.
Thi
s ar
ticle
is li
cens
ed u
nder
a C
reat
ive
Com
mon
s A
ttrib
utio
n 3.
0 U
npor
ted
Lic
ence
.View Article Online
synthetic maquette proteins36 to begin to assemble a detailed picture of the waythat protein structure may be used to control strong plasmon–exciton coupling.
The pigment complement of light harvesting complexes determines thecoupling strength
In strong plasmon–exciton coupling, the energies of the resulting plexcitonicstates are determined by the energy of the LSPR (which is controllable, viamodication of the lithographic process),32 the energy and transition dipolemoment of the exciton, and the organisation of the excitons. Because of theirexquisitely controlled architectures, light-harvesting complexes provide powerfulmodel systems within which to explore strong plasmon–exciton coupling.
Fig. 6 combines data from all three studies completed to date. It shows themean coupling energy EC determined from tting the extinction spectra for
Fig. 6 Mean coupling energy EC as a function of the exciton energy Emol for a variety oflight-harvesting complexes and for self-assembled monolayers derivatised by attachmentof chlorophyll a. For LHCII, the error bars are similar in size to the symbol used.
This journal is © The Royal Society of Chemistry 2019 Faraday Discuss., 2019, 216, 57–71 | 65

Faraday Discussions PaperO
pen
Acc
ess
Art
icle
. Pub
lishe
d on
25
Mar
ch 2
019.
Dow
nloa
ded
on 3
/21/
2022
12:
19:4
2 A
M.
Thi
s ar
ticle
is li
cens
ed u
nder
a C
reat
ive
Com
mon
s A
ttrib
utio
n 3.
0 U
npor
ted
Lic
ence
.View Article Online
a number of strongly coupled systems as a function of the exciton energy Emol.The data are clustered into two broad groups. Three points lie just outside thethreshold for the strong coupling regime: a monolayer derivatised with Chl a, BT6maquettes containing a single binding site for a chlorin (BT6-SE3691), and “blue”LH1, a carotenoid-free mutant of LH1 from R. sphaeroides all yield couplingenergies that are signicant but not sufficiently large to be said to have enteredthe strong coupling regime. In all cases the pigment is a chlorin (or bacterio-chlorin) with a comparatively small transition dipole moment, and in all cases theexciton density is low (�1017 m�2).
A second group of points exhibits larger coupling energies. For each of theseproteins, the coupling energy is large enough to yield strong splitting of theplasmon mode. This group includes wild-type (WT) LH2, in which the Crt isspheroidenone, and the Dcrtl::crtlPaDcrtC LH2 mutant, which has the samestructure as WT-LH2 save that spheroidenone has been replaced by lycopene. Inthe case of these proteins, the Crt transition dipole moment is aligned perpen-dicular to the surface of the gold nanostructure to which they are attached,meaning that it lies in the direction of the electric eld associated with the LSPR.The Qx transition dipole moment lies in this direction, but its transition dipolemoment is much smaller and the extinction spectra appear to be dominated bystrong coupling of plasmon modes to the Crt S0 / S2 transition, yielding cleardifferences in the splitting for different mutants (Fig. 7). The Qy transition dipolemoment lies orthogonal to the LSPR eld direction and it does not couple to theplasmon mode. In blue LH2 it is the Qx transition dipole moment that couples tothe LSPR.
The coupling energy is still larger for theDcrtCmutant of LH1, in which the Crtis neurosporene which has a larger transition energy than those of spheroidenoneand lycopene.28 The Crt in LHCII have energies closer to that of the S0 / S2transition in neurosporene than the other mutants of LH2, so that the couplingenergy measured here for LHCII appears slightly small. This is probablya consequence of the different structure of the protein: LH2 has a pronouncedcircular symmetry and the transition dipole moments of the Crt will consequentlylie close to the direction of the LSPR eld, but the structure of LHCII is morecomplex and the transition dipole moments of neither the Crt nor the Chl lie ina single direction. This will inevitably reduce the coupling strength.
His-tagged LH2 yields the largest coupling energy measured in our studies oflight harvesting systems, at 0.41 eV, signicantly larger than the value obtainedfor WT LH2. This is attributed to the strong binding of His-tagged proteins tonanostructures that are functionalised with nitrilotriacetic acid (NTA), which isexpected to lead to a higher surface coverage of immobilised LH2 and thusa higher density of excitons within the plasmon mode volume.
Synthetic biology enables the control of ultra-fast non-local exchange of energyin strongly coupled systems
In our previous studies we demonstrated that for bacterial light harvestingcomplexes and synthetic maquette proteins the coupling strength varied with thesquare root of the density of proteins at the gold surface. These observationsreect the fact that in strong plasmon–exciton coupling, an LSPR couples to anensemble of emitters. Although we have successfully used a simple classical
66 | Faraday Discuss., 2019, 216, 57–71 This journal is © The Royal Society of Chemistry 2019
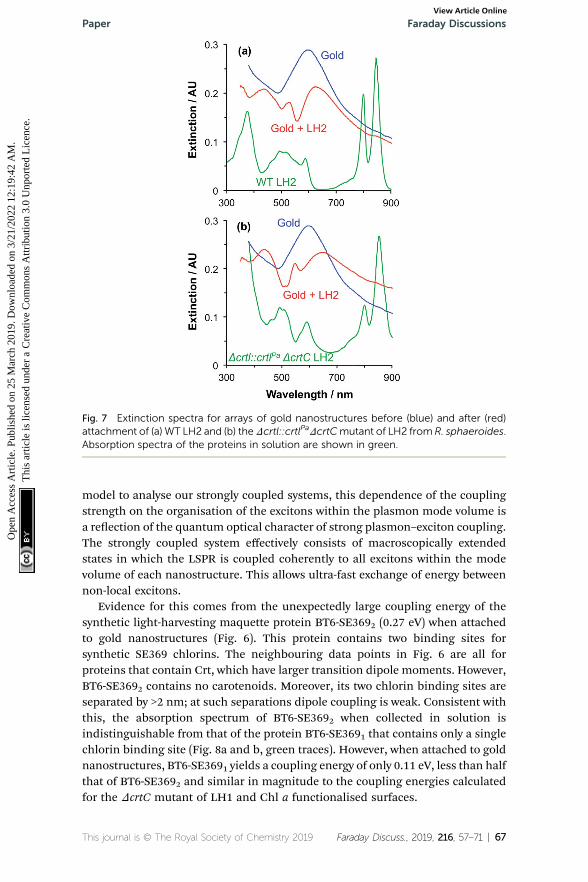
Fig. 7 Extinction spectra for arrays of gold nanostructures before (blue) and after (red)attachment of (a) WT LH2 and (b) theDcrtl::crtlPaDcrtCmutant of LH2 from R. sphaeroides.Absorption spectra of the proteins in solution are shown in green.
Paper Faraday DiscussionsO
pen
Acc
ess
Art
icle
. Pub
lishe
d on
25
Mar
ch 2
019.
Dow
nloa
ded
on 3
/21/
2022
12:
19:4
2 A
M.
Thi
s ar
ticle
is li
cens
ed u
nder
a C
reat
ive
Com
mon
s A
ttrib
utio
n 3.
0 U
npor
ted
Lic
ence
.View Article Online
model to analyse our strongly coupled systems, this dependence of the couplingstrength on the organisation of the excitons within the plasmon mode volume isa reection of the quantum optical character of strong plasmon–exciton coupling.The strongly coupled system effectively consists of macroscopically extendedstates in which the LSPR is coupled coherently to all excitons within the modevolume of each nanostructure. This allows ultra-fast exchange of energy betweennon-local excitons.
Evidence for this comes from the unexpectedly large coupling energy of thesynthetic light-harvesting maquette protein BT6-SE3692 (0.27 eV) when attachedto gold nanostructures (Fig. 6). This protein contains two binding sites forsynthetic SE369 chlorins. The neighbouring data points in Fig. 6 are all forproteins that contain Crt, which have larger transition dipole moments. However,BT6-SE3692 contains no carotenoids. Moreover, its two chlorin binding sites areseparated by >2 nm; at such separations dipole coupling is weak. Consistent withthis, the absorption spectrum of BT6-SE3692 when collected in solution isindistinguishable from that of the protein BT6-SE3691 that contains only a singlechlorin binding site (Fig. 8a and b, green traces). However, when attached to goldnanostructures, BT6-SE3691 yields a coupling energy of only 0.11 eV, less than halfthat of BT6-SE3692 and similar in magnitude to the coupling energies calculatedfor the DcrtC mutant of LH1 and Chl a functionalised surfaces.
This journal is © The Royal Society of Chemistry 2019 Faraday Discuss., 2019, 216, 57–71 | 67

Fig. 8 (a) Extinction spectra for the clean gold nanostructure array (black), BT6-SE3692 inbuffer (green) and nanostructures derivatised by attachment of BT6-SE3692 (blue). (b)Extinction spectra for clean gold nanostructure array (black), BT6-SE3691 in buffer (green)and nanostructures derivatised by attachment of BT6-SE3691 (red). (c) Experimental data(blue) and fitted spectrum (black) for gold nanostructures derivatised by attachment ofBT6-SE3692. (d) Experimental data (red) and fitted spectrum (black) for gold nano-structures derivatised by attachment of BT6-SE3691.
Faraday Discussions PaperO
pen
Acc
ess
Art
icle
. Pub
lishe
d on
25
Mar
ch 2
019.
Dow
nloa
ded
on 3
/21/
2022
12:
19:4
2 A
M.
Thi
s ar
ticle
is li
cens
ed u
nder
a C
reat
ive
Com
mon
s A
ttrib
utio
n 3.
0 U
npor
ted
Lic
ence
.View Article Online
Modelling of the extinction spectra yields an exciton energy for BT6-SE3691 of2.06 � 0.07 eV, close to that of the Qy transition in the protein. For BT6-SE3692,however, an exciton energy of 2.20 � 0.01 eV is obtained, intermediate betweenthe energies of the Qx and Qy transitions of the chlorin. A transition with thisenergy is not observed in the absorption spectrum of either protein.
We hypothesise that these surprising observations are explained by strongcoupling of the LSPR to a dimer state not observed under weak coupling. Tran-sition dipole moments in aggregates of pigment molecules may couple to form J-dimers (or aggregates) leading to a red shi in the exciton energy,37 or H-dimers(or aggregates) leading to a blue shi38 (as shown in Fig. 9). However, as notedabove, the chlorins in BT6-SE3692 are too far apart for effective dipole coupling.We hypothesise that in the strongly coupled system, the dimer state results fromultra-fast exchange of energy between non-local pigment molecules via the plas-mon mode. The observation of this dipole coupling is thus a consequence of thecoherence that is intrinsic to strongly coupled systems.
The blue shi in the exciton energy that results from strong coupling of theplasmon mode to excitons in BT6-SE3692 suggests the formation of H-dimers.Such coupling of the chlorins would also yield an increase in the transitiondipole moment, which, combined with the larger exciton energy, would account
68 | Faraday Discuss., 2019, 216, 57–71 This journal is © The Royal Society of Chemistry 2019

Fig. 9 Possible alignment of pairs of SE369 chlorins in maquettes. The blue arrowrepresents the Qy transition dipole moment, and the red arrow the direction of the fieldassociated with the surface plasmon mode.
Paper Faraday DiscussionsO
pen
Acc
ess
Art
icle
. Pub
lishe
d on
25
Mar
ch 2
019.
Dow
nloa
ded
on 3
/21/
2022
12:
19:4
2 A
M.
Thi
s ar
ticle
is li
cens
ed u
nder
a C
reat
ive
Com
mon
s A
ttrib
utio
n 3.
0 U
npor
ted
Lic
ence
.View Article Online
for the much larger coupling energy determined for the two-chlorin maquette.However, the use of an H-dimer model here may represent an over-simplicationof what may be a more complex coupling mechanism: given that in strong plas-mon–exciton coupling the plasmon mode couples to an array of emitters, it isindeed plausible that the observed couplings involve chlorins in differentproteins. These data, combined with the close similarity of the absorption spectraacquired for the two proteins under weak coupling conditions, provide evidencethat by changing the structure of the maquette it was possible to manipulate thecoherent non-local transfer of energy in the strongly coupled system.
Conclusions
Plasmon modes are strongly coupled to excitons in light-harvesting complexesfrom plants and bacteria. The strong coupling regime is reached when the plas-mon mode and the excitons in pigment molecules exchange energy faster thantheir respective decay channels. By manipulating the structures of these pigment–protein complexes, the organisation of excitons within the plasmonmode volumecan be controlled precisely, enabling the properties of the coupled states to bemanipulated through the ultra-fast exchange of energy via the plasmon mode.Non-local coupling between excitons can be manipulated via the design ofsynthetic proteins and through the control of protein organisation at the surfacesof plasmonic nanostructures. Strong plasmon–exciton coupling achievescoherent transport of energy across distances of at least 100s of nm, but this canbe extended by manipulation of plasmonic coupling mechanisms in extendedarrays of plasmonic nanostructures.
Conflicts of interest
There are no conicts to declare.
Acknowledgements
The authors are grateful to the EPSRC (Programme Grant EP/I012060/1 andequipment grant EP/M028437/1) for Financial Support. C. V., M. P. J. and C. N. H.were supported by research grant BB/M000265/1 from the Biotechnology and
This journal is © The Royal Society of Chemistry 2019 Faraday Discuss., 2019, 216, 57–71 | 69

Faraday Discussions PaperO
pen
Acc
ess
Art
icle
. Pub
lishe
d on
25
Mar
ch 2
019.
Dow
nloa
ded
on 3
/21/
2022
12:
19:4
2 A
M.
Thi
s ar
ticle
is li
cens
ed u
nder
a C
reat
ive
Com
mon
s A
ttrib
utio
n 3.
0 U
npor
ted
Lic
ence
.View Article Online
Biological Sciences Research Council (UK) and Advanced Award 338895 from theEuropean Research Council.
Notes and references
1 C. J. Bardeen, Annu. Rev. Phys. Chem., 2014, 65, 127–148.2 G. J. Hedley, A. Ruseckas and I. D. W. Samuel, Chem. Rev., 2017, 117, 796–837.3 A. Chenu and G. D. Scholes, Annu. Rev. Phys. Chem., 2015, 66, 69–96.4 J.-L. Bredas, E. H. Sargent and G. D. Scholes, Nat. Mater., 2017, 16, 35–44.5 G. D. Scholes, G. R. Fleming, L. X. Chen, A. Aspuru-Guzik, A. Buchleitner,D. F. Coker, G. S. Engel, R. van Grondelle, A. Ishizaki, D. M. Jonas,J. S. Lundeen, J. K. McCusker, S. Mukamel, J. P. Ogilvie, A. Olaya-Castro,M. A. Ratner, F. C. Spano, K. B. Whaley and X. Zhu, Nature, 2017, 543, 647.
6 M. G. Cory, M. C. Zerner, X. Hu and K. Schulten, J. Phys. Chem. B, 1998, 102,7640–7650.
7 A. Damjanovic, T. Ritz and K. Schulten, Phys. Rev. E: Stat. Phys., Plasmas, Fluids,Relat. Interdiscip. Top., 1999, 59, 3293–3311.
8 M. L. Cartron, J. D. Olsen, M. Sener, P. J. Jackson, A. A. Brindley, P. Qian,M. J. Dickman, G. J. Leggett, K. Schulten and C. Neil Hunter, Biochim.Biophys. Acta, Bioenerg., 2014, 1837, 1769–1780.
9 M. Sener, J. Strumpfer, A. Singharoy, C. N. Hunter and K. Schulten, eLife, 2016,5, e09541.
10 H. Lee, Y.-C. Cheng and G. R. Fleming, Science, 2007, 316, 1462–1465.11 G. S. Engel, T. R. Calhoun, E. L. Read, T.-K. Ahn, T. Mancal, Y.-C. Cheng,
R. E. Blankenship and G. R. Fleming, Nature, 2007, 446, 782–786.12 E. Collini, C. Y. Wong, K. E. Wilk, P. M. G. Curmi, P. Brumer and G. D. Scholes,
Nature, 2010, 463, 644–647.13 P. D. Dahlberg, G. J. Norris, C. Wang, S. Viswanathan, V. P. Singh and
G. S. Engel, J. Chem. Phys., 2015, 143, 101101.14 P. D. Dahlberg, P.-C. Ting, S. C. Massey, M. A. Allodi, E. C. Martin, C. N. Hunter
and G. S. Engel, Nat. Commun., 2017, 8, 988.15 J. Strumpfer, M. Sener and K. Schulten, J. Phys. Chem. Lett., 2012, 3, 536–542.16 F. Fassioli, R. Dinshaw, P. C. Arpin and G. D. Scholes, J. R. Soc., Interface, 2014,
11, 20130901.17 A. Halpin, P. J. M. Johnson, R. Tempelaar, R. S. Murphy, J. Knoester,
T. L. C. Jansen and R. J. D. Miller, Nat. Chem., 2014, 6, 196–201.18 D. M. Wilkins and N. S. Dattani, J. Chem. Theory Comput., 2015, 11, 3411–3419.19 H.-G. Duan, V. I. Prokhorenko, R. J. Cogdell, K. Ashraf, A. L. Stevens,
M. Thorwart and R. J. D. Miller, Proc. Natl. Acad. Sci. U. S. A., 2017, 114,8493–8498.
20 T. W. Ebbesen, H. J. Lezec, H. F. Ghaemi, T. Thio and P. A. Wolff, Nature, 1998,391, 667–669.
21 W. L. Barnes, A. Dereux and T. W. Ebbesen, Nature, 2003, 424, 824–830.22 J. Dintinger, S. Klein, F. Bustos, W. L. Barnes and T. W. Ebbesen, Phys. Rev. B:
Condens. Matter Mater. Phys., 2005, 71, 035424.23 Y. Sugawara, T. A. Kelf, J. J. Baumberg, M. E. Abdelsalam and P. N. Bartlett,
Phys. Rev. Lett., 2006, 97, 266808.24 S. Aberra Guebrou, C. Symonds, E. Homeyer, J. C. Plenet, Y. N. Gartstein,
V. M. Agranovich and J. Bellessa, Phys. Rev. Lett., 2012, 108, 066401.
70 | Faraday Discuss., 2019, 216, 57–71 This journal is © The Royal Society of Chemistry 2019

Paper Faraday DiscussionsO
pen
Acc
ess
Art
icle
. Pub
lishe
d on
25
Mar
ch 2
019.
Dow
nloa
ded
on 3
/21/
2022
12:
19:4
2 A
M.
Thi
s ar
ticle
is li
cens
ed u
nder
a C
reat
ive
Com
mon
s A
ttrib
utio
n 3.
0 U
npor
ted
Lic
ence
.View Article Online
25 L. Shi, T. K. Hakala, H. T. Rekola, J. P. Martikainen, R. J. Moerland andP. Torma, Phys. Rev. Lett., 2014, 112, 153002.
26 A. I. Vakevainen, R. J. Moerland, H. T. Rekola, A. P. Eskelinen,J. P. Martikainen, D. H. Kim and P. Torma, Nano Lett., 2014, 14, 1721–1727.
27 P. Torma and W. L. Barnes, Rep. Prog. Phys., 2015, 78, 013901.28 A. Tsargorodska, M. L. Cartron, C. Vasilev, G. Kodali, O. A. Mass,
J. J. Baumberg, P. L. Dutton, C. N. Hunter, P. Torma and G. J. Leggett, NanoLett., 2016, 16, 6850–6856.
29 S. R. J. Brueck, Proc. IEEE, 2005, 93, 1704–1721.30 X. Wei, X. Su, P. Cao, X. Liu, W. Chang, M. Li, X. Zhang and Z. Liu, Nature,
2016, 534, 69–74.31 C. C. Gradinaru, I. H. M. van Stokkum, A. A. Pascal, R. van Grondelle and
H. van Amerongen, J. Phys. Chem. B, 2000, 104, 9330–9342.32 A. Tsargorodska, O. El Zubir, B. Darroch, M. l. L. Cartron, T. Basova,
C. N. Hunter, A. V. Nabok and G. J. Leggett, ACS Nano, 2014, 8, 7858–7869.33 B. Gallinet and O. J. F. Martin, Phys. Rev. B: Condens. Matter Mater. Phys., 2011,
83, 235427.34 A. E. Schlather, N. Large, A. S. Urban, P. Nordlander and N. J. Halas, Nano Lett.,
2013, 13, 3281–3286.35 P. Lopez-Tarifa, N. Liguori, N. van den Heuvel, R. Croce and L. Visscher, Phys.
Chem. Chem. Phys., 2017, 19, 18311–18320.36 A. Lishchuk, G. Kodali, J. A. Mancini, M. Broadbent, B. Darroch, O. A. Mass,
A. Nabok, P. L. Dutton, C. N. Hunter, P. Torma and G. J. Leggett, Nanoscale,2018, 10, 13064–13073.
37 S. Shoji, T. Ogawa, T. Hashishin, S. Ogasawara, H. Watanabe, H. Usami andH. Tamiaki, Nanotubes of Biomimetic Supramolecules Constructed bySynthetic Metal Chlorophyll Derivatives, Nano Lett., 2016, 16, 3650–3654.
38 B. Z. Packard, D. T. Toptygin, A. Komoriya and L. Brand, Proc. Natl. Acad. Sci. U.S. A., 1996, 93, 11640–11645.
This journal is © The Royal Society of Chemistry 2019 Faraday Discuss., 2019, 216, 57–71 | 71