turkey’s competitiveness: national economic strategy and ... files...turkey’s competitiveness:...
TRANSCRIPT

1 Copyright 2009 © Professor Michael E. PorterCompetitiveness Master - 2009-04-20.ppt
Turkey’s Competitiveness: National Economic Strategy and the Role of Business
Professor Michael E. PorterInstitute for Strategy and Competitiveness
Harvard Business School
Istanbul, Turkey16 October 2009
This presentation draws on ideas from Professor Porter’s articles and books, including, The Competitive Advantage of Nations (The Free Press, 1990), “The Microeconomic Foundations of Economic Development,” in The Global Competitiveness Report, (World Economic Forum), “Clusters and the New Competitive Agenda for Companies and Governments” in On Competition (Harvard Business School Press, 2008) and ongoing research at the Institute for Strategy and Competitiveness. No part of this publication may be reproduced, stored in a retrieval system, or transmitted in any form or by any means - electronic, mechanical, photocopying, recording, or otherwise - without the permission of Michael E. Porter. Further information on Professor Porter’s work and the Institute for Strategy and Competitiveness is available at www.isc.hbs.edu, Version: October 14, 2009 (6:30pm)

2 Copyright 2009 © Professor Michael E. PorterCompetitiveness Master - 2009-04-20.ppt
Agenda
• Turkey’s Economic Performance
• Principles of Competitiveness
• Assessment of Turkey’s Competitive Position
• Towards an Economic Strategy

3 Copyright 2009 © Professor Michael E. PorterCompetitiveness Master - 2009-04-20.ppt
$0
$2,000
$4,000
$6,000
$8,000
$10,000
$12,000
$14,000
1950 1955 1960 1965 1970 1975 1980 1985 1990 1995 2000 2005
Turkey’s Prosperity Performance
Note: PPP using EKS calculation methodology. Source: Groningen Growth and Development Centre, Total Economy Database (June 2009)
GDP per Capita(in 2008 PPP US$)
CAGR:
+3.27%
CAGR:
+3.27%CAGR:
+4.74%
CAGR:
+4.74%CAGR:
+2.57%
CAGR:
+2.57%
2008

4 Copyright 2009 © Professor Michael E. PorterCompetitiveness Master - 2009-04-20.ppt
$0
$5,000
$10,000
$15,000
$20,000
$25,000
$30,000
$35,000
0% 5% 10% 15% 20%
PPP-adjusted GDP per Capita, 2008 ($USD)
Growth of Real GDP per Capita (PPP-adjusted), CAGR, 2001 to 2008Source: EIU (2009), authors calculations
Bahrain
China
Vietnam
South Africa
Latvia
Germany
Oman
Croatia
Czech Republic
Saudi Arabia
Thailand
Estonia
Russia
Lebanon
Yemen
UAE
France
Brazil
SyriaIndia
Turkey
Egypt
Lithuania
Israel
Slovakia
Hungary
Iran
Mexico
Slovenia
Jordan
Chile
Other countriesNeighboring countries
Prosperity PerformanceSelected Middle and Upper Middle Income Countries
Malta
Greece
Korea
Italy
Japan
Spain
Poland
Ukraine
Georgia
Azerbaijan
Armenia
Bulgaria
Tunisia
Pakistan
Cyprus
New Zealand
Bosnia
BelarusMalaysia
Colombia
Kazakhstan
LibyaPanama
Portugal
Romania
Argentina

5 Copyright 2009 © Professor Michael E. PorterCompetitiveness Master - 2009-04-20.ppt
0%
2%
4%
6%
8%
10%
12%
14%
-10% -8% -6% -4% -2% 0% 2% 4%
Unemployment PerformanceSelected Middle and Upper Middle Income CountriesUnemployment
Rate, 2008
Change in Unemployment Rate in Percentage Points, 1999-2008Note: In some cases, 1999 data was unavailable, so 2000 data used.Source: EIU (2009)
Improving Deteriorating
France
Malta
Greece
Hong Kong
Germany
Italy
Tunisia
SwedenLithuania
South Korea
Czech Republic
Poland
Estonia
Mexico
Slovenia
USA
Malaysia
Portugal
New Zealand Japan
HungaryPhilippines
China
Turkey
Slovakia
Australia
Indonesia
Canada
Spain
Thailand
Brazil
RussiaIndia
Chile
Sri Lanka
Singapore
Romania
Bulgaria
Egypt
South Africa (22.9%)
Croatia
Saudi Arabia
VietnamLatvia
Pakistan
Argentina (-14.6%)
Morocco
Switzerland
Austria
Ireland
Netherlands
Finland Israel
Denmark
Albania Iran
Colombia
Syria
Kazakhstan
Ukraine
Azerbaijan

6 Copyright 2009 © Professor Michael E. PorterCompetitiveness Master - 2009-04-20.pptSource: Economist Intelligence Unit (2009)
Labor Force UtilizationParticipation Rates, Selected Countries
25%
30%
35%
40%
45%
50%
55%
60%
65%
-3% -2% -1% 0% 1% 2% 3% 4% 5% 6% 7%
Labor Force Participation Rate, 2008
Change in Labor Force Participation Rate, 2001 to 2008
Germany
Korea
Mexico
Slovenia
USA
Pakistan
Japan
Turkey
Slovakia
AustraliaDenmark
Brazil
Indonesia
China
ArgentinaPhilippines
RussiaVietnam
India
Malaysia
Chile
Thailand
Croatia
Lithuania
Tunisia BulgariaSouth Africa
EgyptLibya
Saudi Arabia
Colombia
Ghana
Cote d’Ivoire
Romania
KuwaitSingapore
Iceland
Macedonia
IrelandSpain
LatviaCyprusEstonia
Ukraine
Moldova (-4.98%)
IsraelHungary
Austria Greece
Netherlands
Italy
Canada
New ZealandFinland
UAE
YemenSyria Jordan
Iran
France Poland
Portugal
Switzerland
Kazakhstan
Azerbaijan (66.4%)
Bahrain
Belgium
Czech Rep.

7 Copyright 2009 © Professor Michael E. PorterCompetitiveness Master - 2009-04-20.ppt
Turkey’s Export Share Trends
Source: WTO (2009)
World Export Market Share
0.0%
0.2%
0.4%
0.6%
0.8%
1.0%
1.2%
1.4%
1.6%
1.8%
1997 1998 1999 2000 2001 2002 2003 2004 2005 2006 2007
Processed GoodsSemi-processed GoodsUnprocessed GoodsServicesTOTAL

8 Copyright 2009 © Professor Michael E. PorterCompetitiveness Master - 2009-04-20.ppt
0%
10%
20%
30%
40%
50%
60%
70%
80%
90%
100%
-15% -10% -5% 0% 5% 10% 15% 20%
Export PerformanceSelected Middle and Upper Middle Income Countries
Exports of Goods and Services (% of GDP), 2008
Change in Exports of Goods and Services (% of GDP), 2001 to 2008
Russia
Thailand
Jordan
Estonia
China
Germany
Philippines
UK
Cyprus
South Africa
Ireland (-18.4%)
USA
India
Romania
Brazil
Cambodia
Chile
FranceIndonesia
Australia
Czech Rep.
Greece
Slovakia
Turkey
Mexico
Korea
Pakistan
Argentina
Vietnam
Malaysia (103.5%)
Canada
Hungary
Croatia
Source: EIU (2008), authors’ analysis
Japan
Netherlands
Egypt (27.2%)
Bangladesh
Poland
New Zealand
Slovenia
Denmark
Albania
Lithuania
Ukraine
BelarusBulgaria
Finland Iceland
Malta
Yemen
United Arab Emirates
Qatar
Syria
KuwaitOman
LebanonIran
Kazakhstan
Israel
Armenia
Belgium
Georgia
LatviaMoldova
Spain Italy
AustriaSwitzerland
Saudi Arabia (31.2%)
Azerbaijan (35.3%)Vietnam (25%)

9 Copyright 2009 © Professor Michael E. PorterCompetitiveness Master - 2009-04-20.ppt
0%
10%
20%
30%
40%
50%
60%
0% 5% 10% 15% 20% 25% 30% 35% 40% 45%
Inbound Foreign Investment PerformanceStocks and Flows, Selected Countries
Source: UNCTAD, World Investment Report (2009)
Inward FDI Stocks as % of GDP, Average 1990-2008
FDI Inflows as % of Gross Fixed Capital Formation, Average 1990 - 2008
Japan
Russia
Saudi Arabia
Turkey
Slovenia
Jordan
Hungary
Vietnam
Slovakia
Czech RepublicKazakhstan
Chile Netherlands
Poland
Estonia
Malaysia
CroatiaSouth Africa
New Zealand
Indonesia ChinaUkraine
Lithuania
Lebanon
Brazil
Bulgaria
Korea
AustriaLatvia
Switzerland
Spain
Kazakhstan
Mexico
Portugal
Philippines
Greece
Romania
CyprusEgypt
Oman
BelarusUAE
Qatar
Syria
Thailand
Georgia (60.1%)
IndiaIran
Bahrain
Malta
Turkey (1990-2000)
Turkey (2001-2008)
BosniaGeorgia
Macedonia
Cambodia

10 Copyright 2009 © Professor Michael E. PorterCompetitiveness Master - 2009-04-20.ppt
0
1
2
3
4
5
-20% -10% 0% 10% 20% 30% 40% 50% 60%
Note: Blue shaded countries have similar GDP per capita to Turkey. Source: USPTO (2008), EIU (2008)
Average U.S. patents per 1 million population, 2004-2008
CAGR of US-registered patents, 2004 – 2008
Innovative CapacityInnovation Output of Selected Countries
Saudi Arabia
RussiaPortugal
TurkeyIndia
Poland
Kuwait
Czech Republic
China
South Africa
UAE
Greece
Indonesia
Hungary
Cyprus
120 patents =
Argentina
Brazil
Croatia
Malaysia
Bulgaria
PhilippinesEgypt
Chile
Lebanon
Thailand
UkraineRomania
Mexico
Colombia

11 Copyright 2009 © Professor Michael E. PorterCompetitiveness Master - 2009-04-20.ppt
Strategic Issues Facing Turkey in 2009
• There have been significant policy improvements since 2001, such as opening the economy to trade and competition, streamlining regulations, and improving infrastructure
• However, the slowdown of reforms during 2008 exposed Turkey to the brunt of the global crisis
– Investors and consumers are still wary given Turkey’s historical track record
• Improving Turkey’s future economic performance will require addressing numerous challenges
– Turkey has only reached the first stage in becoming a truly competitive economy
• Second stage reforms are considerably more challenging
• Turkey needs a coherent economic strategy in order to continue its progress
• The private and the public sector must collaborate in order to take the economy to the next level

12 Copyright 2009 © Professor Michael E. PorterCompetitiveness Master - 2009-04-20.ppt
Agenda
• Turkey’s Economic Performance
• Principles of Competitiveness
• Assessment of Turkey’s Competitive Position
• Towards an Economic Strategy

13 Copyright 2009 © Professor Michael E. PorterCompetitiveness Master - 2009-04-20.ppt
What is Competitiveness?
• Nations compete to offer the most productive environment for business
• The public and private sectors play different but interrelated roles in creating a productive economy
• Competitiveness depends on the productivity with which a nation uses its human, capital, and natural resources.
– Productivity sets the sustainable standard of living (wages, returns on capital, returns on natural resources)
– It is not what industries a nation competes in that matters for prosperity, but how productively it competes in those industries
– Productivity in a national economy arises from a combination of domestic and foreign firms
– The productivity of “local” or domestic industries is fundamental to competitiveness, not just that of export industries
– Relentless innovation in technology, products, and organizational methods is necessary to drive productivity growth and a rising standard of living
14 Copyright 2009 © Professor Michael E. PorterCompetitiveness Master - 2009-04-20.ppt
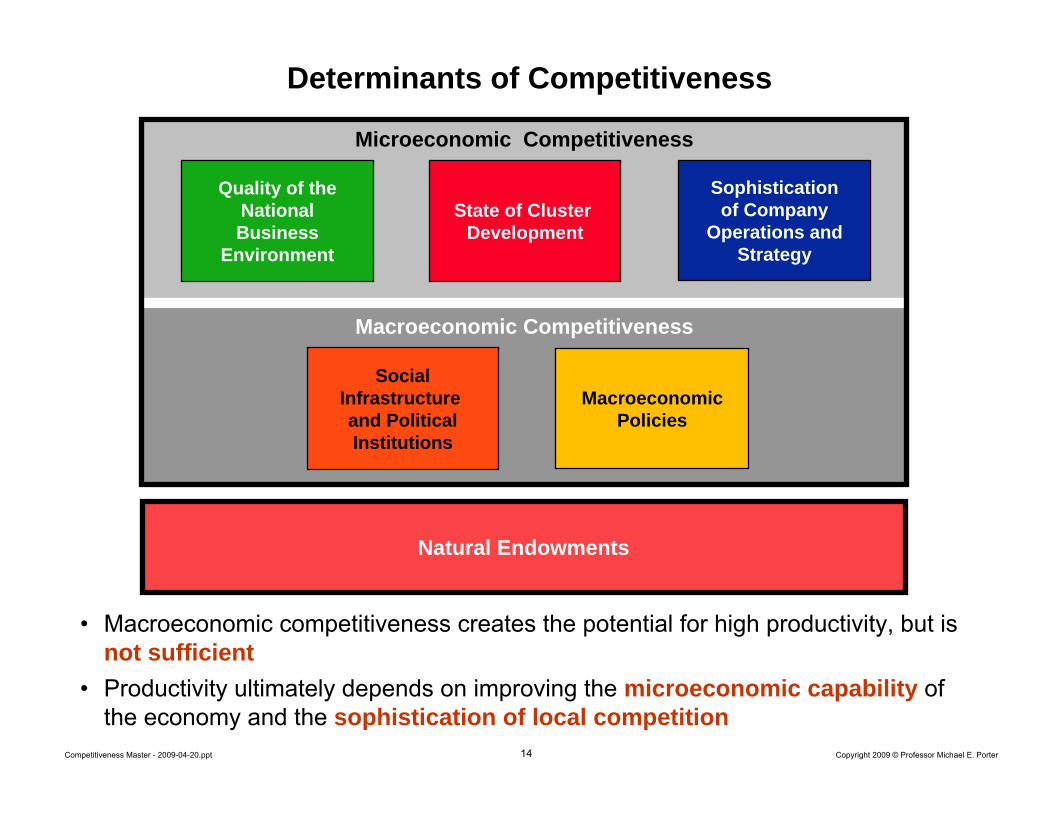
Macroeconomic Competitiveness
Microeconomic Competitiveness
Sophisticationof Company
Operations andStrategy
Quality of the NationalBusiness
Environment
MacroeconomicPolicies
SocialInfrastructure and PoliticalInstitutions
State of Cluster Development
• Macroeconomic competitiveness creates the potential for high productivity, but is not sufficient
• Productivity ultimately depends on improving the microeconomic capability of the economy and the sophistication of local competition
Determinants of Competitiveness
Natural Endowments

15 Copyright 2009 © Professor Michael E. PorterCompetitiveness Master - 2009-04-20.ppt
Determinants of Competitiveness
Macroeconomic Competitiveness
Microeconomic CompetitivenessSophisticationof Company
Operations andStrategy
Quality of the NationalBusiness
Environment
SocialInfrastructure and PoliticalInstitutions
State of Cluster Development
Natural Endowments
• Human Development: basic education and health care
• Rule of Law: property rights and due process
• Political Institutions: stable and effective political and governmental processes and organizations
SocialInfrastructure and PoliticalInstitutions
MacroeconomicPolicies

16 Copyright 2009 © Professor Michael E. PorterCompetitiveness Master - 2009-04-20.ppt
Macroeconomic Competitiveness
Microeconomic CompetitivenessSophisticationof Company
Operations andStrategy
Quality of the NationalBusiness
Environment
SocialInfrastructure and PoliticalInstitutions
State of Cluster Development
Natural Endowments
MacroeconomicPolicies
Determinants of Competitiveness
• Fiscal policy: public spending aligned with revenues over time
• Monetary policy: low levels of inflation
• Macroeconomic management: avoiding structural imbalances and cyclical overheating
MacroeconomicPolicy

17 Copyright 2009 © Professor Michael E. PorterCompetitiveness Master - 2009-04-20.ppt
Macroeconomic Competitiveness
Microeconomic CompetitivenessSophisticationof Company
Operations andStrategy
Quality of the NationalBusiness
Environment
SocialInfrastructure and PoliticalInstitutions
State of Cluster Development
Natural Endowments
MacroeconomicPolicies
Determinants of Competitiveness
• The internal skills, capabilities, and management practices needed to attain the highest level of company productivity and innovation possible
Sophisticationof Company
Operations andStrategy
18 Copyright 2009 © Professor Michael E. PorterCompetitiveness Master - 2009-04-20.ppt
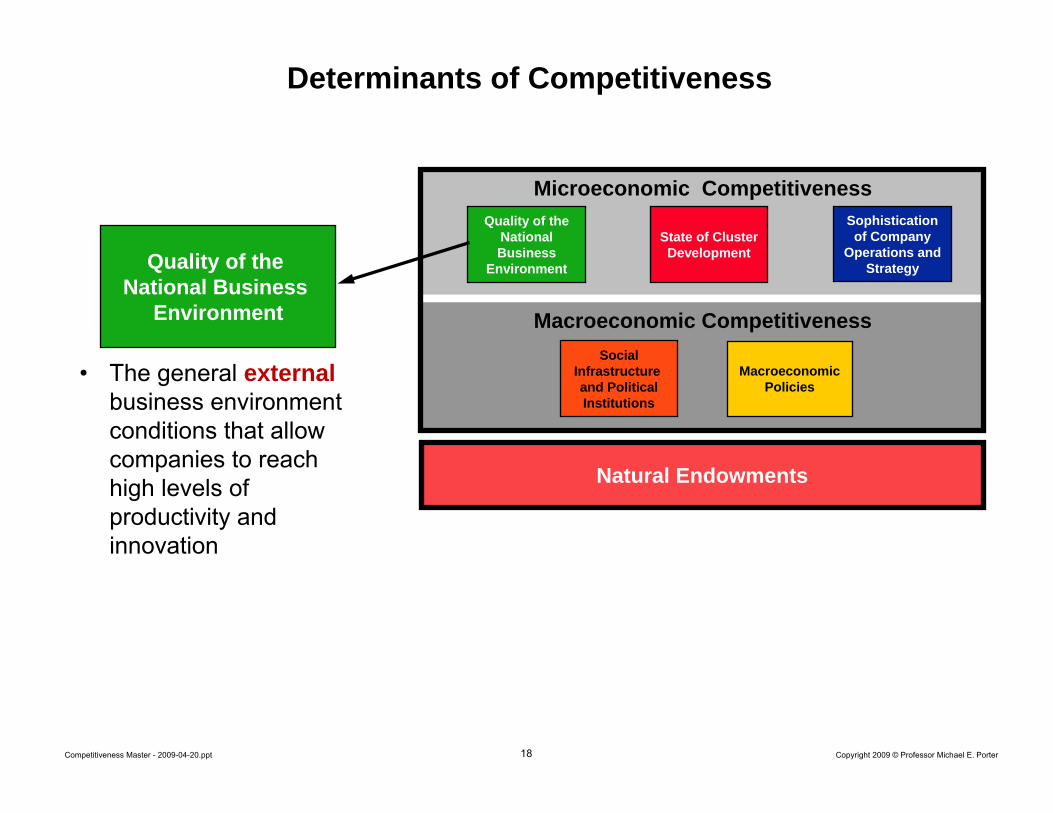
Determinants of Competitiveness
• The general external business environment conditions that allow companies to reach high levels of productivity and innovation
Quality of the National Business
Environment Macroeconomic Competitiveness
Microeconomic CompetitivenessSophisticationof Company
Operations andStrategy
Quality of the NationalBusiness
Environment
SocialInfrastructure and PoliticalInstitutions
State of Cluster Development
Natural Endowments
MacroeconomicPolicies

19 Copyright 2009 © Professor Michael E. PorterCompetitiveness Master - 2009-04-20.ppt
Determinants of Competitiveness
• The depth of specialized skills and assets and the ability to capture synergies across related firms and industries
State of Cluster Development
Macroeconomic Competitiveness
Microeconomic CompetitivenessSophisticationof Company
Operations andStrategy
Quality of the NationalBusiness
Environment
SocialInfrastructure and PoliticalInstitutions
State of Cluster Development
Natural Endowments
MacroeconomicPolicies

20 Copyright 2009 © Professor Michael E. PorterCompetitiveness Master - 2009-04-20.ppt
Quality of the Business Environment
Context for Firm
Strategy and Rivalry
Context for Firm
Strategy and Rivalry
Related and Supporting Industries
Related and Supporting Industries
Factor(Input)
Conditions
Factor(Input)
ConditionsDemand
ConditionsDemand
Conditions
• Sophisticated and demanding local customers and needs
– e.g., Strict quality, safety, and environmental standards
– Consumer protection laws
• Many things matter for competitiveness• Successful economic development is a process of successive upgrading, in which the
business environment improves to enable increasingly sophisticated ways of competing
• Efficient access to high quality business inputs
– Efficient utilization of natural endowments
– Human resources– Capital availability– Physical infrastructure– Administrative and information
infrastructure (e.g. registration, permitting, transparency)
– Scientific and technological infrastructure
• Availability of suppliers , supporting industries and institutions, and firms in related fields
Open and vigorous local competition
– Openness to foreign competition– Competition laws
• Local rules and incentives that encourage investment and productivity
– e.g. incentives for capital investment, intellectual property protection, corporate governance standards
21 Copyright 2009 © Professor Michael E. PorterCompetitiveness Master - 2009-04-20.ppt
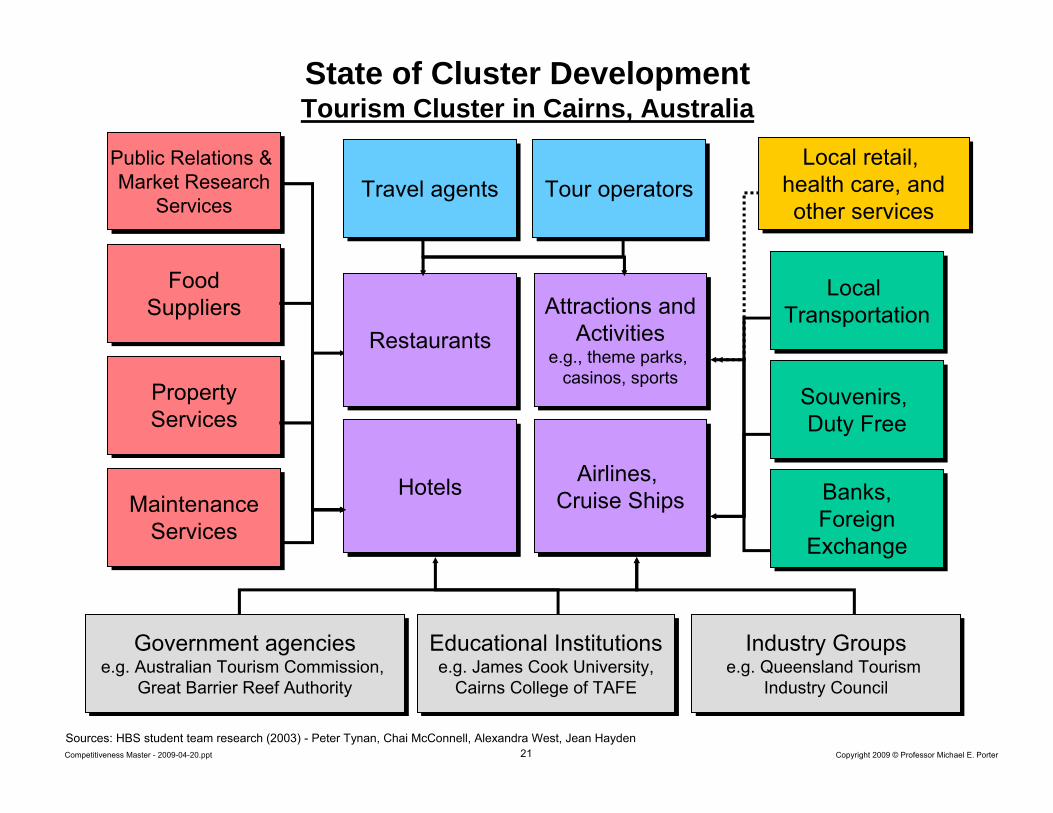
Sources: HBS student team research (2003) - Peter Tynan, Chai McConnell, Alexandra West, Jean Hayden
HotelsHotels
Attractions andActivities
e.g., theme parks, casinos, sports
Attractions andActivities
e.g., theme parks, casinos, sports
Airlines, Cruise Ships
Airlines, Cruise Ships
Travel agentsTravel agents Tour operatorsTour operators
RestaurantsRestaurants
PropertyServicesPropertyServices
MaintenanceServices
MaintenanceServices
Government agenciese.g. Australian Tourism Commission,
Great Barrier Reef Authority
Government agenciese.g. Australian Tourism Commission,
Great Barrier Reef Authority
Educational Institutionse.g. James Cook University,
Cairns College of TAFE
Educational Institutionse.g. James Cook University,
Cairns College of TAFE
Industry Groupse.g. Queensland Tourism
Industry Council
Industry Groupse.g. Queensland Tourism
Industry Council
FoodSuppliers
FoodSuppliers
Public Relations & Market Research
Services
Public Relations & Market Research
Services
Local retail, health care, andother services
Local retail, health care, andother services
Souvenirs, Duty Free
Souvenirs, Duty Free
Banks,Foreign
Exchange
Banks,Foreign
Exchange
Local Transportation
Local Transportation
State of Cluster DevelopmentTourism Cluster in Cairns, Australia

22 Copyright 2009 © Professor Michael E. PorterCompetitiveness Master - 2009-04-20.ppt
Development of the Australian Wine Cluster
1955
Australian Wine Research Institute founded
1970
Winemaking school at Charles Sturt University founded
1980
Australian Wine and Brandy Corporation established
1965
Australian Wine Bureau established
1930
First oenology course at RoseworthyAgricultural College
1950s
Import of European winery technology
1960s
Recruiting of experienced foreign investors, e.g. Wolf Bass
1990s
Surge in exports and international acquisitions
1980s
Creation of large number of new wineries
1970s
Continued inflow of foreign capital and management
1990
Winemaker’s Federation of Australia established
1991 to 1998
New collective organizations created for education, research, market information, and export promotions
Source: Michael E. Porter and Örjan Sölvell, The Australian Wine Cluster – Supplement, Harvard Business School Case Study, 2002

23 Copyright 2009 © Professor Michael E. PorterCompetitiveness Master - 2009-04-20.ppt
Develop Related ClustersDevelop Related Clusters
Upgrade Existing Export Products and Services
Upgrade Existing Export Products and Services
Clusters and Economic Diversification
Deepen Existing ClustersDeepen Existing Clusters
Turn Products Into ClustersTurn Products Into Clusters• Local firms• MNCs
24 Copyright 2009 © Professor Michael E. PorterCompetitiveness Master - 2009-04-20.ppt
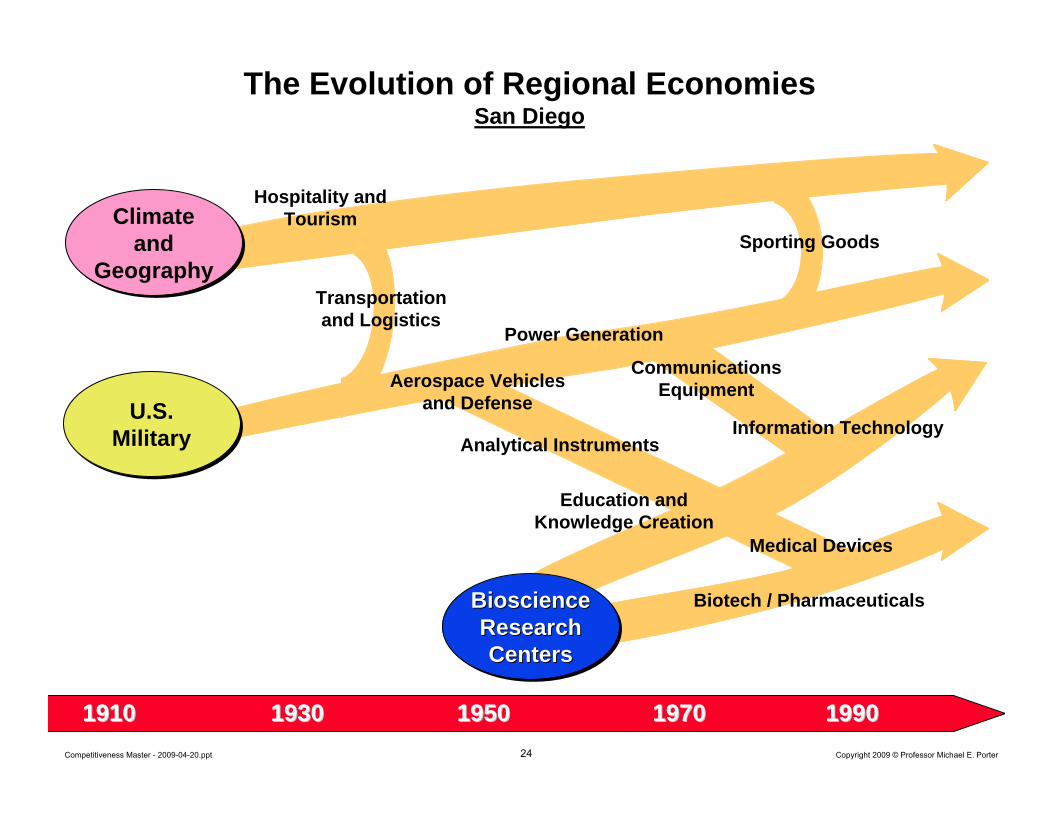
The Evolution of Regional EconomiesSan Diego
U.S. Military
U.S. Military
CommunicationsEquipment
Sporting Goods
Analytical Instruments
Power Generation
Aerospace Vehiclesand Defense
Transportationand Logistics
Information Technology
19101910 19301930 19501950 1990199019701970
Bioscience Research Centers
Bioscience Bioscience Research Research CentersCenters
Climate and
Geography
Climate and
Geography
Hospitality and Tourism
Medical Devices
Biotech / Pharmaceuticals
Education andKnowledge Creation

25 Copyright 2009 © Professor Michael E. PorterCompetitiveness Master - 2009-04-20.ppt
FurnitureBuilding Fixtures,
Equipment & Services
Fishing & Fishing Products
Hospitality & TourismAgricultural
Products
Transportation & Logistics
Clusters and Economic DiversificationLinkages Across Clusters
Plastics
Oil & Gas
Chemical Products
Biopharma-ceuticals
Power Generation
Aerospace Vehicles &
Defense
Lightning & ElectricalEquipment
Financial Services
Publishing & Printing
Entertainment
Information Tech.
Communi-cations
Equipment
Aerospace Engines
Business Services
DistributionServices
Forest Products
Heavy Construction
Services
ConstructionMaterials
Prefabricated Enclosures
Heavy Machinery
Sporting & Recreation
Goods
Automotive
Production Technology
Motor Driven Products
Mining & Metal Manufacturing
Apparel
Leather & Related Products
Jewelry & Precious Metals
Textiles
Footwear
Processed Food
Tobacco
Medical Devices
Analytical InstrumentsEducation &
Knowledge Creation
Note: Clusters with overlapping borders or identical shading have at least 20% overlap(by number of industries) in both directions.

26 Copyright 2009 © Professor Michael E. PorterCompetitiveness Master - 2009-04-20.ppt
Specialization of Regional EconomiesLeading Clusters by U.S. Economic Area, 2007
Boston, MA-NHAnalytical Instruments Education and Knowledge CreationMedical DevicesFinancial Services
Boston, MA-NHAnalytical Instruments Education and Knowledge CreationMedical DevicesFinancial Services
Los Angeles, CAEntertainmentApparelDistribution ServicesHospitality and Tourism
Los Angeles, CAEntertainmentApparelDistribution ServicesHospitality and Tourism
San Jose-San Francisco, CABusiness ServicesInformation TechnologyAgricultural ProductsCommunications EquipmentBiopharmaceuticals
San Jose-San Francisco, CABusiness ServicesInformation TechnologyAgricultural ProductsCommunications EquipmentBiopharmaceuticals
New York, NY-NJ-CT-PAFinancial ServicesBiopharmaceuticalsJewelry and Precious MetalsPublishing and Printing
New York, NY-NJ-CT-PAFinancial ServicesBiopharmaceuticalsJewelry and Precious MetalsPublishing and Printing
Seattle, WAAerospace Vehicles and DefenseInformation TechnologyEntertainmentFishing and Fishing Products
Seattle, WAAerospace Vehicles and DefenseInformation TechnologyEntertainmentFishing and Fishing Products
San Diego, CAMedical DevicesAnalytical InstrumentsHospitality and TourismEducation and Knowledge Creation
San Diego, CAMedical DevicesAnalytical InstrumentsHospitality and TourismEducation and Knowledge Creation
Chicago, IL-IN-WIMetal ManufacturingLighting and Electrical EquipmentProduction TechnologyPlastics
Chicago, IL-IN-WIMetal ManufacturingLighting and Electrical EquipmentProduction TechnologyPlastics
Pittsburgh, PAEducation and Knowledge CreationMetal ManufacturingChemical ProductsPower Generation and Transmission
Pittsburgh, PAEducation and Knowledge CreationMetal ManufacturingChemical ProductsPower Generation and Transmission
Denver, COBusiness ServicesMedical DevicesEntertainmentOil and Gas Products and Services
Denver, COBusiness ServicesMedical DevicesEntertainmentOil and Gas Products and Services
Raleigh-Durham, NCEducation and Knowledge CreationBiopharmaceuticalsCommunications EquipmentTextiles
Raleigh-Durham, NCEducation and Knowledge CreationBiopharmaceuticalsCommunications EquipmentTextiles
Atlanta, GATransportation and LogisticsTextilesMotor Driven ProductsConstruction Materials
Atlanta, GATransportation and LogisticsTextilesMotor Driven ProductsConstruction Materials
DallasAerospace Vehicles and DefenseOil and Gas Products and ServicesInformation TechnologyTransportation and Logistics
DallasAerospace Vehicles and DefenseOil and Gas Products and ServicesInformation TechnologyTransportation and Logistics
Source: Prof. Michael E. Porter, Cluster Mapping Project, Institute for Strategy and Competitiveness, Harvard Business School; Richard Bryden, Project Director.
Houston, TXOil and Gas Products and ServicesChemical ProductsHeavy Construction ServicesTransportation and Logistics
Houston, TXOil and Gas Products and ServicesChemical ProductsHeavy Construction ServicesTransportation and Logistics

27 Copyright 2009 © Professor Michael E. PorterCompetitiveness Master - 2009-04-20.ppt
Regions and Competitiveness
• Economic performance varies significantly across sub-national regions (e.g., provinces, states, metropolitan areas)
• Many essential levers of competitiveness reside at the regional level• Region’s specialize in different sets of clusters• Cluster strength directly impacts regional performance• Each region needs its own distinctive competitiveness agenda• Competitiveness requires effective policy collaboration between
regions and the national government
• Decentralization of economic policy is especially important in large countries to foster regional specialization, internal competition, and accountability

28 Copyright 2009 © Professor Michael E. PorterCompetitiveness Master - 2009-04-20.ppt
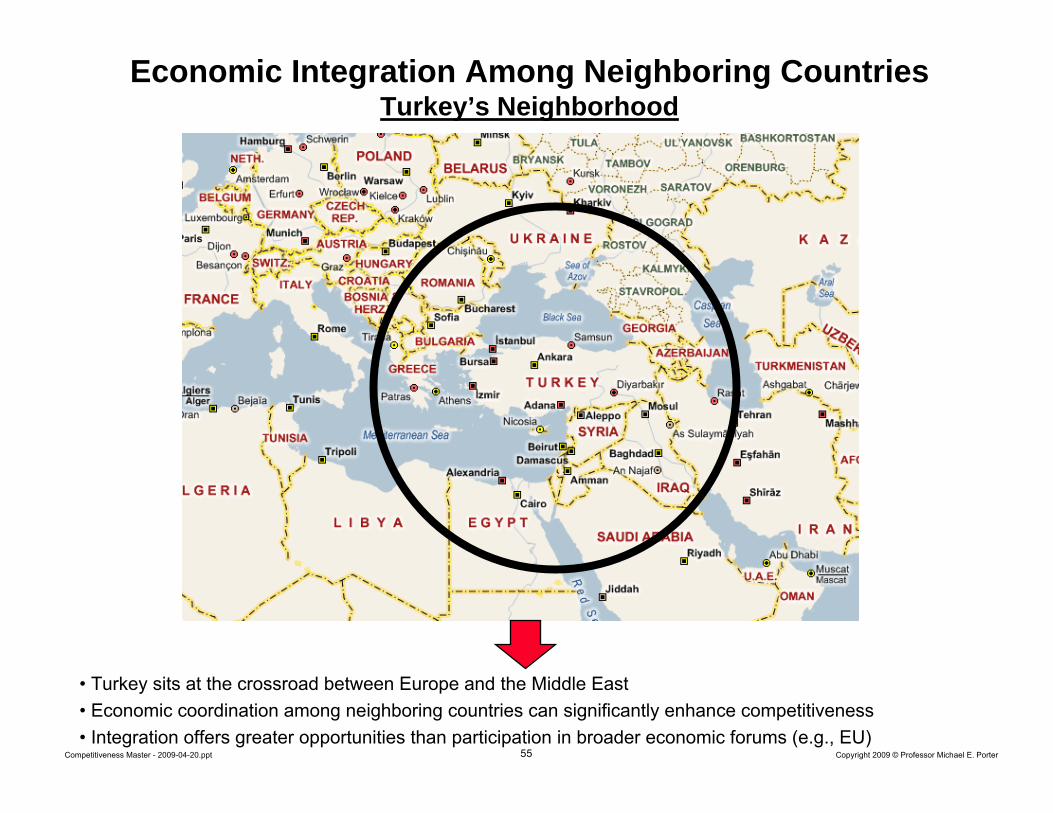
Economic Integration Among Neighboring CountriesTurkey’s Neighborhood
• Turkey sits at the crossroad between Europe and the Middle East• Economic coordination among neighboring countries can significantly enhance competitiveness• Integration offers greater opportunities than participation in broader economic forums (e.g., EU)

29 Copyright 2009 © Professor Michael E. PorterCompetitiveness Master - 2009-04-20.ppt
Competitiveness and the Neighborhood
• Opening trade and investment among neighbors
– A nation’s neighbors are its most natural trading and investment partners
– The natural path of internationalization for local firms is the neighborhood
– Open trade and investment make each a more attractive location for investment
• Economic coordination to drive improvements in the business environment– Capturing synergies in policy and infrastructure
– Gaining greater clout in international negotiations
• External agreements to help overcome domestic political and economic barriers to reform

30 Copyright 2009 © Professor Michael E. PorterCompetitiveness Master - 2009-04-20.ppt
• Eliminating trade and investment barriers within the region
• Simplifying and harmonizing cross-borderregulations and paperwork
• Coordinatinganti-monopoly and fair competition policies
• Harmonizing environmental standards
• Harmonizing product safetystandards
• Establishing reciprocal consumerprotection laws
• Opening governmentprocurementwithin the region
• Improving the efficiency of the regional transportationinfrastructure
• Creating an efficient energy network
• Enhancing regional communicationsand connectivity
• Linking financialmarkets
• Opening the movement of students for higher education
• Harmonizing administrativerequirements for businesses
• Facilitating cross-border cluster development
– e.g., Supplier networks
– Transport & Logistics
– Quality standards
Factor ConditionsFactor Factor
ConditionsConditionsContext for
Strategy and Rivalry
Context for Context for Strategy Strategy
and Rivalryand Rivalry
Related and Supporting Industries
Related and Supporting Industries
Demand ConditionsDemand Demand
ConditionsConditions
Economic Integration Among NeighborsCapturing Synergies
Macroeconomic Competitiveness
Macroeconomic Competitiveness
• Coordinating macro-economicpolicies
• Coordinating programs to improve publicsafety
31 Copyright 2009 © Professor Michael E. PorterCompetitiveness Master - 2009-04-20.ppt
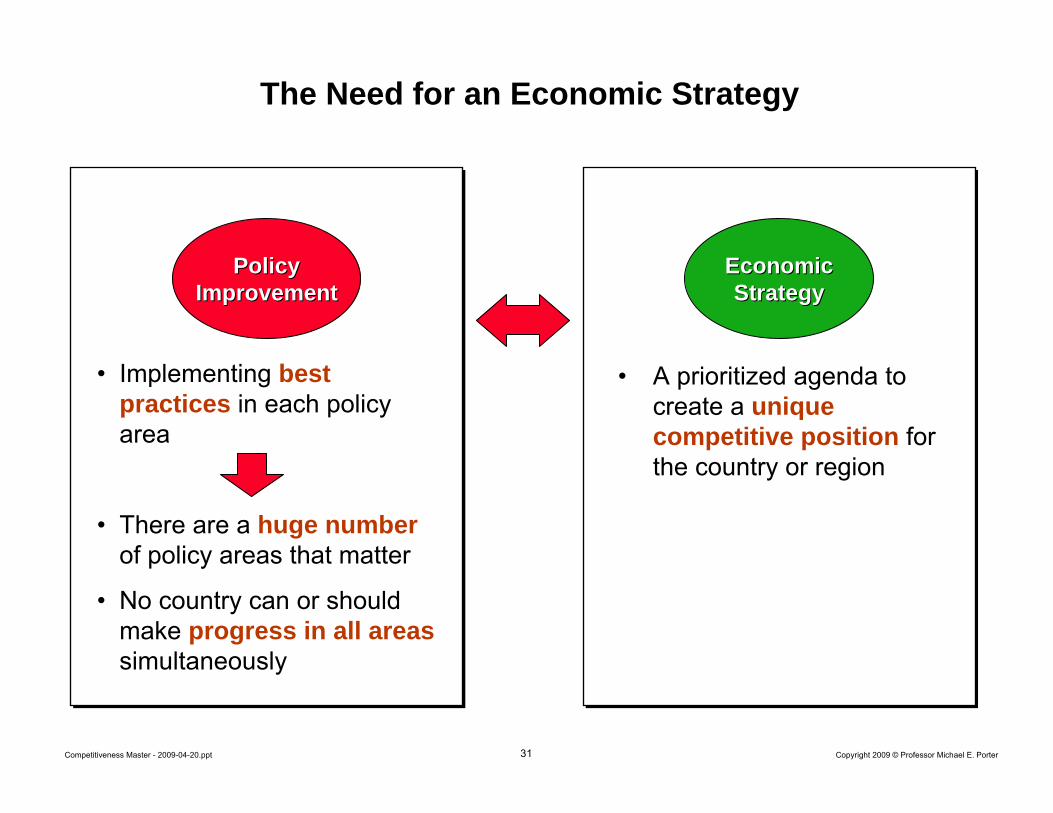
• A prioritized agenda to create a uniquecompetitive position for the country or region
• Implementing best practices in each policy area
• There are a huge number of policy areas that matter
• No country can or should make progress in all areas simultaneously
PolicyPolicyImprovementImprovement
EconomicEconomicStrategyStrategy
The Need for an Economic Strategy

32 Copyright 2009 © Professor Michael E. PorterCompetitiveness Master - 2009-04-20.ppt
National Value PropositionNational Value Proposition
The Need for an Economic Strategy
Refining Unique StrengthsRefining Unique Strengths Addressing Crucial ConstraintsAddressing Crucial Constraints
• What elements of the business environment and institutional context can be unique strengths relative to peers/neighbors?
• What existing and emerging clusterscan be developed?
• What are the crucial weaknesses and constraints that must be addressed to achieve parity with peer countries and allow the country to move to the next level?
• What are the distinctive competitive assets of the nation’s economy given its location, legacy, rate of progress, existing strengths, and potential strengths?
– What unique value as a business location?– In what types of fields / clusters?– What roles with neighbors, the broad region, and the wider world?
• Priorities and sequencing are a necessity in economic development

33 Copyright 2009 © Professor Michael E. PorterCompetitiveness Master - 2009-04-20.ppt
The Process of Economic DevelopmentShifting Roles and Responsibilities
Old ModelOld Model
• The central government drives economic development through policy decisions, spending and incentives
• The central government drives economic development through policy decisions, spending and incentives
New ModelNew Model
• Economic development is a collaborative process involving government at multiple levels, companies, educational and research institutions, and private sector organizations
• Economic development is a collaborative process involving government at multiple levels, companies, educational and research institutions, and private sector organizations
• Competitiveness must be a bottom-up process in which many individuals, companies, and institutions take responsibility and act

34 Copyright 2009 © Professor Michael E. PorterCompetitiveness Master - 2009-04-20.ppt
Role of the Private Sector in Economic Development
• The competitive advantage of companies depends partly on the quality of the business environment at the national and regional level
• A company gains advantages from being part of a strong cluster
Corporate role in competitiveness
• Inform government on business needs and constraints bearing on company and cluster development
• Nurture local suppliers and attract foreign suppliers
• Work closely with local educational and research institutions to improve their quality and create specialized programs addressing the cluster’s needs
• Collaborate with other companies to enhance competitiveness through trade associations and other mechanisms
• Participate actively in national and regional competitiveness initiatives
• Focus corporate social responsibility initiatives on enhancing the business environment
35 Copyright 2009 © Professor Michael E. PorterCompetitiveness Master - 2009-04-20.ppt
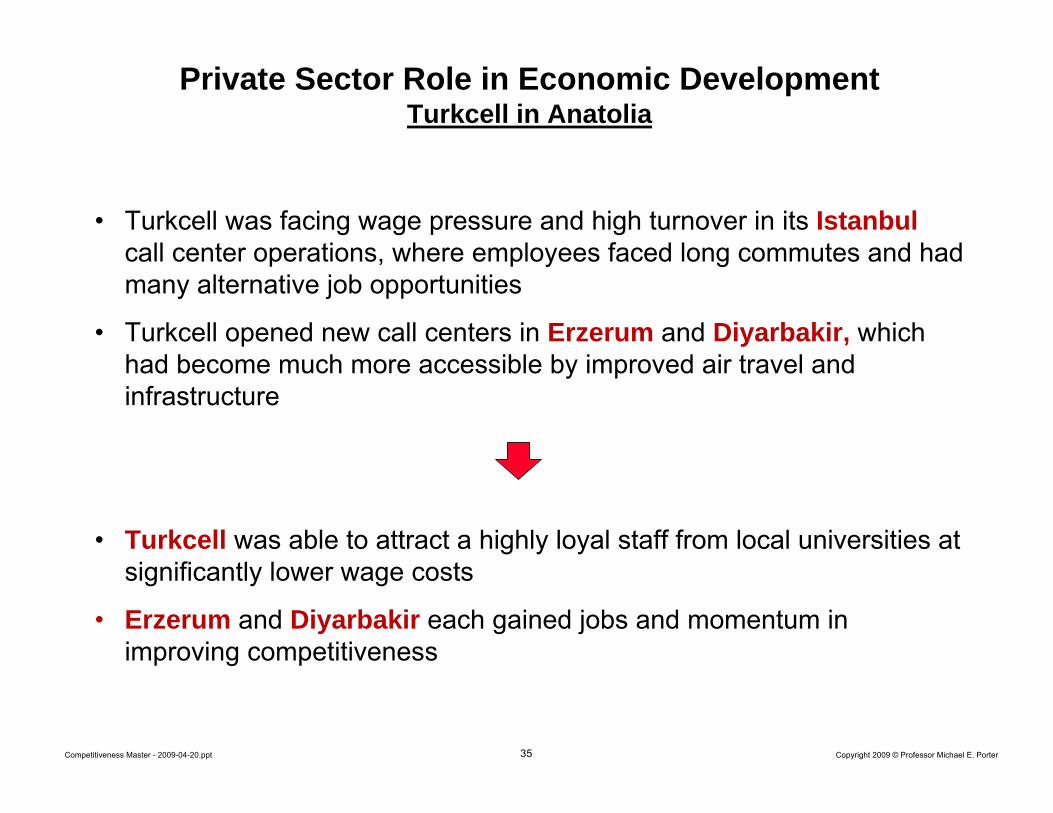
Private Sector Role in Economic DevelopmentTurkcell in Anatolia
• Turkcell was facing wage pressure and high turnover in its Istanbulcall center operations, where employees faced long commutes and had many alternative job opportunities
• Turkcell opened new call centers in Erzerum and Diyarbakir, which had become much more accessible by improved air travel and infrastructure
• Turkcell was able to attract a highly loyal staff from local universities at significantly lower wage costs
• Erzerum and Diyarbakir each gained jobs and momentum in improving competitiveness

36 Copyright 2009 © Professor Michael E. PorterCompetitiveness Master - 2009-04-20.ppt
Agenda
• Turkey’s Economic Performance
• Principles of Competitiveness
• Assessment of Turkey’s Competitive Position
• Towards an Economic Strategy

37 Copyright 2009 © Professor Michael E. PorterCompetitiveness Master - 2009-04-20.ppt
$0
$10,000
$20,000
$30,000
$40,000
$50,000
$60,000
$70,000
-3% 0% 3% 6% 9%
Comparative Labor ProductivitySelected Countries
Growth of real GDP per employee (PPP-adjusted), 1990 to 2008
Real GDP per employee (PPP adjusted US$), 2008
Source: authors calculation Groningen Growth and Development Centre (2009), EIU (2009)
Turkey (Avg. growth 2001to 2008)Mexico
New Zealand
Australia
Iran
Slovakia
Pakistan
Brazil
Malaysia
Germany
Poland
Slovenia
Argentina
ChinaPhilippines
Russia
Indonesia
Bosnia
Korea
India
Thailand
Japan
Egypt
Belarus
Czech Republic
Georgia
Romania
Saudi Arabia
South Africa
Syria
Spain
Croatia
Chile
Oman
Cambodia
Kazakhstan
UAE
Ukraine
PortugalLithuania
Kuwait
Israel
Jordan
Greece
Hungary
Azerbaijan
Cyprus
Armenia
Albania
Macedonia
Austria
Malta
Estonia
Singapore
Bulgaria
Switzerland
Latvia
Vietnam
Serbia
Turkey

38 Copyright 2009 © Professor Michael E. PorterCompetitiveness Master - 2009-04-20.ppt
Decomposing Turkey’s GDP per Capita Growth
-$200
-$150
-$100
-$50
$0
$50
$100
$150
$200
$250
1997 1998 1999 2000 2001 2002 2003 2004 2005 2006 2007 2008
Contribution to change in real GDP per Capita (PPP adjusted)
Labor Force Participation
Labor Productivity
Source: EIU (2008), GGDC total economy database (2008)
39 Copyright 2009 © Professor Michael E. PorterCompetitiveness Master - 2009-04-20.ppt
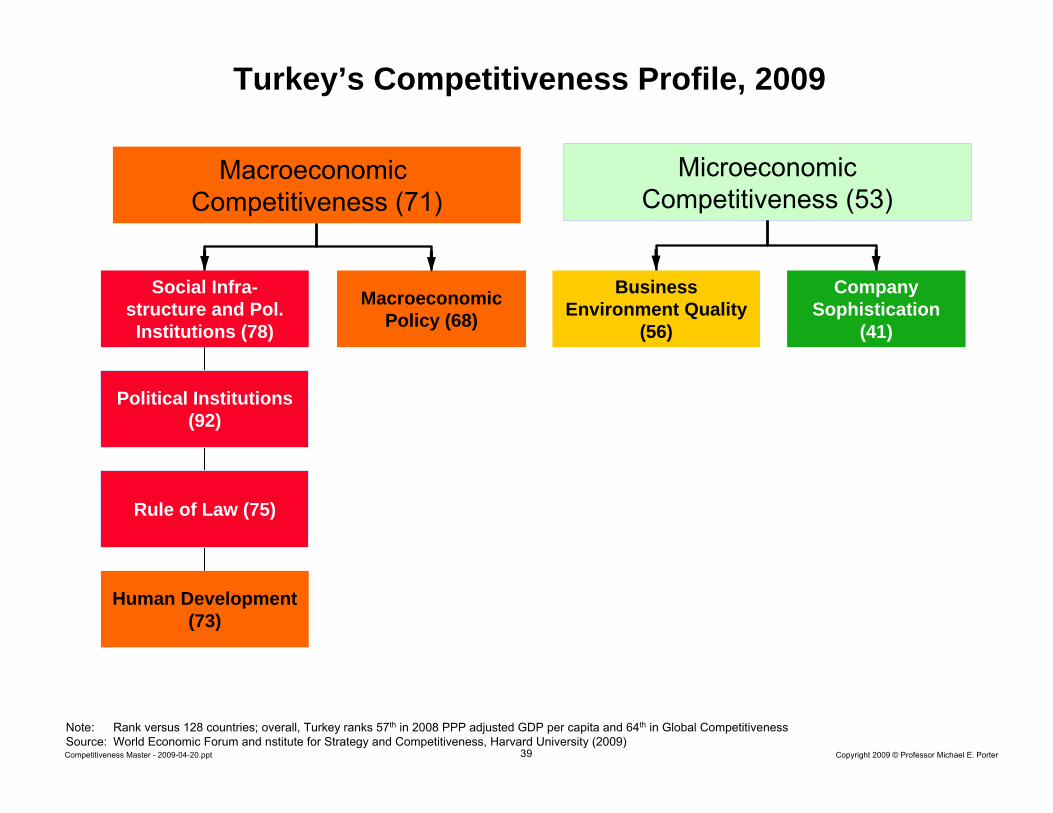
Turkey’s Competitiveness Profile, 2009
Macroeconomic Competitiveness (71)
Political Institutions (92)
Rule of Law (75)
Human Development (73)
MicroeconomicCompetitiveness (53)
Social Infra-structure and Pol. Institutions (78)
Macroeconomic Policy (68)
Business Environment Quality
(56)
Company Sophistication
(41)
Note: Rank versus 128 countries; overall, Turkey ranks 57th in 2008 PPP adjusted GDP per capita and 64th in Global CompetitivenessSource: World Economic Forum and nstitute for Strategy and Competitiveness, Harvard University (2009)
40 Copyright 2009 © Professor Michael E. PorterCompetitiveness Master - 2009-04-20.ppt
-20 -15 -10 -5 0 5 10 15 20
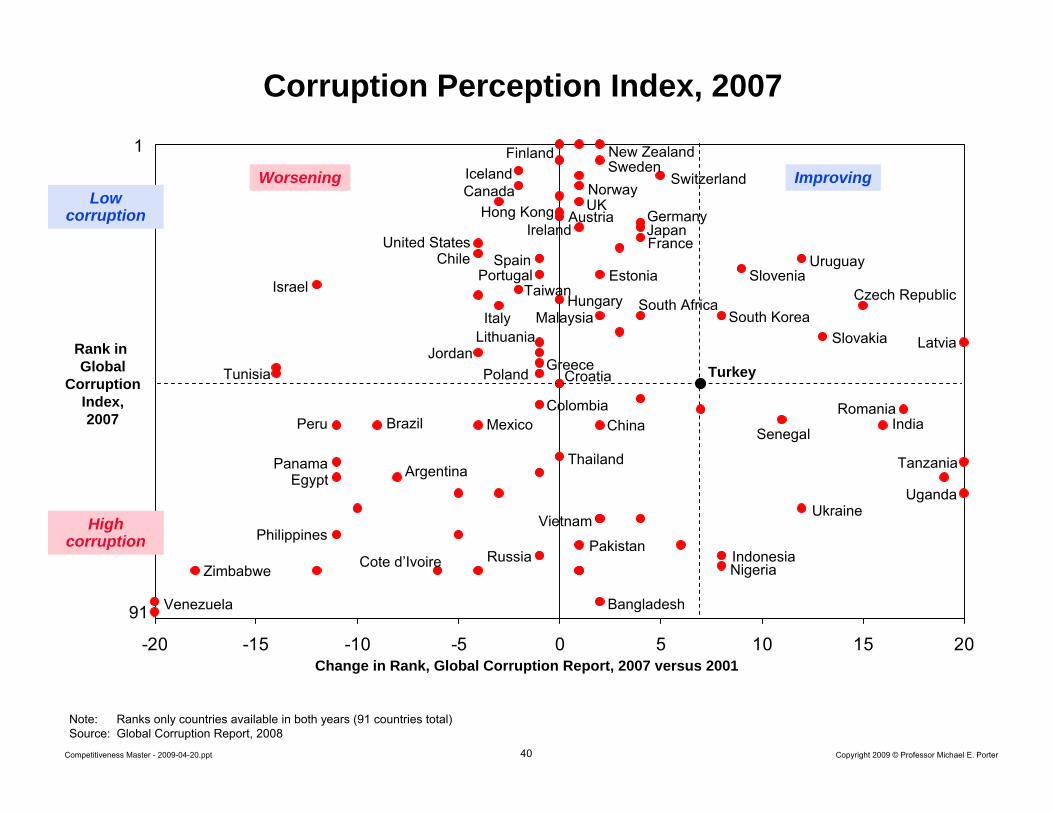
Corruption Perception Index, 2007
Note: Ranks only countries available in both years (91 countries total)Source: Global Corruption Report, 2008
Change in Rank, Global Corruption Report, 2007 versus 2001
Rank in Global
CorruptionIndex,2007
91
1 Finland
Canada
Bangladesh
Indonesia
Ireland
Portugal
Egypt
Iceland
Czech Republic
SlovakiaSouth Korea
Latvia
India
Slovenia
Thailand
Switzerland
France
Romania
Turkey
Estonia
Austria GermanyJapan
Vietnam
China
NorwayUK
MalaysiaLithuania
Colombia
HungaryTaiwan
Spain
Hong Kong
ChileUnited States
South Africa
Mexico
Croatia
Italy
Poland
Brazil
Argentina
Israel
Venezuela
Russia
Uruguay
New ZealandSweden
Tunisia
Peru
Tanzania
Uganda
Senegal
Philippines
Zimbabwe Cote d’Ivoire NigeriaPakistan
GreeceJordan
Ukraine
Panama
Worsening Improving
High corruption
Low corruption

41 Copyright 2009 © Professor Michael E. PorterCompetitiveness Master - 2009-04-20.ppt
Human DevelopmentTurkey vs. Peer Countries
Source: World Bank, Human Development Index 2009
GDP per capitaHuman
Development Index (HDI)
Life Expectency
Index
Education index
Gender Development Index (GDI)
Slovakia $ 20,076 45 42 59 46 40Hungary $ 18,755 46 43 73 28 37Lithuania $ 17,575 49 46 94 20 42Latvia $ 16,377 51 48 86 26 44Croatia $ 16,027 52 45 48 51 43Poland $ 15,987 53 41 51 33 39Gabon $ 15,167 54 103 154 103 85Russia $ 14,690 55 71 133 43 59Libya $ 14,364 57 55 67 61 54Mexico $ 14,104 58 53 48 78 48Chile $ 13,880 59 44 35 49 41Botswana $ 13,604 60 125 170 122 105Malaysia $ 13,518 61 66 61 99 58Argentina $ 13,238 62 49 56 37 46Turkey $ 12,955 63 79 95 111 70Romania $ 12,369 64 63 83 53 52Venezuela $ 12,156 65 58 69 47 55Montenegro $ 11,699 66 65 64 66 ..Panama $ 11,391 67 60 51 72 51Mauritius $ 11,296 68 81 91 106 67Bulgaria $ 11,222 69 61 75 44 50Uruguay $ 11,216 70 50 46 31 45Iran $ 10,955 71 88 104 119 76Kazakhstan $ 10,863 72 82 140 22 66Costa Rica $ 10,842 73 54 33 84 47Belarus $ 10,841 74 68 116 26 57Serbia $ 10,248 75 67 65 66 ..
Country GDP per capita (PPP US$), 2007
Rank, 2007

42 Copyright 2009 © Professor Michael E. PorterCompetitiveness Master - 2009-04-20.ppt
Turkey’s Macroeconomic Competitiveness - ContinuedAction Priorities
• Strengthen the independence of institutions like the Central Bank
• Stronger fiscal discipline– Create greater stability in government spending through fiscal rules
• Agree on a process of resolving the domestic political tensionsamong key institutions and interest groups
• Improve the quality of governmental organizations, including at the provincial level
• Continue efforts to improve the accessibility and quality of educationand health care services across the country

43 Copyright 2009 © Professor Michael E. PorterCompetitiveness Master - 2009-04-20.ppt
Turkish Company Sophistication
Assessment• Significant improvements, especially among large companies• Solid operational efficiency in manufacturing but weaker performance
in services• A huge gap between the large business groups, that compare
favorably to international peers, and the huge number of SMEs that are far behind
• The World Bank reports significant entry and exit of new companies, but little sustained growth of small companies in the Turkish economy
Action Agenda• Consolidate efforts to improve the performance of SMEs• Strengthen the linkages between large business groups and SMEs• Use cluster policy as a tool to boost SME development

44 Copyright 2009 © Professor Michael E. PorterCompetitiveness Master - 2009-04-20.ppt
WEAKNESSESSTRENGTHS
Turkey’s Business Environment Overall Strengths and Weaknesses
• Domestic transportation and communication infrastructure
• Rules and regulations for starting new companies
• Openness to foreign investment• Moderate level of tariff barriers• Domestic rivalry improving• Availability of local suppliers• IT policies• Improving sophistication of the financial
system
• Tax system• Access to credit, especially for SMEs• Limited workforce skills• Low sophistication of local buyers• Weak governance and auditing• Distortive effects of government-owned
companies on competition• Unreliable electricity supply• Innovation infrastructure• Burdensome customs procedures• Intellectual property protection• Low patenting rates• Limited management schools• Labor rigidity• Regulatory quality
Note: Rank versus 128 countries; overall, Turkey ranks 57th in 2008 PPP adjusted GDP per capita and 64th in Global CompetitivenessSource: Institute for Strategy and Competitiveness, Harvard University (2009)

45 Copyright 2009 © Professor Michael E. PorterCompetitiveness Master - 2009-04-20.ppt
0
20
40
60
80
100
120
140
Ease ofDoing
Business
EnforcingContracts
RegisteringProperty
Starting aBusiness
ProtectingInvestors
TradingAcrossBorders
GettingCredit
PayingTaxes
Closing aBusiness
Dealingwith
Licenses
EmployingWorkers
Ease of Doing BusinessTurkey, 2009
Ranking, 2009 (of 183 countries)
Source: World Bank Report, Doing Business (2009/10)
Favorable Unfavorable
Turkey’s per capita GDP rank: 57
73
27
36
56 57
6771
75
121
133
145

46 Copyright 2009 © Professor Michael E. PorterCompetitiveness Master - 2009-04-20.ppt
0.0%
0.5%
1.0%
1.5%
2.0%
2.5%
3.0%
3.5%
4.0%
4.5%
-1.0% -0.5% 0.0% 0.5% 1.0% 1.5% 2.0%
Cluster DevelopmentTurkey’s National Cluster Export Portfolio, 1997 to 2007
Change in Turkey’s world export market share, 1997 to 2007Source: Prof. Michael E. Porter, International Cluster Competitiveness Project, Institute for Strategy and Competitiveness, Harvard Business School; Richard Bryden, Project Director. Underlying data drawn from the UN Commodity Trade Statistics Database and the IMF BOP statistics.
Turk
ey’s
wor
ld e
xpor
t mar
ket s
hare
, 200
7
Change In Turkey’s Overall World Export Share: +0.18%
Turkey’s Average World Export Share: 0.87%
Exports of US$3.3 Billion =
Hospitality and Tourism
AutomotiveProcessed Foods
Business Services (-1.59%)
Transportation and Logistics
BiopharmaceuticalsProduction Technology
Motor Driven Products
Oil and Gas
Marine Equipment
Information Technology Aerospace Vehicles and Defense
Plastics
Textiles
Construction Services (-5.2%)
Agriculture Products
Construction Materials
Financial Services
Lighting and Electrical Equipment
Heavy Machinery
Prefabricated Enclosures and Structures
EntertainmentJewelry, Precious Metals and Collectibles
Communications Equipment
Metal, Mining and Manufacturing
Apparel
FurnitureFootwear
Leather and Related Products
Building Fixtures and Equipment
Tobacco

47 Copyright 2009 © Professor Michael E. PorterCompetitiveness Master - 2009-04-20.ppt
FurnitureBuilding Fixtures,
Equipment & Services
Fishing & Fishing Products Hospitality
& TourismAgricultural
ProductsTransportation
& Logistics
Share of World Exports by ClusterTurkey, 2007
Plastics
Oil & Gas
Chemical Products
Biopharma-ceuticals
Power Generation
Aerospace Vehicles &
Defense
Lightning & ElectricalEquipment
Financial Services
Publishing & Printing
Information Tech.
Communi-cations
Equipment
Business Services
DistributionServices
Forest Products
Heavy Construction
Services
ConstructionMaterials
Prefabricated Enclosures
Apparel
Leather & Related Products
Jewelry & Precious Metals
Textiles
Footwear
Processed Food
Tobacco
Medical Devices
Analytical InstrumentsEducation &
Knowledge Creation
Note: Clusters with overlapping borders have at least 20% overlap (by number of industries) in both directions.
Marine Equipment
Aerospace Engines
Heavy Machinery
Sporting & Recreation
Goods
Automotive
Production Technology
Motor Driven Products
Mining & Metal Manufacturing
0.9% - 1.5%
1.5% - 3%
> 3%
Enter-tainment
World Market Share

48 Copyright 2009 © Professor Michael E. PorterCompetitiveness Master - 2009-04-20.ppt
Real Estate Development Firms
Real Estate Development Firms
Housing projects Hotels Office space
Road construction Dams Energy projects
Contractors, Subcontractors, Design
Services
Contractors, Subcontractors, Design
Services
Builders Architects Engineering firms
Institutions of Collaboration
TourismTourism Transport / Logistics
Transport / Logistics
Building Fixtures & Equipment
Building Fixtures & Equipment
Construction Materials
Construction Materials
Other: Furniture, Mining, Heavy
Machinery
Other: Furniture, Mining, Heavy
Machinery
9th
largest exporter in world
28th largest exporter in the world
19th largest exporter in the world
8th largest exporter in the world
Related Clusters
National / Local Government
National / Local Government
Domestic ForeignReal Estate
Investors
Real Estate Investors
HouseholdsHouseholds
TOKI Southeastern
Anatolia Project Administration
Primary & Secondary Housing
IndustryIndustry Energy Manufacturing
Equity Financing
Ministry of Public Works &
Settlement
Ministry of Public Works &
Settlement
Laws Setting Standards
Town Urban Planning Depts.
Town Urban Planning Depts.
Awarding of Licenses
Inspections
Regulatory Bodies
Banking Institutions
Banking Institutions
Mortgages Construction
Services Co Funding
Project Finance
Debt Financing
ProfessionalAssociations /
Chambers
ProfessionalAssociations /
Chambers
Contractors, construction employees
Engineers, city planners, architects
Related Cluster Assoc.
Related Cluster Assoc.
Real Estate Investment
Associations
Real Estate Investment
Associations
Univ. DegreesUniv. Degrees
Educational Institutions
BillKent (Private) Middle East
Technical Univ. (Public)
Istanbul Technical Univ. (Public)
Private Universities
One major association
Urban Planning firms Repair & Maintenance
professionals
200,000 companies with 100,000 in informal sector
15 large companies
Construction Services
Multiple associations for each related cluster
Multiple successful related clusters
Sources: HBS student team research (2007) –Yannis Katsarakis, AmrRezk, Emrah Sazak, Hayder Shaydurrllin, Bahadir Yadikar
The Turkish Construction Cluster

49 Copyright 2009 © Professor Michael E. PorterCompetitiveness Master - 2009-04-20.ppt
State of Turkish Cluster Development
Assessment• Turkey’s economy has naturally developed around clusters• Organized collaboration within these clusters remains low• Economic policy has not leveraged cluster development as a tool to
create synergies and deliver government policies more effectively– Recent EU-financed cluster programs have not yet had a significant
impact in Turkey
Action agenda• Pursue an aggressive national cluster development agenda to
support existing clusters and enable the emergence of new clusters in related fields
• Utilize clusters as a central tool for upgrading company sophistication, stimulating growth in SMEs, and driving regional competitiveness

50 Copyright 2009 © Professor Michael E. PorterCompetitiveness Master - 2009-04-20.ppt
Develop Related ClustersDevelop Related Clusters
Upgrade Existing Export Products and Services
Upgrade Existing Export Products and Services
Clusters and Economic Diversification
Deepen Existing ClustersDeepen Existing Clusters
Turn Products Into ClustersTurn Products Into Clusters • Local firms• MNCs

51 Copyright 2009 © Professor Michael E. PorterCompetitiveness Master - 2009-04-20.ppt
0.0%
0.5%
1.0%
1.5%
2.0%
0.4% 0.6% 0.8% 1.0% 1.2% 1.4% 1.6% 1.8%
Change in Subcluster’s share of World Exports, 1997 – 2006
Subc
lust
er’s
shar
e of
Wor
ld e
xpor
ts, 2
006
Turkey’s Automotive Cluster, 1997 – 2007 Exports by Subcluster
Motor Vehicle AssemblySubcluster Overall Export Share: 1.37%
Overall change in Subcluster World Export Share : +1.21%
Source: Prof. Michael E. Porter, Cluster Mapping Project, Institute for Strategy and Competitiveness, Harvard Business School; Richard Bryden, Project Director.Exports of US$2.5 billion =
Glass
Automotive Components
Engines
Automotive PartsProduction Equipment

52 Copyright 2009 © Professor Michael E. PorterCompetitiveness Master - 2009-04-20.ppt
$0
$2,000
$4,000
$6,000
$8,000
$10,000
-5% -4% -3% -2% -1% 0% 1% 2% 3% 4% 5% 6% 7%
Regional Economic PerformanceTurkish Provinces
Unweighted Turkish Average: 0.81%
Note: 2001 is latest available data for Turkish provinces. Source: OECD Regions at a Glance: 2009
Unweighted Turkish Average: $4,888
Adana
IzmirMuğla
Yalova
Eskişehir
Kirklareli
Kirikkale
Nevşehir
Bursa
Ankara
Istanbul
Kocaeli($17,036)
Bolu (10.82%, $11,649)
Çanakkale Mersin Edirne
Artvin
Zonguldak (8.37%)
Antalya
Tekirdağ
GDP per Capita, 2001 (USD, PPP-adjusted)
Growth of Real GDP per Capita (PPP-adjusted), CAGR, 1995-2001
ManisaBilecik
Sakarya
Kayseri / KastamonuKütahya
Tunceli
Hatay
GiresunSivas
Düzce (-13.13%) BayburtOsmaniye
Sinop
Batman
Aydin / Karaman Balikesir Burdur RizeKilis
Ordu
BingölŞirnak Muş
Agri
YozgatAksaray
Adiyaman
Ezrincan
Uşak
Bitlis
NiğdeElaziğKahramanmaraş
Denizli
Van Hakkari
Afyon
Isparta
SamsonÇorum
DiyarbakirMaltya
KanyaKirşehir
GümüşhaneSiirtÇankiri
Ardahan
MardinEzurum
Kars Iğdir

53 Copyright 2009 © Professor Michael E. PorterCompetitiveness Master - 2009-04-20.ppt
Specialization by Cluster of Turkish Regions, 2007
Note: Source: European Cluster Observatory, 2009
IstanbulTextilesLeather and ApparelDistribution ServicesJewelry
IstanbulTextilesLeather and ApparelDistribution ServicesJewelry
Bati AnadoluFurnitureConstruction MaterialsDistribution ServicesAerospace
Bati AnadoluFurnitureConstruction MaterialsDistribution ServicesAerospace
AkdenzizTextilesHospitality and TourismApparelDistribution Services
AkdenzizTextilesHospitality and TourismApparelDistribution Services
Orta AnadoluFurnitureTextilesAgricultural ProductsMetal Mining and Manufacturing
Orta AnadoluFurnitureTextilesAgricultural ProductsMetal Mining and Manufacturing
Bati KaradenizTobaccoApparelMetal Mining and ManufacturingForest Products
Bati KaradenizTobaccoApparelMetal Mining and ManufacturingForest Products
Dogu KaradenizFood ProcessingDistribution ServicesFurnitureForest Products
Dogu KaradenizFood ProcessingDistribution ServicesFurnitureForest Products
Ortadogu AnadoluTextilesAgricultural ProductsApparelDistribution Services
Ortadogu AnadoluTextilesAgricultural ProductsApparelDistribution Services
Guneydogu AnadoluTextilesTobaccoOil and GasFood Processing
Guneydogu AnadoluTextilesTobaccoOil and GasFood Processing
Bati MarmaraApparelTextilesChemicalsConstruction Materials
Bati MarmaraApparelTextilesChemicalsConstruction Materials
Dogu MarmaraTextilesAutomotiveApparelFurniture
Dogu MarmaraTextilesAutomotiveApparelFurniture
EgeTobaccoTextilesConstruction MaterialsApparel
EgeTobaccoTextilesConstruction MaterialsApparel
Kuzeydogu AnadoluAgricultural ProductsFootwearDistribution ServicesHospitality and Tourism
Kuzeydogu AnadoluAgricultural ProductsFootwearDistribution ServicesHospitality and Tourism

54 Copyright 2009 © Professor Michael E. PorterCompetitiveness Master - 2009-04-20.ppt
Regional Economic Development in TurkeyAction Agenda
• Decentralize economic policy making to enhance regional leadership while creating incentives / accountability for performance
• Create a sound development platform in each region, including sound physical infrastructure and the provision of basic public services
• Create regional governmental capability to assume responsibility for regional economic development
• Decentralization of economic policy should be seen as a long term process, with devolution taking place in stages as regional government capabilities develop
55 Copyright 2009 © Professor Michael E. PorterCompetitiveness Master - 2009-04-20.ppt
Economic Integration Among Neighboring CountriesTurkey’s Neighborhood
• Turkey sits at the crossroad between Europe and the Middle East• Economic coordination among neighboring countries can significantly enhance competitiveness• Integration offers greater opportunities than participation in broader economic forums (e.g., EU)
56 Copyright 2009 © Professor Michael E. PorterCompetitiveness Master - 2009-04-20.ppt
Economic Coordination with Neighboring Countries
Assessment
• Turkey’s geographic position between a number of important global regions provides huge opportunities
• While government policy has focused on politically stable relations with neighbors, companies have started to extend their operations into these neighboring countries
Action Agenda
• Turkey should pursue economic coordination with neighboring countries as a critical tool of economic policy to reap the full benefits of its geographic location
• Turkey has a great opportunity to create a new Eastern neighborhood

57 Copyright 2009 © Professor Michael E. PorterCompetitiveness Master - 2009-04-20.ppt
Agenda
• Turkey’s Economic Performance
• Principles of Competitiveness
• Assessment of Turkey’s Competitive Position
• Towards an Economic Strategy

58 Copyright 2009 © Professor Michael E. PorterCompetitiveness Master - 2009-04-20.ppt
Toward a Turkish Economic Strategy
Implications
Maintain a sound macroeconomic policy platform
Achieve political stability
Continue to strengthen workforce skills
Consolidate efforts for SME development
Mobilize cluster development
• Large workforce with a strong work ethic at competitive wage levels
• Strong entrepreneurial “trading”legacy
• Significant and growing domestic market
• Large, spread out geographic area with heterogeneous regions
• Geographic position at the crossroads of major world regions
• Companies with experience to operate in challenging policy environments
• Stronger market institutions than other emerging economies
Unique Strengths
Decentralize economic policy and strengthen regional institutions
Simplify trade of goods and services
Intensify economic collaboration with neighbors
Strengthen physical infrastructure connecting provinces and neighbors

59 Copyright 2009 © Professor Michael E. PorterCompetitiveness Master - 2009-04-20.ppt
Turkey: Moving to Action
• Strong private sector leadership is needed to address the well documented competitiveness challenges facing Turkey
• Encourage Provincial Competitiveness Councils working with the new economic development agencies to drive consensus on provincial plans which monitor implementation
– Involve representatives from the public, private and academic sectors as well as federal government participation
• Work towards the creation of a private-sector led National Council on Competitiveness to build consensus on an overall economic strategy and track implementation
– Public sector and academia participation is critical in order to develop effective national policy and coordinate implementation
60 Copyright 2009 © Professor Michael E. PorterCompetitiveness Master - 2009-04-20.ppt
Moving the Next Level of Turkish Competitiveness:The Role of the Private Sector
• The recent improvements in Turkish economic policy have created new opportunities for Turkish companies to grow and upgrade
• The next stage of economic development will require companies tobecome a more active partner in the design and implementation of economic policy
– Participate in national and regional competitiveness efforts– Collaborate with other companies in upgrading the business environment
• A coherent economic strategy for Turkey will be crucial to allow the country to be able to fundamentally enhance competitiveness
• Such a strategy will only be effective only if it is based on a new model of collaboration between business and government