turkcell...turkcell | first quarter of 2016 4 1 try figures are based on ifrs try figures 2 net...
TRANSCRIPT

Turkcell | First Quarter of 2016
1
TURKCELL FIRST QUARTER OF 2016
April 28, 2016

Turkcell | First Quarter of 2016
2
This presentation may contain statements that are forward looking. These statements are based on current expectations and assumptions that are subject to risks and uncertainties, which may cause actual results to differ materially due to factors discussed in this presentation, in our press release, in the Risk Factors section of Turkcell’s most recent Form 20-F, or in other reports and filings with the US Securities and Exchange Commission. We undertake no duty to update or revise any forward looking statements, whether as a result of new information, future events or otherwise. Please note that non-financial data is unconsolidated unless otherwise specified.
NOTICE

Turkcell | First Quarter of 2016
3
BUSINESS OVERVIEW Kaan Terzioğlu Turkcell CEO
Turkcell | First Quarter of 2016
4 1 TRY figures are based on IFRS TRY figures 2 Net Income excluding FX gain/(loss) (inc tax and minority impact), monetary gain (inflation impact), interest Income on time deposit, Fintur’s profit/loss impact & one off items
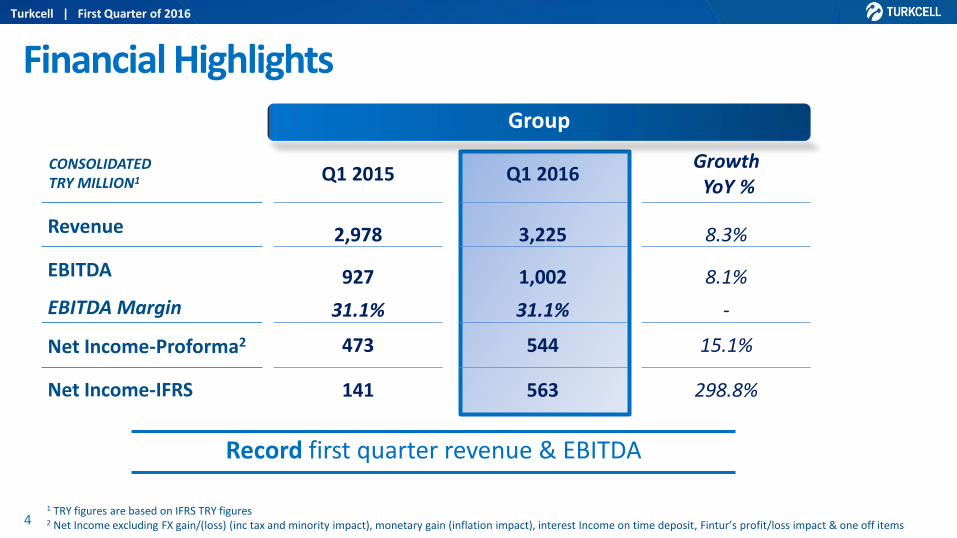
Financial Highlights
CONSOLIDATED TRY MILLION1 Q1 2015 Q1 2016
Growth YoY %
Revenue 2,978 3,225 8.3%
EBITDA 927 1,002 8.1%
EBITDA Margin 31.1% 31.1% -
Net Income-Proforma2 473 544 15.1%
Net Income-IFRS 141 563 298.8%
Group
Record first quarter revenue & EBITDA

Turkcell | First Quarter of 2016
5
~20%
31%-33% Margin
Turkey 8-10% Group 8-10%
EBITDA EBITDA MARGIN
OPERATIONAL CAPEX / SALES3
TURKCELL TURKEY TRY MILLION1
REVENUE
- NET INCOME-PROFORMA2
GROUP GUIDANCE
Q116 YoY
2,928 10.0%
916 31.3%
10.6% 0.2pp
538 11.4%
3,225 8.3%
1,002 31.1%
8.1% -
544 15.1%
20% 8pp
Q116 YoY
1 TRY figures are based on IFRS TRY figures 2 Net Income excluding FX gain/(loss) (inc tax and minority impact), monetary gain (inflation impact), interest Income on time deposit, Fintur’s profit/loss impact & one off items 3 Excluding license fees
Financial Highlights
Good start to the year; 2016 guidance is maintained

Turkcell | First Quarter of 2016
6
Turkcell Turkey: Double Digit Growth Continued Turkcell Turkey
2,442 2,662
2,928
765 828 916
31.3% 31.1% 31.3%
Q114 Q115 Q116
Revenue EBITDA EBITDA Margin
10.0% YoY
(TRY Million)
10.6% YoY
13.9% YoY 3%
% in Turkcell Turkey
Consumer
Corporate
80%
18%
Q116 Revenue Growth
Wholesale
8.7% YoY
10.0% YoY

Turkcell | First Quarter of 2016
7
Turkcell Turkey: Strong Data & Services Growth
YoY Growth
Consumer & Corporate
Revenue Breakdown
% of Turkcell Turkey
Data & Services 31.1% 42%
Other1 (including
Hardware & Software Sales) 37.0% 4%
SMS 2.9% 5%
Voice 4.1% 48%
606 638 727 740 763
187 200 213 228 240 144
159 177 179
226
Q115 Q215 Q315 Q415 Q116
Mobile broadband Fixed broadband
Services&Solutions
YoY
28.4%
25.8%
Data & Services Revenues TRY Million
1,117
937 997
1,147 1,229
As of Q116
57.2%
31.1%

Turkcell | First Quarter of 2016
8
34.3 33.3
15.5 16.7
45% 50%
Q115 Q116Total PostpaidPostpaid (%)
Continued Focus on Value
1,272 1,582
776 935
Q115 Q116Total Fiber
99
268
Q115 Q116IPTV
Mobile (million) Fixed (thousand) TV (thousand)
124K 36K 44K
Smartphone (million)
13.2 16.6
42%
55%
Q115 Q116Number Penetration
514K
Postpaid Fiber IPTV Smartphone Net Add
QoQ
YoY 1.2M 159K 169K 3.4M

Turkcell | First Quarter of 2016
9
29%
42% 30%
Single Play
Double Play
Multi-play with TV36%
47%
17%
Single Play
Double Play
Triple Play
Mobile
Increasing Multi-play Fiber Residential
Subscriber Breakdown* Subscriber Breakdown**
ARPU (TRY) Q116 YoY Growth
Mobile Blended 24.7 8.8%
Postpaid (excl. M2M) 41.7 2.2%
Prepaid 12.4 9.7%
ARPU (TRY) Q116 YoY Growth
Fixed Residential 50.3 6.8%
*Breakdown among mobile voice users which excludes subscribers who do not use their line in the last 3 months **Fiber residential subscriber breakdown revised and Multi-play with TV includes internet and TV users which was shown in double play in previous presentations

Turkcell | First Quarter of 2016
10
Integrated Call Center Single call center & My Account app
Uninterrupted Connection 4.5GB mobile internet until XDSL installation
No installation Costs No charge for fixed line installation
Single Invoice One and only in Turkey
First Real Converged Offers
15
10
6 4
1000 MIN 500 MIN
5GB 5GB 1GB
50 Mbps Unlimited (75 GB)
TRY129 TRY109 TRY89 TRY79
GB Mobile internet
GB
GB GB
5GB 5GB ∞

Turkcell | First Quarter of 2016
11
INSTANT MESSAGING
7.5M download As of April
SPORTS
2.1M download As of April
PERSONAL CLOUD
2.6M download As of April
MUSIC
5.7M download As of April
DOWNLOAD (Million) DOWNLOAD (Million) DOWNLOAD (Million)
679 558
342 211
165
Q116
Q415
Q315
Q215
Q115
TURKCELL TV+
~700K subscribers As of April
2.0 1.6
1.1 0.9
0.6
Q116
Q415
Q315
Q215
Q115
2.5 2.3
2.0 1.2
0.8
Q116
Q415
Q315
Q215
Q115
5.6 5.2
4.1 3.5
3.0
Q116
Q415
Q315
Q215
Q115
7.1 4.8
1.9 1.4
0.5
Q116
Q415
Q315
Q215
Q115
SUBSCRIBERS (000)
Download numbers are cumulative BIP download numbers include total of BIP 1.0, 2.0 and 3.0
Continued Focus on Strategic Services
"All-Access" "All-Access" "All-Access" "All-Access" "All-Access" in Q2
DOWNLOAD (Million)
Turkcell | First Quarter of 2016
12
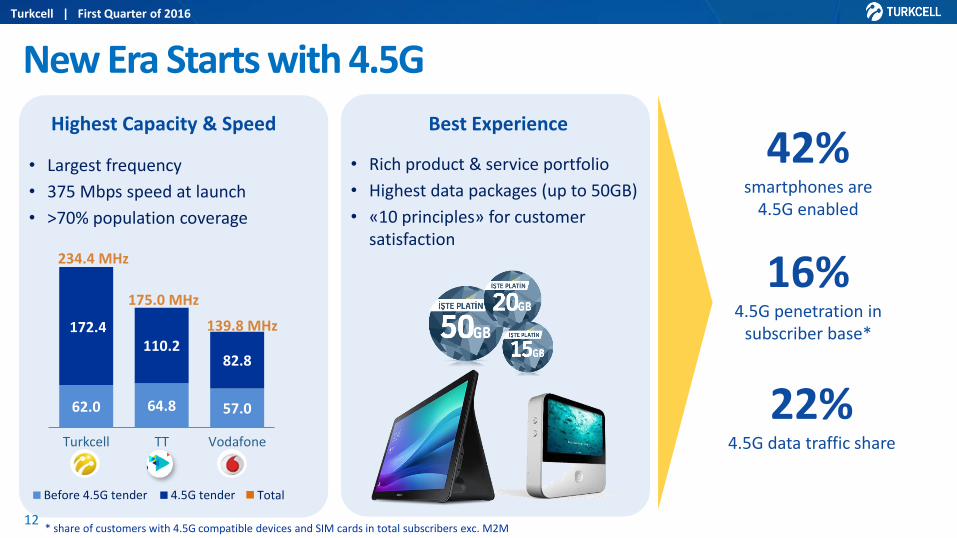
• Rich product & service portfolio
• Highest data packages (up to 50GB)
• «10 principles» for customer satisfaction
• Largest frequency
• 375 Mbps speed at launch
• >70% population coverage
New Era Starts with 4.5G
42% smartphones are
4.5G enabled
22% 4.5G data traffic share
Highest Capacity & Speed Best Experience
62.0 64.8 57.0
172.4 110.2
82.8
Turkcell TT Vodafone
Before 4.5G tender 4.5G tender
234.4 MHz
139.8 MHz
175.0 MHz 16%
4.5G penetration in subscriber base*
Total
* share of customers with 4.5G compatible devices and SIM cards in total subscribers exc. M2M

Turkcell | First Quarter of 2016
13
Turkcell International: Returned to Growth & Profitability
17%
UKRAINE
BELARUS
65%
% in Turkcell International
16%
NORTHERN CYPRUS
31.4%
1.7%
3.2%
Revenue Growth (in local currency)
EBITDA Margin
34.8%
6.9%
30.7%
in UAH
in BYR
in TRY
-656
109
4 58
11
-38.0%
-23.6% -22.9%
-12.0%
2.1%
Turkcell International (TRY Million)
Q115 Q215 Q315 Q415 Q116
Revenue 193 205 235 224 197
EBITDA Margin 27.5% 27.2% 29.6% 30.2% 27.2%
Net Income
Revenue
Growth YoY

Turkcell | First Quarter of 2016
14
FINANCIAL OVERVIEW Murat D. Erden Turkcell CFO
NOTICE:
Please note that all financial data are consolidated whereas non-financial data are unconsolidated unless otherwise specified.
All non-financial data are unconsolidated, prepared in accordance with IFRS and expressed in US$ and/or TRY.
The figures used in this presentation are rounded while percentage changes are calculated based on the figures disclosed in the Q1 2016 result announcement press release.

Turkcell | First Quarter of 2016
15
2,978
3,225
265
4 (22)
RevenueQ115
Δ in Turkcell Turkey
Δ in Turkcell International
Δ in Other Subsidiaries
RevenueQ116
8.3%
TRY MILLION
Turkcell Group: Revenue & EBITDA Development REVENUE
927 1,002
247 (129)
(38) (5)
EBITDAQ115
Δ in Revenues
Δ in Direct cost of
revenues*
Δ in G&A exp.
Δ in S&M exp.
EBITDAQ116
TRY MILLION
8.1%
EBITDA
* Excluding depreciation & amortization

Turkcell | First Quarter of 2016
16
141
563 14 (43)
(80)
693
91 (253)
Q115 Δ in EBIT Δ in Interest Inc./Exp.
Δ in Equity in Net Inc./Loss
Δ in FX Gain/Loss
Δ in Taxation Δ in Other Inc/Exp. Q116
Turkcell Group: Net Income Development TRY MILLION
∆ in EBITDA 75 ∆ in D&A (61)
∆ in non-controlling interest (295) ∆ in other inc/exp 43

Turkcell | First Quarter of 2016
17
Turkcell Group: Balance Sheet Highlights
TRY MILLION Q1 2015 Q4 2015 Q1 2016
Total Cash 8,174 2,919 2,522
Total Assets 23,978 26,207 26,175
Total Debt 4,127 4,214 4,028
Net Debt/(Cash) (4,046) 1,295 1,506
Total Equity 12,927 14,419 14,902
SUMMARY BALANCE SHEET
2,919 2,522
1,002 (738) 172 (145) (491) (195)
Q415 EBITDA Capex* Net intincome
Net chg in debt Regulatory fees Other Q116
CASH DEVELOPMENT
* Including operational and non-operational Capex

Turkcell | First Quarter of 2016
18
86%
14%
Foreign Currency Local Currency
81%
19%
Foreign Currency Local Currency
Debt Breakdown Q1 2015
TRY 4,127 mn
TRY 4,028 mn
Turkcell Turkey 54% 46% 90% 10%
lifecell 94% 6% 0% 100%
BeST 100% 0% 0% 100%
Q1 2016
(5,334)
1,295 1,506
(1.4x)
0.3x 0.4x
2014 2015 Q116
Net Debt (TRY mn)
Net Debt/EBITDA
NET DEBT/EBITDA

Turkcell | First Quarter of 2016
19
THANK YOU For further information please e-mail
[email protected] or call Turkcell Investor Relations at
(+90 212 313 1888)
Have you updated Turkcell IR app? For Android For iOS

Turkcell | First Quarter of 2016
20
APPENDIX

Turkcell | First Quarter of 2016
21
Summary Income Statement As Per CMB1 Financials
1 Capital Markets Board of Turkey 2 Depreciation and amortization is included
Summary income statement Q1 2015 Q4 2015 Q1 2016 YoY (%) QoQ (%)
Revenue 2,978 3,335 3,225 8% (3%)
Direct Cost of Revenues2 1,828 (2,054) (2,018) 10% (2%)
S&M (476) (493) (481) 1% (2%)
G&A (141) (166) (179) 27% 8%
EBITDA 927 1,058 1,002 8% (5%)
EBITDA Margin 31.1% 31.7% 31.1% - (0.6pp)
Net Income 142 585 563 298% (4%)
(TRY MILLION)

Turkcell | First Quarter of 2016
22
Consolidated Balance Sheet
Consolidated Balance Sheet 1Q 2015 4Q 2015 1Q 2016 YoY (%) QoQ (%)
Cash & Bank 8,174 2,919 2,522 (69%) (14%)
CURRENT ASSETS 13,363 8,795 8,645 (35%) (2%)
Fixed Assets, Net 8,564 15,104 15,272 78% 1%
Other Long Term Assets 2,051 2,308 2,258 10% (2%)
TOTAL NON-CURRENT ASSETS 10,615 17,412 17,530 65% 1%
TOTAL ASSETS 23,978 26,207 26,175 9% 0%
S/T Debt 3,578 726 655 (82%) (10%)
TOTAL CURRENT LIABILITIES 9,742 6,304 5,759 (41%) (9%)
L/T Debt 550 3,488 3,373 514% (3%)
TOTAL NON-CURRENT LIABILITIES 1,309 5,484 5,514 321% 1%
MINORITY INTEREST (530) 64 66 (112%) 3%
Share Capital 2,200 2,200 2,200 - -
TOTAL EQUITY 12,927 14,419 14,902 15% 3%
TOTAL EQUITY AND LIABILITIES 23,978 26,207 26,175 9% 0%
(TRY MILLION)

Turkcell | First Quarter of 2016
23
2.54 2.90 3.02 3.22 2.94 2.82 3.18 3.21
2013 2014 2015 1Q16
Average Period-End
Currency Trends USD / TRY EUR / TRY
USD / BYR USD / UAH
1.91 2.19 2.73 2.92
2.13 2.32 2.91 2.83
2013 2014 2015 1Q16
8,883 10,255 15,917 20,552
9,510 11,850 18,569 20,133
2013 2014 2015 1Q16
7.99 11.87
21.79 25.77 7.99
15.77 24.00 26.22
2013 2014 2015 1Q16