turbulence locations and intensities from radio occultation … · 2013-03-19 · turbulence...
TRANSCRIPT

Lakshmi Kantha University of Colorado, Boulder
Sixth FORMOSAT/COSMIC Data Users’ Workshop at NCAR October 30, 2012
TURBULENCE LOCATIONS AND INTENSITIES FROM RADIO OCCULTATION SOUNDINGS

2
Turbulence in the Free Atmosphere Gage et al. (1980)

3
Education and Outreach
COSMIC RO soundings
Radiosonde soundings

4
Unstable Overturning Regions
V ~ 5m/s
Radiosonde
AL
TIT
UD
E
POTENTIAL TEMPERATURE
Unstable
Overturning
Region

Thorpe’s Sorting Algorithm
SORTING ALGORITHM4
1 2
34
5
67
8
9
1011
1213
14
15Z
6
5
127
4
11
83
10
9
Displacement d = Δz
Thorpe scale
LT = rms d1dn( )
Ozmidov scale
LO = ε / N 3
LO
~ LT
→ ε =CKLT
2N
3
CK
~O(1)
Mixing coefficient
K = γεN −2
Mixing efficiency γ ~ 0.25

6
2 sec (~ 10 m) FASTEX Radiosonde Soundings in 1997 Clayson and Kantha (2008)
εεεε

7
6 sec (~ 30 m) Operational Soundings at Denver in 2005 Clayson and Kantha (2008)
ε

Resolution, Resolution, Resolution

1 sec (~ 2 m) SAMS (Balsley et al. 2010) Soundings Kantha (2012)
ε

Effect of Vertical Resolution on extractions (Kantha 2012)
ε
ε
Blue - 2 m, Green – 10 m, Red – 30 m
ε =CKLT
2N3→

11
Harrow (Canada) ST Radar (Kantha & Hocking 2011)
ε = 0.6δ2N
δ −Corrected Spectral Width
Sondes – Red open circles Red lines Radar – Filled circles, Blue lines
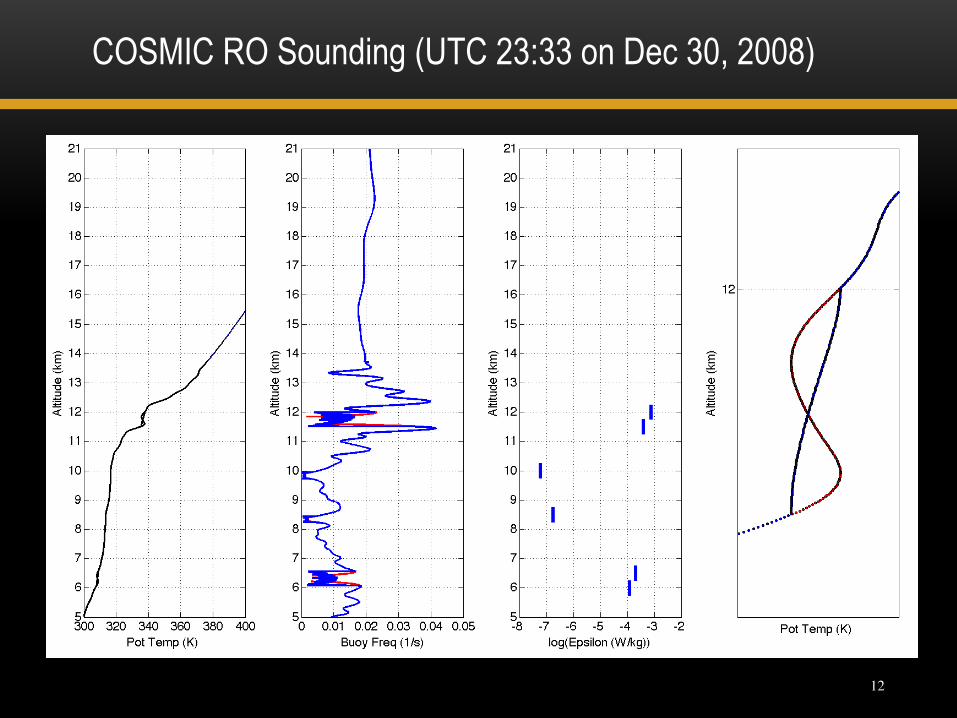
12
COSMIC RO Sounding (UTC 23:33 on Dec 30, 2008)
ε

13
Average between Flight Levels 8 and 12 km on July 1, 2010
εεεε
ε

14
at Various Flight Levels at 08:00 UTC on July 1, 2010 ε
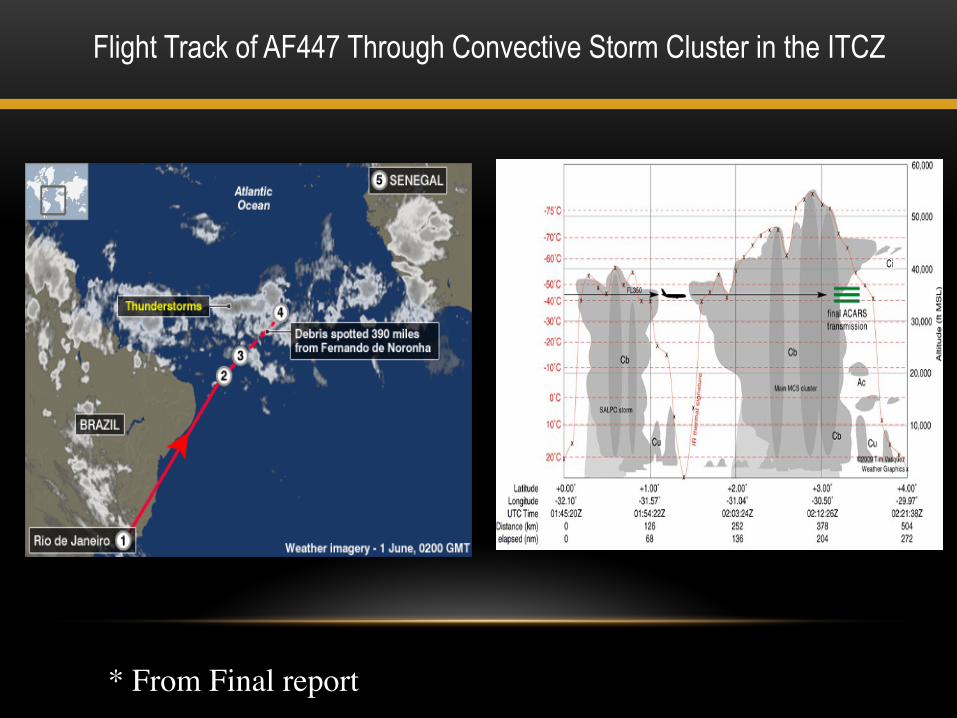
Flight Track of AF447 Through Convective Storm Cluster in the ITCZ
* From Final report

AF 447 Crash Site Temperature profiles and TKE Dissipation Rates
Temperature profiles
Red – Dry temperature, Blue – Temperature orrected for water vapor)

17
Aberystwyth (Wales) 50 MHz MST Radar

TKE Dissipation Rates in 1o x 1o box around Wales MST Radar

Comparison with Wales ST Radar
UTC 11:52 on April 19, 2008 NERC radar data from Dr. David Hooper
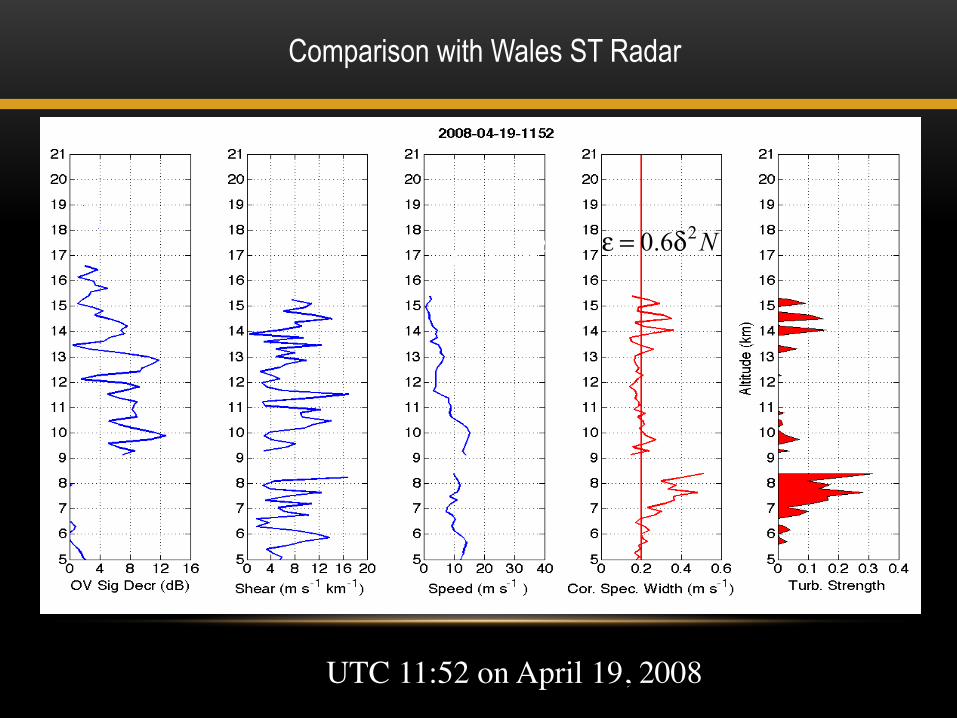
Comparison with Wales ST Radar
UTC 11:52 on April 19, 2008
ε = 0.6δ2N
ε = 0.6δ2N

• Extraction of turbulence locations and intensities from GPS/GNSS RO soundings feasible
• More cal/val is needed – ST/MST radars can help here. PIREPS too • Combined with high-res radiosondes, the technique can help
understand the spatio-temporal variability of mixing in the global free atmosphere
• Potential operational utility for aviation applications • Complements refractive index fluctuation spectrum approach by
Cornman et al. at NCAR • Looking forward to COSMIC follow-on projects and operational use
Concluding Remarks

QUESTIONS?
Acknowledgements: COSMIC Project and NCAR for RO soundings Dr. Clayson (WHOI) for assistance with data

• Clayson, C. A. and L. Kantha (2008). On turbulence and mixing in the free atmosphere inferred from high-resolution soundings. J. Atmos. Ocean. Technol., 25, 833–852. • Balsley, B. B., Kantha, L. & Colgan, W. (2010). On the use of Slow Ascent Meter-Scale Sampling (SAMS) radiosondes for observing overturning events in the free atmosphere. J. Atmos. Oceanic Technol., 27, 766-775. • Kantha, L. & Hocking, W. (2011). Dissipation rates of turbulence kinetic energy in the free atmosphere: MST radar and radiosondes. J. Atmos. Sol. Terr. Phys., 73, 1043-1051. • Kantha, L. (2012). Turbulence dissipation rates in the free atmosphere from high-resolution radiosondes. In Turbulence: Theory, Types and Simulation, Chapter 7, NOVA Science Publishers, 239-264. • Kantha, L. (2012b). Turbulence locations and intensities in the atmosphere from radio occultation soundings. Unpublished manuscript.
References