turbulence characteristics in sharp open-channel bends€¦ · · 2011-01-01turbulence...
TRANSCRIPT

Turbulence characteristics in sharp open-channel bendsK. Blanckaerta!
ICARE-ENAC, Ecole Polytechnique Fédérale, CH-1015 Lausanne, Switzerland
H. J. de VriendDelft University of Technology, P.O. Box 5048, 2600 GA Delft, The Netherlands
sReceived 24 March 2004; accepted 25 January 2005; published online 11 April 2005d
In spite of its importance, little is known about the turbulence characteristics in open-channel bends.This paper reports on an experimental investigation of turbulence in one cross section of anopen-channel bend. Typical flow features are a bicellular pattern of cross-stream circulationssecondary flowd and a turbulence activity in the outer bend that is significantly less than in theequivalent straight uniform shear flow. Measured distributions are given of the turbulent kineticenergy, its production, the mixing coefficients, some parameters characterizing the turbulencestructure, and the fourth-order correlations of the turbulent velocity fluctuations. The transportequation for the turbulent kinetic energy is evaluated term by term, on the basis of the measureddata. The results show that the turbulence structure is different from straight uniform flow, in thatthe Reynolds stress tensor is more diagonally dominant. This is shown to be the main cause of theobserved reduction of turbulence activity in the outer bend. The usual two-equation turbulenceclosure models include a transport equation for the turbulent kinetic energy, but they do not accountfor this modified turbulence structure. The departures of the measured turbulence structure from itsequivalent in straight uniform shear flow are related to a curvature-flux-Richardson numberRf
which includes the streamline curvature. Such a relation may be useful to improve simple turbulenceclosure models for curved open-channel flow. ©2005 American Institute of Physics.fDOI: 10.1063/1.1886726g
I. INTRODUCTION
Turbulence plays an important role in open-channelflows. It is to a large extent responsible for the spreading andmixing of heat and dissolved or suspended matterssedi-ments, pollutants, oxygen, etc.d. It also has a strong interac-tion with the mean velocity field and the boundary shearstress. Turbulence plays an important role in the formation ofcross-stream circulation cells,1 which in their turn influencethe distribution of the velocity and the boundary shearstress.2 This interaction is reflected by the sensitivity of flowmodels to the turbulence closure.
Open-channel bends are ubiquitous in alluvial lowlandrivers, but they also occur in mountain rivers and man-madechannels. They influence the conveyance capacity of thechannel, may lead to undesired erosion/deposition and en-hanced mixing, and provide a suitable place for the intake ofrelatively clear water. From an ecological point of view, me-anders give rise to a spatial variation of flow conditions, thusproviding a range of habitats. Meander migration is an im-portant agent in floodplain rejuvenation. Many good reasons,therefore, to investigate curved open-channel flow.
In spite of the relevance of both turbulence and bends,little is known about the turbulence characteristics in open-channel bends. The study of environmental problems inbends, such as spreading and mixing processes, suffers froman almost complete lack of experimental data on turbulence.Numerical simulations of the flow in open-channel bends
frequently use extensions of turbulence closures that weredeveloped for rectilinear shear flow. They often give poorresults, due to the different turbulence structure. The lack ofexperimental data, especially from simultaneous high-resolution measurements of all three velocity components,hampers the development of improved turbulence models.
The main goal of this paper is to present detailed experi-mental data on the turbulence characteristics in an open-channel bend, including distributions of the turbulent kineticenergystked, the production of tke, the mixing coefficients,parameters characterizing the turbulence structure, andfourth-order turbulence correlations. These experimental dataare measured in one cross section of a bend, in which theflow is characterized by the existence of a bicellular patternof cross-stream circulationssecondary flowd and by a signifi-cant reduction of the turbulence activity in the outer bend ascompared to straight uniform shear flow.
Another goal of this paper is to analyze the mechanismsthat lead to the reduction of the turbulence activity in theouter bend, via a term-by-term evaluation of the transportequation for the turbulent kinetic energy on the basis of themeasured data. Special attention is given to the terms repre-senting the production of tke and to those representing itsadvective transport by the cross-stream motion.
A third goal of this paper is to investigate whether tur-bulence closure models can be improved by means ofad hocmodifications that account for the influence of streamlinecurvature.adTelephone:141/21/6932378. Electronic mail: [email protected]
PHYSICS OF FLUIDS17, 055102s2005d
1070-6631/2005/17~5!/055102/15/$22.50 © 2005 American Institute of Physics17, 055102-1
Downloaded 25 May 2005 to 128.178.27.16. Redistribution subject to AIP license or copyright, see http://pof.aip.org/pof/copyright.jsp

II. THE EXPERIMENT
Natural river bends occur under a wide variety of spatialscales, planform shapes, and hydraulic parameters. Instead ofattempting to design an experiment that is representative ofmeandering natural rivers, we have opted for a sharp single-bend configuration consisting of a straight inflow reach fol-lowed by a constant curvature bend. The aim was to isolateand emphasize curvature effects and minimize contaminationby upstream geometrical and hydraulic effects. By consider-ing a relatively sharp bend, the curvature effects are morepronounced, hence better visible.
Flow measurements were carried out in a laboratoryflume which widthB is 0.4 m and consists of a 2 m longstraight approach reach, followed by a 120° bend with aconstant radius of curvatureR of 2 m at the centerline.
The bed, which was covered by a nearly uniform quartzsand with median grain size diameterd50=2.1 mm, was inequilibrium with the flow. In a preliminary run, the initiallyflat sand bed was deformed by the flow under clear-water-scour conditions, i.e., with the bed shear stress in the straightinflow reach at or just below the critical shear stress forsediment motion. This preliminary run led to the formationof a typical bar-pool topography in the bendsFig. 1d, which
shows important spatial variations but is stableszero timederivatived without active sediment transport.
The hydraulic conditions of the flow are shown in TableI. The parametersR/B=5 andR/H=17.9, and hence the as-pect ratioB/H=3.6, correspond to a bend that is rather sharpand significantly narrower than usual in natural lowland riv-ers. These ratios do occur, however, in mountain rivers andman-made channels. Moreover, the flow in a wide bend witha mobile-bed topography is concentrated mostly in the outerpart of the cross section, where the depth is significantlylarger than in the shallow inner bend with its almost “dead-water” zone.3,4 The “effective” aspect ratio there is signifi-cantly smaller than in a straight reach of the same channel.The flow in the outer bend in the present experiment is there-fore thought to be rather similar to the flow in the deepestpart of sharp natural channel bends. Although similaritiesexist, it should be borne in mind that no experimental setupcan be representative of natural rivers in general, whose tur-bulence characteristics may significantly depend on hydrau-lic parameters such as the aspect ratioB/H, or the curvatureratio R/H.
Nonintrusive velocity measurements were made on afine grid in the outer half of the cross section at 60° from the
FIG. 1. sad Experimental setup, bed topography, and reference system;sbd measuring grid in the cross section at 60°, acoustic Doppler velocity profilersADVPd configuration.
055102-2 K. Blanckaert and H. J. de Vriend Phys. Fluids 17, 055102 ~2005!
Downloaded 25 May 2005 to 128.178.27.16. Redistribution subject to AIP license or copyright, see http://pof.aip.org/pof/copyright.jsp
bend entrancefFig. 1sbdg. By imposing physical boundaryconditionssno slip condition, free shear, etc.d, some experi-mental data have been extrapolated into the zones close tothe water surface and the bed, outside the measuring grid, asexplained in detail in Blanckaert and Graf.5 These extrapo-lations, however, are not essential for the purpose of thepresent analysis. The measured data are represented and ana-lyzed in a coordinate system with thes axis along the chan-nel centerline, then axis perpendicular to it and pointing tothe left and thez axis vertically upwards, perpendicular tothe horizontalss,nd planesFig. 1d.
The velocity measurements were made with an acousticDoppler velocity profilersADVPd, developed at EPFL.6 TheADVP was mounted in a water-filled box attached to theoutside of the wallfFigs. 1sad and 1sbdg and measured thethree instantaneous velocity componentsv jstd simultaneouslyalong the main axis of the measuring device. Such transver-sal profiles, extending over half the channel width, weremeasured at vertical intervals of 0.5 cmfFig. 1sbdg. The sam-pling frequency was 44.6 Hz and the acquisition time was180 s. This provides sufficient information to derive themean velocity vectorv=svs,vn,vzd, as well as the fluctuatingvelocity vectorv8=svs8 ,vn8 ,vz8d and all turbulent correlationsvi8
av j8b si , j =s,n,z; a andb are integers, an overbar denotes a
time-averaged valued.A detailed description of the experimental setup, the
data-processing procedures and the measuring grid is givenin Blanckaert and Graf.5 More information on the workingprinciple of the ADVP, its experimental uncertainty, and itscomparison with other velocity meters can be found inRolland,7 Lemmin and Rolland,8 Hurther and Lemmin,9,10
Hurther,6 Blanckaert and Graf,5 Blanckaert and Lemmin11
and Blanckaert and de Vriend.1 In summary, the uncertaintyis estimated at less than 4% in the mean velocities, and atless than 10% in the turbulent normal stresses. The uncer-tainty in the turbulent shear stresses is slightly less than inthe turbulent normal stresses. For the present data set, Blanc-kaert and Graf5 have made more conservative estimates forthe turbulent shear stresses, ±20%, and for the cross-streamvelocities, ±0.002 m/sswhich amounts to about ±10%d.These higher relative uncertainties are mainly due to the lowmean values of these quantities. The uncertainty in the tur-bulence measurements increases progressively towards fixedboundaries, due to the steep mean velocity gradient in the
measuring volume. The lower 20% of the boundary layer isaffected by it. For that reason, the ADVP measurements fo-cus on the outer-flow region, away from the boundaries.
These uncertainties mainly concern statistical errors;systematic errors, due to instrument misalignment for ex-ample, are much smaller.
To eliminate the experimental scatter, the raw experi-mental data have been fitted using two-dimensional smooth-ing splines with weight functions.12 This procedure allowsusing relatively short acquisition timess180 sd. Furthermore,it allows for a more precise evaluation of the terms in thetransport equation for the tke, including derivatives and/orproducts of measured quantities. This smoothing technique isillustrated in Blanckaert and Graf.5 According to the proce-dure outlined by Blanckaert and de Vriend,1 the uncertaintyin these evaluated terms is estimated at less than 40%. This issufficient for the purpose of this paper, since our interpreta-tions focus on first-order effects.
III. EXPERIMENTAL RESULTS
Presentations of the distributions of the mean velocitiesand the turbulent stressesvi8v j8 have been reported by Blanc-kaert and Graf.5 Only the measured data that are of particularrelevance to this paper are briefly presented in this section.
The flow field in the investigated cross section at 60° ischaracterized by a bicellular pattern of cross-stream motionsvn,vzd, as shown in Fig. 2. The classical helical motion,termed center-region cell, is discernable in the central part ofthe cross section. The cross-stream velocities involved aretypically 10% of the mean downstream velocity. In the upperpart of the outer-bank region, a weaker counterrotating celloccurs, with cross-stream velocities of typically 3% of themean downstream velocity. The mechanisms leading to thesetwo circulation cells have been analyzed by Blanckaert andde Vriend.1–13
Figures 3sad and 3sbd show the normalized distributionsof the mean-flow kinetic energyK / s1/2U2d, and the turbu-lent kinetic energyk/ s1/2u*,60
2 d, per unit mass, in whichKandk are defined as
K = 12svs
2 + vn2 + vz
2d < 12vs
2, k = 12svs8
2 + vn82 + vz8
2d. s1d
The characteristic shear velocity,u*,60=ÎgRhs−]zS,60/]sd=0.045 m/s, is based on the downstream water-surface gra-
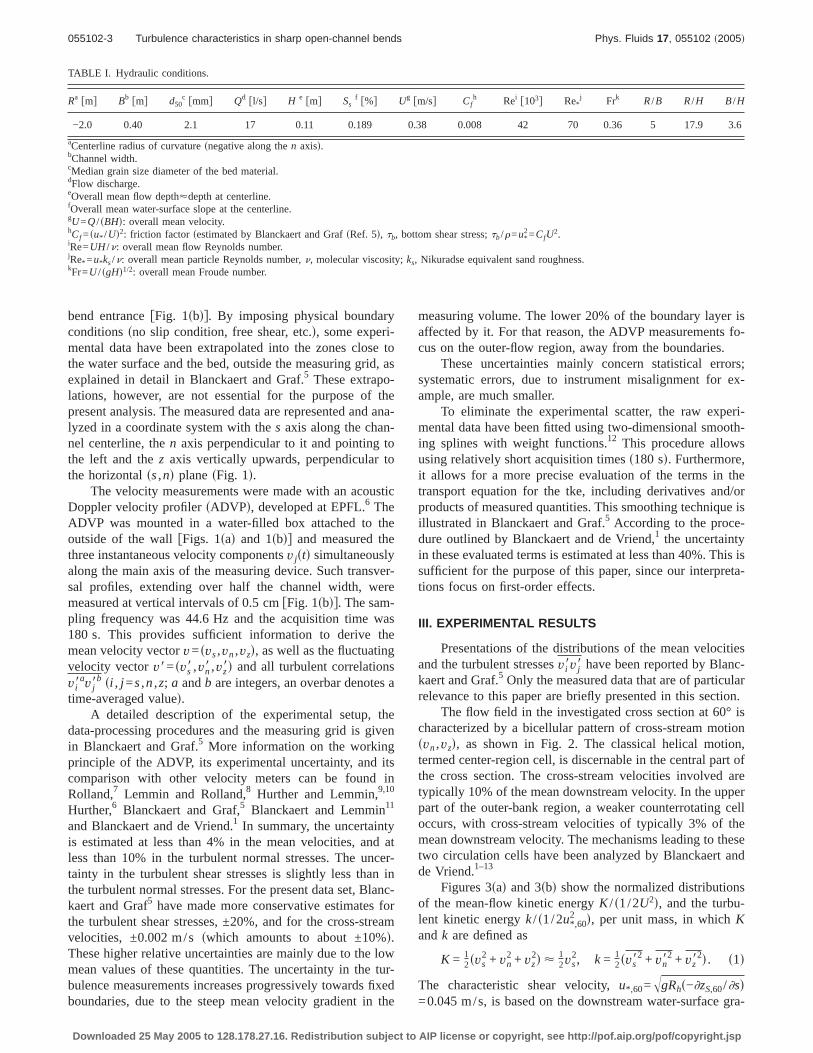
TABLE I. Hydraulic conditions.
Ra fmg Bb fmg d50c fmmg Qd fl/sg H e fmg Ss
f f%g Ug fm/sg Cfh Rei f103g Re*
j Frk R/B R/H B/H
−2.0 0.40 2.1 17 0.11 0.189 0.38 0.008 42 70 0.36 5 17.9 3.6
aCenterline radius of curvaturesnegative along then axisd.bChannel width.cMedian grain size diameter of the bed material.dFlow discharge.eOverall mean flow depth<depth at centerline.fOverall mean water-surface slope at the centerline.gU=Q/ sBHd: overall mean velocity.hCf =su* /Ud2: friction factor sestimated by Blanckaert and GrafsRef. 5d, tb, bottom shear stress;tb/r=u*
2=CfU2.
iRe=UH /n: overall mean flow Reynolds number.jRe* =u*ks/n: overall mean particle Reynolds number,n, molecular viscosity;ks, Nikuradse equivalent sand roughness.kFr=U / sgHd1/2: overall mean Froude number.
055102-3 Turbulence characteristics in sharp open-channel bends Phys. Fluids 17, 055102 ~2005!
Downloaded 25 May 2005 to 128.178.27.16. Redistribution subject to AIP license or copyright, see http://pof.aip.org/pof/copyright.jsp

dient at the centerline, −]zS,60/]s=0.289%, and the hydraulicradius,Rh=0.07 m, in the section at 60°.
In straight uniform flow, the vertical profiles ofKstraight
=vs,straight2 /2 typically increase from zero at the bed to a maxi-
mum value near the water surface, whereas the vertical pro-files of kstraighttypically decrease monotonically from the bed
towards the water surface. Assuming a logarithmic down-stream velocity and an exponentially decreasing tke from thebed towards the water surfacesNezu and Nakagawa14d
vs,straight= Usf1 + k−1ÎCfs1 + lnz/hdg = Usfs, s2d
kstraight= 4.78u*2 e−2sz/hd, s3d
it is found by integration of Eqs.s2d and s3d over the flowdepthh that kkl / kKl uniquely depends on the friction factor:
U kklkKl
Ustraight
=kkstraightl
12kvs,straight
2 l=
4.133
kfs2l
S u*
UsD2
=4.133
kfs2l
Cf
< 4.1Cf , s4d
wherefs is the form of the vertical profile of the downstreamvelocity vs, k is the Karman constant,k l indicate localdepth-averaged values andUs=kvsl. The overall resistancefactor Cf in the experiments was about 0.008, which meansthat kkl / kKl<0.03 is to be expected for straight flow.
In our curved-flow experimentthe distributions ofK andk show a more complex behavior. The vertical profiles ofK / s1/2U2d<svs/Ud2 fFig. 3sadg do not increase from thebed to the surface but have their maximum in the lower partof the water column.K / s1/2U2d increases from the center-line in outward direction to reach a maximum of about 2.2 atthe separation between the circulation cells. The mass is con-served, the large velocities are driven to the outside, hence
FIG. 2. Vector representation of normalized cross-stream motionsvn,vzd /U.
FIG. 3. sad Isolines of normalized mean-flow kinetic energyK / s1/2U2d; sbd isolines of normalized turbulent kinetic energyk/ s1/2u*,602 d; scd depth-averaged
normalized mean flow and kinetic energy,kKl / s1/2U2d andkkl / s1/2u*,602 d, and ratiokkl / kKl; the arrows refer to the scale axes left or right;sdd vertical profiles
of k/ s1/2u*,602 d in straight flow and bend flow.
055102-4 K. Blanckaert and H. J. de Vriend Phys. Fluids 17, 055102 ~2005!
Downloaded 25 May 2005 to 128.178.27.16. Redistribution subject to AIP license or copyright, see http://pof.aip.org/pof/copyright.jsp

the velocityvs is smaller thanU at the inside of the crosssection. As the cross-stream motion is rather weak, thismeans that the energy content there isK / s1/2U2d!1. Themean flow kinetic energy is thus concentrated in the outerpart of the bend. The mechanisms leading to thisK distribu-tion have been analyzed by Blanckaert and Graf.2
The distribution ofk fFig. 3sbdg exhibits the oppositepattern, in the water column as well as over the width. Thecore of minimumk values nearly coincides with that ofmaximumK values, and positive/negative gradients ofk cor-respond to negative/positive gradients ofK. The depth-averaged valuekkl / s1/2u*,60
2 d decreases from a centerlinevalue of 2.2 to minimum values of about 1 in the outer-bankregion, only to increase in the region affected by bank fric-tion. In Fig. 3sdd, the vertical profile ofkstraight/ s1/2u*,60
2 d forstraight uniform flow—according to Eq.s3d and based onu* =UÎCf with Cf <0.008—is compared with the verticalprofiles of k/ s1/2u*,60
2 d measured atn=−14.1 cm andn=−2.1 cm. In contrast to straight uniform flow, the mea-sured profiles decrease from the bed to a minimum and thenincrease towards a maximum near the water surfacefFig.3sbdg. Similar verticalk profiles have been measured in chan-nel bends and meanders by Tamai and Ikeya,15 Anwar,16
Muto,17 and Sudoet al.18
While in straight uniform flow the ratiokkl / kKl would
be constantsabout 0.03d in the two-dimensionals2Dd flowzone away from the banks, the opposite patterns ofK andkin our experiment result in a pronounced variation ofkkl / kKlover the cross-section. Towards the centerline,kkl / kKl is ofthe expected order of magnitude, but it then decreases, downto 0.01 in most of the outer bend, only to increase strongly inthe region affected by bank friction. Note that the uncertaintyin the depth-averaged values increases somewhat towards theouter bank, due to the extrapolations outside the measuringgrid. This uncertainty, however, is too small to explain thedifference between the expected values ofkkl / kKl<0.03 andthe measured one ofOs0.01d, and does not alter our conclu-sions.
In the next sections, we will investigate the mechanismsunderlying the observed distributions ofk andkkl / kKl, espe-cially in the outer bend.
IV. ANALYSIS
A. Transport equation for k
The mechanisms underlying the distribution of tke arenow investigated by means of a term-by-term analysis of thetransport equation for ksHinze;19 see Batchelor20 for thetransformation to curvilinear coordinatesd:
0 =]k
]t= − S 1
1 + n/Rvs
]k
]s+ vn
]k
]n+ vz
]k
]zD
−H 1
1 + n/R
]
]sFSp8
r+ ktDvs8G +
1
1 + n/R
]
]nFs1 + n/RdSp8
r+ ktDvn8G +
]
]zFSp8
r+ ktDvz8GJ s5d
pressure-gradient work+ turbulent k transport
− HSvs82 −
2
3kDess+ Svn8
2 −2
3kDenn + Svz8
2 −2
3kDezz+ 2vs8vn8esn+ 2vs8vz8esz+ 2vn8vz8enzJ
P = production of k= exchange of kinetic energy between mean flow and turbulence
− «snd
viscous dissipation of k,
wherekt=1/2sv8s2+v8n
2+v8z2d denotes the instantaneous tur-
bulent kinetic energy. Since they are not relevant to our ex-perimental analysis, all terms containing the molecular vis-cosity n are regrouped in«snd. Besides the viscousdissipation of turbulence it also contains some viscousdiffusion,19 which is assumed to be negligibly small, giventhe high Reynolds number in these experiments. In Eq.s5d, tdenotes time,s1+n/Rd is a metric factor accounting for thedivergence of the radial coordinate axes,p8 are the turbulent
pressure fluctuations andeijsi , j =s,n,zd are the strain rates,with ess+enn+ezz=0.
The bracketed terms in the third line of Eq.s5d, denotedby P, are found with the opposite sign in the transport equa-tion for the mean flow kinetic energyK.19 They represent theexchange of kinetic energy between mean flow and turbu-lence, which occurs through work of deformation of themean motion by the turbulent stresses. Although negativecontributions may exist in some regions of the flow domain
055102-5 Turbulence characteristics in sharp open-channel bends Phys. Fluids 17, 055102 ~2005!
Downloaded 25 May 2005 to 128.178.27.16. Redistribution subject to AIP license or copyright, see http://pof.aip.org/pof/copyright.jsp

falso see Fig. 4scdg, the sum is globally positive and is com-monly called the production ofk. Globally speaking,P isbalanced by the viscous dissipation«svd. Locally,P and«sndmay not balance, due to the transport terms in the first andsecond lines of Eq.s5d. These terms do not generate or dis-sipate energy, but merely redistribute it from one point in theflow to another.21 The terms in the first line represent theadvective transport ofk by the cross-stream motionsvn,vzdand due to the flow non-uniformitys] /]sd, whereas the termsin the second line represent turbulent diffusion ofk and workdone by the pressure gradient. Our experiment concernssteady flows]k/]t=0d, but the unsteady term is retained inEq. s5d to facilitate interpretation: positive/negative terms inthe right-hand side correspond to terms that tend to increase/decrease the localk.
The various terms in Eq.s5d are evaluated, as far aspossible, from our experimental data, in order to gain insightinto the mechanisms underlying the observedk distribution.By definition, the terms related to downstream variations inthe flow fields] /]s terms; including those appearing implic-itly in the strain ratesess, esn, andeszd cannot be evaluatedfrom velocity measurements in a single cross section. The
terms related to the pressure fluctuations could not be evalu-ated since the pressure was not measured. Knowledge ofthese terms would add to the understanding of curved-flowturbulence, but is not essential for the purpose of the presentpaper.
In straight uniform flow, neither cross-stream motion nordownstream or transversal gradients exist; therefore, Eq.s5dreduces to
0 = −]
]zSSp8
r+ ktDvz8D − 2vs8vz8 esz− «snd. s6d
Assuming a triangular distribution of −vs8vz8 with values zeroat the water surface andu*
2 at the bed, and assuming a loga-rithmic vertical profile of the downstream velocityvs fEq.s2dg, one can easily derive that
Pstraight= − 2vs8vz8 esz=1
k
u*3
HSH
z− 1D , s7ad
− 2vs8vz8 esz
u*3/H
=1
kSH
z− 1D . s7bd
FIG. 4. sad Normalized production ofk in straight uniform flow;sbd fictitious k distribution as would exist in the absence of cross-stream motion andschematic pattern of cross-stream motionsvn,vzd scf. Fig. 2d; scd normalized production ofk measured in the experimentfcf. Eq.s5dg; sdd normalized advectivetransport ofk measured in the experimentfcf. Eq. s5dg.
055102-6 K. Blanckaert and H. J. de Vriend Phys. Fluids 17, 055102 ~2005!
Downloaded 25 May 2005 to 128.178.27.16. Redistribution subject to AIP license or copyright, see http://pof.aip.org/pof/copyright.jsp

This function is shown in Fig. 4sad. Thek-production ismaximum at the bed and rapidly decreases towards the watersurface. Clearly, bed friction is the principal source of tke.This justifies normalizing the evaluated terms in thek-equation byu*,60
3 /H=0.0008 m2/s3. The tke is redistributedover the flow depth by the first terms in Eq.s6d and dissi-pated by the last term.
Intuitively, one would expect the observedk pattern inour curved-flow experimentto be redistributedsadvectivetransportd by the cross-stream motionsvn,vzd. This is diffi-cult to demonstrate, since thek distribution strongly interactswith the cross-stream motion. In order to have an idea of itsinfluence, we start from a fictitiousk distribution, as wouldexist in the absence of cross-stream motion, with highk val-ues near the flow boundaries and a rapid decrease away fromthose boundaries. Such a distribution, inspired by Eq.s3d, isproportional to the bed shear stresstb/r=u*
2, which in theabsence of advective momentum transport and neglecting in-fluences from the banks, can be obtained from the simplifieddepth-integrated downstream momentum equation:2
tb
r= u*
2 = −1
1 + n/Rgh
]zS
]s. s8d
Here ]zs/]s is nearly constant over the width of the bend;however, the physical water surface slope,s1+n/Rd−1]zs/]s, is larger in the inner bend than in the outerbend due to the metric factor 1+n/R s n/R. / ,0 in outer/inner bendd. This is the so-called potential-vortex effect thatimpels the locus of high velocity towards the inner bank.Over a natural bed topography, however, the influence of thelocal flow depthh is dominant andtb/r=u*
2 increases inoutward direction. The fictitiousk distribution shown in Fig.4sbd is obtained by inserting the measured values of]zs/]sand h in Eqs. s8d and s3d. To account in a simple way forturbulence generation by bank friction, the fictitiousk patternis taken symmetrical about the bisectors of the lower cornersof the flow domain.
We now let the measuredsvn,vzd-pattern act upon thisfictitious k distributionfFig. 4sbdg. The center-region cell ad-vects tke clockwise: the high near-bedk values are concen-trated in the inner bend; the highk values near the inner bankspread out near the water surface in the inner bend; the lowkvalues near the water-surface shift towards the downwardflow outer part of the center-region cell and give rise to acore of lowk values further down in the water column; therelatively low k values originating from the region of down-ward flow between the two cells concentrate near the bed inthe outer bend. Similarly, the outer-bank cell advects tkecounterclockwise: the highk values near the outer bank shifttowards the water surface near the outer bank; the low valuesnear the water surface shift towards the region where theouter-bank cell goes downwards and contributes to the coreof low k values; the relatively lowk values in the lower halfof the outer-bank cell are advected toward the outer bank.
Qualitatively, the above description agrees well with themeasured distribution ofk fsee Fig. 3sbdg.
Yet, the measured distribution of the advectivek trans-port by the cross-stream motionfFig. 4sddg seems not to
support the above analysis. In the center region, the mea-sured terms in Eq.s5d representing advectivek transportfFig. 4sddg are negative near the bed and thus tends to de-crease the observedk, whereas it is positive near the watersurface and tends to increase the observedk. Averaged overthe flow depth, the positive and the negative contributionsnearly compensate each other. In the outer-bank region, themeasured advectivek transport is negligible. The measuredadvectivek transport can still explain the deformation of thevertical k profiles as compared to the straight-uniform flowprofiles, but not the observed distribution ofk over the width,especially the reduced values in the outer-bank region.
This apparent contradiction is due to the nonlinearity ofthe k dynamics. Similar to the fictitiousk distribution, a fic-titious P distribution can be assumed that would exist in theabsence of cross-stream motion. Proportional to the localssheard velocity cubed, it would increase in outward directionand have the same vertical profiles as in straight uniformflow fEq. s7dg. Under the influence of the cross-stream mo-tion, the fictitiousk distribution gradually modifies as de-scribed above, which results in a gradual redistribution ofPand of the advectivek-transport terms themselves.
The measured distribution of the productionP fsee Fig.4scdg strongly deviates from the fictitious distribution, overthe flow depth as well as over the channel width. Whereasthe fictitious P distribution increases in outward direction,the measuredP distribution decreases. In the center region,P fFig. 4scdg is mainly due to bed friction and the measuredP values are of the same order of magnitude as the typicalnear-bed values in straight uniform flowfFig. 4sbdg. Thenear-bed values, however, should be interpreted with care,since the underlying velocity measurements are less reliablethere.1 Contrary to the straight uniform flow profiles, nega-tive values ofP are observed over most of the flow depth,indicating a restitution of kinetic energy from the turbulenceto the mean flow. These negative values, which reach nor-malized magnitudes as large asOs−25d, are almost entirelydue to thevs8vz8 esz-contributionfFig. 7sad in Blanckaert andde Vriend1g. Obviously, compared to a situation with onlyproduction of turbulent kinetic energy, i.e.,P.0, the exis-tence of zones withP,0 tends to reducek. In the outer-bank region, the magnitude ofP is less than in the centerregion, which is mainly due to the negligible values of theturbulent shear stressvs8vz8 fFig. 6sad in Blanckaert andGraf5g and of the correspondingvs8vz8 esz-contribution fFig.7sad in Blanckaert and de Vriend1g on the measuring grid.Values increase toOs20d in the region affected by friction atthe outer bank, indicating that the outer-bank friction is lessthan the bed friction in the center region, which leads toPvaluesOs300d. This is in agreement with the measured dis-tributions ofvs8vn8 andvs8vz8 sFig. 6 in Blanckaert and Graf5d.The small outer-bank friction is explained partially by thesmoothness of the outer bank as compared to the rough sandbed and partially by the reduced turbulence activity in theouter-bank region.
The turbulent diffusion in transversal directionsnotshownd is found to be relatively small, with normalized mag-nitudes less thanOs0.1d. The accuracy of the evaluated ver-tical diffusion termssnot shownd is poor. As expected, the
055102-7 Turbulence characteristics in sharp open-channel bends Phys. Fluids 17, 055102 ~2005!
Downloaded 25 May 2005 to 128.178.27.16. Redistribution subject to AIP license or copyright, see http://pof.aip.org/pof/copyright.jsp

terms are positive near the bed, with relatively high normal-ized values ofOs50d, and negative over most of the watercolumn. By no means, these terms can explain the observedtransversal distribution ofk.
The above analysis leads to the following hypothesisabout the mechanisms responsible of the observed distribu-tion of k. In the absence of cross-stream motion, the fictitiousproductionP increases in outward direction and leads to anoutward increasing fictitiousk distribution as shown in Fig.4sbd. The advectivek transport by the cross-stream motion isat the origin of the redistribution ofk. It tends to increase thek values in the inner half of the cross section and to decreasethem in the outer half. Ask gets redistributed, the advectivek transport becomes less efficient and ultimately, it does notexplain the observed width distribution ofk anymore. How-ever, ask becomes redistributed also the production termsPare modifiedsthe values of the turbulent stressesvi8v j8 obvi-ously depend on the available turbulent kinetic energykd.Whereas the initial fictitiousP increases in outward direc-tion, the modifiedP distribution ultimately decreases in out-ward direction. It can be concluded that this ultimateP dis-tribution is the major factor responsible of the measuredoutward decrease ofk. Especially the low values of thevs8vz8 esz contribution in the outer-bank region might be im-portant for the reducedk values.
Obviously there is a strong feedback between the re-duced levels ofk and the low values of the production termP in the outer-bank region. From the distributions ofk and ofP, however, it is not clear to what extent the reducedk iscaused by the lowP values, or conversely. This issue will beinvestigated by considering some typical turbulence charac-teristics in Sec. IV B and discussed in Sec. IV C.
B. Turbulence structure
In the previous chapter, the causal relation betweenkandP did not become clear. We will therefore take a closerlook at the turbulence-structure parametersa1 and n jk sthemixing coefficientsd. The role of these turbulence-structureparameters in thek-P relationship and thek distribution will
be discussed in Sec. IV C. A rather extensive presentation ofthe mixing coefficients is justified by the fact that they arealso important to the spreading and mixing of heat and dis-solved or suspended matterssediments, pollutants, oxygen,etc.d.
1. Structure parameter a 1
An important turbulence-structure parameter isa1, de-fined as22,23
a1 = Îvs8vz82
+ vn8vz82/2k. s9d
According to Schwarz and Bradshaw,22 it can be regarded asa first indicator of the efficiency of turbulent eddies in pro-ducing shear, given the amount of tke. The parametera1 istypically larger in two dimensional than in three-dimensionalflows. These smaller values ofa1 in various types of three-dimensional flows are shown and physically explained bySchwarz and Bradshaw22 and Piquet.23 To our knowledge,values ofa1 for three-dimensional open-channel flow havenot been reported before.
The vertical profile ofa1 for straight uniform open-channel flow is shown in Fig. 5sad. It is based on a triangularprofile of −vs8vz8 that increases from 0 at the water surface tou*
2 at the bed, under the assumption thatvn8vz8=0 and that Eq.s3d holds fork. The a1 profile increases from 0 at the watersurface, reaches a maximum of about 0.14 around mid-depthand subsequently decreases to about 0.1 at the bed. The ex-perimental distribution ofa1 for our curved open-channelflow is shown in Fig. 5sbd. In the center region, values arehigh, Os1d, mainly due to very high values of thes-z com-ponent of the Reynolds stress, which are probably associatedwith the deformation of the downstream velocity profile andthe downward directed secondary flow.24 Moreover, the dis-tribution of k in this area does not exhibit the sharp increasenear the bed which is common in straight uniform flow. Fi-nally, it has to be noted that the measured velocities are notvery accurate in the lowest 20% of the water column;1 there-fore the values may be overestimated there. Outward from
FIG. 5. Turbulence structure parametera1=Îvs8vz82+vn8vz8
2/2k; sad theoretical profile in straight uniform flow;sbd measured distribution in curved flow.
055102-8 K. Blanckaert and H. J. de Vriend Phys. Fluids 17, 055102 ~2005!
Downloaded 25 May 2005 to 128.178.27.16. Redistribution subject to AIP license or copyright, see http://pof.aip.org/pof/copyright.jsp

the centerline, a strong reduction ofa1 is observed:a1
=Os0.1d near the separation of the two circulation cells andeven less in the outer-bank region. This strong outward de-crease ofa1 corresponds to a similar outward decrease ofvs8vz8.
5 Apparently, the efficiency of shear production de-creases towards the outer bend.
2. Mixing coefficients
The mixing coefficientsn jk also tell something about theturbulence structure. Similar to the definition of the eddyviscosity, they are defined as the ratio between the deviatoricturbulent stresses −sv j8vk8−2/3d jkkd and the correspondingstrain ratesejk:
n jk = nkj = −v j8vk8 − 2/3d jkk
2ejks j ,k = s,n,zd, s10d
whered jk is the Kronecker delta. Note that these six mixingcoefficients do not have the frame-indifferent characteristicsof the Reynolds stress tensorv j8vk8 or the strain rate tensorejk.Applying the definition of the mixing coefficients, the termsrepresenting production of turbulent kinetic energy in Eq.s5dcan be rewritten as
P = 2snssess2 + nnnenn
2 + nzzezz2 + 2nsnesn
2 + 2nszesz2 + 2nnzenz
2 d.
s11ad
According to Eqs.s10d ands11ad, the mixing coefficients canbe regarded as indicators of the efficiency of the strain ratesin producing turbulence. The sign of the mixing coefficientn jk corresponds to the sign of the energy exchange term−sv j8vk8−2/3d jkkdejk in P. n jk.0 corresponds to productionof tke, whereasn jk,0 corresponds to restitution of kineticenergy from the turbulence to the mean flow via the corre-sponding turbulent stressv j8vk8.
The mixing coefficients are particularly important withrespect to environmental problems such as the spreading andmixing of heat and suspended or dissolved matter. Thosephenomena are described by an advection-diffusion equa-tion, in which the diffusion coefficientssRutherford25d arecommonly taken proportional to the mixing coefficients.
In numerical models, often a scalar eddy viscosity isadopted for turbulence closure, which implies thatnss=nnn
=nzz=nsn=nsz=nnz=nt.0 and thatP is definitely positive:
P = 2ntsess2 + enn
2 + ezz2 + 2esn
2 + 2esz2 + 2enz
2 d . 0. s11bd
In straight uniform flow, it is common practice to prescribe aparabolic distribution ofnt over the water column, with zerovalues at the bed and the water surface and a depth-averagedvalue ofkntlstraight=0.067uph. This profile corresponds to thelogarithmic downstream velocity profile. The experimentalmixing coefficients shown in Fig. 6 are normalized by thisreference value for straight uniform flow,kntlstraight
=0.067u*,60H.The distributions of all mixing coefficients shown in
Figs. 6sad–6sed contain positive as well as negative values.Near the bed, mainly positive values are found, whereasnegative values occur mainly in the upper part of the watercolumn. The latter correspond to a restitution of kinetic en-
ergy from the turbulence to the mean flow via the turbulentstressv j8vk8. Obviously, the existence of zones with negativemixing coefficients tends to reducek with respect to thesituation in which there is only production of turbulent ki-netic energysv jk.0d. Negative values of the mixing coeffi-cients v jk—or of the corresponding kinetic energy ex-change −sv j8vk8−2/3d jkkdejk—have been reportedbefore.16,26–28 Blanckaert and de Vriend1 have shown thatthis restitution of kinetic energy from the turbulence to themean flow plays an important role in the generation of theouter-bank cell of cross-stream circulation in the present ex-perimentscf. Fig. 2d.
Looking at the distribution over the water column, themagnitude of the experimental mixing coefficients has a ten-dency to be minimal near the bed and near the water surfaceand to have a maximum somewhere halfway the water col-umn. Qualitatively, this is in agreement with the parabolicprofile used in straight uniform flow.
As stated before, the magnitudessabsolute values areindicated byi id of the mixing coefficients are very impor-tant to the modeling of spreading and mixing processes.However, experimental data on these mixing coefficients arescarce. The present data show that the coefficientinnni fFig.6sadg is maximum near the centerline, decreases towards aminimum near the separator between the two circulationcells and increases again towards the outer bank. The coef-ficient inzzi fFig. 6sbdg shows the opposite behavior and hasits maximum in the separation zone between the two cells.As mentioned before, thess,nd and thess,zd contributionsare dominant in the production of tke. The magnitude of thecorresponding mixing coefficientsinszi and insni fFigs. 6scdand 6sdd, respectivelyg strongly decreases in the outward di-rection, fromOs1 to 10d in the center region toOs0.1 to 1d inthe outer-bank region.innzi fFig. 6sedg behaves similarly, ex-cept that it assumes high values near the center of the outer-bank cell. This outward decrease of the mixing coefficientsrelated to the turbulent shear stresses is in agreement with theoutward decrease of the coefficienta1 fFig. 5sbdg and con-firms the observation that the efficiency of shear stress pro-duction for a given turbulent kinetic energy is reduced incurved flow.
Figure 6sfd shows the lateral distribution in the outerbend of the mixing coefficientskin jkil, being the depth-averaged absolute values evaluated within the measuringgrid and excluding the asymptotic values where the straintends to zero. These lateral distributions confirm the behaviorobserved in the three-dimensional distributions. Note thestrong decrease ofkinszil in outward direction, with very lowvalues in the outer-bank region.kinsnil reaches similar smallvalues in the outer-bank region. The normalized average val-ues over the entire measuring grid,kkin jkill, shown in thetable below Fig. 6sfd, are allOs1d. The dominant componentis sn,nd, with a normalized value of 5.32, which should becompared with the values of 1.5slaboratory channelsd to 6sirregular waterwaysd reported by Graf and Altinakar.29 It isremarkable that the components related to the turbulent nor-mal stresses are larger than those related to the turbulentshear stresses.
055102-9 Turbulence characteristics in sharp open-channel bends Phys. Fluids 17, 055102 ~2005!
Downloaded 25 May 2005 to 128.178.27.16. Redistribution subject to AIP license or copyright, see http://pof.aip.org/pof/copyright.jsp

C. Physical mechanisms
The analysis of the transport equation fork indicated thatthe reduced turbulence activity in the outer-bank region can-not be explained solely from the advective redistribution oftke by the cross-stream motion. This phenomenon is prima-rily due to a decrease of the tke production. The parametera1
and the mixing coefficientsn jk sSec. IV Bd indicate that the
turbulence structure in our curved flow experiment differssignificantly from that in straight uniform flow. Given thesame amount of turbulent kinetic energyk the turbulent shearstressesv j8vk8 s j Þkd turn out to be significantly smaller. Inother words, the Reynolds stress tensor is more diagonallydominant in curved flow.
The observed decrease of the turbulence activity in the
FIG. 6. sad–sed Isolines of normalized mixing coefficientsfEq. s10dg; sfd width distribution of depth-averaged mixing coefficients.
055102-10 K. Blanckaert and H. J. de Vriend Phys. Fluids 17, 055102 ~2005!
Downloaded 25 May 2005 to 128.178.27.16. Redistribution subject to AIP license or copyright, see http://pof.aip.org/pof/copyright.jsp

outer-bank region can be explained from these findings asfollows. Suppose we start from the turbulence structure instraight uniform flow. If less turbulent shear stress is pro-duced while thek level remains the same, this leads to areduced production of tkefsee Eq.s5dg, and less productionobviously results in lowerk levels. The lowerk levels, intheir turn, lead to smaller turbulent stressesv j8vk8 and thusalso to a smaller productionP. Apparently, the feedback isnegative, so that it ultimately leads to a reduced, but nonzerok level.
Blanckaert and de Vriend30 have further analyzed theturbulence structure of the same flow field. They found thatthe velocity fluctuations are atypically coherent over thewidth and therefore decomposed them into slow coherentfluctuations and a background signal. The slow fluctuationsrepresent a bulk oscillation of the pattern of circulation cells.A spectral analysis shows that the slow fluctuations have thecharacteristics of a wavelike motionslow efficiency of sheargenerationd whereas the background signal has the character-istics of developed turbulence. This explains in physicalterms why the total velocity fluctuations lead to less shearstress production than if all of it were developed turbulence.
V. MODELING IMPLICATIONS
A. Standard turbulence closure
Consequently, for the accurate modeling of thek distri-bution it is not sufficient that the turbulence closure includesthe transport equation fork fEq. s5dg, it also needs to accu-rately describe the turbulence structure, i.e., the distributionof the turbulence energy among the different turbulent nor-mal stresses as well as the distribution of the turbulent shearstresses. Factors that influence the turbulence structure arethe cross-stream motion, downstream and transversal pres-sure gradients, accelerations and decelerations along stream-lines, the curvature of the streamlines, the relative bed rough-ness, etc. Large eddy simulationsLESd models or turbulenceclosures that use a transport equation for each of the turbu-lent stresses—such as Reynolds stress models—can accountfor all these factors. Such models are computationally expen-sive, which explains why lower-order turbulence closures arethe most commonly used in practice. The widely used two-equation closures, however, do not account for the factorsmentioned above. Thek-« model, for instance, which is oftenused for open-channel flows, contains the transport equationfor k, but uses a scalar eddy viscosity, which means that thedeviatoric turbulent stresses, −sv j8vk8−2/3d jkkd, are takenproportional to the strain rates,ejk fsee Eqs.s10d, s11ad, ands11bdg. It cannot accurately represent the turbulence struc-ture, sincent cannot account for the observed behavior of themixing coefficientsscf. Fig. 6d.
sid nt is definitely positive, whereas the experimentalmixing coefficients have positive as well as negativevalues.
sii d nt is a scalar, whereas the six experimental mixingcoefficients have different magnitudes and differentdistributions.
siii d The scalarnt cannot account for the different behavior
of the mixing coefficients related to the turbulent nor-mal stresses and those related to the turbulent shearstresses; especially the reduction of the latter in theouter bend cannot be reproduced.
All factors making the turbulence structure in our experi-ment deviate from that in straight channel flow directly orindirectly result from the main flow curvature. Therefore, itseems worthwhile to attempt finding a relationship betweenthe changes in the turbulence structure and a curvature pa-rameter. Such a relationship may be useful to make semi-empirical extensions to existing turbulence closure models,in order to improve their capabilities in curved open-channelflow.
B. Stratification analogue
1. Two-dimensional shear flows curvedin their own plane
Theoretical and numerical31–36 as well asexperimental37–39 investigations for two-dimensional shearflows curved in their own plane have shown that the struc-ture of turbulence is very sensitive to the streamline curva-ture. Its influence is an order of magnitude larger than pre-dicted by straightforward extensions of calculation methodsfor simple shear layers.
Bradshaw40,41 has established a formal analogy betweenthe influence of streamline curvature and the influence ofbuoyancy. While buoyancy leads to a density stratification ofthe flow, curvature leads to a pressure stratification. Theanalysis usually applied to derive buoyancy parameters fromthe equations of motion can be used to formally deriveanalogous curvature parameters. Extensions of standard tur-bulence closures based on such parameters have been pro-posed for a variety of two-dimensional shear flows, charac-terized by streamline curvature in the plane of mainshear.31,33–35,38
One such parameter is the curvature-flux-Richardsonnumber, defined as
Rf = S− 2vs8vn8vs
rsnDYS− vs8vn8
rsn
]rsnvs
]nD
=2vs
rsnYS 1
rsn
]rsnvs
]nD <
2vs
rsnYS ]vs
]n+
vs
rsnD , s12d
wherersn is the local radius of streamline curvature—whichis negative for the investigated left-turning bend—andn isthe direction in which the flow is curved.Rf is interpreted asthe ratio of the curvature-induced production ofs−v8n
2d to thetotal v8s
2 production. In these two-dimensional flows curvedin their own plane, turbulence is damped ifRf .0 and en-hanced ifRf ,0. Furthermore, the distribution of the turbu-lent kinetic energy among the turbulent normal stresses isaltered:v8n
2/v8s2 decreases asRf .0 and increases asRf ,0.
2. Three-dimensional open-channel flows curvedin the horizontal plane
Although our experiment concerns a more complexthree-dimensional flow field, curved in a different plane and
055102-11 Turbulence characteristics in sharp open-channel bends Phys. Fluids 17, 055102 ~2005!
Downloaded 25 May 2005 to 128.178.27.16. Redistribution subject to AIP license or copyright, see http://pof.aip.org/pof/copyright.jsp

FIG. 7. sad–sfd Isolines of normalized fourth-order turbulent correlationsÎsvi8v j8d2/u*,602 ; sgd time series ofvs8stdvz8std /u*,60
2 at the pointsn,z*d=s−12.6,−7.8d scmd.
055102-12 K. Blanckaert and H. J. de Vriend Phys. Fluids 17, 055102 ~2005!
Downloaded 25 May 2005 to 128.178.27.16. Redistribution subject to AIP license or copyright, see http://pof.aip.org/pof/copyright.jsp
with the strong cross-stream motion as the main complicat-ing factor, the flow field seems to be stratified in the plane ofcurvature. This is most obvious from the square root of thefourth-order turbulent moments,Îsv j8vk8d
2, shown in Figs.7sad–7sfd normalized byu*,60
2 .With the exception of thesn,nd component, all compo-
nentsÎsv j8vk8d2 are rather uniformly distributed over the wa-
ter column and decrease rather strongly in the outward direc-tion, in compliance with the reduced turbulence activitytowards the outer bank. These higher-order turbulence char-acteristics suggest that the analogy between buoyancy strati-fication and curvature stratification also holds in complexthree-dimensional curved flows.
These fourth-order turbulent moments characterize themagnitude of the instantaneous values of the quantitiesv j8stdvk8std. These instantaneous values are at least as impor-tant as their time-averaged valuesv j8vk8, being the turbulentstresses, if it comes to the spreading and mixing of heat anddissolved or suspended matter, sediment transport, and ero-sion of alluvial boundaries. In regions of low turbulent stress,considerable positive and negative instantaneous values canbe reached. This is illustrated for the turbulent shear stressvs8vz8 at sn,z*d=s−12.6,−7.8d cm, in Fig. 7sgd sz* denotes thedistance below the water surfaced.
Demuren and Rodi42 and Ye and McCorquodale43 haveapplied a curvature extension to thek-« model for the simu-lation of flow and pollutant dispersion in open-channelscurved in the horizontal plane. They found that the inclusionof curvature effects can significantly affect the results andadopted a modified version of the curvature extension pro-posed by Leschziner and Rodi33 for two-dimensional shearflows curved in their own plane:
nt = cm
k2
«with cm =
0.09
1 + 0.57k2
«2S ]vs
]n+
vs
rsnD vs
rsn
=0.09
1 + 0.57k2
«2S ]vs
]nD2 2Rf
s2 − Rfd2
.
s13d
Generally speaking, such semiempirical extensions will notbe good enough to correctly represent the turbulence struc-ture in highly three-dimensional flows with a significantcross-stream motion. In order to be useful, they need to bebased on a large amount of experimental data. In the follow-ing, we will investigate to what extent the turbulence struc-ture in our case of three-dimensional curved open-channelflow can be related to the curvature-flux-Richardson number.
C. Experimental observations
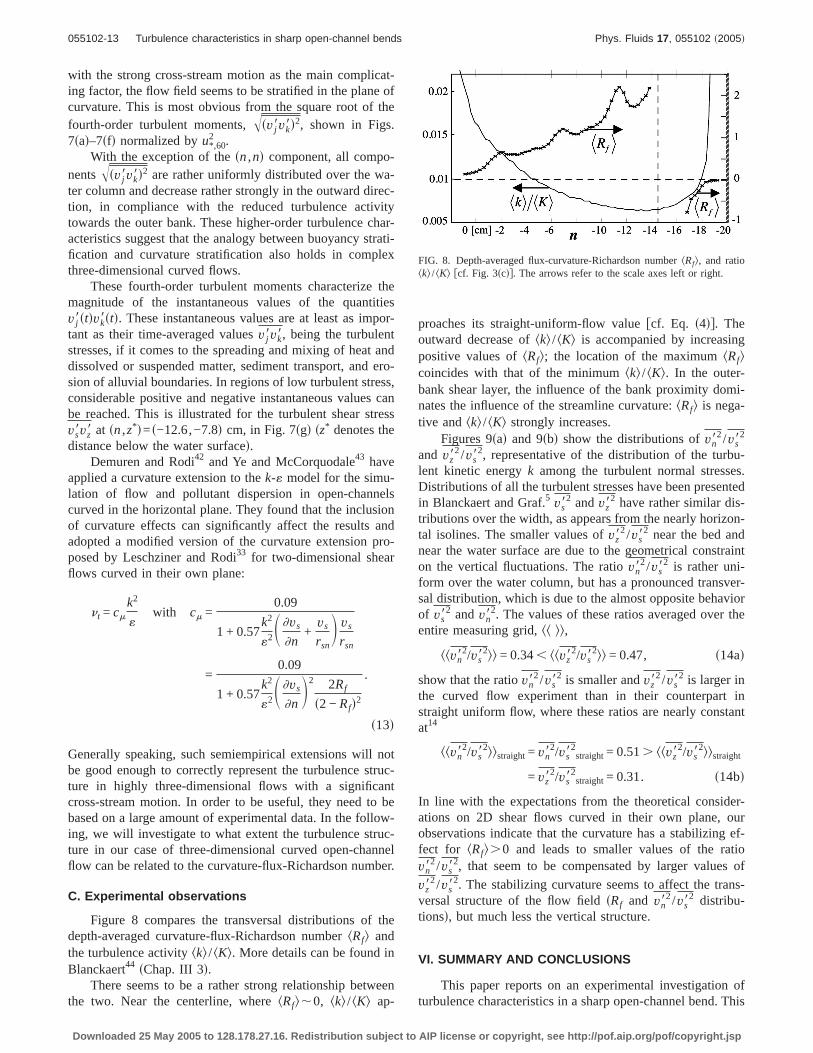
Figure 8 compares the transversal distributions of thedepth-averaged curvature-flux-Richardson numberkRfl andthe turbulence activitykkl / kKl. More details can be found inBlanckaert44 sChap. III 3d.
There seems to be a rather strong relationship betweenthe two. Near the centerline, wherekRfl,0, kkl / kKl ap-
proaches its straight-uniform-flow valuefcf. Eq. s4dg. Theoutward decrease ofkkl / kKl is accompanied by increasingpositive values ofkRfl; the location of the maximumkRflcoincides with that of the minimumkkl / kKl. In the outer-bank shear layer, the influence of the bank proximity domi-nates the influence of the streamline curvature:kRfl is nega-tive andkkl / kKl strongly increases.
Figures 9sad and 9sbd show the distributions ofvn82/vs8
2
and vz82/vs8
2, representative of the distribution of the turbu-lent kinetic energyk among the turbulent normal stresses.Distributions of all the turbulent stresses have been presentedin Blanckaert and Graf.5 vs8
2 andvz82 have rather similar dis-
tributions over the width, as appears from the nearly horizon-tal isolines. The smaller values ofvz8
2/vs82 near the bed and
near the water surface are due to the geometrical constrainton the vertical fluctuations. The ratiovn8
2/vs82 is rather uni-
form over the water column, but has a pronounced transver-sal distribution, which is due to the almost opposite behaviorof vs8
2 andvn82. The values of these ratios averaged over the
entire measuring grid,kk ll,
kkvn82/vs8
2ll = 0.34, kkvz82/vs8
2ll = 0.47, s14ad
show that the ratiovn82/vs8
2 is smaller andvz82/vs8
2 is larger inthe curved flow experiment than in their counterpart instraight uniform flow, where these ratios are nearly constantat14
kkvn82/vs8
2llstraight= vn82/vs8
2straight= 0.51. kkvz8
2/vs82llstraight
= vz82/vs8
2straight= 0.31. s14bd
In line with the expectations from the theoretical consider-ations on 2D shear flows curved in their own plane, ourobservations indicate that the curvature has a stabilizing ef-fect for kRfl.0 and leads to smaller values of the ratiovn8
2/vs82, that seem to be compensated by larger values of
vz82/vs8
2. The stabilizing curvature seems to affect the trans-versal structure of the flow fieldsRf and vn8
2/vs82 distribu-
tionsd, but much less the vertical structure.
VI. SUMMARY AND CONCLUSIONS
This paper reports on an experimental investigation ofturbulence characteristics in a sharp open-channel bend. This
FIG. 8. Depth-averaged flux-curvature-Richardson numberkRfl, and ratiokkl / kKl fcf. Fig. 3scdg. The arrows refer to the scale axes left or right.
055102-13 Turbulence characteristics in sharp open-channel bends Phys. Fluids 17, 055102 ~2005!
Downloaded 25 May 2005 to 128.178.27.16. Redistribution subject to AIP license or copyright, see http://pof.aip.org/pof/copyright.jsp

fills a gap in the availability of turbulence data that has ham-pered the modeling of such flows, so far.
In the outer half of one cross section of a laboratoryopen-channel bend, three-dimensional velocity measure-ments were made with an acoustic Doppler velocity profilersADVPd on a fine grid. This instrument takes simultaneoushigh-resolution measurements of all three velocity compo-nents in a horizontal line coinciding with the instrument’saxis. From these measurements, the mean velocity vectorwas derived, as well as the fluctuating velocity vector, all sixturbulent stress components and all higher-order turbulentvelocity correlations. Typical of the flow in the investigatedcross section are the existence of a bicellular pattern of cross-stream circulation and a significantly reduced turbulence ac-tivity in the outer bend.
The observed distributions of all six turbulent stresscomponents have been reported elsewhere.5 In the presentpaper, distributions of various other turbulence characteris-tics are given, such as the turbulent kinetic energy, the ratiobetween the depth-averaged turbulent kinetic energy and thedepth-averaged mean flow kinetic energy, the turbulence-structure parametera1, the mixing coefficients, the ratios be-tween the turbulent normal stresses, and the square roots ofthe fourth-order turbulent correlations.
An analysis of the mechanisms leading to the reducedturbulence activity in the outer bend was made, via a term-by-term evaluation of the transport equation for the turbulentkinetic energyk on the basis of the measured data. Specialattention was given to the terms representing the productionof turbulent kinetic energy and those representing its advec-tive transport by the cross-stream motion. The rather specu-lative conclusion is that there is a negative feedback betweentransport and production. The advective transport redistrib-utesk over the cross section and thereby modifies the distri-bution of the productionP, hence the turbulence structure,hencek. In the ultimatek distribution the influence of thecross-stream motion has almost vanished and it is mainly the
modifiedP distribution that is responsible for the observedreduction ofk towards the outer bank.
The relationship between the turbulent kinetic energyand its production is complex and characterized by a feed-back mechanism. It is shown to depend mainly on the turbu-lence structure, represented by the structure parametera1 andthe mixing coefficients. The turbulence structure in our ex-periment is found to differ significantly from that in straightuniform flow. Both a1 and the mixing coefficients indicatethat the efficiency of shear stress production for a givenamount of turbulent kinetic energy is less in curved-channelflow than in straight uniform flowsthe Reynolds stress tensoris more diagonally dominantd, and that it decreases towardsthe outer bank. This modified turbulence structure explainsthe observed reduction of turbulence activity in the outerbend.
All departures from the turbulence structure in straightuniform flow are directly or indirectly due to the imposedstreamline curvature. Bradshaw40,41 has established a formalanalogy between streamline curvature and buoyancy in two-dimensional shear layer flows curved in their own plane. Therelevant control parameter is the curvature-flux-RichardsonnumberRf. The turbulence structure in our case of highlythree-dimensional flow, which is curved in the horizontalplane, appears to be related toRf, as well. The departuresfrom straight uniform flow qualitatively agree with whatcould be expected on the basis of this analogy with two-dimensional curved flow: turbulence is reduced forRf .0and the ratiovn8
2/vs82 is decreased. The influence of the
streamline curvature acts primarily in the horizontal andbrings about a kind of transversal stratification in the turbu-lence structure. The latter is further confirmed by the distri-butions of the fourth-order turbulent correlations.
Consequently, it is not sufficient for turbulence closuremodels to incorporate the transport equation for the turbulentkinetic energy: they also have to represent the turbulence
FIG. 9. Ratios of the turbulent normal stresses:sad vn82/vs8
2; sbd vz82/vs8
2.
055102-14 K. Blanckaert and H. J. de Vriend Phys. Fluids 17, 055102 ~2005!
Downloaded 25 May 2005 to 128.178.27.16. Redistribution subject to AIP license or copyright, see http://pof.aip.org/pof/copyright.jsp

structure. Two-equation turbulence models, such as the com-monly usedk-« model, are inherently unable to do so. Semi-empirical extensions to two-equation turbulence closuresbased on the curvature-flux-RichardsonRf number, as pro-posed for two-dimensional curved flows, may be used toimprove the applicability of such closures to three-dimensional curved flows. This requires more experimentaldata, however, with a larger spatial coverage and for a widerrange of hydraulic and geometric conditions.
It should be emphasized that our experimental data origi-nate from a single cross section at 60° from the bend en-trance, under one set of hydraulicsFr,Cd and geometricsR/B, B/Hd conditions. The experimental program is pres-ently extended to more cross sections around the bend and awider range of hydraulic conditions in a larger and less nar-row flume.44
ACKNOWLEDGMENTS
This research was sponsored by the Swiss National Sci-ence Foundation under Grant Nos. 2100-052257.97/1 and2000-059392.99/2. The first author acknowledges his Ph.D.supervisor W. H. Graf, as well as Professor Zech and Profes-sor Booij for their review of the manuscript.
1K. Blanckaert and H. J. de Vriend, “Secondary flow in sharp open-channelbends,” J. Fluid Mech.498, 353 s2004d.
2K. Blanckaert and W. H. Graf, “Momentum transport in sharp open-channel bends,” J. Hydraul. Eng.130, 186 s2004d.
3A. J. Odgaard, “Bank erosion contribution to stream sediment load,” IowaInstitute of Hydraulic Research, Iowa, Report No. 280, 1984.
4W. E. Dietrich, “Mechanics of flow and sediment transport in river bends,”River Channels: Environment and Process, edited by K. RichardssInst.Brit. Geogr. spec., Oxford, 1987d, pp. 179–227.
5K. Blanckaert and W. H. Graf, “Experiments on flow in an open-channelbend. Mean flow and turbulence,” J. Hydraul. Eng.127, 835 s2001d.
6D. Hurther, “3-D acoustic Doppler velocimetry and turbulence in open-channel flow,” Ph.D. thesis Nr 2395, Ecole Polytechnique Fédérale Lau-sanne, Switzerland, 2001.
7T. Rolland, “Développement d’une instrumentation Doppler ultrasonore:application aux écoulements turbulents en hydraulique,” Ph.D. thesis Nr1281, Ecole Polytechnique Fédérale Lausanne, Switzerland, 1994.
8U. Lemmin and T. Rolland, “Acoustic velocity profiler for laboratory andfield studies,” J. Hydraul. Eng.123, 1089s1997d.
9D. Hurther and U. Lemmin, “A constant beamwidth transducer for three-dimensional Doppler profile measurements in open channel flow,” Meas.Sci. Technol.9, 1706s1998d.
10D. Hurther and U. Lemmin, “A correction method for turbulence measure-ments with a 3-D acoustic Doppler velocity profiler,” J. Atmos. Ocean.Technol. 18, 446 s2001d.
11K. Blanckaert and U. Lemmin, “Means of noise reduction in acousticturbulence measurements,” J. Hydraul. Res.sto be publishedd.
12C. de Boor,A Practical Guide to SplinessSpringer, Berlin, 1978d.13K. Blanckaert and H. J. de Vriend, “Non-linear modeling of mean flow
redistribution in curved open channels,” Water Resour. Res.39, 1375s2003d.
14I. Nezu and H. Nakagawa,Turbulence in Open-Channel FlowssIAHR-monograph, Balkema, 1993d, p. 54.
15N. Tamai and T. Ikeya, “Three-dimensional flow over alternating pointbars in a meandering channel,” J. Hydrosci. Hydr. Eng.3, 1 s1985d.
16H. O. Anwar, “Turbulent structure in a river bend,” J. Hydraul. Eng.112,657 s1986d.
17Y. Muto, “Turbulent flow in two-stage meandering channels,” Ph.D. the-sis, Bradford University, Bradford, UK, 1997.
18K. Sudo, M. Sumida, and H. Hibara, “Experimental investigation on tur-bulent flow in a square-sectioned 90-degree bend,” Exp. Fluids30, 246s2001d.
19J. O. Hinze,TurbulencesMcGraw-Hill, New York, 1975d.20G. K. Batchelor,An Introduction to Fluid DynamicssCambridge Univer-
sity Press, Cambridge, 1970d.21H. Tennekes and J. L. Lumley,A First Course in TurbulencesMIT, Cam-
bridge, MA, 1972d.22W. R. Schwarz and P. Bradshaw, “Turbulence structural changes for a
three-dimensional turbulent boundary layer in a 30° bend,” J. Fluid Mech.272, 183 s1994d.
23J. Piquet,Turbulent Flows: Models and PhysicssSpringer, Berlin, 1999d.24I. Nezu, H. Nakagawa, and A. Tominaga, “Secondary currents in a straight
channel flow and the relation to its aspect ratio,”Turbulent Shear Flows 4,edited by L. J. S. Bradburyet al. sSpringer, Berlin, 1985d, pp. 246–260.
25J. C. Rutherford,River Mixing sWiley, Chichester, UK, 1994d, p. 33.26R. Booij and J. Tukker, “3-dimensional laser-Doppler measurements in a
curved flume,”Developments in Laser Techniques and Applications toFluid MechanicssSpringer, Berlin, 1996d, pp. 98–114.
27K. Shiono and Y. Muto, “Complex flow mechanisms in compound mean-dering channels with overbank flow,” J. Fluid Mech.376, 221 s1998d.
28R. Booij, “Measurements and large eddy simulations of the flows in somecurved flumes,” J. Turbul.4, 1 s2003d.
29W. H. Graf and M. Altinakar,Fluvial HydraulicssWiley, Chichester, UK,1998d.
30K. Blanckaert and H. J. de Vriend, “Turbulence structure in sharp open-channel bends,” J. Fluid Mech.sto be publishedd.
31H. P. A. H. Irwin and P. A. Smith, “Prediction of the effect of streamlinecurvature on turbulence,” Phys. Fluids18, 624 s1975d.
32M. M. Gibson and W. Rodi, “A Reynolds-stress closure model of turbu-lence applied to the calculation of a highly curved mixing layer,” J. FluidMech. 103, 161 s1981d.
33M. A. Leschziner and W. Rodi, “Calculation of annular and twin paralleljets using various discretization schemes and turbulence-model varia-tions,” ASME Trans. J. Fluids Eng.103, 352 s1981d.
34W. Rodi and G. Scheuerer, “Calculation of curved shear layers with two-equation turbulence models,” Phys. Fluids26, 1422s1983d.
35G. C. Cheng and S. Farokhi, “On turbulent flows dominated by curvatureeffects,” ASME Trans. J. Fluids Eng.114, 52 s1992d.
36A. G. L. Holloway and S. Tavoularis, “Geometric explanation of the ef-fects of mild streamline curvature on the turbulence anisotropy,” Phys.Fluids 10, 1733s1998d.
37R. M. C. So and G. L. Mellor, “Experiment on convex curvature effects inturbulent boundary layers,” J. Fluid Mech.60, 43 s1973d.
38A. G. L. Holloway and S. Tavoularis, “The effects of curvature on shearedturbulence,” J. Fluid Mech.237, 569 s1992d.
39B. Chebbi, A. G. L. Holloway, and S. Tavoularis, “The response ofsheared turbulence to changes in curvature,” J. Fluid Mech.358, 223s1998d.
40P. Bradshaw, “The analogy between streamline curvature and buoyancy inturbulent shear flow,” J. Fluid Mech.36, 177 s1969d.
41P. Bradshaw, “Effects of streamline curvature on turbulent flow,”AGARDograph 169s1973d.
42A. O. Demuren and W. Rodi, “Calculation of flow and pollutant dispersionin meandering channels,” J. Fluid Mech.172, 63 s1986d.
43J. Ye and J. A. McCorquodale, “Simulation of curved open channel flowby 3D hydrodynamic model,” J. Hydraul. Eng.124, 687 s1998d.
44K. Blanckaert, “Flow and turbulence in sharp open-channel bends,” Ph.D.thesis, Nr 2545, Ecole Polytechnique Fédérale Lausanne, Switzerlandsavailable on ftp://lrhmac15.epfl.ch/Pub/Thesis/Blanckaert/PhDd s2002d.
055102-15 Turbulence characteristics in sharp open-channel bends Phys. Fluids 17, 055102 ~2005!
Downloaded 25 May 2005 to 128.178.27.16. Redistribution subject to AIP license or copyright, see http://pof.aip.org/pof/copyright.jsp