tuning the flexibility in mofs by sbu functionalization
TRANSCRIPT
DaltonTransactions
PAPER
Cite this: Dalton Trans., 2016, 45,4407
Received 8th September 2015,Accepted 3rd February 2016
DOI: 10.1039/c5dt03504j
www.rsc.org/dalton
Tuning the flexibility in MOFs by SBUfunctionalization†
Volodymyr Bon,a Negar Kavoosi,a Irena Senkovska,a Philipp Müller,a Jana Schaber,b
Dirk Wallacher,c Daniel M. Többens,d Uwe Muellere and Stefan Kaskel*a
A new approach for the fine tuning of flexibility in MOFs, involving functionalization of the secondary
building unit, is presented. The “gate pressure” MOF [Zn3(bpydc)2(HCOO)2] was used as a model material
and SBU functionalization was performed by using monocarboxylic acids such as acetic, benzoic or cin-
namic acids instead of formic acid in the synthesis. The resulting materials are isomorphous to
[Zn3(bpydc)2(HCOO)2] in the “as made” form, but show different structural dynamics during the guest
removal. The activated materials have entirely different properties in the nitrogen physisorption experi-
ments clearly showing the tunability of the gate pressure, at which the structural transformation occurs,
by using monocarboxylic acids with varying backbone structure in the synthesis. Thus, increasing the
number of carbon atoms in the backbone leads to the decreasing gate pressure required to initiate the
structural transition. Moreover, in situ adsorption/PXRD data suggest differences in the mechanism of the
structural transformations: from “gate opening” in the case of formic acid to “breathing” if benzoic acid is
used.
Introduction
Flexible Metal–Organic Frameworks (MOFs) or so called SoftPorous Crystals are a unique class of materials capable toswitch between the porous and dense (or less porous) states asa response to external stimuli such as temperature, pressure,electromagnetic irradiation or adsorption of guestmolecules.1–3 The existence of two different states withdifferent physical and textural properties gives rise to a widepotential application field of such materials. For example,NH2-MIL-53(Al) is able to transform between the narrow andlarge pore phases and therefore could be used as an opticalswitch.4 Sensor technology is also one of the prospective appli-cation fields for switchable MOFs. Thus a Mg based flexible
MOF with the composition [Mg(H2dhtp)(H2O)2]·DMAc,denoted as AEMOF-1·DMAc (AEMOF-1 – alkaline earth MOF-1;H4dhtp – 2,5-dihydroxy-terepthalic acid; DMAc – N,N′-di-methylacetamide) was used as a highly efficient luminescentsensor for the real time detection of water traces in variousorganic solvents.5 The flexibility was also successfully used toachieve the separation of CO and N2, which have very similarphysical properties.6 The selective trapping of NO molecules inthe flexible Ru- and Rh-based coordination polymers couldfind its application in biomedicine.7
All envisioned applications based on the flexibility requirematerials with well-defined switching behavior. However,tuning and designing of flexible MOFs with specific switchingproperties remain very challenging, which limits the appli-cation potential of flexible crystalline materials. The mostoften applied strategies to influence the flexibility in softMOFs8 are: (i) introduction of flexible side chains into theligand;9 (ii) modulation of host–guest interaction strength bylinker functionalization;10 (iii) incorporation of differentmetals into the same framework;11 (iv) adjustment of thecrystal size.12
In this contribution, we present a switchability tuningapproach based on the systematic substitution of monocarbo-xylates in the secondary building unit (SBU) of a “gate pressure”MOF [Zn3(bpydc)2(HCOO)2] (bpydc – 2,2′-bipyridine-5,5′-dicarb-oxylate), also known as JLU-Liu4 (JLU – JiLin University).13
It contains two formic acid anions directly coordinatedto the metal cluster. The solvent assisted exchange of the
†Electronic supplementary information (ESI) available: Temperature dependentPXRD measurement for 1′, TG curves for 1–4 and 2′–4′, FT-IR spectra for 1′–4′,and PXRD patterns for 3′ and 4′. CCDC 1422814–1422821. For ESI and crystallo-graphic data in CIF or other electronic format see DOI: 10.1039/c5dt03504j
aDepartment of Inorganic Chemistry, Technische Universität Dresden, Bergstrasse 66,
D-01062 Dresden, Germany. E-mail: [email protected] of Bioanalytical Chemistry, Technische Universität Dresden, Bergstrasse
66, D-01062 Dresden, GermanycDepartment of Sample Environments, Helmholtz-Zentrum Berlin für Materialien
und Energie, Hahn-Meitner-Platz 1, 14109 Berlin, GermanydDepartment of Crystallography, Helmholtz-Zentrum Berlin für Materialien und
Energie, Hahn-Meitner-Platz 1, 14109 Berlin, GermanyeMX Group, Institute for Soft Matter and Functional Materials, Helmholtz-Zentrum
Berlin für Materialien und Energie, Albert-Einstein-Str. 15, 12489 Berlin, Germany
This journal is © The Royal Society of Chemistry 2016 Dalton Trans., 2016, 45, 4407–4415 | 4407
Ope
n A
cces
s A
rtic
le. P
ublis
hed
on 0
3 Fe
brua
ry 2
016.
Dow
nloa
ded
on 1
1/11
/202
1 5:
16:3
3 PM
. T
his
artic
le is
lice
nsed
und
er a
Cre
ativ
e C
omm
ons
Attr
ibut
ion
3.0
Unp
orte
d L
icen
ce.
View Article OnlineView Journal | View Issue

monocarboxylic ligand was already demonstrated for rigid Zrbased MOFs.14 We could show that utilizing monocarboxylicacids with different backbones in the synthesis (for instanceacetic, benzoic, or cinnamic acid) results in the formation ofisomorphous frameworks, showing completely differentadsorption behavior. Crystal structures of the large pore andnarrow pore phases as well as adsorption behavior of thematerials bearing different monocarboxylic ligands werestudied to enlighten the structural transformations in quest.
ExperimentalMaterials
All chemicals were purchased from commercial sources andused without further purification. N,N-Dimethylformamide(DMF) (anhydrous 99.8%), trans-cinnamic acid (97%), aceto-nitrile (99.8%), and 5,5′-dimethyl-2,2′-dipyridine (98%, dmpby)were purchased from Sigma Aldrich. 2,2′-Bipyridyl-5,5′-dicarb-oxylic acid (H2bpydc) was synthesised according to thereported procedure15 (for more details see the ESI†). Benzoicacid (99.5%) and formic acid (99%) were purchased fromGrüssing GmbH, Zn(NO3)2·4H2O from Merck, acetic acid(100%) from Roth and Company, heptane (99%) and dichloro-methane 99.99% from Fisher, anhydrous toluene from VWR,and 1-propanol 99.5% from TCI.
Synthesis
[Zn3(bpydc)2(HCOO)2] JLU-Liu4 (1). JLU-Liu4 (1) was syn-thesized using a slightly modified procedure. Zn(NO3)2·4H2O(52.2 mg, 0.2 mmol), H2bypdc (20 mg, 0.082 mmol) andformic acid (1 mL, 26.5 mmol) were mixed with 6.5 mL DMFand transferred to the Pyrex© tubes. The mixture was heatedfor 24 h at 120 °C. The resulting white octahedral crystals werefiltered off and washed 3 times with DMF. Filtration was per-formed under argon flow. After that, the solvent wasexchanged with ethanol over a period of 3 days. At the end, thesample was activated for 5 hours at 70 °C under dynamicvacuum. Yield: 32.2 mg (63%). After activation, all sampleswere handled under an argon atmosphere. The PXRD patternsobtained for the “as made” and activated samples confirmedthe phase purity.
[Zn3(bpydc)2(CH3COO)2] (2). A mixture of Zn(NO3)2·4H2O(52.2 mg, 0.2 mmol), H2bypdc (20 mg, 0.082 mmol), and aceticacid (1 mL, 17.5 mmol) with 6.5 mL DMF was added to Pyrex©tubes and heated 24 h at 120 °C. Then crystals were collectedand washed several times first with DMF and then withethanol. Subsequently, they were immersed in dry ethanolfor 3 days. The crystals were filtered off under argon flow andevacuated for 12 h at 70 °C. Yield: 17.26 mg (52.5%).
Elemental analysis (wt%): calc. C 42.89, N 6.98, H 2.74;found C 41.13, N 7.26, H 1.03.
[Zn3(bpydc)2(C6H5COO)2] (3). Zn(NO3)2·4H2O (52.2 mg,0.2 mmol), H2bypdc (20 mg, 0.082 mmol), and benzoic acid(1.4 g, 11.5 mmol) were dissolved in 6.5 mL DMF. The mixturewas placed into the Pyrex© tubes and heated at 120 °C for
48 h. Washing and activation procedures were the same asdescribed for compound 2. Yield: 16 mg (42.65%).
Elemental analysis (wt%): calc. C 49.23, N 6.04, H 2.8;found C 48.18, N 6.16, H 1.27.
[Zn3(bpydc)2(C6H5CHCHCOO)2] (4). A mixture of Zn(NO3)2·4H2O (52.2 mg, 0.2 mmol), H2bypdc (20 mg, 0.082 mmol), andcinnamic acid (1.25 g, 8.4 mmol) with 6.5 mL DMF was placedinto the Pyrex© tubes and heated at 80 °C for 72 h. Washingand activation procedures were the same as described forcompound 2. Yield: 21 mg (53%).
Elemental analysis (wt%): calc. C 51.52, N 5.72, H 3.06;found C 49.77, N 5.87, H 1.96.
Single crystal X-ray diffraction
The crystal structure of compounds 1–4 were determined bysingle crystal X-ray diffraction. All single crystals were preparedin glass capillaries with some amount of solvent. The capil-laries were sealed with melted wax. The datasets were collectedat the BESSY MX BL14.2 beamline of Helmholtz-ZentrumBerlin für Materialien und Energie (HZB).16 All diffractionexperiments were performed at room temperature using radi-ation with an energy of 14 keV (λ = 0.88561 Å). The ϕ-scanswith an oscillation range of 1° were used for data collection.The datasets were processed using CCP4 software.17 Thecrystal structures were solved by direct methods and refined byfull matrix least-squares on F2 using the SHELXTL programpackage.18 All non-hydrogen atoms were refined in anisotropicapproximation. Hydrogen atoms were refined in the geometri-cally calculated positions using the “riding model” withUiso(H) = 1.2Uiso(C) for sp, sp2 hybridized carbon atoms andwith Uiso(H) = 1.5Uiso(C) for sp
3 hybridized carbon atoms. Theatoms of the phenyl rings of the benzoate (compound 3) andcinnamate (compound 4) anions are disordered and weretreated using the AFIX 66 instruction. In the case of compound4, SIMU and DELU instructions have been used to restrain thethermal parameters of disordered fragments. Because of thehigh symmetry of the crystal system it was not possible to loca-lize the lattice solvent molecules in the pores. Therefore, theSQUEEZE procedure was used to correct reflection intensities,corresponding to disordered solvent molecules.19 CCDC1422814, 1422816, 1422818 and 1422820 contain the sup-plementary crystallographic data for compounds 1, 2, 3, and 4,respectively. The extended crystallographic data for the struc-tures 1–4 are given in Table S1 of the ESI.†
Crystal data for [Zn3(bpydc)2(HCOO)2] (1). C26H14N4O12Zn3,M = 770.52 g mol−1, tetragonal, P43212 (no. 96), a = 15.320(2)Å, c = 23.240(5) Å, V = 5454.5(18) Å3, Z = 4, ρcalc = 0.938 g cm−3,λ = 0.88561 Å, T = 298 K, θmax = 32.1°, reflections collected/unique 12 822/5847, Rint = 0.0194, R1 = 0.0287, wR2 = 0.0852,S = 1.089, largest diff. peak 0.569 e Å−3 and hole −0.543 e Å−3.
Crystal data for [Zn3(bpydc)2(CH3COO)2] (2). C28H18N4O12Zn3,M = 798.57 g mol−1, tetragonal, P43212 (no. 96), a = 15.300(2)Å, c = 23.280(5) Å, V = 5449.6(18) Å3, Z = 4, ρcalc = 0.973 g cm−3,λ = 0.88561 Å, T = 298 K, θmax = 32.1°, reflections collected/unique 19 800/6337, Rint = 0.0275, R1 = 0.0313, wR2 = 0.0960,S = 1.099, largest diff. peak 0.629 e Å−3 and hole −0.532 e Å−3.
Paper Dalton Transactions
4408 | Dalton Trans., 2016, 45, 4407–4415 This journal is © The Royal Society of Chemistry 2016
Ope
n A
cces
s A
rtic
le. P
ublis
hed
on 0
3 Fe
brua
ry 2
016.
Dow
nloa
ded
on 1
1/11
/202
1 5:
16:3
3 PM
. T
his
artic
le is
lice
nsed
und
er a
Cre
ativ
e C
omm
ons
Attr
ibut
ion
3.0
Unp
orte
d L
icen
ce.
View Article Online

Crystal data for [Zn3(bpydc)2(C6H5COO)2] (3).C38H22N4O12Zn3, M = 922.70 g mol−1, tetragonal, P43212 (no.96), a = 15.160(2) Å, c = 23.030(5) Å, V = 5292.9(18) Å3, Z = 4,ρcalc = 1.158 g cm−3, λ = 0.88561 Å, T = 298 K, θmax = 32.1°,reflections collected/unique 40 507/6196, Rint = 0.0556, R1 =0.0515, wR2 = 0.1546, S = 1.079, largest diff. peak 0.656 e Å−3
and hole −0.764 e Å−3.Crystal data for [Zn3(bpydc)2(C6H5CHvCHCOO)2] (4).
C42H26N4O12Zn3, M = 974.78 g mol−1, tetragonal, P43212 (no.96), a = 15.270(2) Å, c = 23.050(5) Å, V = 5374.6(18) Å3, Z = 4,ρcalc = 1.205 g cm−3, λ = 0.88561 Å, T = 298 K, θmax = 32.1°,reflections collected/unique 20 740/6207, Rint = 0.0556, R1 =0.0377, wR2 = 0.1195, S = 1.123, largest diff. peak 0.500 e Å−3
and hole −0.756 e Å−3.
Crystal structures of 1′–4′ determined from PXRD
The crystal structures for narrow pore phases were solved fromthe PXRD patterns that were recorded at room temperature onthe evacuated samples. Data for 1′, 3′, and 4′ were collected atthe BESSY KMC-2 beamline of HZB in transmission geometryusing 2 scans in the range of 5 to 50°. Data for 2′ were col-lected on STOE Stadi P. The patterns were indexed using theX-Cell program implemented in Material Studio 5.0 software.20
The most intensive reflections in the 2θ range between 2 and20° were used for indexing. The C2221 space group was chosenfor 1′, 2′, and 4′ considering the group–subgroup relationshipsand extinction rules. The starting models for the crystal struc-ture refinement were derived from the “as made” 1, 2, and 4structures, which were converted into the corresponding spacegroup. After adapting the unit cell parameters to thoseobtained during indexing, the structural models were opti-mized using a geometry optimization tool with implemen-tation of a universal force field. Due to the low data/parameterratio, the rigid-body Rietveld refinement with energy optionswas used to refine the structures.
The crystallographically independent Zn atoms, carboxylategroups, and phenyl rings were treated as rigid bodies.
In the case of compound 2′, the minor impurity of openphase 2 is present after activation. Therefore, reflections at7.0° and 11.6° 2θ, which belong to the open phase 2 (Fig. 3),were excluded from the Rietveld refinement.
The final Rietveld plots are given in Fig. 1. CCDC 1422815,1422817, 1422819 and 1422821 contain the supplementarycrystallographic data for compounds 1′, 2′, 3′, and 4′,respectively.
Refinement data for Zn3(bpydc)2(HCOO)2 (1′).C26H14N4O12Zn3, Fw = 770.58, orthorhombic, C2221 (no. 20),a = 27.821(1) Å, b = 10.184(1) Å, c = 21.626(1) Å, V = 6127.4(3)Å3, Z = 8, 12 refined motion groups, 56 refined DOF, Rwp =15.68%, Rp = 12.20%.
Refinement data for Zn3(bpydc)2(CH3COO)2 (2′).C28H18N4O12Zn3, Fw = 798.63, orthorhombic, C2221 (no. 20),a = 27.715(1) Å, b = 10.575(1) Å, c = 21.691(1) Å, V = 6245.4(3)Å3, Z = 8, 14 refined motion groups, 68 refined DOF, excludedregions 6.60–7.30, 11.50–11.77, Rwp = 7.60%, Rp = 5.83%.
Fig. 1 Rietveld plots for compounds 1’ (a), 2’ (b), 3’ (c), and 4’ (d).
Dalton Transactions Paper
This journal is © The Royal Society of Chemistry 2016 Dalton Trans., 2016, 45, 4407–4415 | 4409
Ope
n A
cces
s A
rtic
le. P
ublis
hed
on 0
3 Fe
brua
ry 2
016.
Dow
nloa
ded
on 1
1/11
/202
1 5:
16:3
3 PM
. T
his
artic
le is
lice
nsed
und
er a
Cre
ativ
e C
omm
ons
Attr
ibut
ion
3.0
Unp
orte
d L
icen
ce.
View Article Online
Refinement data for Zn3(bpydc)2(C6H5COO)2 (3′).C38H22N4O12Zn3, Fw = 922.77, tetragonal, P43212 (no. 96), a =15.019(1) Å, c = 21.905(2) Å, V = 4941.4(3) Å3, Z = 4, 6 refinedmotion groups, 28 refined DOF, Rwp = 17.99%, Rp = 12.10%.
Refinement data for Zn3(bpydc)2(C6H5CHCHCOO)2 (4′).C42H26N4O12Zn3, Fw = 974.84, orthorhombic, C2221 (no. 20),a = 17.313 (1) Å, b = 24.594(1) Å, c = 22.139(2) Å, V = 9426.6(3)Å3, Z = 8, 18 refined motion groups, 92 refined DOF, Rwp =11.65%, Rp = 8.98%.
In situ monitoring of nitrogen adsorption (77 K) by powderX-ray diffraction
Concerted adsorption of N2 and X-ray powder diffractionexperiments on compounds 3 and 4 were performed at theKMC-2 beamline of HZB using specially designed instrumenta-tion.21 All adsorption experiments were performed at 77 K inthe relative pressure range between 10−3 and 1 (p0 = 101.3 kPa).All diffraction measurements were performed in the 2θ rangefrom 2 to 50° using monochromatic synchrotron radiation (8048eV; λ = 1.5406 Å). The diffraction images from the VÅNTEC-20002D detector were integrated using Datasqueeze 2.2.9 software.22
Hexagonal boron nitride was used as an external standard.
Physical measurements
Thermogravimetric analyses were carried out under air usingSTA 409 PC from the NETZSCH Company. Mass analysis wasperformed using Aëolos QMS 403 from the NETZSCHCompany. The heating rate was set to 5 K min−1. FT-IR spectrawere measured on a VERTEX-70 spectrophotometer (Bruker)using the DRIFT technique. Nitrogen adsorption measure-ments up to 100 kPa at 77 K were performed on approximately35 mg of sample using BELSORP-max apparatus. The nitrogenwith the purity of 99.999% was used for the experiments.Powder X-ray diffraction patterns were obtained on a STADI P(Stoe) diffractometer at RT using monochromatic Cu–Kα1 radi-ation (λ = 1.5406 Å) (step size: 0.05, exposure time: 23 s perpoint). All measurements were performed in transmission geo-metry. The samples were prepared in the Ar-filled glovebox.Temperature dependent PXRD measurements were performedon an X’Pert Pro diffractometer (PANalytical) in reflection geo-metry using θ/2θ scans and a MRI (Material Research Instru-ments) sample stage. The PXRD patterns were obtained underdynamic vacuum every 25 °C in the temperature rangebetween 25 and 450 °C. The heating rate was set to 3 K min−1.
Results and discussion
JLU-Liu4 developed by Liu and co-workers consists of tri-nuclear Zn(II) units coordinated by four carboxylic groups, two2,2′-bipyridine units, and two formate anions. The structurecomprises of a 3D framework (ant topology) and displays chan-nels 4.9 × 5.1 Å in dimensions.13 The 3D framework ofJLU-Liu4 undergoes structural transformation upon removal ofguest molecules from the pores to give a MOF with gateopening behavior. This is indicated by shifting and intensity
changing of the peaks in the PXRD pattern. However, the struc-ture of the desolvated compound has not yet been reported.
To study the influence of the monocarboxylic ligand natureon the structure formation of JLU-Liu4 (1), acetic (HAc),benzoic (HBz), or cinnamic (HCn) acid was used in the syn-thesis instead of the originally reported formic acid.
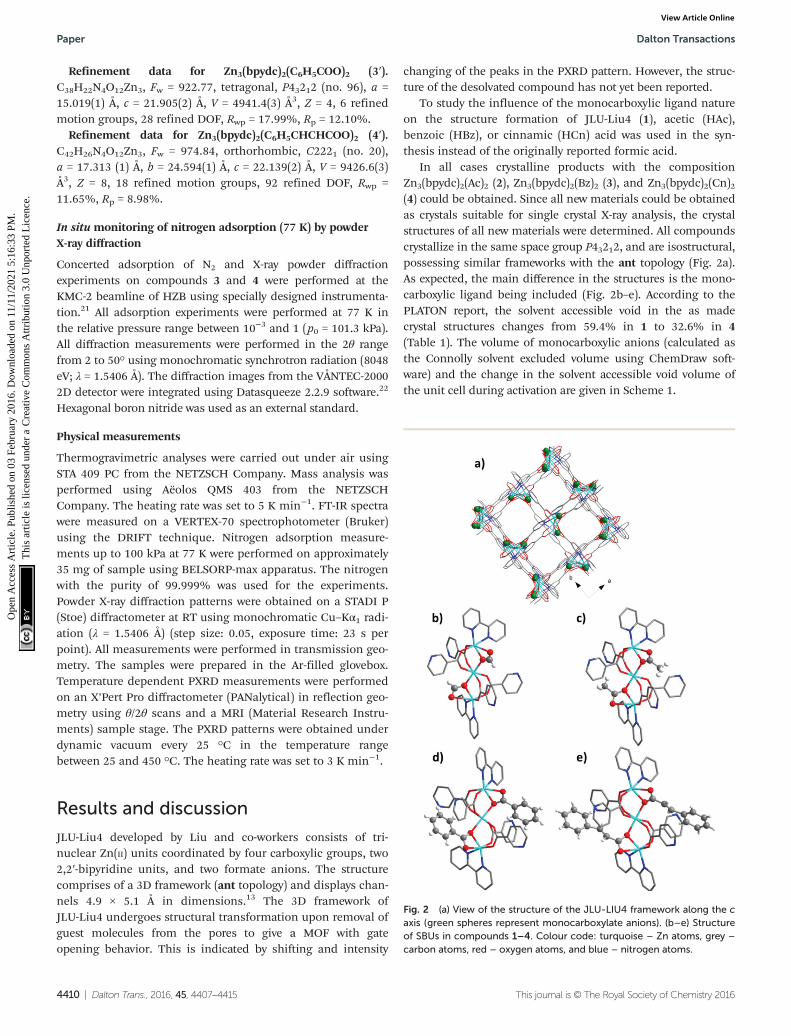
In all cases crystalline products with the compositionZn3(bpydc)2(Ac)2 (2), Zn3(bpydc)2(Bz)2 (3), and Zn3(bpydc)2(Cn)2(4) could be obtained. Since all new materials could be obtainedas crystals suitable for single crystal X-ray analysis, the crystalstructures of all new materials were determined. All compoundscrystallize in the same space group P43212, and are isostructural,possessing similar frameworks with the ant topology (Fig. 2a).As expected, the main difference in the structures is the mono-carboxylic ligand being included (Fig. 2b–e). According to thePLATON report, the solvent accessible void in the as madecrystal structures changes from 59.4% in 1 to 32.6% in 4(Table 1). The volume of monocarboxylic anions (calculated asthe Connolly solvent excluded volume using ChemDraw soft-ware) and the change in the solvent accessible void volume ofthe unit cell during activation are given in Scheme 1.
Fig. 2 (a) View of the structure of the JLU-LIU4 framework along the caxis (green spheres represent monocarboxylate anions). (b–e) Structureof SBUs in compounds 1–4. Colour code: turquoise – Zn atoms, grey –
carbon atoms, red – oxygen atoms, and blue – nitrogen atoms.
Paper Dalton Transactions
4410 | Dalton Trans., 2016, 45, 4407–4415 This journal is © The Royal Society of Chemistry 2016
Ope
n A
cces
s A
rtic
le. P
ublis
hed
on 0
3 Fe
brua
ry 2
016.
Dow
nloa
ded
on 1
1/11
/202
1 5:
16:3
3 PM
. T
his
artic
le is
lice
nsed
und
er a
Cre
ativ
e C
omm
ons
Attr
ibut
ion
3.0
Unp
orte
d L
icen
ce.
View Article Online

After removal of the solvent molecules, crystallographictransformation takes place in all compounds, according to thechanges in the PXRD patterns (Fig. 3). The patterns of all acti-vated compounds (further referred to as 1′, 2′, 3′, and 4′,respectively) were successfully indexed and the crystal struc-tures were solved using molecular simulations combined withthe Rietveld refinement.
Activated phases 1′ and 2′ have very similar structures: bothcrystallize in the C2221 space group with similar unit cell para-meters (due to this similarity, only the structure of 1′ is describedin detail below). The C2221 space group is a sub-group of theP43212 (the space group of the parent compounds 1 and 2).
Due to the rigidity of the linker, the main contribution tothe structural transformation comes from the cluster distor-tion. The reduction of the symmetry creates two independentSBUs (SBU 1 and SBU 2) in 1′ showing differences in distortionwith respect to the linearity of the Zn3 array and coordinationenvironment of the ligand molecules. In SBU 1, the anglebetween three Zn atoms decreases from 178.65(1)° in 1 to
160.48(1)° in 1′. The angle between the planes involving two2,2′-bipyridine moieties coordinated to the same cluster changesfrom 80.31(5)° in 1 to 57.53(5)° in 1′ (Fig. 4a and b). A significantcontribution to the structural contraction originates from thebending of carboxylate hinges (dihedral angles between the planeof the carboxylate group and the O–Zn–Zn–O plane). Thesechange from 5.75(3)° and 6.07(3)° in 1 to 19.42(3)° and 20.63(3)°in 1′. This is also often the source of flexibility and structural tran-sitions in other switchable MOFs.23,24 The Zn atoms in SBU 2 arearranged in a nearly linear fashion with a Zn⋯Zn⋯Zn angle of176.67(1)°. The formate anions, which are coordinated on theopposite sides of SBU in 1 (Fig. 4a and b) change the position inSBU 1 of 1′ and move to the same side of the cluster (Fig. 4b).
Table 1 Calculated textural properties of the investigated compounds
Compound
Solvent accessiblevoid volumeof unit cell/%
Calculatedpore volume(Vp)/cm
3 g−1
Calculatedgeometricalsurface area/m2 g−1
1 59.4 0.70 24251′ 17.6 0.09 762 55.7 0.63 21422′ 15.8 0.09 663 40.5 0.36 10473′ 36.7 0.30 6904 32.6 0.30 7474′ 24.8 0.17 188
Fig. 4 (a) SBU 1 of 1; (b) SBU 1 and SBU 2 of 1’; (c) crystal structure of 1;(d) crystal structure of 1’. (Colour code in (c) and (d): blue spheres – SBUunits, and red spheres – bpydc2− linkers).
Scheme 1 Schematic representation of the monocarboxylic ligandinfluence on the activation of the LiU-4 series. The volume ofmonocarboxylic anions was calculated as the Connolly solvent excludedvolume using ChemDraw software. The specified volume represents thesolvent accessible volume of the unit cell for Z = 4.
Fig. 3 PXRD patterns for compounds 1–4 and 1’–4’.
Dalton Transactions Paper
This journal is © The Royal Society of Chemistry 2016 Dalton Trans., 2016, 45, 4407–4415 | 4411
Ope
n A
cces
s A
rtic
le. P
ublis
hed
on 0
3 Fe
brua
ry 2
016.
Dow
nloa
ded
on 1
1/11
/202
1 5:
16:3
3 PM
. T
his
artic
le is
lice
nsed
und
er a
Cre
ativ
e C
omm
ons
Attr
ibut
ion
3.0
Unp
orte
d L
icen
ce.
View Article Online

On the framework level, the structural contraction in 1occurs along the [110] direction (Fig. 4c), corresponding to the[010] direction in 1′ (Fig. 4d).
The textural properties of 1′ calculated using Poreblazer3.0.2 software25 show that the compound has nearly no acces-sible pore volume (0.09 cm3 g−1) as well as a very small porelimiting diameter of 2.11 Å. This completely supports theexperimental results, since 1′ shows no uptake of nitrogen upto reaching the “gate opening pressure” of 0.47.
The crystal structure of compound 3′ was refined in thesame space group as the structure of 3 (Fig. 1) with differentlattice cell constants. Obviously, compound 3 cannot undergocomplete transformation because of the bulky phenyl rings ofthe benzoate. They hinder the cluster transformation as itoccurs in 1. Namely, two coordinated benzoate anions, locatedon the opposite sides of the Zn cluster in 3 cannot regroup inthe same way as in 1, and are located on the same side of theSBU plane, because of the small aperture between the ligandmolecules, coordinated to the cluster.
The comparison of the calculated pore volumes for 3 and 3′shows only minor changes from 0.36 cm3 g−1 to 0.30 cm3 g−1.
The thermal stability of the investigated materials wasstudied by temperature dependent PXRD and thermo-gravimetric (TG) analysis (Fig. S2–S8 ESI†). Investigation of 1′by thermo-XRD under an argon atmosphere confirms theretention of crystallinity up to 300 °C (see ESI, Fig. S1†) con-firming the TG data reported earlier.13 According to the TGanalysis data, materials 2′, 3′, and 4′ are stable up to 300 °C,330 °C, and 320 °C, respectively (see ESI, Fig. S6–S8†). There-fore, the samples were activated at 150 °C in a vacuum prior tothe adsorption experiments.
Compound 1′ shows classical gate pressure behaviourduring physisorption of nitrogen at 77 K, with almost nouptake up to p/p0 = 0.47. The total pore volume calculated atp/p0 = 0.95 amounts to 0.55 cm3 g−1 which is slightly lowerthan the theoretical value (Table 1). As expected, the nitrogenadsorption isotherm of 2′ shows a slightly different trend,reaching the plateau after adsorbing nearly 25 cm3 g−1 nitro-gen at very low relative pressures. After reaching p/p0 = 0.3, avery steep increase in uptake takes place. The isotherm reachesa second plateau at p/p0 = 0.95. The adsorbed amount in satur-ation is 295 cm3 g−1 that corresponds to the pore volume of0.456 cm3 g−1. Materials 3′ and 4′ show completely differentbehaviour during the adsorption of the nitrogen at 77 K(Fig. 5). Thus, compound 3′ adsorbs nearly 100 cm3 g−1 ofnitrogen already at p/p0 = 10−4 confirming the incompletenessof the crystal structure closing (narrow pore state) of 3′ dis-cussed above. The second step in the isotherm, most likelyconnected to the structural transformation, occurs in the rela-tive pressure range between 0.03 and 0.07. After that thecourse of the isotherm is characterized by the continuousincrease of the uptake reaching 227 cm3 g−1 at p/p0 = 0.97.
Implementation of the larger cinnamate anion intoJLU-Liu4 has further influence on the adsorption properties ofthe solid. As in the case of 3′, the hysteresis related to theguest induced structural changes is shifted to a lower pressure
range, and is located between p/p0 = 5 × 10⁻³ and p/p0 =5 × 10⁻². The isotherm reaches saturation at p/p0 = 0.95showing the nitrogen uptake of 203 cm3 g−1.
While the structural transformations during the adsorptionof nitrogen on 1′ and 2′ are supposed to be one step “gateopening” (Scheme 2), the adsorption behaviour of 3′ and 4′ wasstudied by parallelized adsorption and PXRD experiments. ThePXRD patterns recorded on the evacuated material 3′ and at thefirst adsorption point (Fig. 6, PXRD no. 1) show the presence ofa narrow pore phase. Surprisingly, further five PXRD patterns,recorded in the relative pressure range from 5 × 10⁻⁴ up to10−1, show a shift of the main (101) reflection from 2θ = 7.19°to 7.44°, indicating the formation of an intermediate phase(ip) and contraction of the unit cell (Fig. 4, PXRD patterns no.2–6). Unfortunately, the patterns could not be indexed un-ambiguously because of the presence of the reflections ofmore than one phase. Further increase of the gas pressureleads to the gradual shift of the (101) reflection back to lowerangles, but the initial position is not completely reached(Fig. 4, PXRDs no. 2 and 7). The PXRD patterns, obtained in
Fig. 5 Nitrogen physisorption isotherms for compounds 1’–4’ at 77 K:(a) linear representation of the isotherms; (b) isotherms of compounds 3’and 4’ on a semilogarithmic scale. Black circles – 1’, blue triangles – 2’,red squares – 3’, and green diamonds – 4’. Close symbols – adsorption,and open symbols – desorption.
Paper Dalton Transactions
4412 | Dalton Trans., 2016, 45, 4407–4415 This journal is © The Royal Society of Chemistry 2016
Ope
n A
cces
s A
rtic
le. P
ublis
hed
on 0
3 Fe
brua
ry 2
016.
Dow
nloa
ded
on 1
1/11
/202
1 5:
16:3
3 PM
. T
his
artic
le is
lice
nsed
und
er a
Cre
ativ
e C
omm
ons
Attr
ibut
ion
3.0
Unp
orte
d L
icen
ce.
View Article Online

the p/p0 range of 0.1 to 1 are characterized by the intensityincrease of the reflection at 2θ = 6.98° characteristic for the asmade phase 3. Although the PXRD patterns from 2 to 6 couldnot be indexed, the shape of the isotherm as well as the reflec-tion shift suggest that the transition is similar to the breathingphenomena, observed in MIL-53(Cr) and MIL-53(Al)materials.26 Desorption of nitrogen proceeds without phasetransitions showing the presence of a mixture of compounds
3′ and 3 up to low pressures. Only evacuation of the sampleafter the experiment at room temperature leads to structuraltransformation to the initial narrow pore state.
Nitrogen physisorption at 77 K combined with PXRDanalysis of 4′ (Fig. 7) reveals a completely different structuraltransformation induced by the cinnamate anion (Scheme 2).The PXRD pattern of completely evacuated 4′ shows a reflectionat 2θ = 7.50° matching the intermediate phase, obtained duringthe adsorption of nitrogen on 3′. Indeed, the direct comparisonof the above mentioned PXRD patterns shows good match(Fig. S11, ESI†). The indexing of the PXRD patterns obtainedfrom evacuated 4′ gives several possible unit cells, one of whichis an orthorhombic C-centered unit cell. Taking into accountthat 1′ crystallizes in the same crystal system, this unit cell wasused for the Rietveld refinement. The pore volume calculatedfrom the final structural model matches with the value estimatedfrom the adsorption isotherm of the compound.
Although the adsorption isotherms of 3′ and 4′ are similarto some extent, in situ adsorption/PXRD experiments suggest adistinct pathway for the structural evolution in 4′. In the caseof 4′, the most intense reflection shifts towards lower 2θ angleswith increasing pressure, probably indicating the stepwiseopening of the crystal structure. The phase 4′ exists up tothe relative pressure of 0.013. Further adsorption of nitrogenleads to phase transition, accompanied by the shift of themost intense reflection from 7.50° to 7.29° 2θ. Unfortunately,the pure intermediate phase could not be obtained and
Fig. 6 Adsorption of N2 at 77 K on 3’ monitored in situ by PXRD.
Fig. 7 Adsorption of N2 at 77 K on 4’ monitored in situ by PXRD.
Scheme 2 Mechanisms of structural transformation during the adsorp-tion of N2 at 77 K for 1–4.
Dalton Transactions Paper
This journal is © The Royal Society of Chemistry 2016 Dalton Trans., 2016, 45, 4407–4415 | 4413
Ope
n A
cces
s A
rtic
le. P
ublis
hed
on 0
3 Fe
brua
ry 2
016.
Dow
nloa
ded
on 1
1/11
/202
1 5:
16:3
3 PM
. T
his
artic
le is
lice
nsed
und
er a
Cre
ativ
e C
omm
ons
Attr
ibut
ion
3.0
Unp
orte
d L
icen
ce.
View Article Online
therefore the PXRD patterns could not be indexed unambigu-ously. In the relative pressure range between 0.2 and 1 duringthe adsorption and desorption almost pure phase 4 is pre-sented. Only at relative pressures lower than 10−2, the revers-ible transformation from 4 to the intermediate phase isobserved.
Conclusions
In summary, the fine tuning of the gate pressure and switch-ability in JLU-Liu-4 was possible by modification of the SBU.Compounds containing coordinated formate, acetate, benzoateor cinnamate anions on the cluster have the same frameworkswith the ant topology, but show variations in structural trans-formation during the adsorption of nitrogen at 77 K. While theutilisation of small carboxylic acids during the synthesis (com-pounds 1 and 2) results in complete closing of the frameworkafter solvent removal and therefore “gate opening” behaviourduring the adsorption, bulkier carboxylates lead to incompleteclosing of the frameworks after desolvation. Compounds con-taining benzoate (3′) and cinnamate (4′) anions show nearlythe same adsorption behaviour but undergo completelydifferent structural transformation during the adsorption.While the structural changes during adsorption on 3′ could berather described as classical breathing,27 the changes in 4′lead to the step-wise increase of the unit cell volume. Webelieve that this approach can be further generalized andapplied for other flexible MOFs with coordination vacancieson the metal cluster (typically Zn3 and Co3 clusters) in order toobtain materials with targeted adsorption properties.
Acknowledgements
N. K. thanks the “excellence initiative by the German federaland state government” (Institutional strategy, measure“support the best”). V. B. thanks the German Federal Ministryfor education and research (Project BMBF No. 05K13OD3). TheHZB is gratefully acknowledged for the allocation of the syn-chrotron radiation beamtime on KMC-2 and MX BL14.2 beam-lines and for travel grants.
References
1 A. Schneemann, V. Bon, I. Schwedler, I. Senkovska, S. Kaskeland R. A. Fischer, Chem. Soc. Rev., 2014, 43, 6062–6096.
2 S. Horike, S. Shimomura and S. Kitagawa, Nat. Chem.,2009, 1, 695–704.
3 F.-X. Coudert, Chem. Mater., 2015, 27, 1905–1916.4 P. Serra-Crespo, M. A. van der Veen, E. Gobechiya,
K. Houthoofd, Y. Filinchuk, C. E. A. Kirschhock,J. A. Martens, B. F. Sels, D. E. De Vos, F. Kapteijn andJ. Gascon, J. Am. Chem. Soc., 2012, 134, 8314–8317.
5 A. Douvali, A. C. Tsipis, S. V. Eliseeva, S. Petoud,G. S. Papaefstathiou, C. D. Malliakas, I. Papadas,
G. S. Armatas, I. Margiolaki, M. G. Kanatzidis, T. Lazaridesand M. J. Manos, Angew. Chem., Int. Ed., 2015, 54, 1651–1656.
6 H. Sato, W. Kosaka, R. Matsuda, A. Hori, Y. Hijikata,R. V. Belosludov, S. Sakaki, M. Takata and S. Kitagawa,Science, 2014, 343, 167–170.
7 W. Kosaka, K. Yamagishi, A. Hori, H. Sato, R. Matsuda,S. Kitagawa, M. Takata and H. Miyasaka, J. Am. Chem. Soc.,2013, 135, 18469–18480.
8 Z. Chang, D.-H. Yang, J. Xu, T.-L. Hu and X.-H. Bu, Adv.Mater., 2015, 27, 5432–5441.
9 S. Henke, A. Schneemann, A. Wütscher and R. A. Fischer,J. Am. Chem. Soc., 2012, 134, 9464–9474.
10 P. Horcajada, F. Salles, S. Wuttke, T. Devic,D. Heurtaux, G. Maurin, A. Vimont, M. Daturi,O. David, E. Magnier, N. Stock, Y. Filinchuk, D. Popov,C. Riekel, G. Férey and C. Serre, J. Am. Chem. Soc.,2011, 133, 17839–17847.
11 O. Kozachuk, M. Meilikhov, K. Yusenko, A. Schneemann,B. Jee, A. V. Kuttatheyil, M. Bertmer, C. Sternemann,A. Pöppl and R. A. Fischer, Eur. J. Inorg. Chem., 2013, 2013,4546–4557.
12 Y. Sakata, S. Furukawa, M. Kondo, K. Hirai, N. Horike,Y. Takashima, H. Uehara, N. Louvain, M. Meilikhov,T. Tsuruoka, S. Isoda, W. Kosaka, O. Sakata andS. Kitagawa, Science, 2013, 339, 193–196.
13 J. Wang, J. Luo, J. Zhao, D.-S. Li, G. Li, Q. Huo and Y. Liu,Cryst. Growth Des., 2014, 14, 2375–2380.
14 P. Deria, Y. G. Chung, R. Q. Snurr, J. T. Hupp andO. K. Farha, Chem. Sci., 2015, 6, 5172–5176.
15 I. Gamba, I. Salvadó, G. Rama, M. Bertazzon,M. I. Sánchez, V. M. Sánchez-Pedregal, J. Martínez-Costas,R. F. Brissos, P. Gamez, J. L. Mascareñas, M. VázquezLópez and M. E. Vázquez, Chem. – Eur. J., 2013, 19, 13369–13375.
16 U. Mueller, N. Darowski, M. R. Fuchs, R. Forster,M. Hellmig, K. S. Paithankar, S. Puhringer, M. Steffien,G. Zocher and M. S. Weiss, J. Synchrotron Radiat., 2012, 19,442–449.
17 M. D. Winn, C. C. Ballard, K. D. Cowtan, E. J. Dodson,P. Emsley, P. R. Evans, R. M. Keegan, E. B. Krissinel,A. G. W. Leslie, A. McCoy, S. J. McNicholas,G. N. Murshudov, N. S. Pannu, E. A. Potterton,H. R. Powell, R. J. Read, A. Vagin and K. S. Wilson, ActaCrystallogr., Sect. D: Biol. Crystallogr., 2011, 67, 235–242.
18 G. Sheldrick, Acta Crystallogr., Sect. A: Fundam. Crystallogr.,2008, 64, 112–122.
19 A. Spek, Acta Crystallogr., Sect. D: Biol. Crystallogr., 2009,65, 148–155.
20 Material Studio 5.0, Accelrys Software Inc., San Diego, USA,2009.
21 V. Bon, I. Senkovska, D. Wallacher, A. Heerwig, N. Klein,I. Zizak, R. Feyerherm, E. Dudzik and S. Kaskel, Micro-porous Mesoporous Mater., 2014, 188, 190–195.
22 P. A. Heiney, Datasqueeze 2.2.9 Graphical Tool for X-ray DataAnalysis, 2012.
Paper Dalton Transactions
4414 | Dalton Trans., 2016, 45, 4407–4415 This journal is © The Royal Society of Chemistry 2016
Ope
n A
cces
s A
rtic
le. P
ublis
hed
on 0
3 Fe
brua
ry 2
016.
Dow
nloa
ded
on 1
1/11
/202
1 5:
16:3
3 PM
. T
his
artic
le is
lice
nsed
und
er a
Cre
ativ
e C
omm
ons
Attr
ibut
ion
3.0
Unp
orte
d L
icen
ce.
View Article Online

23 C. Serre, S. Bourrelly, A. Vimont, N. A. Ramsahye,G. Maurin, P. L. Llewellyn, M. Daturi, Y. Filinchuk,O. Leynaud, P. Barnes and G. Férey, Adv. Mater., 2007, 19,2246–2251.
24 V. Bon, N. Klein, I. Senkovska, A. Heerwig, J. Getzschmann,D. Wallacher, I. Zizak, M. Brzhezinskaya, U. Mueller andS. Kaskel, Phys. Chem. Chem. Phys., 2015, 17, 17471–17479.
25 L. Sarkisov and A. Harrison, Mol. Simul., 2011, 37, 1248–1257.
26 C. Serre, F. Millange, C. Thouvenot, M. Noguès,G. Marsolier, D. Louër and G. Férey, J. Am. Chem. Soc.,2002, 124, 13519–13526.
27 G. Ferey and C. Serre, Chem. Soc. Rev., 2009, 38, 1380–1399.
Dalton Transactions Paper
This journal is © The Royal Society of Chemistry 2016 Dalton Trans., 2016, 45, 4407–4415 | 4415
Ope
n A
cces
s A
rtic
le. P
ublis
hed
on 0
3 Fe
brua
ry 2
016.
Dow
nloa
ded
on 1
1/11
/202
1 5:
16:3
3 PM
. T
his
artic
le is
lice
nsed
und
er a
Cre
ativ
e C
omm
ons
Attr
ibut
ion
3.0
Unp
orte
d L
icen
ce.
View Article Online