tulane workshop on multi-omics integration
TRANSCRIPT
Tauber Bioinformatics Research Center at the University of Haifa has a proven track record in Bioinformatics with scientific collaborations with Hospitals, Universities, involvement in government-funded projects, and multiple publications in leading
journals.
Pine Biotech holds an exclusive license for commercialization of tools developed at the TBRC for research, industry applications and education. The startup is located at the BioInnovation Center in New Orleans, LA. In collaboration with TBRC staff, Pine Biotech is completing several pilot projects to validate our approach.

Dr. Leonid Brodsky
Dr. Alfred Tauber
Dr. Baruch Rinkevich
Dr. Hanoch Kaphzan
Bioinformatics
Immunology
Marine Biology
Neurobiology
Rare Genomic Diseases

Data Types
Specific Pipelines
Integration
Education
Machine Learning

Projects and Approaches

Noisy and Complex Heterogenous Datasets
BiAssociation: Integration of different types of –omics data
Identifying hidden patterns in data
BiClustering: Example of Assembly of raw transcriptomic reads from exosomal RNAs and other non aligned reads

Integration and Identification of Key Features
Drug 1 Drug 2 Drug 3
Cell Line 1 IG50 IG51 IG52
Cell Line 2 IG51 IG52 IG53
Cell Line 3 IG52 IG53 IG54
Cell Line 4 IG53 IG54 IG55
Cell Line 1 Cell Line 2 Cell Line 3
Gene 1 Exp. Level Exp. Level Exp. Level
Gene 2 Exp. Level Exp. Level Exp. Level
Gene 3 Exp. Level Exp. Level Exp. Level
Gene 4 Exp. Level Exp. Level Exp. Level
Data Source 1 Data Source 2
Clustering Clustering
Many-to-Many Relationships of clustering results
Key Feature 1Key Feature 2
…
BiAssociation

Identification of predictor genes and mutations for drug efficacy
Selection of tumor and stroma genes as biomarker candidates

cell lines
mut
atio
ns
cell lines
gene
s
cell lines
drug
s
Pres
ence
/Abs
ence
of
SN
P (1
/0)
Expr
essi
on
Valu
es
IC50
Va
lues
drugs
cell
lines IC50
Values
chem
ical
des
crip
tors
IC50 Values
patie
nts
IC50 Values
drugs
drugs
Network of Integrations
Linking clinical conditions with omics data in model experiments

Processed Tables of Raw Expression Data
Samples
Expression levels
Variation
Association
Sequence
Pathway
Variation
Function

Drug-Gene BiAssociation using swRegression
cell lines
gene
s
Expr
essi
on
Valu
es
drugs
cell
lines
IC50
Va
lues
cell line 1
cell line 2
cell line 3
cell line 4
cell line 5
cell line 6
cell line 7
gene expression IC50 value
Detection of gene activation linked to an IC50 value by cell line. Each cell line represents a subtype of cancer, selected by
modeling that biological condition
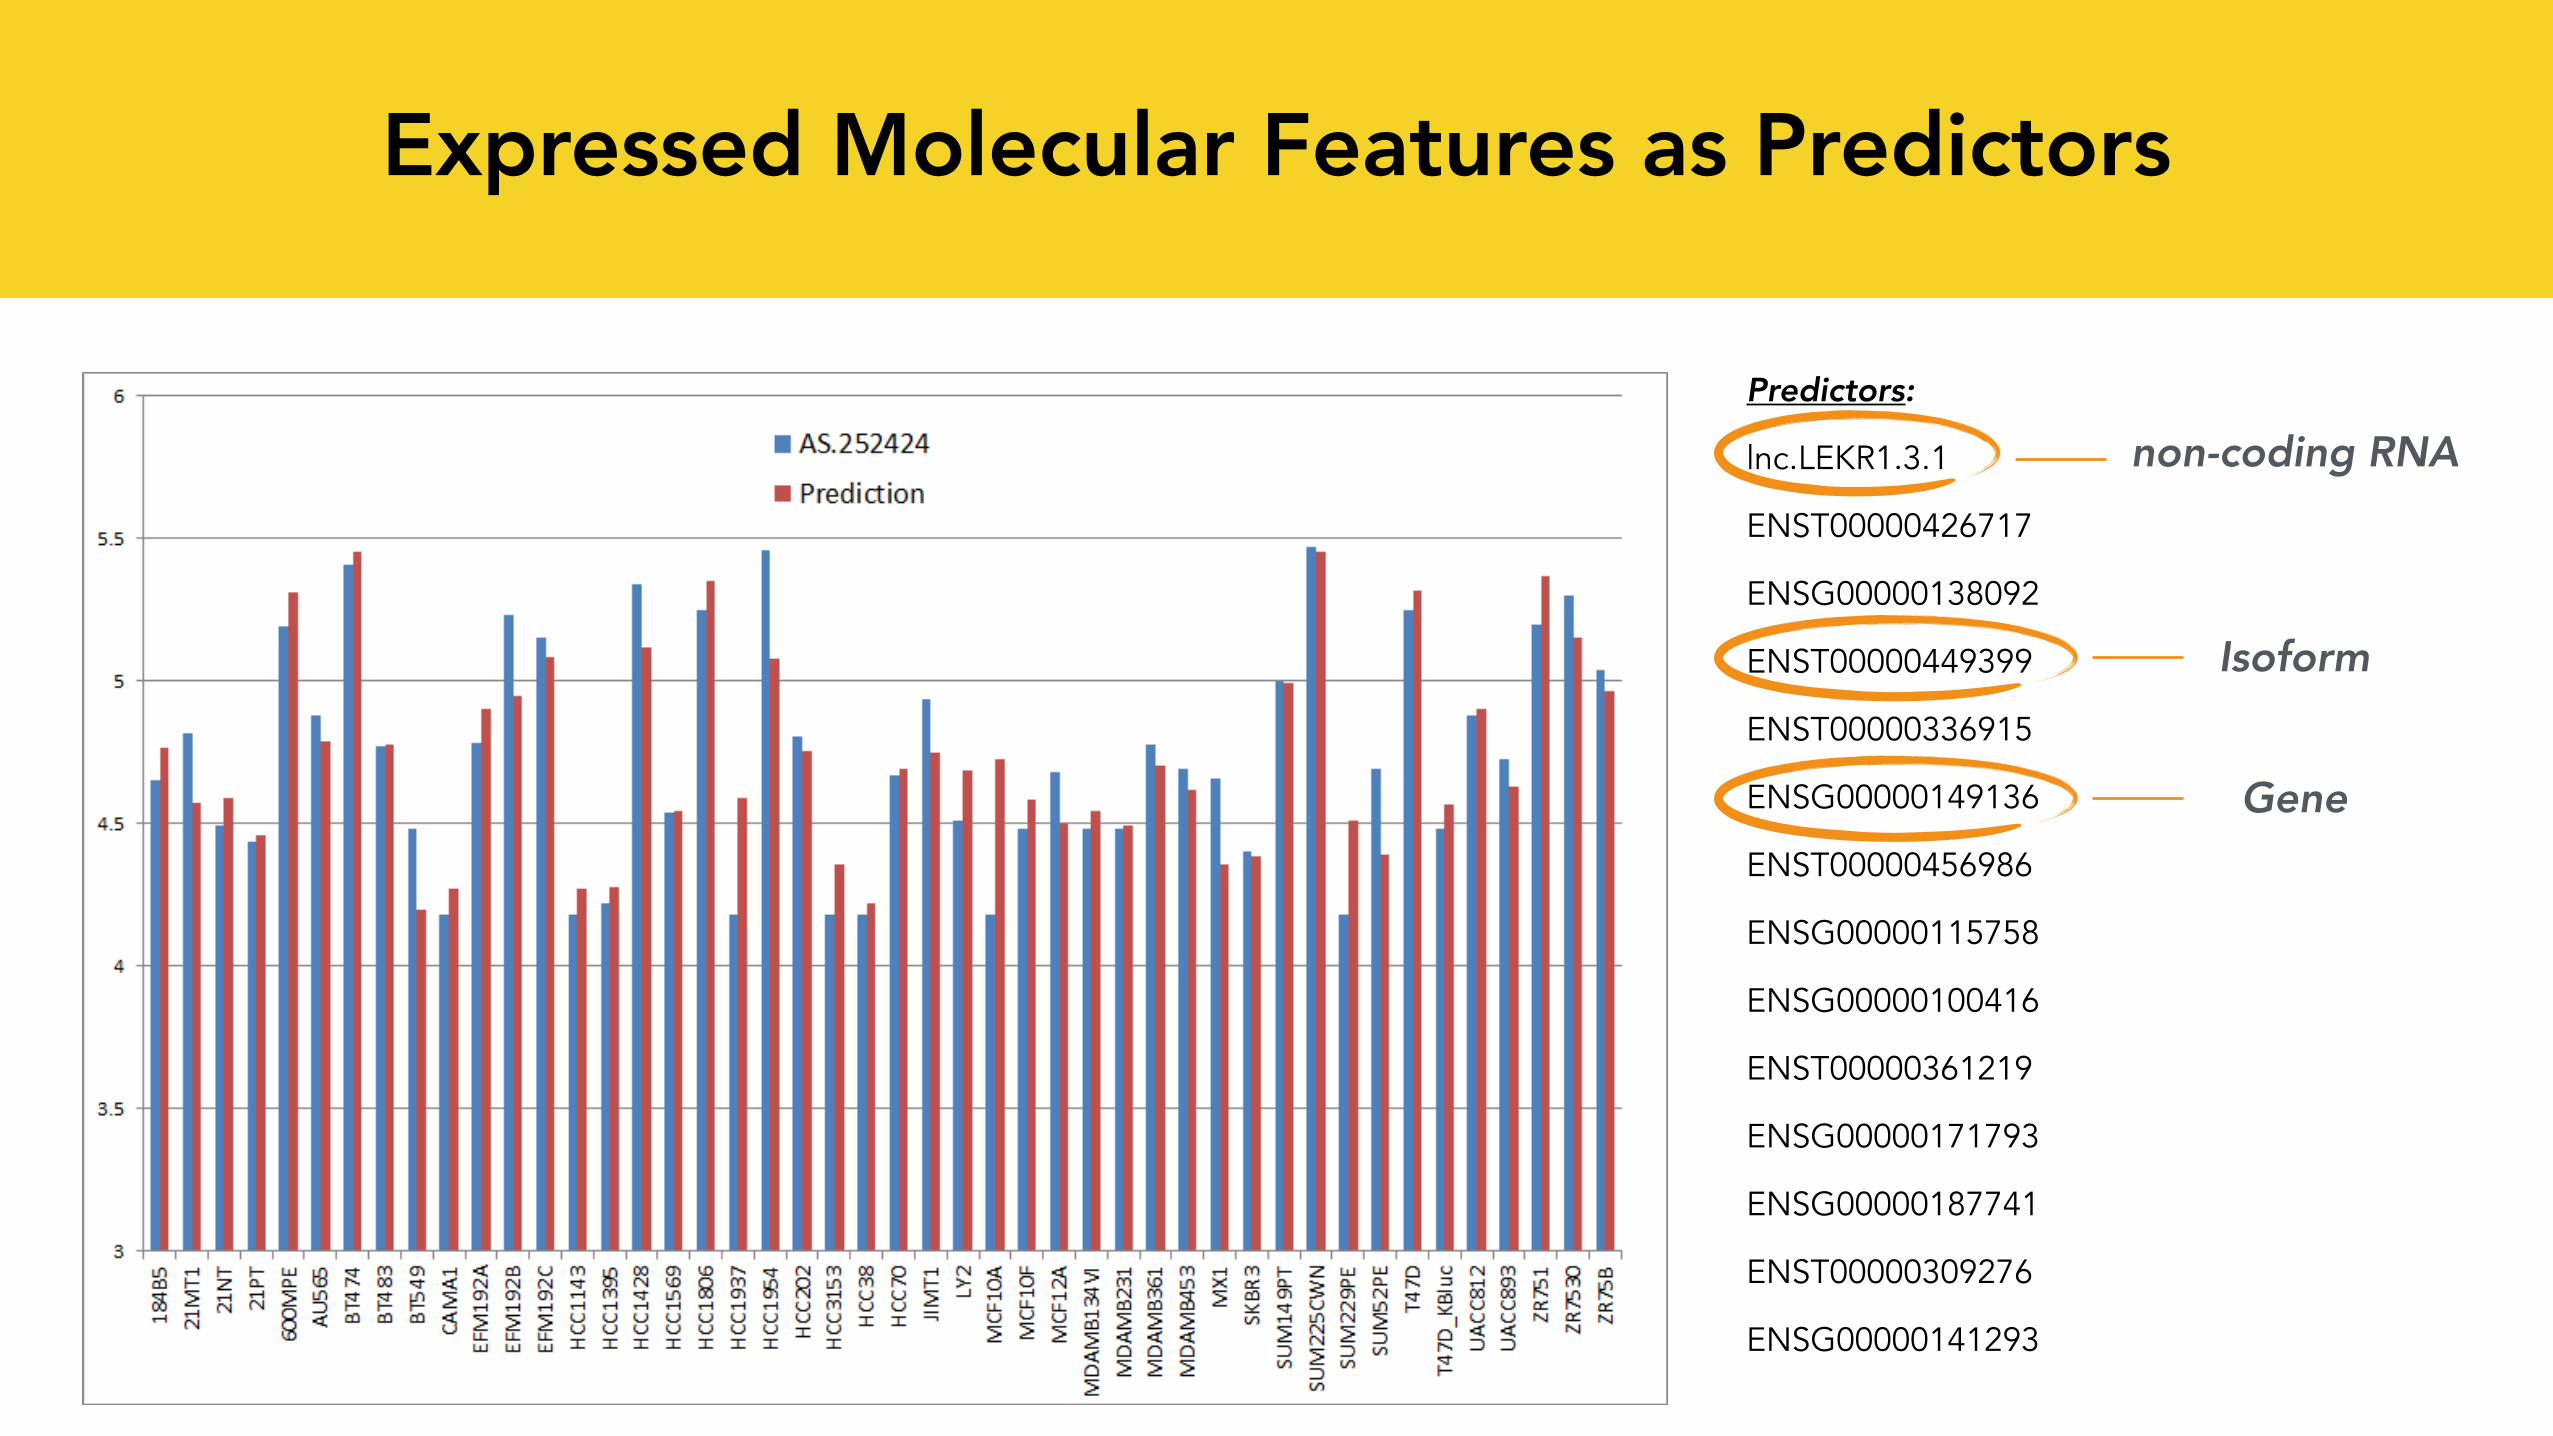
Predictors:
lnc.LEKR1.3.1
ENST00000426717
ENSG00000138092
ENST00000449399
ENST00000336915
ENSG00000149136
ENST00000456986
ENSG00000115758
ENSG00000100416
ENST00000361219
ENSG00000171793
ENSG00000187741
ENST00000309276
ENSG00000141293
non-coding RNA
Isoform
Gene
Expressed Molecular Features as Predictors

Multivariate Mutation-Expression BiAssociation
cell lines
gene
s
Expr
essi
on
Valu
escell lines
mut
atio
ns
Mut
atio
n Va
lues
(1/0
)
cell line 1
cell line 2
cell line 3
cell line 4
cell line 5
cell line 6
cell line 7
gene expression
mutation isl
ands
island abundance
neighboring gene
DOCK6
DOCK6
DOCK6
DOCK6
DOCK6
DOCK6
DOCK6
OR
2O
R11
OR
5A1
46 cell lines
173 genes of the Olfactory pathway
mutation island vs. SNP
“neighborhood” gene

Applications to Clinical Studies
cell line 1
cell line 2
cell line 3
cell line 4
cell line 5
cell line 6
cell line 7
minus Log (GI50) mutation islands neighbor
ROBO1
ROBO1
ROBO1
ROBO1
ROBO1
ROBO1
ROBO1
46 cell lines
Doxorubicin GI50 Profile
mutation island vs. SNP
ROBO1 receptor
Doxorubicin: standard treatment in eligible patients with advanced/metastatic soft tissue sarcoma
Who? Why? How?
SLIT2 protein
SLIT2 protein
SLIT2 protein
SLIT2 protein
SLT2 protein
ROBO1 receptor
SLIT2 protein

BiAssociation for Hidden Patterns in Omics Data

Lymphoma possibly associated with Epstein-Barr virus Stroma-Specific Sample Identification Small Cell Lung Carcinoma Samples

Lymphomagenesis Samples
Genes deferentially expressed in these outlier samples are enriched with immune processes in the tumor. We hypothesize that these tumors are lymphomas.
One sample from these outlier samples is a chronic lymphocytic leukemia sample and so the B-cell presence in this sample is not surprising. However, the other two samples are lung bronchogenic cancer and lung squamous cancer respectively. Our hypothesis is that these two cancers are lymphoma cancers associated with Epstein-Barr virus
References: Patient-Derived Tumor Xenografts Are Susceptible to Formation of Human Lymphocytic Tumors (2015) and Human Solid Tumor Xenografts in Immunodeficient Mice Are Vulnerable to Lymphomagenesis Associated with Epstein-Barr Virus (2012)
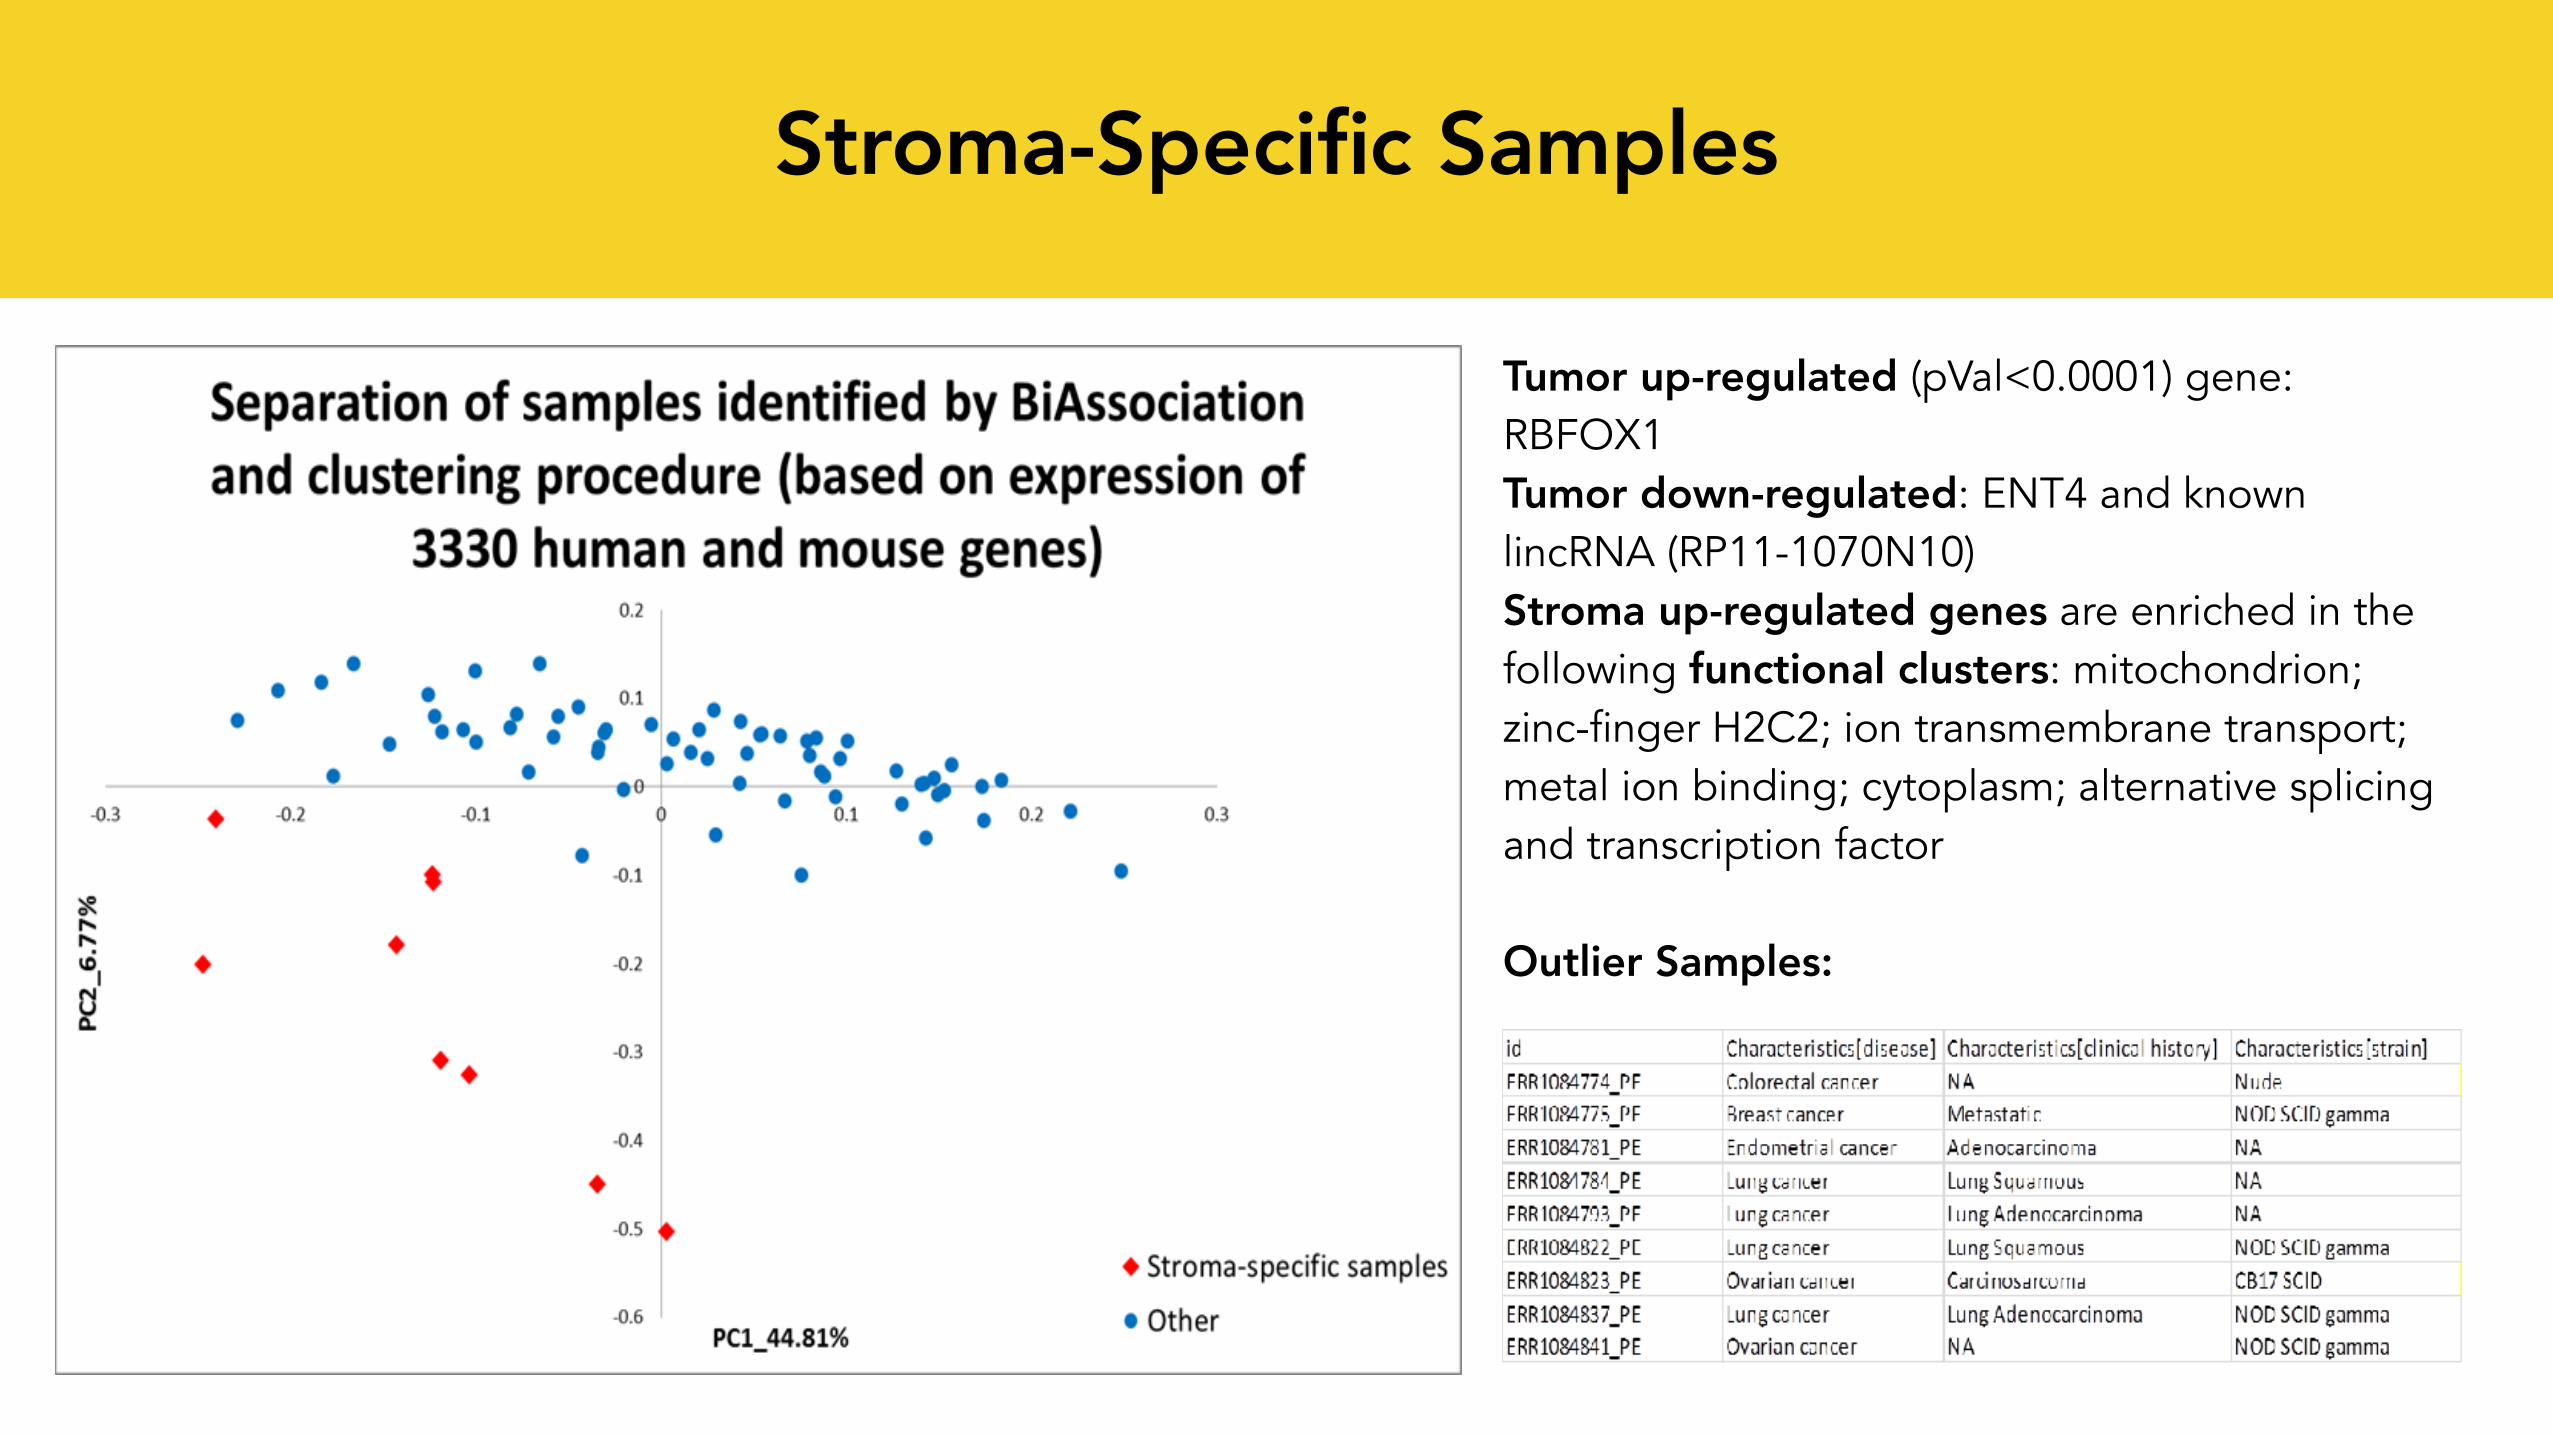
Stroma-Specific Samples
Tumor up-regulated (pVal<0.0001) gene: RBFOX1 Tumor down-regulated: ENT4 and known lincRNA (RP11-1070N10) Stroma up-regulated genes are enriched in the following functional clusters: mitochondrion; zinc-finger H2C2; ion transmembrane transport; metal ion binding; cytoplasm; alternative splicing and transcription factor
Outlier Samples:

Significantly (p-val <0.0001) up-regulated (in Small-cell Carcinoma Lung Cancer samples) tumor genes (491 genes) are enriched by the following functional clusters: Zinc finger C2H2; Kelch repeat; CUB domain; protein phosphatase 2C.
Significantly down-regulated tumor genes (p-val<0.0001; 1056 genes) are enriched by the following functional clusters: connecting peptide; MHC 1; tumor necrosis factor-activated receptor activity; calcium binding
Significantly down-regulated stroma genes (p-val <0.0001; 323 genes) are enriched by the following functional clusters: Interferon regulatory factor; SOCS box; 2'-5'-oligoadenylate synthetase activity
Small Cell Lung Carcinoma
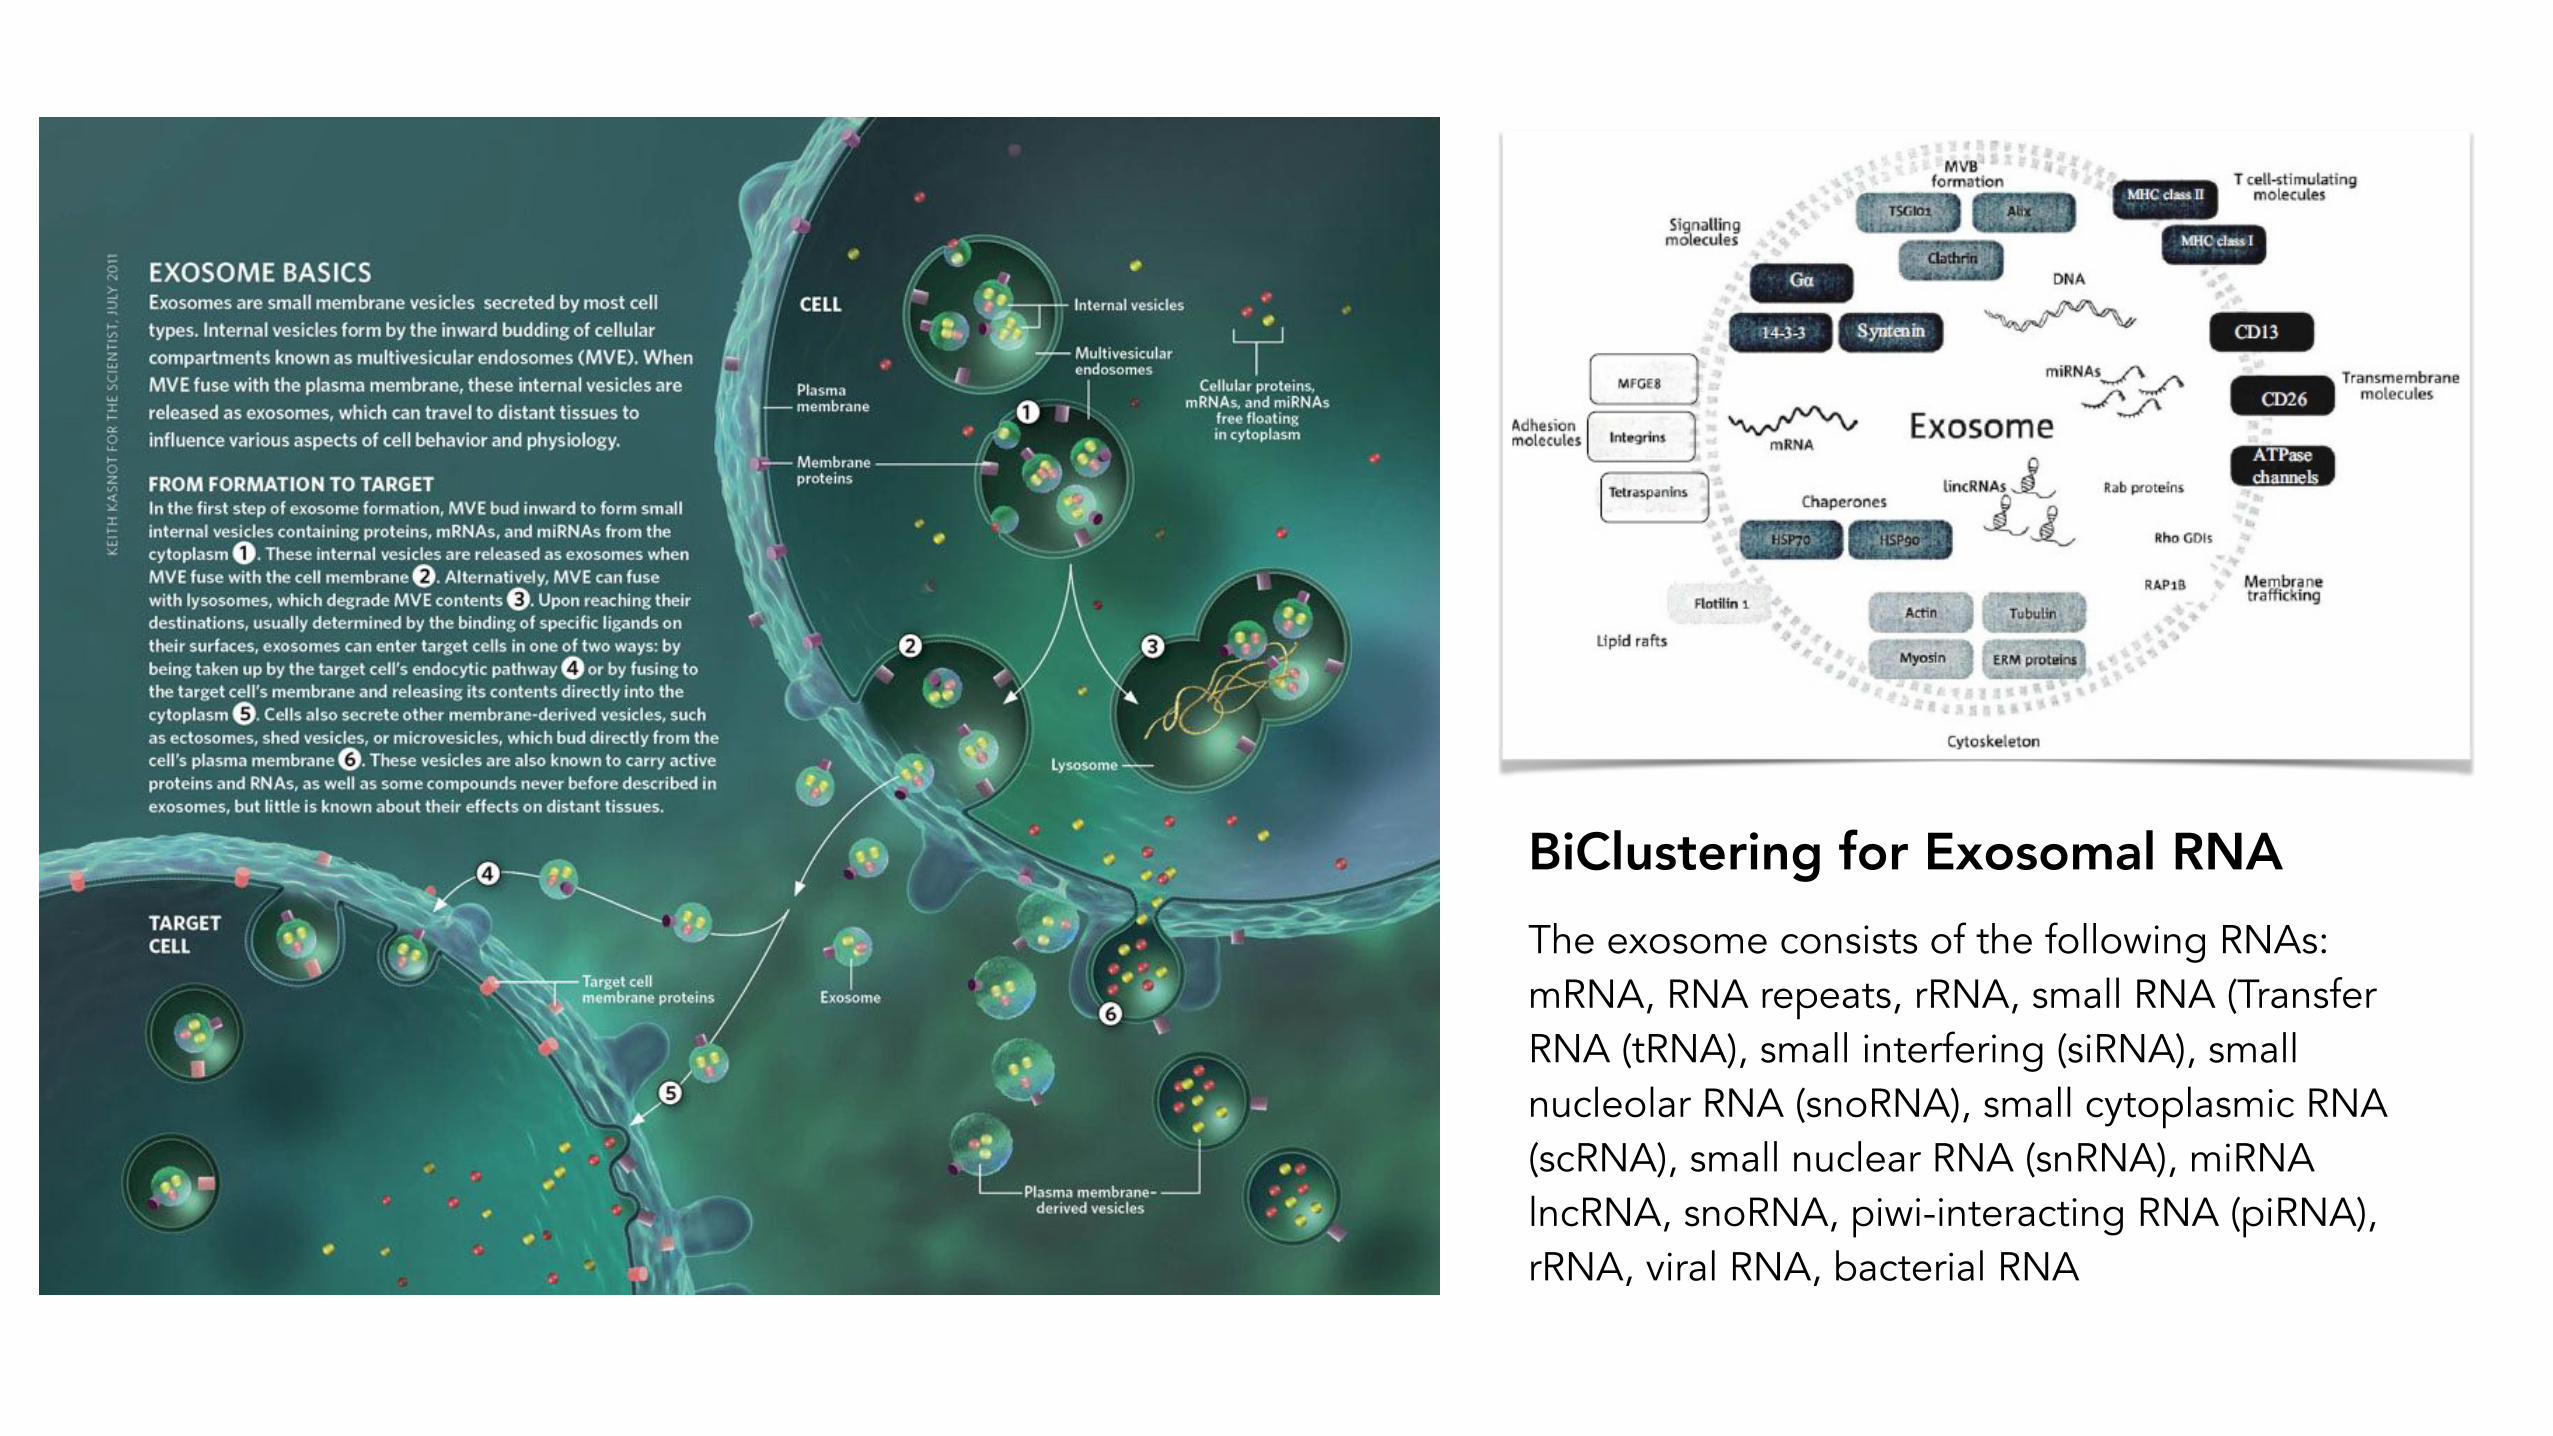
The exosome consists of the following RNAs: mRNA, RNA repeats, rRNA, small RNA (Transfer RNA (tRNA), small interfering (siRNA), small nucleolar RNA (snoRNA), small cytoplasmic RNA (scRNA), small nuclear RNA (snRNA), miRNA lncRNA, snoRNA, piwi-interacting RNA (piRNA), rRNA, viral RNA, bacterial RNA
BiClustering for Exosomal RNA

Consensus
known sequences
known sequences
K-chainsRaw reads Assembly
BiClustering Procedure
Assembly of small RNA, repetitive elements and other transcribed genomic elements via BiClustering.

Thank You!