tui group investor presentation · customer: access to > 30 million customers worldwide tour...
TRANSCRIPT
TUI GROUP – Investor Presentation Horst Baier (CFO) Commerzbank – German Investment Seminar
New York, 13 – 14 January 2015
2
Important notice
TUI GROUP | Investor Relations | 13 - 14 January 2015
NOT FOR RELEASE, PUBLICATION OR DISTRIBUTION IN WHOLE OR IN PART IN, INTO OR FROM ANY JURISDICTION WHERE TO DO SO WOULD CONSTITUTE A
VIOLATION OF THE RELEVANT LAWS OF SUCH JURISDICTION.
This document is not intended to, and does not, constitute, represent or form part of any offer, invitation or solicitation of an offer to purchase, otherwise acquire, subscribe for, sell or otherwise
dispose of, any securities or the solicitation of any vote or approval in any jurisdiction whether pursuant to this announcement or otherwise. No shares are being offered to the public by means
of this document.
The release, publication or distribution of this document in jurisdictions other than the United Kingdom may be restricted by law and therefore any persons who are subject to the laws of any
jurisdiction other than the United Kingdom should inform themselves about, and observe, any applicable requirements. Any failure to comply with applicable requirements may constitute a
violation of the laws and/or regulations of any such jurisdiction. To the fullest extent permitted by applicable law, the companies and persons involved in the proposed merger of TUI Travel plc
(“TUI Travel”) and TUI AG disclaim any responsibility or liability for the violation of such requirements by any person.
This document contains statements about TUI AG and its group that are or may be forward-looking statements. All statements other than statements of historical facts included in this
document may be forward-looking statements. Such forward-looking statements involve risks and uncertainties that could significantly affect expected results and are based on certain key
assumptions. Many factors could cause actual results to differ materially from those projected or implied in any forward-looking statements, as by their nature forward-looking statements
involve known and unknown risks and uncertainties because they relate to events and depend on circumstances that will occur in the future. Due to such uncertainties and risks, readers are
cautioned not to place undue reliance on such forward-looking statements, which speak only as of the date hereof. TUI AG disclaims any obligation to update any forward-looking or other
statements contained herein, except as required by applicable law or regulation.
Neither TUI AG, nor any members of its Executive Board (Vorstand) or Supervisory Board (Aufsichtsrat), associates, officers or advisers, provides any representation, assurance or guarantee
that the occurrence of the events expressed or implied in any forward-looking statements in this announcement will actually occur. You are cautioned not to place undue reliance on these
forward-looking statements, which speak only as of the date hereof. Other than in accordance with its legal or regulatory obligations, TUI AG is not under any obligation and expressly
disclaims any intention or obligation to update or revise any forward-looking statements, whether as a result of new information, future events or otherwise.
Statements of estimated cost savings and synergies relate to future actions and circumstances which, by their nature, involve risks, uncertainties and contingencies. As a result, any cost savings
and synergies referred to may not be achieved, may be achieved later or sooner than estimated, or those achieved could be materially different from those estimated.
Except where any statement in this document is expressly made as a profit forecast in this document is intended as a profit forecast or profit estimate for any period nor should be interpreted
to mean that earnings or earnings per share for TUI AG, for the current or future financial years would necessarily match or exceed the historical published earnings or earnings per share for
TUI AG.
Regarding slide 25 and 26, please note:
“Executive Board (Vorstand) confirmations
The statements in the section entitled ‘Outlook FY 2014/15’ constitute profit forecasts published by TUI AG for the purposes of the City Code on Takeovers and Mergers. Such statements are
“forward-looking statements”, which are prospective in nature. Such statements are based on current assumptions, expectations and projections about future events, and are therefore subject to
known and unknown risks and uncertainties which could cause actual results to differ materially from the future results ex-pressed or implied by such statements.
In accordance with the City Code on Takeovers and Mergers, the members of the Executive Board (Vorstand) of TUI AG confirm that each such profit estimate and profit forecast is valid, has
been properly compiled on the basis of the assumptions stated and the basis of accounting used is consistent with TUI AG’s accounting policies. Peter Long, as CEO of TUI Travel PLC is not
participating in the Executive Board (Vorstand) of TUI AG for the purposes of the possible all-share nil-premium merger with TUI Travel or the giving of these confirmations.”
3 TUI GROUP | Investor Relations | 13 - 14 January 2015
Review FY 2013/14
Merger with TUI Travel
Highlights 1
2
3
Outlook FY 2014/15 4
Agenda

4 TUI GROUP | Investor Relations | 13 - 14 January 2015
Highlights 2014 – An exciting year for our Group
Closing of Transaction in mid-
December:
Issue of new TUI AG shares on
12 December 2014
Listing on London Stock Exchange on 17
December 2014
Creation of the world‘s No 1
integrated tourism business will:
accelerate long-term growth
future-proof our business model
generate substantial synergies
Merger with TUI Travel
Operating performance
We deliver on our targets:
We outperformed our financial targets for FY 2013/14
We are pleased with trading for Winter 2014/15 and the strong start into UK Summer 2015
We are well on track to deliver our EBITA targets in FY 2014/15

5 TUI GROUP | Investor Relations | 13 - 14 January 2015
Review FY 2013/14
Merger with TUI Travel
Highlights 1
2
3
Outlook FY 2014/15 4
Agenda
6
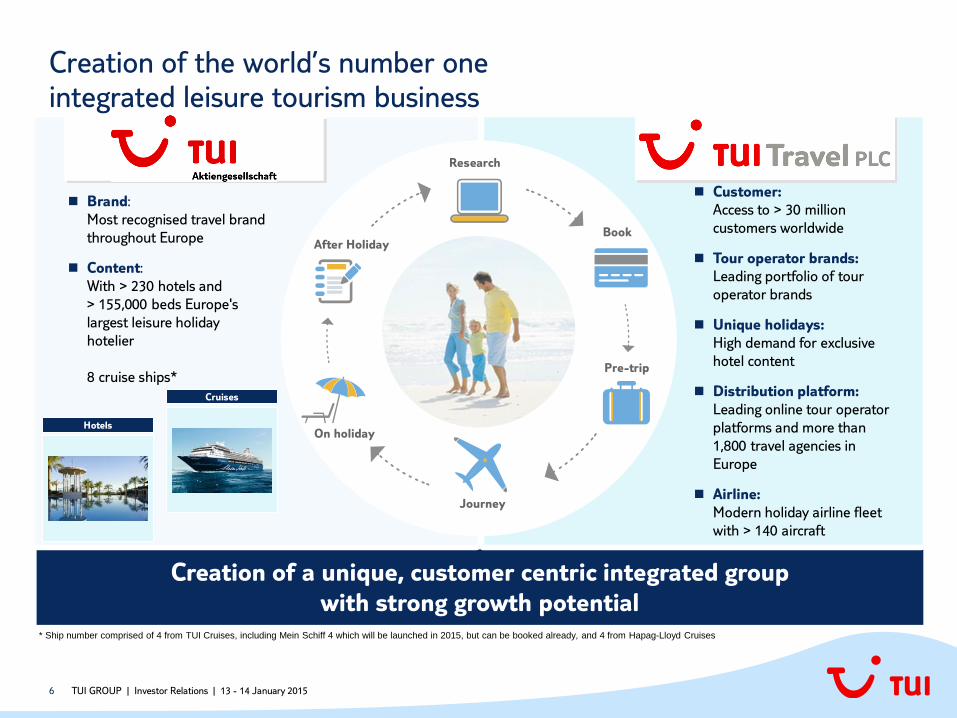
Creation of a unique, customer centric integrated group
with strong growth potential
Hotels
Cruises
Research
Book
Pre-trip
On holiday
Journey
After Holiday
Brand:
Most recognised travel brand
throughout Europe
Content:
With > 230 hotels and
> 155,000 beds Europe's
largest leisure holiday
hotelier
8 cruise ships*
* Ship number comprised of 4 from TUI Cruises, including Mein Schiff 4 which will be launched in 2015, but can be booked already, and 4 from Hapag-Lloyd Cruises
Customer:
Access to > 30 million
customers worldwide
Tour operator brands:
Leading portfolio of tour
operator brands
Unique holidays:
High demand for exclusive
hotel content
Distribution platform:
Leading online tour operator
platforms and more than
1,800 travel agencies in
Europe
Airline:
Modern holiday airline fleet
with > 140 aircraft
Creation of the world’s number one integrated leisure tourism business
TUI GROUP | Investor Relations | 13 - 14 January 2015
7
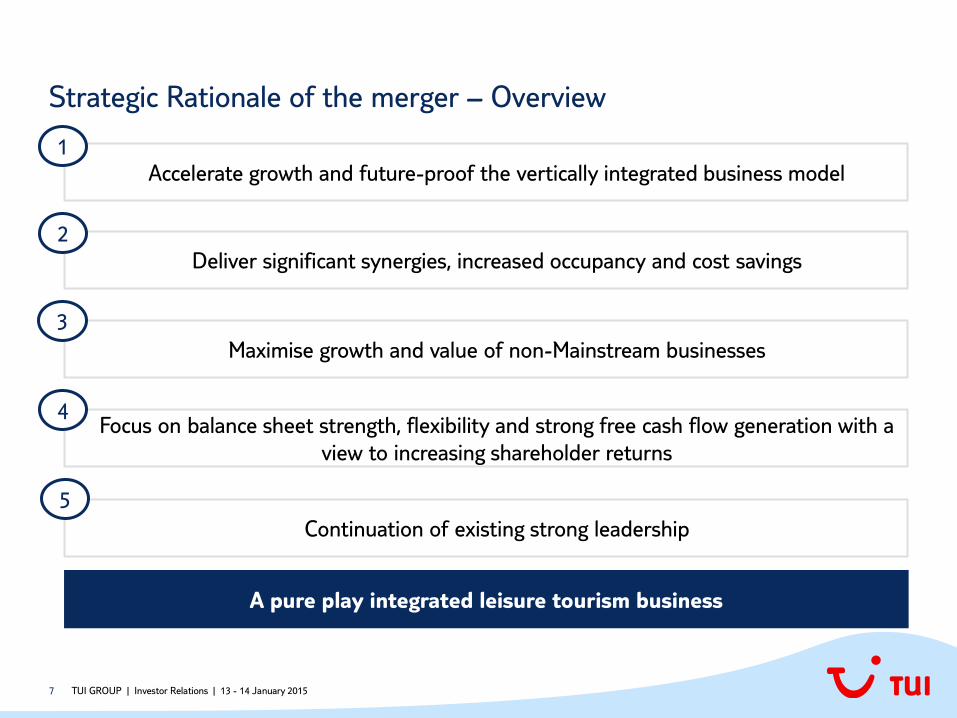
Strategic Rationale of the merger – Overview
TUI GROUP | Investor Relations | 13 - 14 January 2015
A pure play integrated leisure tourism business
Accelerate growth and future-proof the vertically integrated business model
1
Deliver significant synergies, increased occupancy and cost savings
2
Maximise growth and value of non-Mainstream businesses
3
Focus on balance sheet strength, flexibility and strong free cash flow generation with a
view to increasing shareholder returns
4
Continuation of existing strong leadership
5
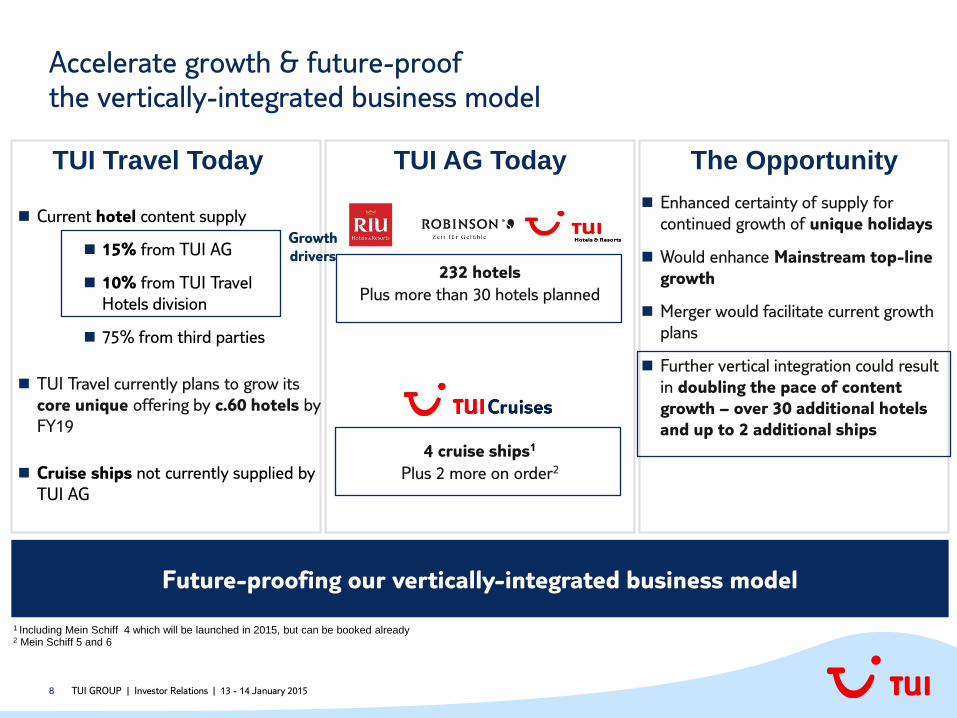
8
232 hotels
Plus more than 30 hotels planned
4 cruise ships1
Plus 2 more on order2
TUI Travel Today The Opportunity
Current hotel content supply
15% from TUI AG
10% from TUI Travel
Hotels division
75% from third parties
TUI Travel currently plans to grow its
core unique offering by c.60 hotels by
FY19
Cruise ships not currently supplied by
TUI AG
Future-proofing our vertically-integrated business model
TUI AG Today
Enhanced certainty of supply for
continued growth of unique holidays
Would enhance Mainstream top-line
growth
Merger would facilitate current growth
plans
Further vertical integration could result
in doubling the pace of content
growth – over 30 additional hotels
and up to 2 additional ships
Growth
drivers
1 Including Mein Schiff 4 which will be launched in 2015, but can be booked already 2 Mein Schiff 5 and 6
Accelerate growth & future-proof the vertically-integrated business model
TUI GROUP | Investor Relations | 13 - 14 January 2015
9
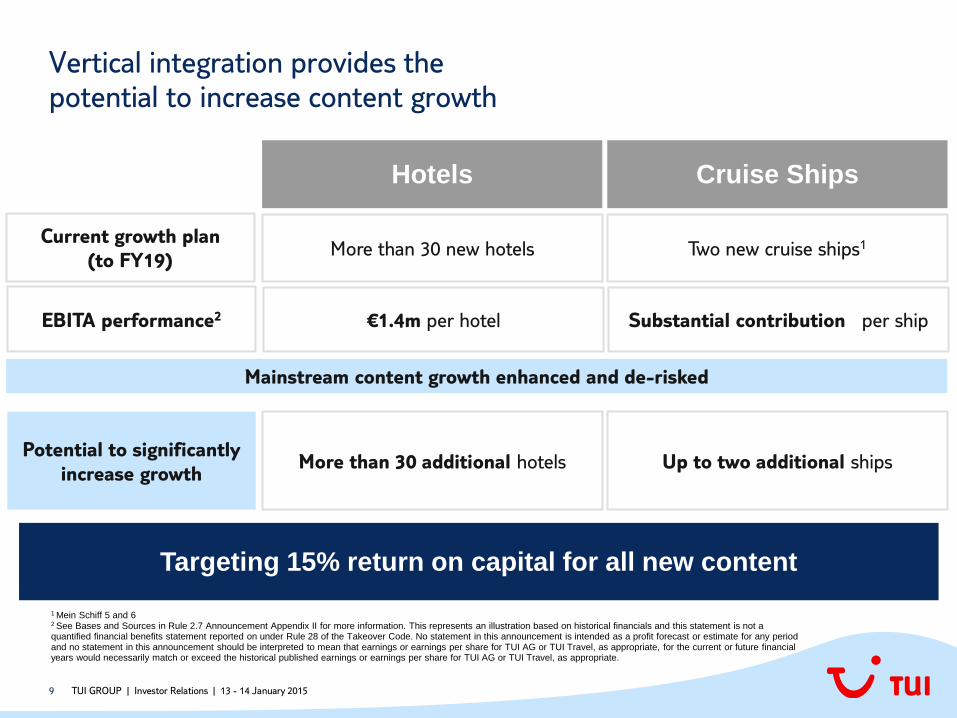
Mainstream content growth enhanced and de-risked
Current growth plan
(to FY19)
Potential to significantly
increase growth
Hotels Cruise Ships
More than 30 new hotels Two new cruise ships1
More than 30 additional hotels Up to two additional ships
EBITA performance2 €1.4m per hotel Substantial contribution per ship
1 Mein Schiff 5 and 6
2 See Bases and Sources in Rule 2.7 Announcement Appendix II for more information. This represents an illustration based on historical financials and this statement is not a quantified financial benefits statement reported on under Rule 28 of the Takeover Code. No statement in this announcement is intended as a profit forecast or estimate for any period and no statement in this announcement should be interpreted to mean that earnings or earnings per share for TUI AG or TUI Travel, as appropriate, for the current or future financial years would necessarily match or exceed the historical published earnings or earnings per share for TUI AG or TUI Travel, as appropriate.
Targeting 15% return on capital for all new content
Vertical integration provides the potential to increase content growth
TUI GROUP | Investor Relations | 13 - 14 January 2015
10
1 Refer to Rule 2.7 Announcement Appendix IV 2 Represents a quantified financial benefits statement reported on under Rule 28 of the Takeover Code 3 The underlying effective tax rate (ETR) of the Combined Group for the financial year 2012/13 is calculated based on the underlying profit before tax (excluding separately disclosed items, acquisition related expenses and impairment charges). 4 See Bases and Sources in Rule 2.7 Announcement Appendix II for more information. This represents an illustration based on historical financials and this statement is not a quantified financial benefits statement reported on under Rule 28 of the Takeover Code. No statement in this announcement is intended as a profit forecast or estimate for any period and no statement in this announcement should be interpreted to mean that earnings or earnings per share for TUI AG or TUI Travel, as appropriate, for the current or future financial years would necessarily match or exceed the historical published earnings or earnings per share for TUI AG or TUI Travel, as appropriate.
5 Refer to Appendix V of the Rule 2.7 Announcement. These cost savings could have been achieved independently of the merger.
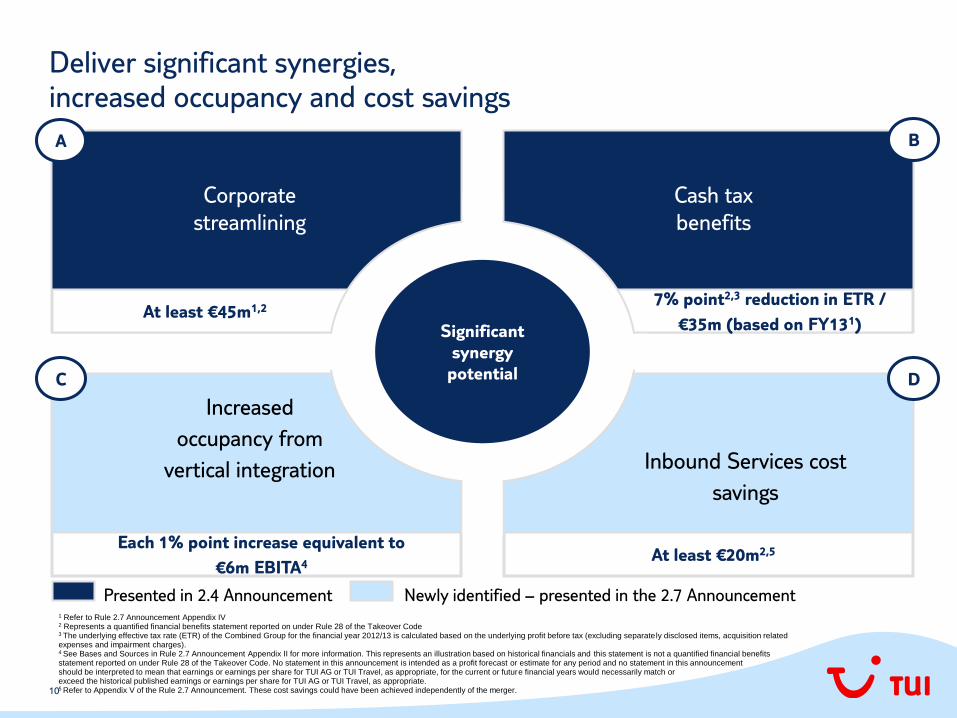
Corporate
streamlining
Cash tax
benefits
Inbound Services cost
savings
Increased
occupancy from
vertical integration
At least €45m1,2 7% point2,3 reduction in ETR /
€35m (based on FY131) Significant
synergy
potential
At least €20m2,5 Each 1% point increase equivalent to
€6m EBITA4
A B
C D
Presented in 2.4 Announcement Newly identified – presented in the 2.7 Announcement
Deliver significant synergies, increased occupancy and cost savings
11
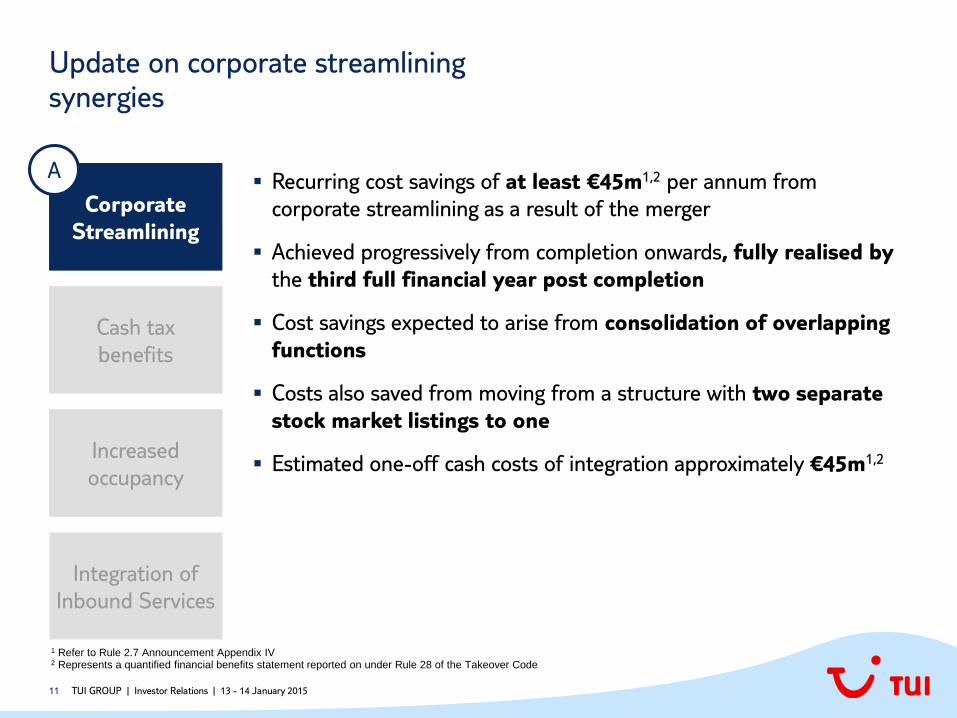
Recurring cost savings of at least €45m1,2 per annum from
corporate streamlining as a result of the merger
Achieved progressively from completion onwards, fully realised by
the third full financial year post completion
Cost savings expected to arise from consolidation of overlapping
functions
Costs also saved from moving from a structure with two separate
stock market listings to one
Estimated one-off cash costs of integration approximately €45m1,2
Corporate
Streamlining
Cash tax
benefits
Increased
occupancy
Integration of
Inbound Services
A
1 Refer to Rule 2.7 Announcement Appendix IV 2 Represents a quantified financial benefits statement reported on under Rule 28 of the Takeover Code
Update on corporate streamlining synergies
TUI GROUP | Investor Relations | 13 - 14 January 2015
12
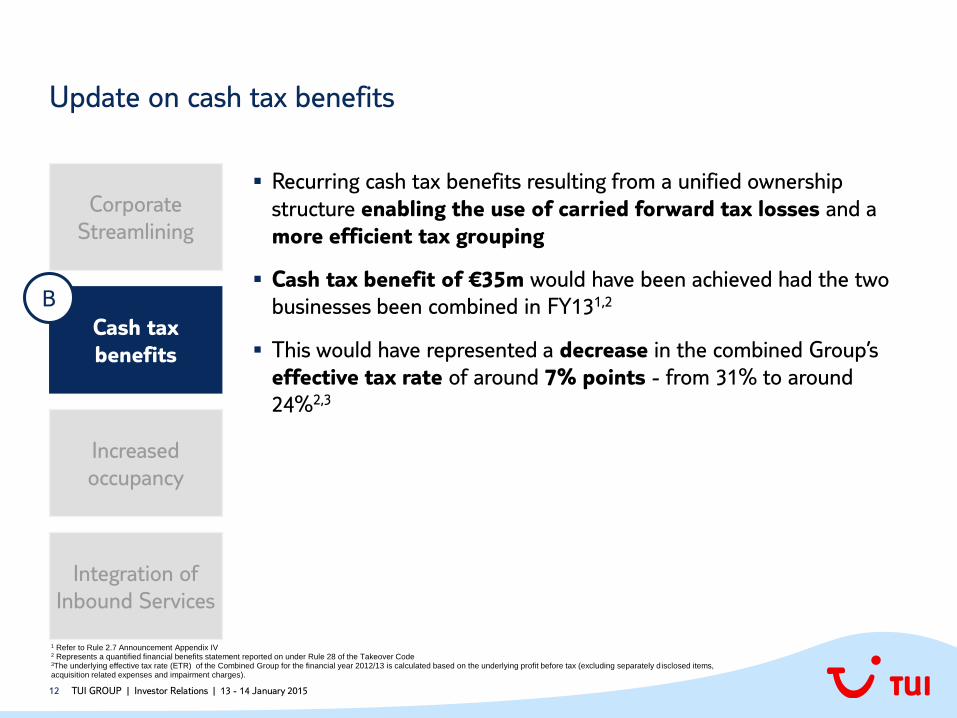
Recurring cash tax benefits resulting from a unified ownership
structure enabling the use of carried forward tax losses and a
more efficient tax grouping
Cash tax benefit of €35m would have been achieved had the two
businesses been combined in FY131,2
This would have represented a decrease in the combined Group’s
effective tax rate of around 7% points - from 31% to around
24%2,3
Corporate
Streamlining
Cash tax
benefits
Increased
occupancy
Integration of
Inbound Services
B
1 Refer to Rule 2.7 Announcement Appendix IV 2 Represents a quantified financial benefits statement reported on under Rule 28 of the Takeover Code 3The underlying effective tax rate (ETR) of the Combined Group for the financial year 2012/13 is calculated based on the underlying profit before tax (excluding separately disclosed items, acquisition related expenses and impairment charges).
Update on cash tax benefits
TUI GROUP | Investor Relations | 13 - 14 January 2015
13
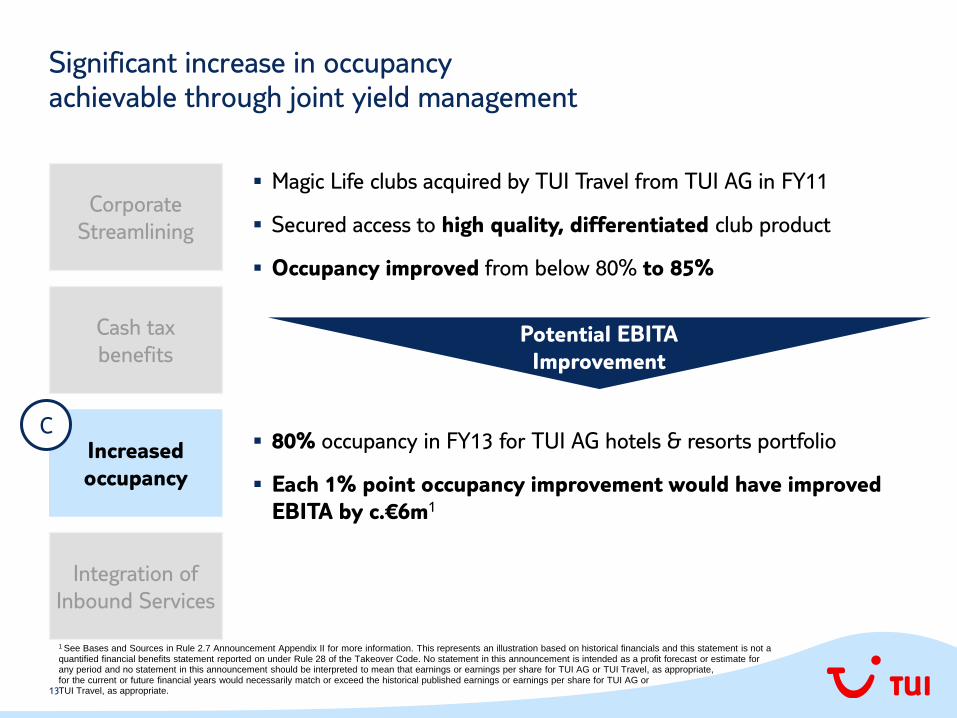
Magic Life clubs acquired by TUI Travel from TUI AG in FY11
Secured access to high quality, differentiated club product
Occupancy improved from below 80% to 85%
80% occupancy in FY13 for TUI AG hotels & resorts portfolio
Each 1% point occupancy improvement would have improved
EBITA by c.€6m1
Corporate
Streamlining
Cash tax
benefits
Increased
occupancy
Integration of
Inbound Services
Potential EBITA
Improvement
C
1 See Bases and Sources in Rule 2.7 Announcement Appendix II for more information. This represents an illustration based on historical financials and this statement is not a quantified financial benefits statement reported on under Rule 28 of the Takeover Code. No statement in this announcement is intended as a profit forecast or estimate for any period and no statement in this announcement should be interpreted to mean that earnings or earnings per share for TUI AG or TUI Travel, as appropriate, for the current or future financial years would necessarily match or exceed the historical published earnings or earnings per share for TUI AG or TUI Travel, as appropriate.
Significant increase in occupancy achievable through joint yield management
14
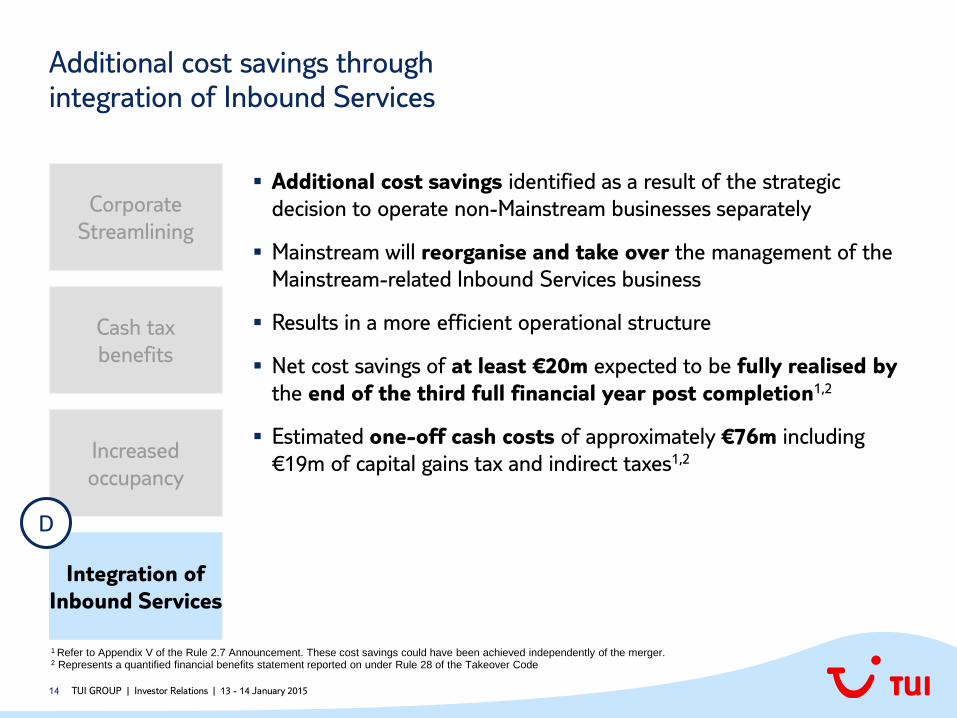
Additional cost savings identified as a result of the strategic
decision to operate non-Mainstream businesses separately
Mainstream will reorganise and take over the management of the
Mainstream-related Inbound Services business
Results in a more efficient operational structure
Net cost savings of at least €20m expected to be fully realised by
the end of the third full financial year post completion1,2
Estimated one-off cash costs of approximately €76m including
€19m of capital gains tax and indirect taxes1,2
Corporate
Streamlining
Cash tax
benefits
Increased
occupancy
Integration of
Inbound Services
D
1 Refer to Appendix V of the Rule 2.7 Announcement. These cost savings could have been achieved independently of the merger. 2 Represents a quantified financial benefits statement reported on under Rule 28 of the Takeover Code
Additional cost savings through integration of Inbound Services
TUI GROUP | Investor Relations | 13 - 14 January 2015
15
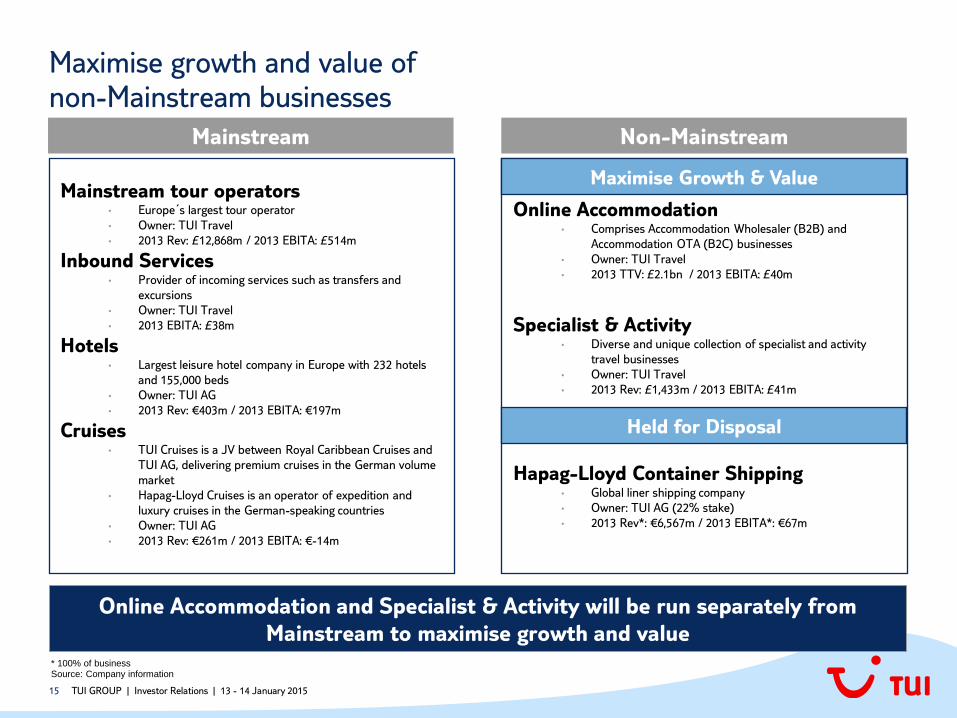
Mainstream tour operators • Europe´s largest tour operator
• Owner: TUI Travel
• 2013 Rev: £12,868m / 2013 EBITA: £514m
Inbound Services • Provider of incoming services such as transfers and
excursions
• Owner: TUI Travel
• 2013 EBITA: £38m
Hotels • Largest leisure hotel company in Europe with 232 hotels
and 155,000 beds
• Owner: TUI AG
• 2013 Rev: €403m / 2013 EBITA: €197m
Cruises • TUI Cruises is a JV between Royal Caribbean Cruises and
TUI AG, delivering premium cruises in the German volume
market
• Hapag-Lloyd Cruises is an operator of expedition and
luxury cruises in the German-speaking countries
• Owner: TUI AG
• 2013 Rev: €261m / 2013 EBITA: €-14m
Online Accommodation • Comprises Accommodation Wholesaler (B2B) and
Accommodation OTA (B2C) businesses
• Owner: TUI Travel
• 2013 TTV: £2.1bn / 2013 EBITA: £40m
Specialist & Activity • Diverse and unique collection of specialist and activity
travel businesses
• Owner: TUI Travel
• 2013 Rev: £1,433m / 2013 EBITA: £41m
Hapag-Lloyd Container Shipping • Global liner shipping company
• Owner: TUI AG (22% stake)
• 2013 Rev*: €6,567m / 2013 EBITA*: €67m
* 100% of business Source: Company information
Online Accommodation and Specialist & Activity will be run separately from
Mainstream to maximise growth and value
Mainstream Non-Mainstream
Held for Disposal
Maximise Growth & Value
Maximise growth and value of non-Mainstream businesses
TUI GROUP | Investor Relations | 13 - 14 January 2015
16
Merger is expected to be EPS accretive1 for both sets of shareholders from the first
full financial year post-Merger2
Strong EPS accretion for TUI Travel shareholders
Strong cash flow/dividend benefit for TUI AG shareholders
Strong EPS accretion1 for both sets of shareholders thereafter
The new Executive Board of TUI AG is confident that value creation for both sets of
shareholders should result from the creation of a pure play integrated leisure
tourism business and from the elimination of the current TUI AG structural
discount
The merger is expected to deliver material value to all shareholders
1 No statement in this announcement is intended as a profit forecast or estimate for any period and no statement in this announcement should be interpreted to mean that earnings or earnings per share for TUI AG or TUI Travel, as appropriate, for the current or future financial years would necessarily match or exceed the historical published earnings or earnings per share for TUI AG or TUI Travel, as appropriate. 2 Before implementation costs of the Merger are accounted for
Delivering material value to all shareholders
TUI GROUP | Investor Relations | 13 - 14 January 2015

17
TUI AG
FY14 dividend
TUI AG proposed to declare a final dividend of an equivalent
amount to the 10.5 pence TUI Travel dividend, taking into account
the exchange ratio (=33 cents per AG share)
Combined Group
dividend policy
Combined Group intends to adopt a policy in line with TUI
Travel’s present progressive dividend policy
Provided that performance develops in line with expectations, target
an increase in dividend per share for FY15 and FY16 of 10% in
excess of the underlying growth in Combined Group earnings
per share
Dividend
TUI GROUP | Investor Relations | 13 - 14 January 2015

18
Strategic Rationale of the merger – Conclusion
TUI GROUP | Investor Relations | 13 - 14 January 2015
A pure play integrated leisure tourism business
Accelerate growth and future-proof the vertically integrated business model
1
Deliver significant synergies, increased occupancy and cost savings
2
Maximise growth and value of non-Mainstream businesses
3
Focus on balance sheet strength, flexibility and strong free cash flow generation with a
view to increasing shareholder returns
4
Continuation of existing strong leadership
5
19 TUI GROUP | Investor Relations | 13 - 14 January 2015
Review FY 2013/14
Merger with TUI Travel
Highlights 1
2
3
Outlook FY 2014/15 4
Agenda

20
Financial year 2013/14 – A strong set of results
Turnover: €18.7bn
+1%
Underlying EBITA: €869m
+14%
Reported EBITA: €774m
+30%
Net result: €284m
+71%
All Segments – TUI Travel, TUI Hotels & Resorts and Cruises
contributed to the increase in turnover to €18.7bn
We outperformed against our profit guidance with growth in
underlying EBITA of 14% (guidance: 6-12%) and growth in
reported EBITA of 30% (guidance: 16-23%)
Strong improvement of net result driven by excellent operating
performance, a decrease in interest cost and a reduction in one-
off items
Our excellent operating performance allows us to propose a dividend of €0.33 per share to our
shareholders as already indicated in the merger announcement & shareholder documentation
*
* before minorities
TUI GROUP | Investor Relations | 13 - 14 January 2015

21
TUI Group Underlying EBITA – 2013/14 profit bridge
TUI GROUP | Investor Relations | 13 - 14 January 2015
762
13/14
869 +11
Central
Operations
Cruises
+24
TUI Hotels
& Resorts
+20
Hotel disposal
gain 12/13
-15
TUI Travel
+67
12/13
Underlying EBITA 2013/14 profit bridge (€m)
* includes disposal gain of €15m
*
+5
TUI Travel €m
+0.9% Turnover 19,954.6
+10.5% Underlying EBITA 707.6
Hotel &
Resorts
+4.2% 861.3
+2.7% 202.5
Cruises
+7.7% 281.0
n.m. 9.7
Group
+1.3% 18,714.7
+14.0% 868.5

22
P&L Key figures 2013/14
TUI GROUP | Investor Relations | 13 - 14 January 2015
in €m 13/14 12/13
Turnover 18,714.7 18,477.5
Underlying EBITA 868.5 761.9
Adjustments -94.7 -167.1
EBITA 773.8 594.8
Impairment of goodwill - -8.3
EBIT 773.8 586.5
Interest result -229.3 -252.8
Equity result Hapag-Lloyd -38.9 -22.3
EBT 505.6 311.4
Income taxes 221.7 145.0
Group result 283.9 166.4
Minority interest TUI Travel 112.7 114.3
Minority interest Hotels 66.5 63.2
Group result after minorities 104.7 -11.1
Hybrid dividend 22.8 23.6
EPS (€) 0.31 -0.14
Adjusted EPS (€) 0.46 -0.05
Net result for equity stake in
Hapag-Lloyd – since end of 04/2014
defined as asset held for sale
Net adjustments decreased
significantly
Reminder: Minority interest TUI Travel
will be transferred into equity post merger
Adjusted EPS stood at €0.46 – excluding
Hapag-Lloyd result
Interest result improved driven by lower
net debt position
23
Group balance sheet 30 Sep 2014 Net financial debt / net cash
TUI GROUP | Investor Relations | 13 - 14 January 2015
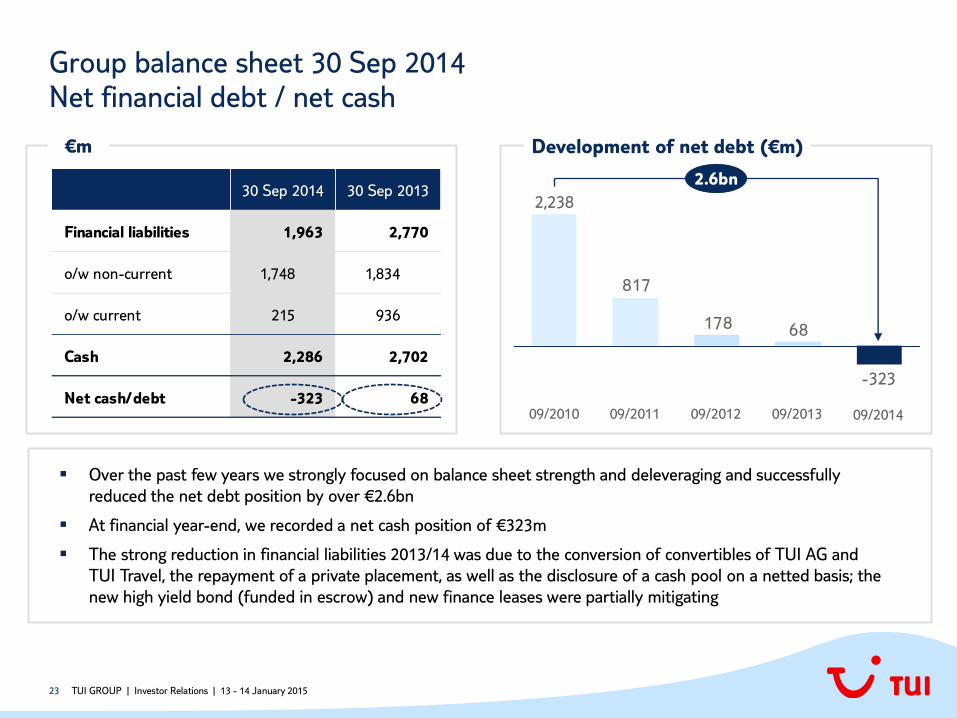
Over the past few years we strongly focused on balance sheet strength and deleveraging and successfully
reduced the net debt position by over €2.6bn
At financial year-end, we recorded a net cash position of €323m
The strong reduction in financial liabilities 2013/14 was due to the conversion of convertibles of TUI AG and
TUI Travel, the repayment of a private placement, as well as the disclosure of a cash pool on a netted basis; the
new high yield bond (funded in escrow) and new finance leases were partially mitigating
30 Sep 2014 30 Sep 2013
Financial liabilities 1,963 2,770
o/w non-current 1,748 1,834
o/w current 215 936
Cash 2,286 2,702
Net cash/debt -323 68
€m
-323
68178
817
09/2012 09/2013
2.6bn
09/2010
2,238
09/2011 09/2014
Development of net debt (€m)
24 TUI GROUP | Investor Relations | 13 - 14 January 2015
Review FY 2013/14
Merger with TUI Travel
Highlights 1
2
3
Outlook FY 2014/15 4
Agenda
25
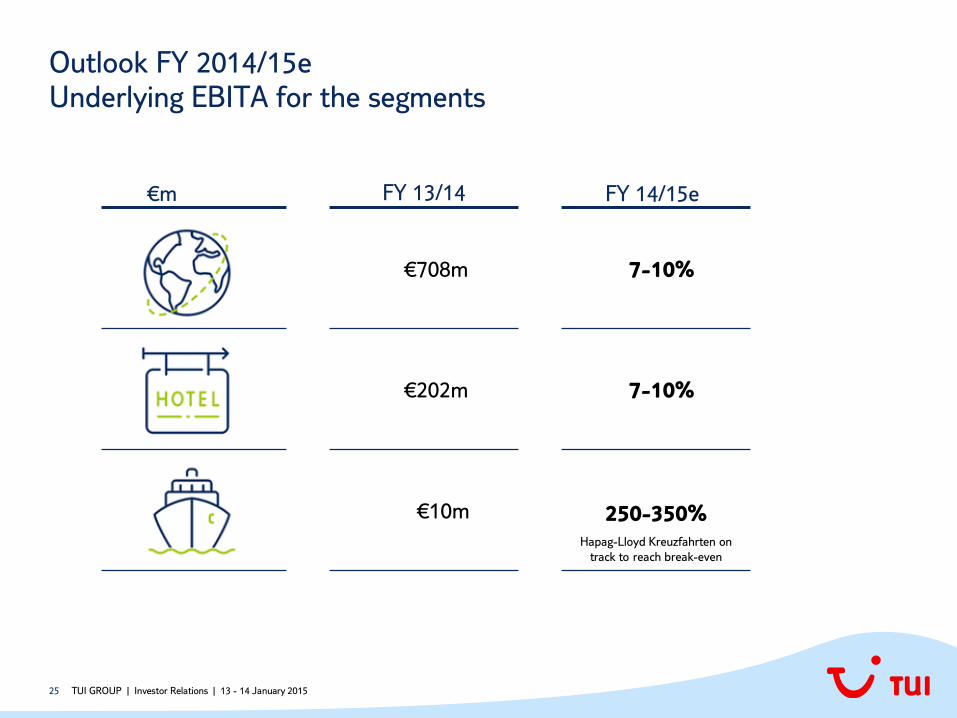
Outlook FY 2014/15e Underlying EBITA for the segments
TUI GROUP | Investor Relations | 13 - 14 January 2015
FY 14/15e FY 13/14 €m
€708m 7-10%
€202m 7-10%
€10m 250-350%
Hapag-Lloyd Kreuzfahrten on
track to reach break-even
26
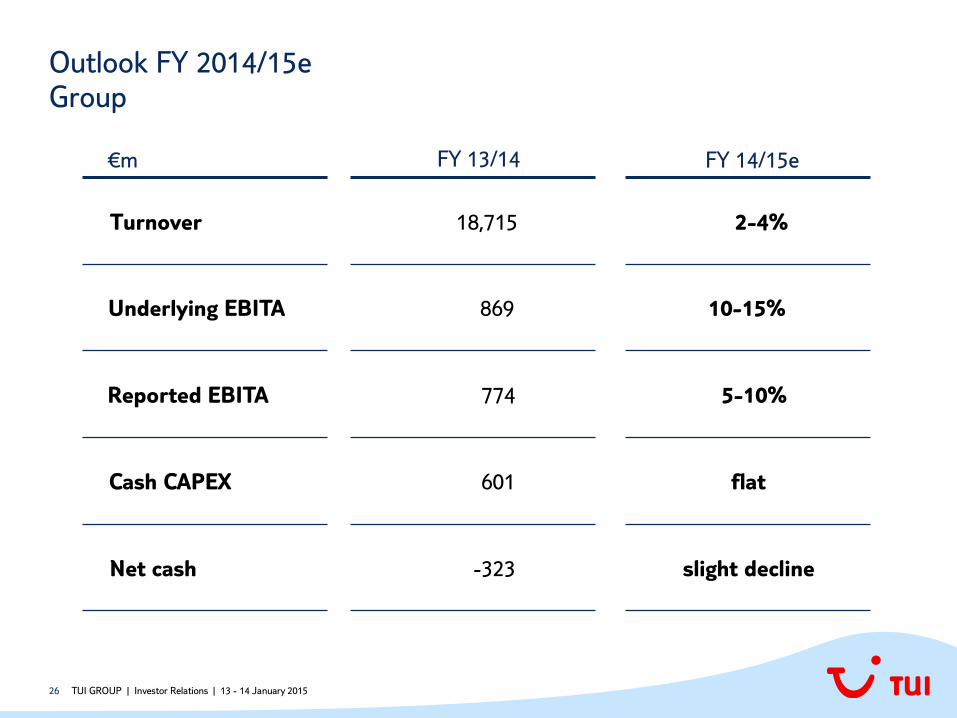
Outlook FY 2014/15e Group
TUI GROUP | Investor Relations | 13 - 14 January 2015
FY 14/15e FY 13/14 €m
2-4% Turnover 18,715
10-15% Underlying EBITA 869
5-10% Reported EBITA 774
flat Cash CAPEX 601
slight decline Net cash -323
27 27 TUI GROUP | Investor Relations | 13 - 14 January 2015
Appendix
28
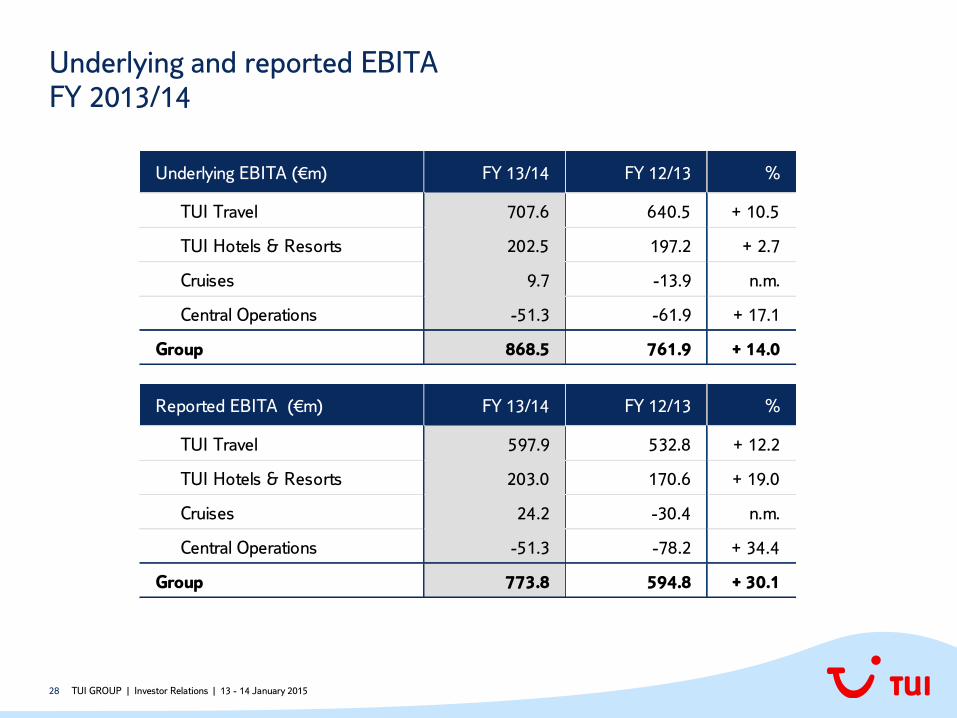
Underlying and reported EBITA FY 2013/14
Reported EBITA (€m) FY 13/14 FY 12/13 %
TUI Travel 597.9 532.8 + 12.2
TUI Hotels & Resorts 203.0 170.6 + 19.0
Cruises 24.2 -30.4 n.m.
Central Operations -51.3 -78.2 + 34.4
Group 773.8 594.8 + 30.1
Underlying EBITA (€m) FY 13/14 FY 12/13 %
TUI Travel 707.6 640.5 + 10.5
TUI Hotels & Resorts 202.5 197.2 + 2.7
Cruises 9.7 -13.9 n.m.
Central Operations -51.3 -61.9 + 17.1
Group 868.5 761.9 + 14.0
TUI GROUP | Investor Relations | 13 - 14 January 2015
29
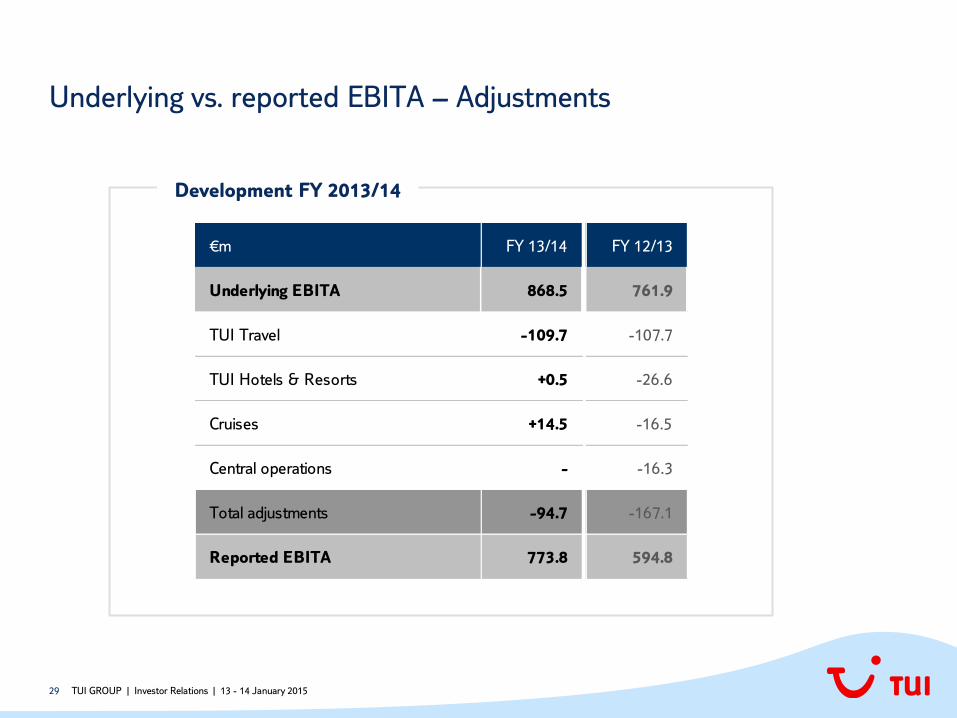
Underlying vs. reported EBITA – Adjustments
TUI GROUP | Investor Relations | 13 - 14 January 2015
€m FY 13/14 FY 12/13
Underlying EBITA 868.5 761.9
TUI Travel -109.7 -107.7
TUI Hotels & Resorts +0.5 -26.6
Cruises +14.5 -16.5
Central operations - -16.3
Total adjustments -94.7 -167.1
Reported EBITA 773.8 594.8
Development FY 2013/14
30
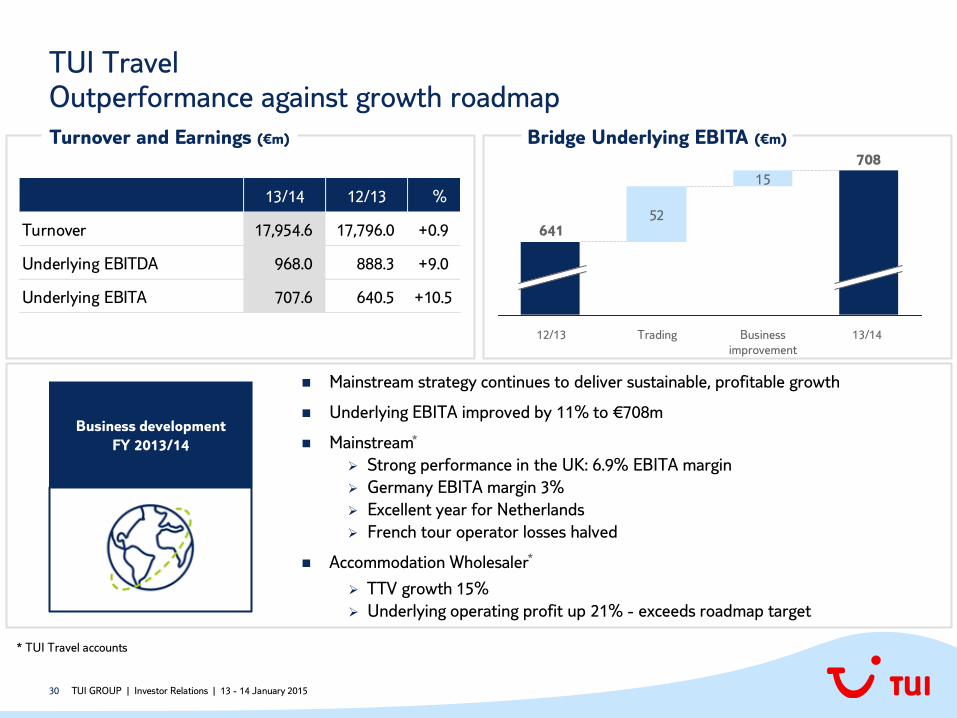
TUI Travel Outperformance against growth roadmap
TUI GROUP | Investor Relations | 13 - 14 January 2015
52
15
Business
improvement
13/14
708
Trading 12/13
641
Business development
FY 2013/14
Turnover and Earnings (€m)
13/14 12/13 %
Turnover 17,954.6 17,796.0 +0.9
Underlying EBITDA 968.0 888.3 +9.0
Underlying EBITA 707.6 640.5 +10.5
Bridge Underlying EBITA (€m)
Mainstream strategy continues to deliver sustainable, profitable growth
Underlying EBITA improved by 11% to €708m
Mainstream
Strong performance in the UK: 6.9% EBITA margin
Germany EBITA margin 3%
Excellent year for Netherlands
French tour operator losses halved
Accommodation Wholesaler
TTV growth 15%
Underlying operating profit up 21% - exceeds roadmap target
*
*
* TUI Travel accounts
31
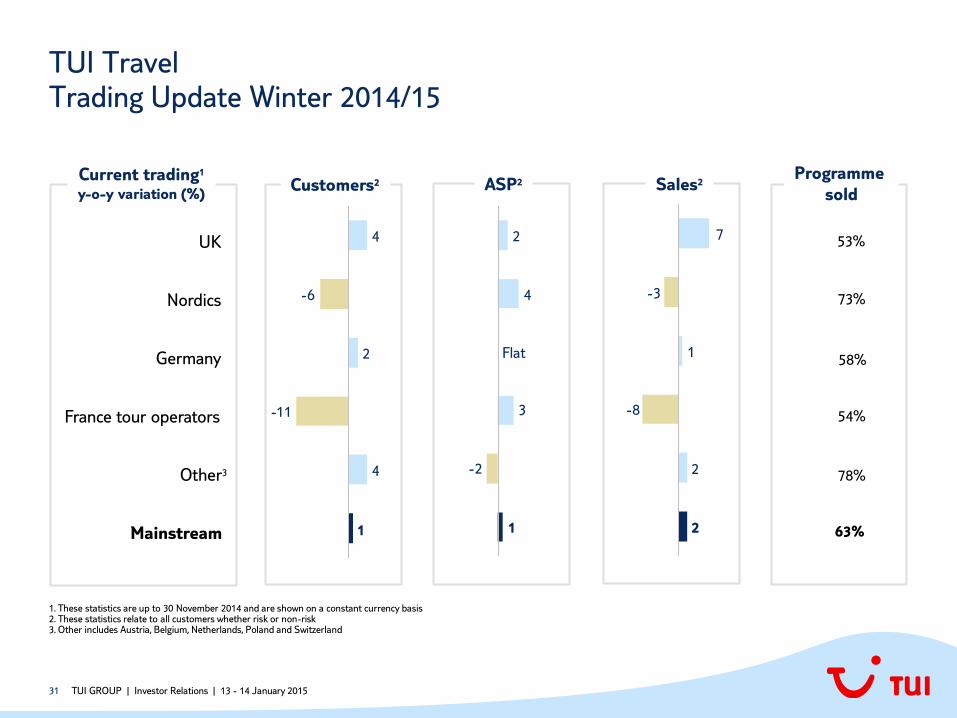
53%
TUI Travel Trading Update Winter 2014/15
ASP2
-2
3
2
1
Flat
4
Sales2 Customers2
4
-6
4
1
-11
2
UK
-8
-3
7
2
2
1
Nordics
Germany
France tour operators
Mainstream
Other3
Current trading1
y-o-y variation (%)
Programme
sold
73%
58%
54%
63%
1. These statistics are up to 30 November 2014 and are shown on a constant currency basis 2. These statistics relate to all customers whether risk or non-risk 3. Other includes Austria, Belgium, Netherlands, Poland and Switzerland
78%
TUI GROUP | Investor Relations | 13 - 14 January 2015
32
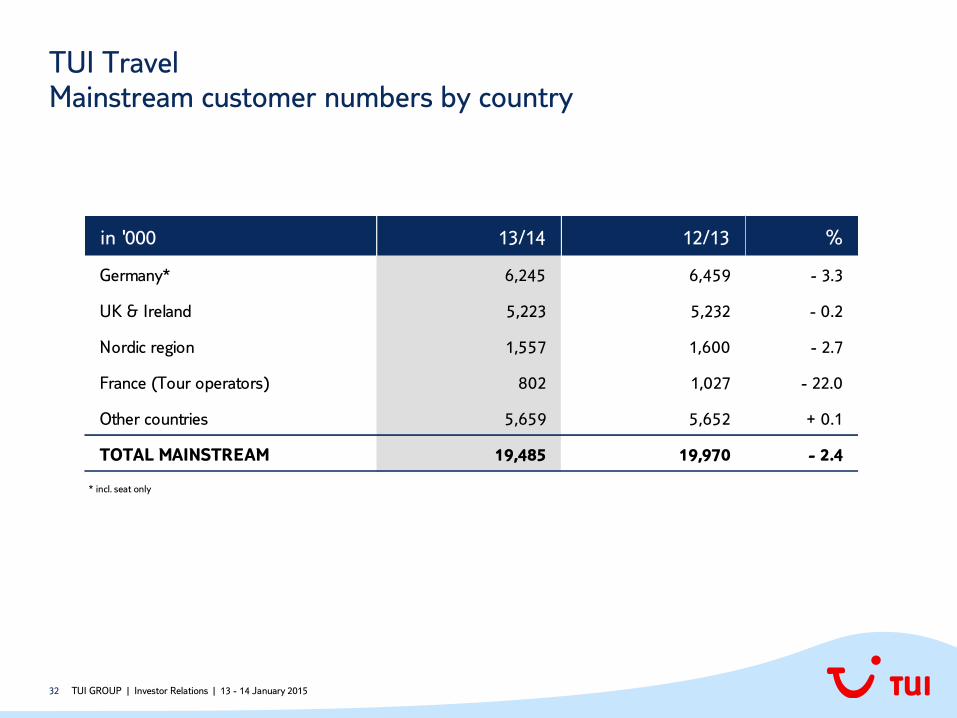
TUI Travel Mainstream customer numbers by country
in '000 13/14 12/13 %
Germany* 6,245 6,459 - 3.3
UK & Ireland 5,223 5,232 - 0.2
Nordic region 1,557 1,600 - 2.7
France (Tour operators) 802 1,027 - 22.0
Other countries 5,659 5,652 + 0.1
TOTAL MAINSTREAM 19,485 19,970 - 2.4
TUI GROUP | Investor Relations | 13 - 14 January 2015
* incl. seat only

33
TUI Hotels & Resorts Riu & Robinson with excellent performance
TUI GROUP | Investor Relations | 13 - 14 January 2015
24
202
13/14 Other
-5
-10 11
-15*
12/13
197
Turnover and Earnings (€m) Bridge Underlying EBITA (€m)
Business development
FY 2013/14
* disposal gain
13/14 12/13 %
Total Turnover 861.3 826.6 +4.2
o/w Turnover 3rd party 464.5 403.1 +15.3
Underlying EBITDA 266.6 271.1 -1.7
Underlying EBITA 202.5 197.2 +2.7
Underl. EBITA (excl. disposal gains) 202.5 182.2 +11.1
o/w Equity result 37.9 42.9
Total turnover up by 4% on good demand and higher average revenue per bed
Underlying EBITA improved by 3% to €202m, excluding disposal gains operating profit
was up by 11%
Riu continued its strong development with an increase in rev/bed and improved occupancy
on higher capacity; hotels in the Canaries benefited from a shift of customers from North
Africa
Robinson delivered strongly improved operating performance with higher rev/bed numbers
on lower capacity, and also benefited from an optimised hotel portfolio mix
Iberotel suffered from weaker demand due to the political situation in Egypt
34
11
24
20
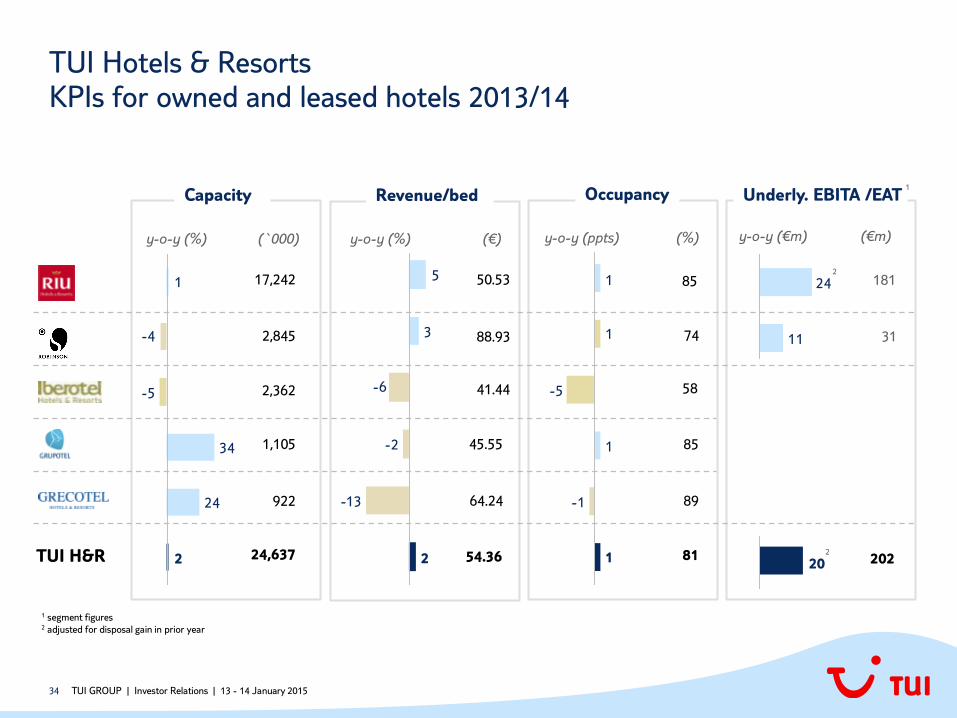
TUI Hotels & Resorts KPIs for owned and leased hotels 2013/14
TUI GROUP | Investor Relations | 13 - 14 January 2015
-2
-6
3
5
2
-13 24
34
-5
-4
1
2TUI H&R
17,242
2,845
2,362
24,637
50.53
88.93
41.44
54.36
8 1
85
-1
1
-5
1
1
1 81
Occupancy
1,105 45.55
89
Capacity Revenue/bed
y-o-y (%) (`000) y-o-y (%) (€) y-o-y (ppts) (%)
202
y-o-y (€m) (€m)
85
74
58
181
31
922 64.24
Underly. EBITA /EAT
1 segment figures 2 adjusted for disposal gain in prior year
2
1
2
35
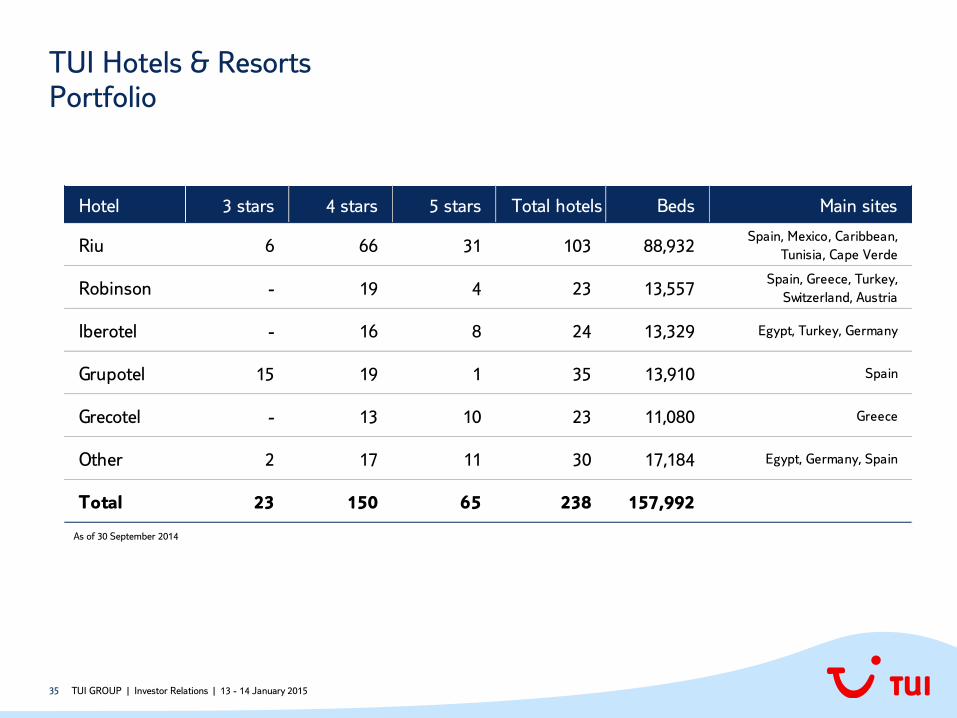
TUI Hotels & Resorts Portfolio
Hotel 3 stars 4 stars 5 stars Total hotels Beds Main sites
Riu 6 66 31 103 88,932Spain, Mexico, Caribbean,
Tunisia, Cape Verde
Robinson - 19 4 23 13,557Spain, Greece, Turkey,
Switzerland, Austria
Iberotel - 16 8 24 13,329 Egypt, Turkey, Germany
Grupotel 15 19 1 35 13,910 Spain
Grecotel - 13 10 23 11,080 Greece
Other 2 17 11 30 17,184 Egypt, Germany, Spain
Total 23 150 65 238 157,992
As of 30 September 2014
TUI GROUP | Investor Relations | 13 - 14 January 2015

36
Riu Portfolio
Mexico
Jamaica
Costa Rica
Panama
Aruba
USA
Bahamas
Cuba
Dom. Rep.
Cape Verde
Morocco
Tunisia
Spain
Portugal
Bulgaria
Turkey
St. Martin
Caribbean: 38 hotels
F L O
47%
M
53%
M = Management; O = Ownership; L = Lease; F = Franchise
F
100%
L O M
Western Med.: 37 hotels
F
3%
L
19%
O
59%
M
19%
North Africa: 15 hotels
O
20%
M
80%
F L
Other: 11 hotels
L F
9%
O
46%
M
45%
Eastern Med.: 2 hotels
TUI GROUP | Investor Relations | 13 - 14 January 2015
37
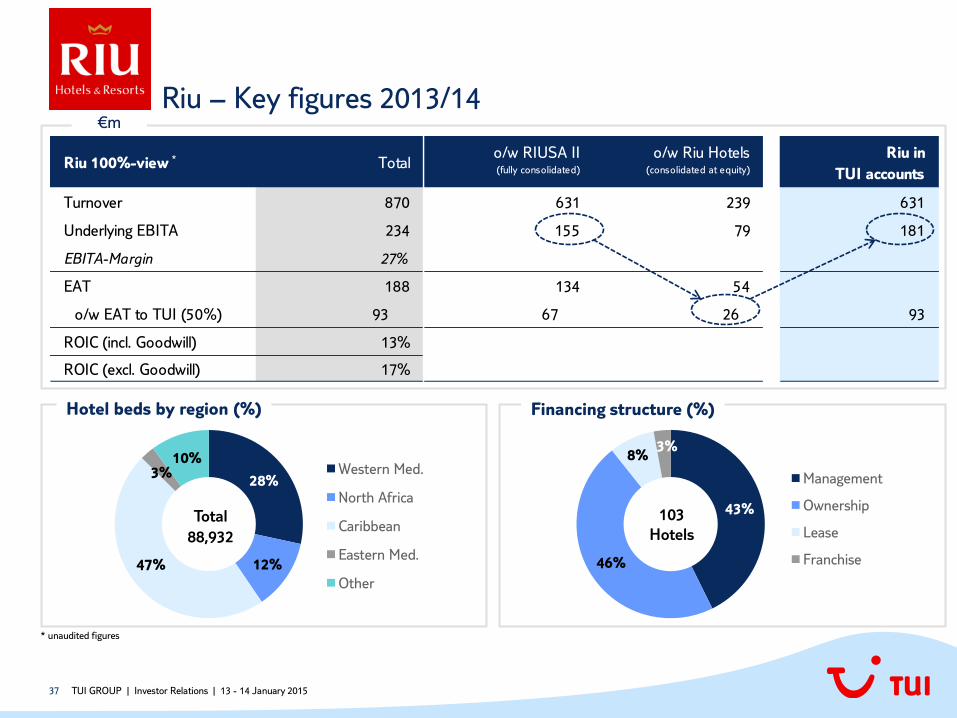
Riu 100%-view Total o/w RIUSA II
(fully consolidated)
o/w Riu Hotels(consolidated at equity)
Riu in
TUI accounts
Turnover 870 631 239 631
Underlying EBITA 234 155 79 181
EBITA-Margin 27%
EAT 188 134 54
o/w EAT to TUI (50%) 93 67 26 93
ROIC (incl. Goodwill) 13%
ROIC (excl. Goodwill) 17%
43%
46%
8% 3%
Management
Ownership
Lease
Franchise
Financing structure (%)
28%
12% 47%
3% 10%
Western Med.
North Africa
Caribbean
Eastern Med.
Other
Total
88,932
Hotel beds by region (%)
103
Hotels
Riu – Key figures 2013/14 €m
* unaudited figures
*
TUI GROUP | Investor Relations | 13 - 14 January 2015
38 TUI GROUP | Investor Relations | 13 - 14 January 2015
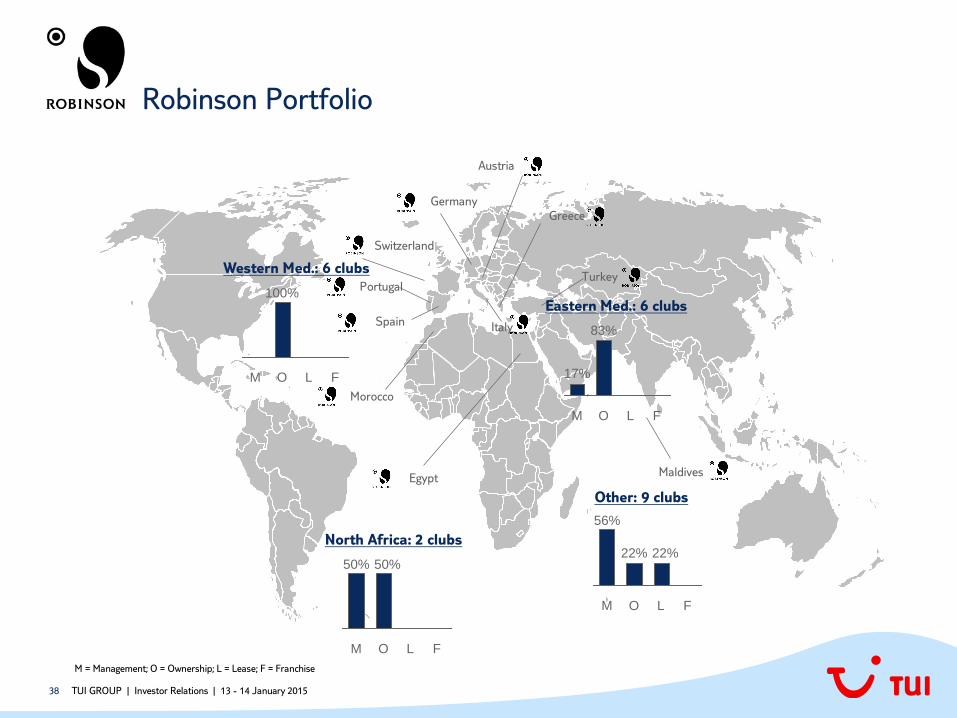
Robinson Portfolio
Spain
Portugal
Switzerland
Germany
Austria
Turkey
Greece
Italy
Morocco
Egypt Maldives
M = Management; O = Ownership; L = Lease; F = Franchise
Eastern Med.: 6 clubs
Western Med.: 6 clubs
F L O
100%
M
North Africa: 2 clubs
F L O
50%
M
50%
Other: 9 clubs
L F
22%
O
22%
M
56%
O
83%
M
17%
F L
39
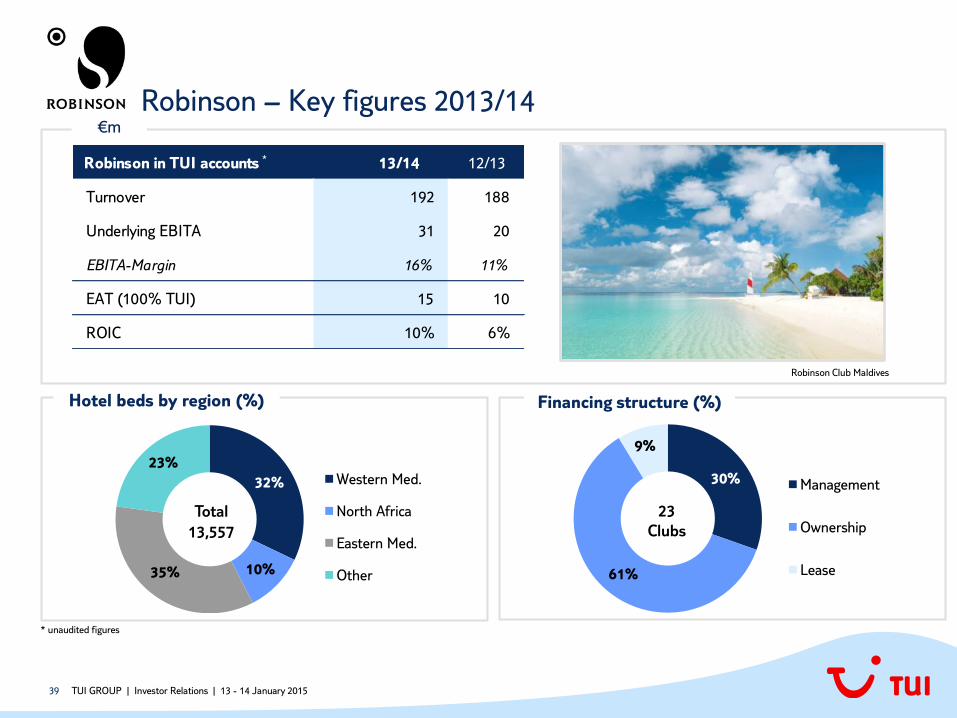
Robinson – Key figures 2013/14
Turnover 192 188
Underlying EBITA 31 20
EBITA-Margin 16% 11%
EAT (100% TUI) 15 10
ROIC 10% 6%
Robinson in TUI accounts 13/14 12/13
32%
10% 35%
23% Western Med.
North Africa
Eastern Med.
Other
Total
13,557
30%
61%
9%
Management
Ownership
Lease
Financing structure (%) Hotel beds by region (%)
23
Clubs
Robinson Club Maldives
* unaudited figures
*
TUI GROUP | Investor Relations | 13 - 14 January 2015
€m
40
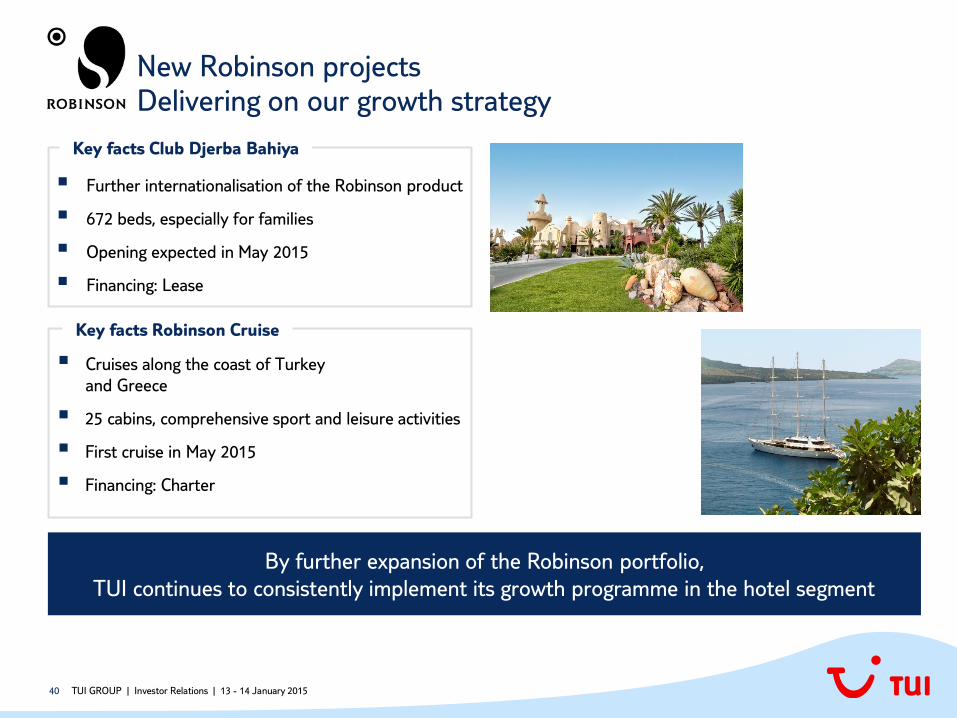
Cruises along the coast of Turkey
and Greece
25 cabins, comprehensive sport and leisure activities
First cruise in May 2015
Financing: Charter
New Robinson projects Delivering on our growth strategy
TUI GROUP | Investor Relations | 13 - 14 January 2015
Further internationalisation of the Robinson product
672 beds, especially for families
Opening expected in May 2015
Financing: Lease
By further expansion of the Robinson portfolio,
TUI continues to consistently implement its growth programme in the hotel segment
Key facts Club Djerba Bahiya
Key facts Robinson Cruise
41
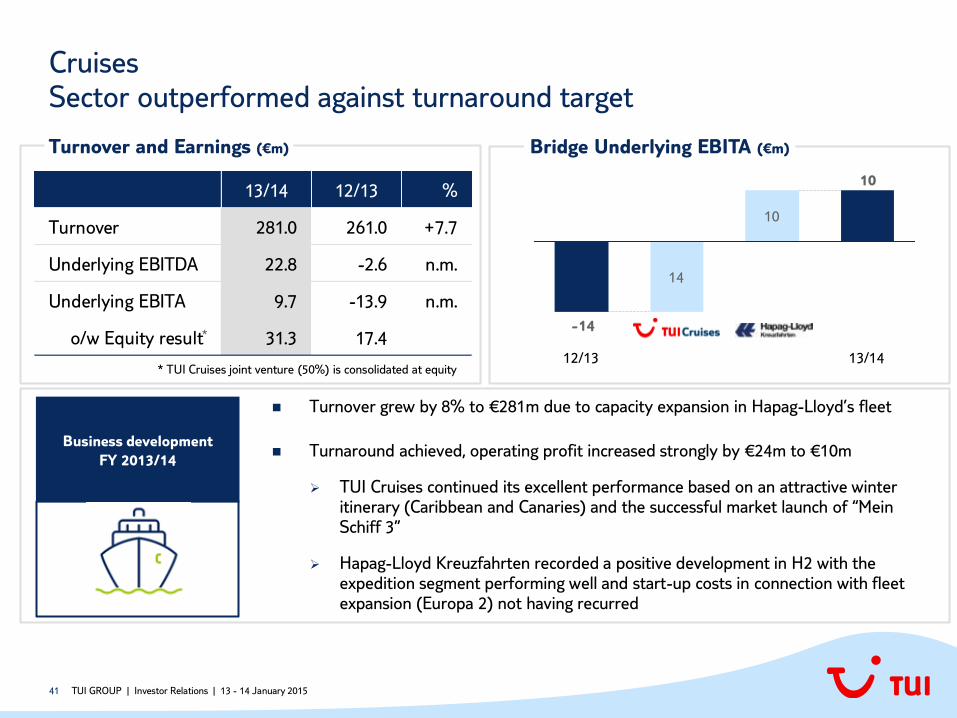
Cruises Sector outperformed against turnaround target
TUI GROUP | Investor Relations | 13 - 14 January 2015
Turnover and Earnings (€m) Bridge Underlying EBITA (€m)
* TUI Cruises joint venture (50%) is consolidated at equity
10
-14
13/14
10
14
12/13
Business development
FY 2013/14
13/14 12/13 %
Turnover 281.0 261.0 +7.7
Underlying EBITDA 22.8 -2.6 n.m.
Underlying EBITA 9.7 -13.9 n.m.
o/w Equity result 31.3 17.4
Turnover grew by 8% to €281m due to capacity expansion in Hapag-Lloyd’s fleet
Turnaround achieved, operating profit increased strongly by €24m to €10m
TUI Cruises continued its excellent performance based on an attractive winter itinerary (Caribbean and Canaries) and the successful market launch of “Mein Schiff 3”
Hapag-Lloyd Kreuzfahrten recorded a positive development in H2 with the expedition segment performing well and start-up costs in connection with fleet expansion (Europa 2) not having recurred
*
42
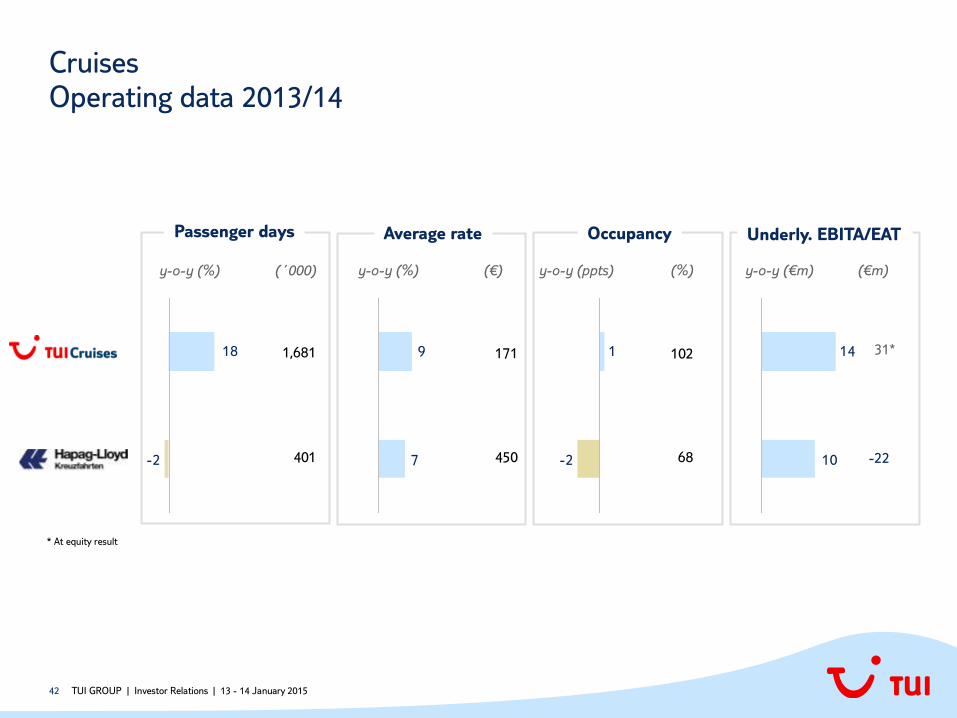
Cruises Operating data 2013/14
TUI GROUP | Investor Relations | 13 - 14 January 2015
-2
18 1,681
401
102
68
171
450 7
9
-2
1
Passenger days
y-o-y (%) (´000) y-o-y (%) (€)
Average rate Occupancy
y-o-y (ppts) (%)
10
14
y-o-y (€m) (€m)
31
-22
* At equity result
Underly. EBITA/EAT
*
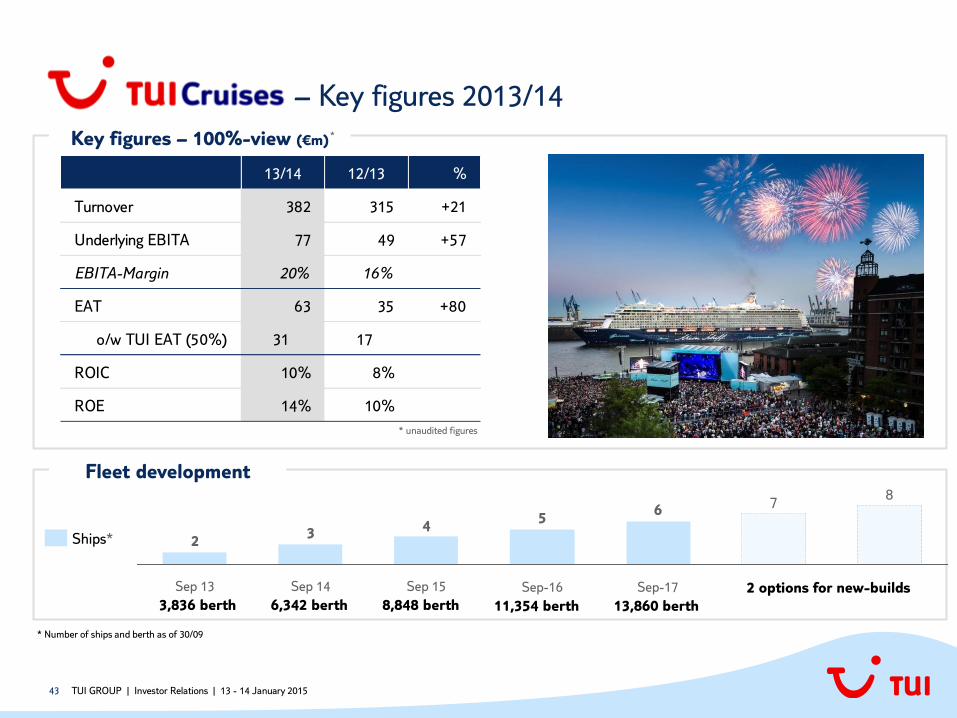
43 TUI GROUP | Investor Relations | 13 - 14 January 2015
13/14 12/13 %
Turnover 382 315 +21
Underlying EBITA 77 49 +57
EBITA-Margin 20% 16%
EAT 63 35 +80
o/w TUI EAT (50%) 31 17
ROIC 10% 8%
ROE 14% 10%
Key figures – 100%-view (€m)
– Key figures 2013/14
* unaudited figures
*
Fleet development
5
8 7
Sep-17
6
Sep-16 Sep 15
4
Sep 14
3
Sep 13
2 Ships*
3,836 berth 6,342 berth 8,848 berth 11,354 berth 13,860 berth
2 options for new-builds
* Number of ships and berth as of 30/09
44
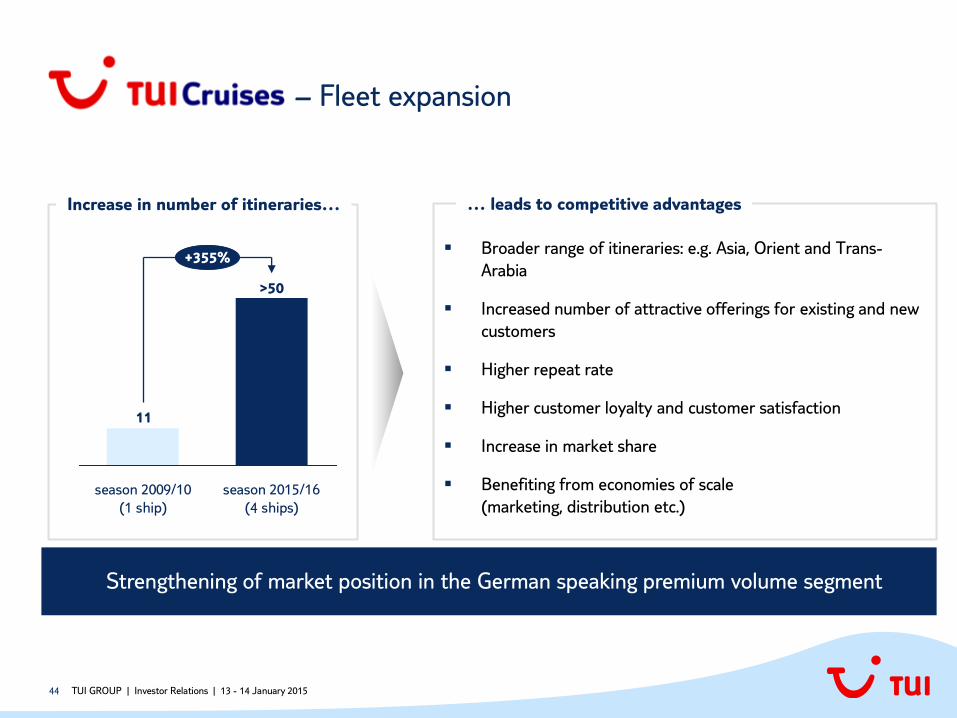
– Fleet expansion
11
season 2015/16
(4 ships)
season 2009/10
(1 ship)
+355%
>50
Increase in number of itineraries… … leads to competitive advantages
Broader range of itineraries: e.g. Asia, Orient and Trans-
Arabia
Increased number of attractive offerings for existing and new
customers
Higher repeat rate
Higher customer loyalty and customer satisfaction
Increase in market share
Benefiting from economies of scale
(marketing, distribution etc.)
Strengthening of market position in the German speaking premium volume segment
TUI GROUP | Investor Relations | 13 - 14 January 2015
45
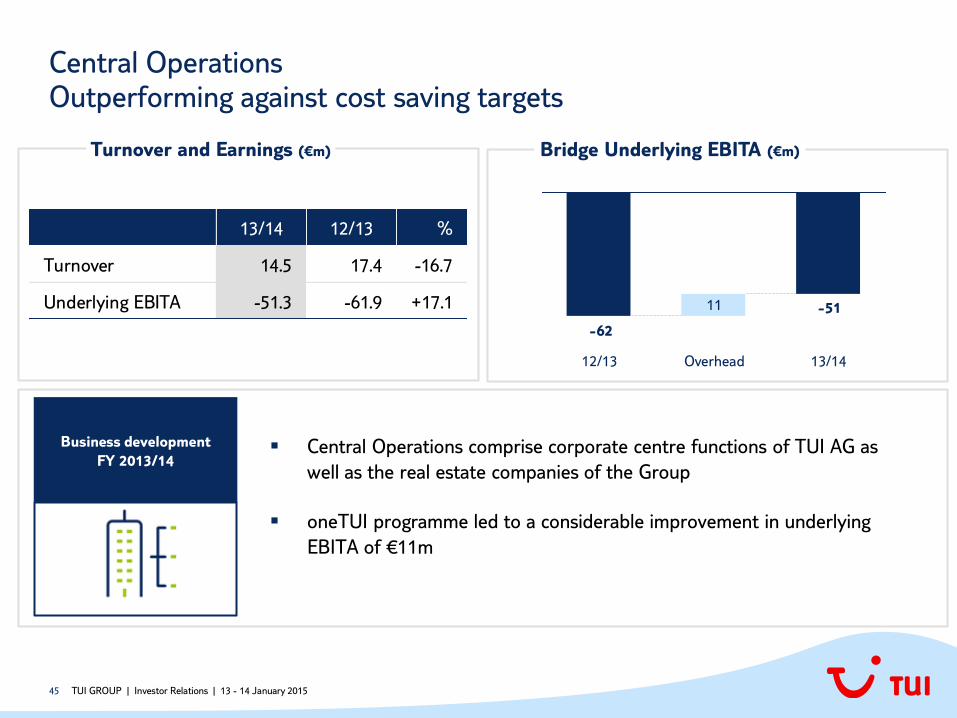
Central Operations Outperforming against cost saving targets
TUI GROUP | Investor Relations | 13 - 14 January 2015
Central Operations comprise corporate centre functions of TUI AG as
well as the real estate companies of the Group
oneTUI programme led to a considerable improvement in underlying
EBITA of €11m
Turnover and Earnings (€m) Bridge Underlying EBITA (€m)
Business development
FY 2013/14
-51
-62
13/14 Overhead
11
12/13
13/14 12/13 %
Turnover 14.5 17.4 -16.7
Underlying EBITA -51.3 -61.9 +17.1
46
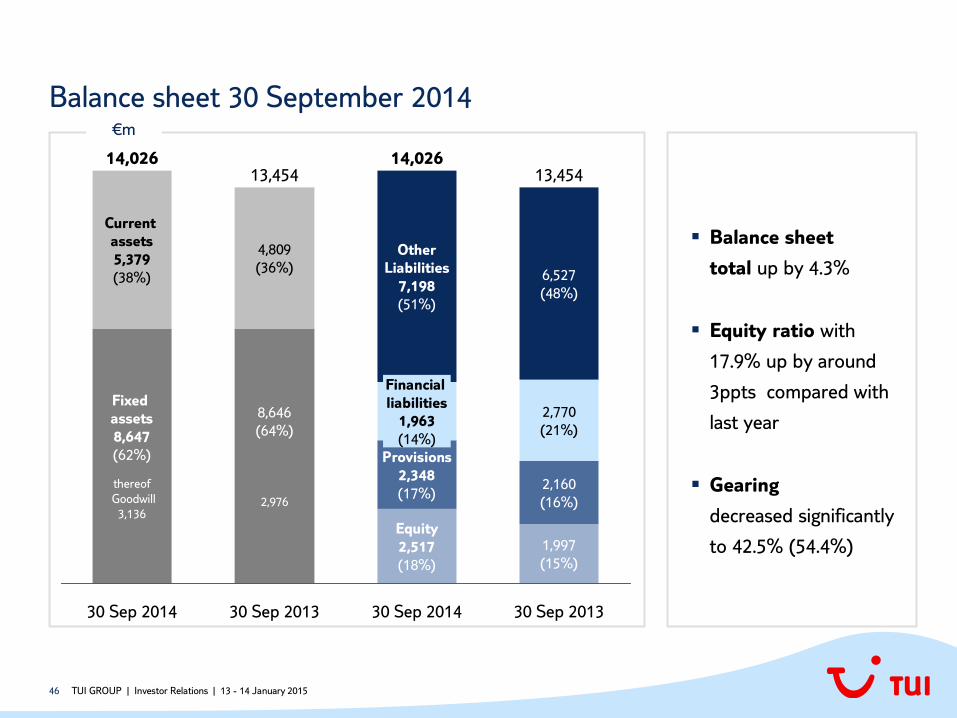
Balance sheet 30 September 2014
TUI GROUP | Investor Relations | 13 - 14 January 2015
Balance sheet
total up by 4.3%
Equity ratio with
17.9% up by around
3ppts compared with
last year
Gearing
decreased significantly
to 42.5% (54.4%)
30 Sep 2013
13,454
1,997
(15%)
2,160
(16%)
2,770
(21%)
6,527
(48%)
30 Sep 2014
14,026
Equity
2,517
(18%)
Provisions
2,348
(17%)
Financial
liabilities
1,963
(14%)
Other
Liabilities
7,198
(51%)
30 Sep 2013
13,454
8,646
(64%)
2,976
4,809
(36%)
30 Sep 2014
14,026
Fixed
assets
8,647
(62%)
thereof
Goodwill
3,136
Current
assets
5,379
(38%)
€m
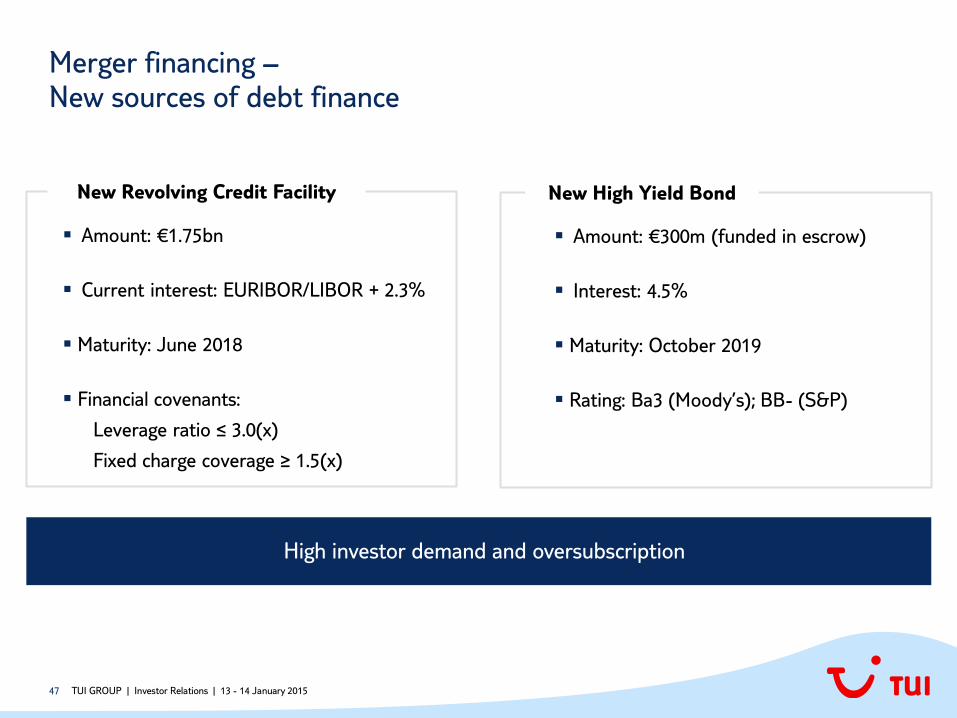
47
Amount: €1.75bn
Current interest: EURIBOR/LIBOR + 2.3%
Maturity: June 2018
Financial covenants:
Leverage ratio ≤ 3.0(x)
Fixed charge coverage ≥ 1.5(x)
High investor demand and oversubscription
Amount: €300m (funded in escrow)
Interest: 4.5%
Maturity: October 2019
Rating: Ba3 (Moody’s); BB- (S&P)
Merger financing – New sources of debt finance
TUI GROUP | Investor Relations | 13 - 14 January 2015
New Revolving Credit Facility New High Yield Bond
48
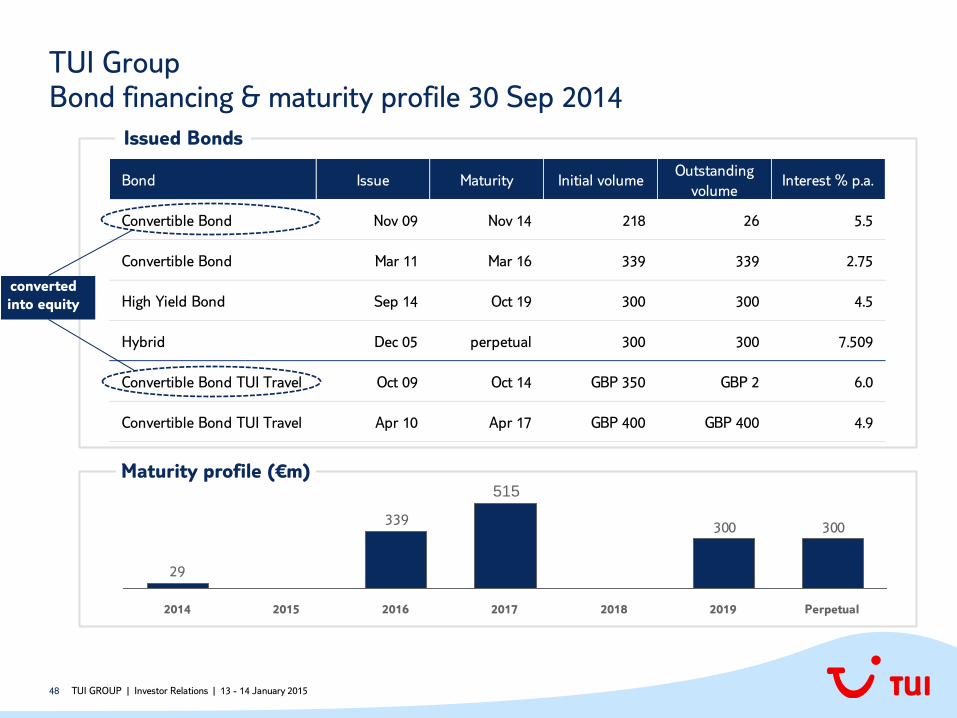
TUI Group Bond financing & maturity profile 30 Sep 2014
TUI GROUP | Investor Relations | 13 - 14 January 2015
Bond Issue Maturity Initial volumeOutstanding
volumeInterest % p.a.
Convertible Bond Nov 09 Nov 14 218 26 5.5
Convertible Bond Mar 11 Mar 16 339 339 2.75
High Yield Bond Sep 14 Oct 19 300 300 4.5
Hybrid Dec 05 perpetual 300 300 7.509
Convertible Bond TUI Travel Oct 09 Oct 14 GBP 350 GBP 2 6.0
Convertible Bond TUI Travel Apr 10 Apr 17 GBP 400 GBP 400 4.9
Issued Bonds
Maturity profile (€m)
300300339
29
515
2019 Perpetual 2018 2017 2016 2015 2014
converted
into equity
49
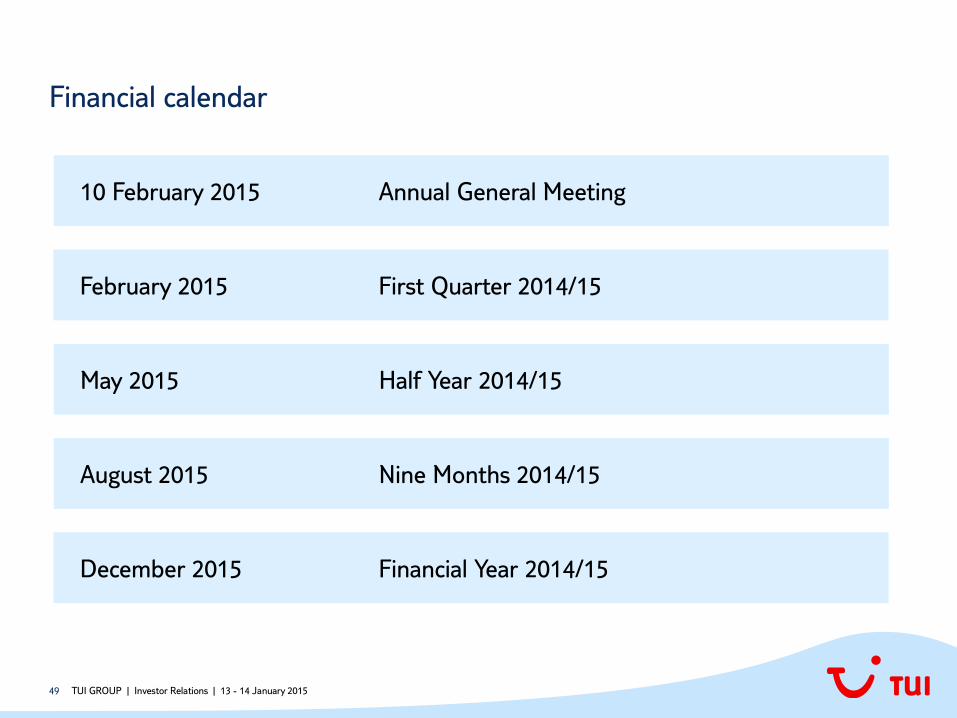
Financial calendar
10 February 2015 Annual General Meeting
February 2015 First Quarter 2014/15
May 2015 Half Year 2014/15
August 2015 Nine Months 2014/15
December 2015 Financial Year 2014/15
TUI GROUP | Investor Relations | 13 - 14 January 2015
50
Contact
TUI GROUP | Investor Relations | 13 - 14 January 2015
TUI GROUP Investor Relations
+49-511-566-1425