tui group annual general meeting 2016 · tui ag | annual general meeting 2016 ... turnover 20,012...
TRANSCRIPT

TUI GROUP Annual General Meeting 2016 Horst Baier – CFO

25
•
•
•
•
•
Highlights financial year 2014/15
TUI AG | Annual General Meeting 2016
• Turnover growth driven by increase in customer numbers and higher average
revenues
• Considerable improvement in underlying earnings, earnings guidance was
outperformed
• Group profit benefits from simplified Group structure and tax synergies
Highlights
FY 2014/15
* Continuing operations
26
•
•
•
•
•
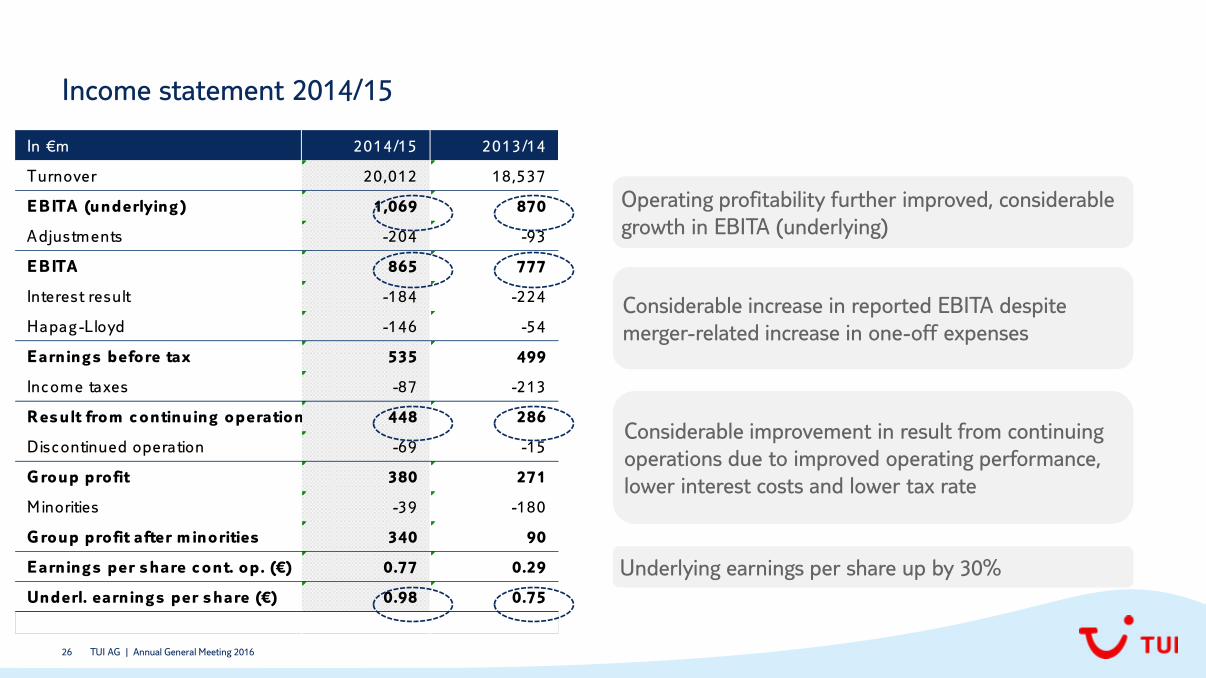
Income statement 2014/15
TUI AG | Annual General Meeting 2016
In €m 2014/15 2013/14
Turnover 20,012 18,537
E BITA (underlying ) 1,069 870
Adjustments -204 -93
E BITA 865 777
Interest result -184 -224
Hapag -Lloyd -146 -54
E arning s before tax 535 499
Income taxes -87 -213
Res ult from c ontinuing operation 448 286
Discontinued operation -69 -15
G roup profit 380 271
Minorities -39 -180
G roup profit after m inorities 340 90
E arning s per s hare c ont. op. (€) 0.777 0.29
Underl. earning s per s hare (€) 0.987 0.75
Operating profitability further improved, considerable
growth in EBITA (underlying)
Considerable improvement in result from continuing
operations due to improved operating performance,
lower interest costs and lower tax rate
Underlying earnings per share up by 30%
Considerable increase in reported EBITA despite
merger-related increase in one-off expenses
27
•
•
•
•
•
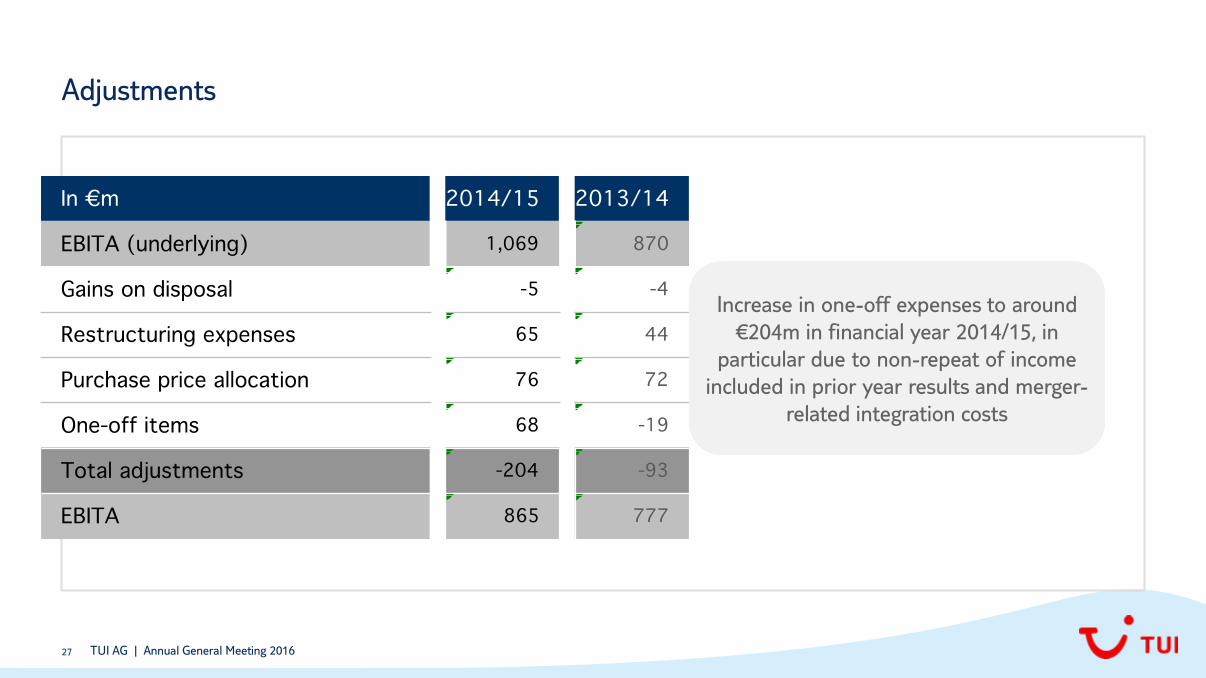
Adjustments
TUI AG | Annual General Meeting 2016
Increase in one-off expenses to around
€204m in financial year 2014/15, in
particular due to non-repeat of income
included in prior year results and merger-
related integration costs

28
•
•
•
•
•
Income statement 2014/15
TUI AG | Annual General Meeting 2016
Further improvement in operating profitability, major
increase in EBITA (underlying)
Major improvement in the result from continuing
operations due to improved operating performance,
lower interest costs and lower tax rate
Underlying earnings per share up by 30%
Major increase in reported EBITA despite merger-
related increase in one-off expenses

29
•
•
•
•
•
Financial position as at 30 Sep. 2015
TUI AG | Annual General Meeting 2016
Equity
Provisions
Financial debt
Other liabilities Current assets
Non-current assets
o/w goodwill
2,800 2,757
1,673 2,258
14,007
30 Sep
2014
8,992
30 Sep
2015
14,087
(3,220)
9,614
(3,136) 2,417 2,530
2,357 2,347
1,886 1,966
7,426 7,164
30 Sep
2014
+1%
14,007
30 Sep
2015
14,087
in €m
Assets Liabilities In €m
Cash and cash equiv.
17.2 18.1 Equity ratio

30
•
•
•
•
•
Net debt as at 30 September 2015
TUI AG | Annual General Meeting 2016
• Significant reduction of €2.1bn in TUI Group debt in the past six years
• Slight increase in TUI Group debt in the financial year under reivew, primarily driven by finance leases
• Financial stability and flexibility are the basis for our sustained growth
€m
2.287
817 178 68
(293)
214
€-2.1bn
09/2013 09/2014 09/2015 09/2011 09/2010 09/2012
Net debt TUI Group (€m)

31
•
•
•
•
•
Dividend proposal for financial year 2014/15
TUI AG | Annual General Meeting 2016
Proposed dividend of 56 cents reflects the strong growth in our operating result
Underlying EBITA (in €m) Dividend calculation (in €)
870
,1,069
+23%*
2014/15 2013/14
0.45 0.07
0.56
Dividend
proposal
2014/15
Better operating
performance
10%
bonus
0.05
Pro forma
dividend
2013/14 * 15% improvement on a constant currency basis
32
•
•
•
•
•
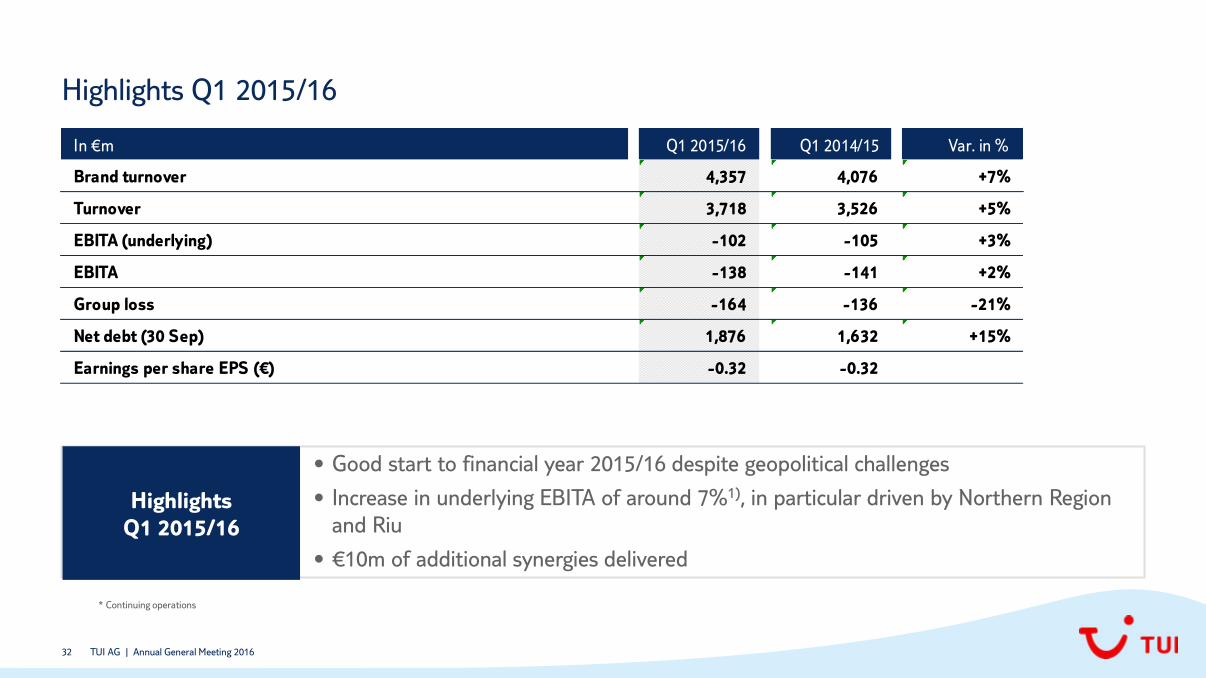
Highlights Q1 2015/16
TUI AG | Annual General Meeting 2016
• Good start to financial year 2015/16 despite geopolitical challenges
• Increase in underlying EBITA of around 7%1), in particular driven by Northern Region
and Riu
• €10m of additional synergies delivered
Highlights
Q1 2015/16
In €m Q1 2015/16 Q1 2014/15 Var. in %
Brand turnover 4,357 4,076 +7%
Turnover 3,718 3,526 +5%
EBITA (underlying) -102 -105 +3%
EBITA -138 -141 +2%
Group loss -164 -136 -21%
Net debt (30 Sep) 1,876 1,632 +15%
Earnings per share EPS (€) -0.32 -0.32
* Continuing operations

33
•
•
•
•
•
Operating performance in Q1 2015/16
TUI AG | Annual General Meeting 2016
Source Markets
2013/14
175,6
2012/13
175,6
2013/14
183,8
2012/13
183,8
2014/15
-78
2015/16
-82
• Northern Region delivers strong improvement in
performance
• Continued challenging trading conditions in Central
Region
• Western Region impacted by phasing of marketing
costs for TUI rebranding in the Netherlands
Highlights
• Riu delivers strong performance in the Canaries and
Caribbean; prior year result included book profit of
€16m
• Robinson impacted by higher marketing costs and
weak occupancy of the new club in Tunisia
Hotels & Resorts Highlights
2925
2014/15 2015/16
in €m
in €m

34
•
•
•
•
• • Good performance by Hapag-Lloyd Cruises, lower
capacity in Q1 due to scheduled dry-docking of
Europa and Hanseatic
• TUI Cruises: Strong demand for Mein Schiff 4
(launched in May 2015)
• Disappointing performance by specialist tour
operators in Q1, in particular due to geopolitical
uncertainty (Adventure) and poor snow conditions
(Ski)
Operating performance in Q1 2015/16
TUI AG | Annual General Meeting 2016
Cruises
2013/14
175,6
2012/13
175,6
2013/14
183,8
2012/13
183,8
28
2014/15 2015/16
Highlights
In €m
Specialist Travel Highlights
-19
2014/15 2015/16
-32
in €m
35
•
•
•
•
•
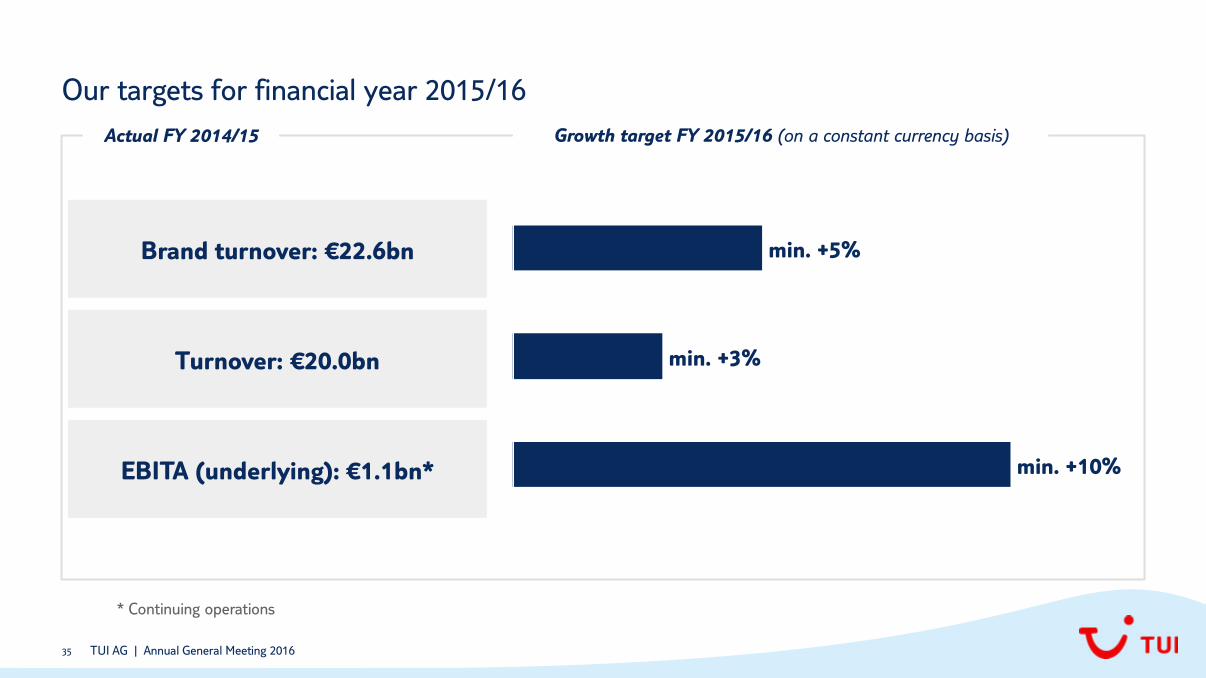
Our targets for financial year 2015/16
TUI AG | Annual General Meeting 2016
Brand turnover: €22.6bn
Turnover: €20.0bn
EBITA (underlying): €1.1bn*
* Continuing operations
min. +5%
min. +10%
min. +3%
Growth target FY 2015/16 (on a constant currency basis) Actual FY 2014/15

36
•
•
•
•
•
Agenda items 6 to 9
TUI AG | Annual General Meeting 2016
ITEMS:
Resolutions on authorisation to increase the share capital (ITEM 6), new authorised capital (ITEM 7), authorisation
to issue bonds (ITEM 8) and authorisation to acquire and use own shares (ITEM 9)
The Executive Board and Supervisory Board ask you for your approval of Items 6 to 9.

TUI GROUP Annual General Meeting 2016