tudor, pickering, holt annual hotter ‘n hell …crzo tudor, pickering, holt . 13. th. annual...
TRANSCRIPT

CRZO
TUDOR, PICKERING, HOLT 13TH ANNUAL HOTTER ‘N HELL ENERGY CONFERENCE Carrizo Oil & Gas June 20-22, 2017

CRZO 2 2
Forward Looking Statements / Note Regarding Reserves This presentation contains statements concerning the Company’s intentions, expectations, beliefs, projections, assessments of risks, estimations, plans or predictions for the future,
objectives, goals, strategies, future events or performance and underlying assumptions and other statements that are not historical facts. These statements are “forward-looking statements” within the meaning of the Private Securities Litigation Reform Act of 1995. The forward-looking statements in this presentation include, but are not limited to, statements relating to the Company’s business and financial outlook, cost and risk profile of oil and gas exploration and development activities, quality and risk profile of Company’s assets, liquidity and the ability to finance exploration and development activities, including accessibility of borrowings under the Company’s revolving credit facility, commodity price risk management activities and the impact of our average realized prices, growth strategies, ability to explore for and develop oil and gas resources successfully and economically, estimates and forecasts of the timing, number, profitability and other results of wells we expect to drill and other exploration activities, drilling inventory, downspacing, infill drilling and completion optimization results, estimates regarding timing and levels of production or reserves, estimated ultimate recovery, the Company’s capital expenditure plan and allocation by area, cost reductions and savings, efficiency of capital, the price of oil and gas at which projects break-even, future market conditions in the oil and gas industry, ability to make, integrate and develop acquisitions and realize any expected benefits or effects of completed acquisitions, midstream arrangements and agreements, gas marketing strategy, lease terms, expected working or net revenue interests, the ability to adhere to our drilling schedule, acquisition of acreage, including number, timing and size of projects, planned evaluation of prospects, probability of prospects having oil and gas, working capital requirements, liquids weighting, rates of return, net present value, 20167exploration and development plans, any other statements regarding future operations, financial results, business plans and cash needs and all other statements that are not historical facts. Statements in this presentation regarding availability under our revolving credit facility are based solely on the current borrowing base commitment amount and amounts outstanding on such date. The amounts we are able to borrow under the revolving credit facility are subject to, and may be less due to, compliance with financial covenants and other provisions of the credit agreement governing our revolving credit facility.
You generally can identify forward-looking statements by the words “anticipate,” “believe,” budgeted,” “continue,” “could,” “estimate,” “expect,” “forecast,” “goal,” “intend,” “may,” “objective,” “plan,” “potential,” “predict,” “projection,” “scheduled,” “should,” or other similar words. Such statements rely on assumptions and involve risks and uncertainties, many of which are beyond our control, including, but not limited to, those relating to a worldwide economic downturn, availability of financing, the Company’s dependence on its exploratory drilling activities, the volatility of and changes in oil and gas prices, the need to replace reserves depleted by production, operating risks of oil and gas operations, the Company’s dependence on key personnel, factors that affect the Company’s ability to manage its growth and achieve its business strategy, results, delays and uncertainties that may be encountered in drilling, development or production, interpretations and impact of oil and gas reserve estimation and disclosure requirements, activities and approvals of our partners and parties with whom we have alliances, technological changes, capital requirements, the timing and amount of borrowing base determinations (including determinations by lenders) and availability under our revolving credit facility, evaluations of us by lenders under our revolving credit facility, other actions by lenders, the potential impact of government regulations, including current and proposed legislation and regulations related to hydraulic fracturing, oil and natural gas drilling, air emissions and climate change, regulatory determinations, litigation, competition, the uncertainty of reserve information and future net revenue estimates, acquisition risks, availability of equipment and crews, actions by midstream and other industry participants, weather, our ability to obtain permits and licenses, the results of audits and assessments, the failure to obtain certain bank and lease consents, the existence and resolution of title defects, new taxes and impact fees, delays, costs and difficulties relating to our joint ventures, actions by joint venture parties, results of exploration activities, the availability and completion of land acquisitions, cost of oilfield services and equipment, completion and connection of wells, and other factors detailed in the “Risk Factors” and other sections of the Company’s Annual Report on Form 10-K for the year ended December 31, 2016 and other filings with the Securities and Exchange Commission (“SEC”). Should one or more of these risks or uncertainties materialize, or should underlying assumptions prove incorrect, actual outcomes may vary materially from those indicated.
Each forward-looking statement speaks only as of the date of the particular statement or, if not stated, the date printed on the cover of the presentation. When used in this presentation, the word “current” and similar expressions refer to the date printed on the cover of the presentation. Each forward-looking statement is expressly qualified by this cautionary statement and the Company undertakes no obligation to update or revise any forward-looking statement, whether as a result of new information, future events or otherwise. All subsequent written and oral forward-looking statements attributable to us or persons acting on our behalf are expressly qualified in their entirety by reference to these risks and uncertainties. You should not place undue reliance on forward-looking statements. The information contained in this presentation does not purport to be all-inclusive or to contain all information that potential investors may require.
We may use certain terms such as “Resource Potential” that the SEC’s guidelines strictly prohibit us from including in filings with the SEC. Our Probable (2P) and Possible (3P) reserves do not meet SEC rules and guidelines (including those relating to pricing) for such reserves. These terms include reserves with substantially less certainty, and no discount or other adjustment is included in the presentation of such reserve numbers. U.S. investors are urged to consider closely the disclosure in our Form 10-K for the year ended December 31, 2016, File No. 000-29187-87, and in our other filings with the SEC, available from us at 500 Dallas, Suite 2300, Houston, Texas, 77002. These forms can also be obtained from the SEC by calling 1-800-SEC-0330.

CRZO 3 3
Carrizo Overview
Deep Inventory of highly-economical drilling locations >160,000 net acres across the Eagle Ford Shale, Delaware
Basin, and Niobrara Formation
>2,000 net horizontal locations in inventory, equivalent to >775 MMBoe of net unbooked reserve potential, with significant additional upside potential
Highly experienced, efficient operator Management team has drilled >800 horizontal wells
EURs consistently rank among the best in our core areas
Operating costs and margin consistently outperform peers
Solid financial position / liquidity First-quarter 2017 Net Debt-to-EBITDA of ~3.3x
Significant liquidity available under the revolver
No near-term debt maturities
Hedged through 2018
Strong production growth Added a 3rd full-time Eagle Ford rig in early 2017
Targeting 26% crude oil production growth in 2017
Targeting a 3-year crude oil production CAGR of >20%
Net Acreage Position
Net Undrilled Locations
Eagle Ford Shale 103,300 >1,200 Delaware Basin 26,100 >240
Niobrara Formation 31,200 >640 Total >160,000 >2,000
Niobrara Formation
Delaware Basin
Eagle Ford Shale
Utica Shale
Marcellus Shale
Focus Areas

CRZO 4 4
Liquidity Position Remains Strong No Near-term Maturities and Ample Flexibility on the Revolver
$0$100$200$300$400$500$600$700$800$900
2017 2018July
2019 2020Sept
2021 2022 2023April
$MM
7.5% Notes 6.25% Notes
$800 Revolver
*Q2 production based on midpoint of Q2 guidance provided May 9, 2017; Q3-Q4 production is implied based on full-year 2017 guidance.
Debt Maturities as of 3/31/2017
$50.13 $53.71 $53.86 $50.00
$0
$10
$20
$30
$40
$50
$60
$70
$80
0
5
10
15
20
25
30
35
40
Q2'17 Q3'17 Q4'17 FY18
Hedg
ed P
ricin
g $/
Bbl
Prod
uctio
n (M
Bbls
/d)
Swap Volume Unhedged Production
Weighted Average Floor Price
Crude Hedges*
Revolving Credit Facility $800 million borrowing base commitment with
interest rate of LIBOR + 2.0%-3.0%
Consortium of 19 banks led by Wells Fargo
Restrictive covenants
• Total Net Debt < 4.0x TTM Adj. EBITDA
7.50% Senior Unsecured Notes (due 2020) $600 million outstanding
Currently callable
No liquidity or performance-based covenants
6.25% Senior Unsecured Notes (due 2023) $650 million outstanding
Callable on April 15, 2018
No liquidity or performance-based covenants
Corporate Credit Rating B2/B+

CRZO 5 5
2017 Capital Program
Eagle Ford D&C
Delaware Basin D&C
Other D&C
Pipeline & Infra.
Continued focus on high-return oily plays
3-rig development program in the Eagle Ford
Further development / delineation of Delaware Basin assets
Funds non-operated activity
Results in strong year-over-year production growth in 2017 and sets up for strong growth in future years
2017 Planned DC&I Capital Program - $540 MM
CAPEX Program Detail
Eagle Ford D&C 410 Delaware Basin D&C 45 Other D&C 30 Pipeline & Infrastructure 55
(All figures in $MM)
90% Drilling &
Completion
Note: 2017 capital program estimates represent the midpoint of guidance range.

CRZO 6 6
0
10
20
30
40
50
60
FY14 FY15 FY16 FY17E
Net
Dai
ly P
rod.
(MBo
e/d)
0
10
20
30
40
50
FY14 FY15 FY16 FY17E FY18E FY19E
Net
Dai
ly P
rod.
(MBb
ls/d
)
Strong Multi-year Production Growth Outlook
Marcellus Utica / Other
Niobrara Delaware Basin
Eagle Ford
Total Production Crude Oil Production

CRZO 7 CRZO 7 7 CRZO 7
Acreage almost entirely in the volatile oil window 10-15 year drilling inventory with all locations identified, planned, and de-risked Multiple inventory expansion and completion optimization initiatives underway
Project To Date 523 gross / 462 net wells drilled 30 gross / 27 net wells WOC
2017 Operated Activity 3-rig drilling program Drill 106 gross / 91 net wells Frac 94 gross / 85 net wells
Eagle Ford Shale A Premier Industry Asset
Eagle Ford Shale Overview Net Acres 103,300
Net Undrilled Locations >1,200
EUR / Well (Mboe) 300-700
Spacing Between Laterals (Ft.) 165-500
Effective Lateral Length (Ft.) ~6,300
Net Undrilled Resource Potential(1) (MMboe) >485
(1)Includes 99 MMboe of PUDs.

CRZO 8 CRZO 8 8 CRZO 8
Eagle Ford Shale Optimizing Development Spacing
Early stagger-stack results have been positive Prior development spacing was 330’ between laterals Successful results at Brown Trust, RPG, and Irvin Ranch
testing effective lateral spacing of 165’ to 285’ Five additional stagger stack pilots either online or
being drilled and completed
Future development potential in the Upper Eagle Ford and Austin Chalk
Industry has successfully tested both formations in the Eagle Ford trend
Carrizo drilled its initial Upper Eagle Ford test in 2015 No locations from either formation included in current
inventory count
Recent infill drilling test was successful Irvin 1H was drilled between two five-year-old wells
• Produced ~75 Mbo in 14 months • Positive production response seen in offsetting
parent wells Planning to drill initial infill test on recently-acquired
acreage
Continued success in spacing initiatives should lead to further expansion of drilling inventory and resource potential
Austin Chalk
Upper Eagle Ford Shale
Lower Eagle Ford Shale
Buda
Potential Bench Development
Stagger Stack Initiative

CRZO 9 9
Eagle Ford Shale Optimizing Completion Techniques
Completed 28 wells with tighter frac stage spacing
200’ stage-spaced wells have outperformed 240’ stage-spaced wells by ~18%
Tighter stage spacing also appears to minimize frac interference between new wells and offsetting parent wells
Currently testing 175’-180’ stage spacing
200’ stage-spaced well average 240’ stage-spaced well average
Performance of Pena 50 vs. Pena 40 Pad
0
10
20
30
40
50
60
70
80
90
100
110
0 30 60 90 120 150 180 210
Cum
ulat
ive
Oil,
MBO
Days on Production

CRZO 10 10
9%
10%
3%
15%
3%
22%
8%
14%
3%
2%
4%
4%
3%
Arnold Winfield
Brown Trust
Gardendale
Irvin
NE LaSalle
North LaSalle
Pena Jasik
RPG
Mumme
Mumme East
Pierce
SE Cotulla Tier 1
SE Cotulla Tier 2
59%
25%
7%
9%
>100%
75%-100%
50%-75%
<50%
Eagle Ford Shale Inventory Detail
Note: Eagle Ford locations reflect current inventory assumptions only. IRRs assume $3/Mcf NYMEX gas price.
Inventory by Area Inventory by IRR (@ $55/Bbl NYMEX)
Core Tier 1
IRR Area

CRZO 11 CRZO 11
Operational efficiencies in Q1’17 more than offset a double-digit increase in frac prices
Dedicated frac crew currently completing ~8 stages per day versus ~7 in 2015
Currently drilling ~40% more wells per rig-month versus 2015 pace
Efficiency gains have helped drive a reduction in completed well costs despite an increase in average lateral length and frac stages per well
Eagle Ford Shale Consistent Focus on Efficiency Gains
6,000
6,050
6,100
6,150
6,200
6,250
6,300
6,350
$0
$1
$2
$3
$4
$5
$6
$7
1Q'15 2Q'15 3Q'15 4Q'15 1Q'16 2Q'16 3Q'16 4Q'16 1Q'17
Lateral Length (ft.)
Wel
l Cos
t ($M
M)
Avg. Well Cost Avg. Lateral Length
5
10
15
20
25
30
Jan Feb Mar Apr May Jun Jul Aug Sep Oct Nov Dec
Thou
sand
Fee
t
2013 2014 2015 2016 2017
Historical Well Cost Trend
Effective Lateral Drilled per Rig-Month (6-month Avg.)

CRZO 12 CRZO 12 12 CRZO 12
Eagle Ford Shale Well Economics Summary
Type Curve Core Tier 1
Total Well Cost $4.0 MM $4.2 MM
Frac Stages 31.6 32.1
Lateral Length 6,300 ft. 6,400 ft.
Percent of Inventory 84% 16%
EUR
Gross 553 Mboe 403 Mboe
Oil Only 423 Mbo 233 Mbo
Net 419 Mboe 320 Mboe
F&D Cost $9.55 / Boe $13.13 / Boe
IRR &
NPV (1)
$75 Oil IRR >250% 96%
NPV $9.2 MM $3.7 MM
$65 Oil IRR >150% 56%
NPV $7.1 MM $2.5 MM
$55 Oil IRR 116% 28%
NPV $5.1 MM $1.2 MM
$45 Oil IRR 58% 10%
NPV $3.0 MM
NYMEX NPV10 Breakeven $30.50 $45.00
(1) Economics based on NYMEX prices and include ~$2.50/Bbl deduct for oil, $3.00/Mcf NYMEX gas price, NGL pricing 29% of NYMEX oil price.
(2) Total well cost includes ~$200K for allocated infrastructure.
Daily Production, BOPD Cum Production, MBO
0
15
30
45
60
75
90
105
120
135
150
165
180
195
210
0
50
100
150
200
250
300
350
400
450
500
550
600
650
700
0 2 4 6 8 10 12 14 16 18 20 22 24
Cum
ulat
ive
Oil,
MBO
Daily
Ave
rage
Oil,
BO
PD
Producing Months

CRZO 13 CRZO 13 13 CRZO 13
Delaware Basin High-return, Stacked-pay Potential
Targeting Wolfcamp formation in areas with potential for stacked-pay development Recent strong well results have delineated northern acreage position Nearby industry activity accelerating Continue to seek accretive acreage expansion opportunities
Project To Date 8 gross / 8 net wells drilled 1 gross / 1 net well WOC
2017 Operated Activity Drill 6 gross / 6 net wells Frac 6 gross / 5 net wells
Delaware Basin Overview Net Acres 26,100
Net Undrilled Locations >240
EUR / Well (Mboe) 900-2,100
Spacing between Laterals (Ft.) 660
Effective Lateral Length (Ft.) ~7,000
Net Undrilled Resource Potential(1) (MMboe) >275
(1)Includes 8 MMboe of PUDs.

CRZO 14 14
Delaware Basin Potential Hydrocarbon Column of More Than 4,000’
1st Bone Spring
2nd Bone Spring
3rd Bone Spring
Wolfcamp X/Y Wolfcamp A
Wolfcamp B
Wolfcamp C Wolfcamp D
Five to seven potential development targets exist across the acreage position
Current inventory count assumes development of only three layers
Carrizo has production from the Wolfcamp A, Wolfcamp B, and Bone Spring
Nearby industry wells also have production from the Wolfcamp X/Y and Wolfcamp C
Operated activity currently focused on the Wolfcamp A
Section is >200’ thick Oiliest of target Wolfcamp formations Potential for two separate landing zones
*Formations not drawn to scale.

CRZO 15 15
Delaware Basin Initial Development Area
Liberator State 1H (30-day rate: 1,400 Boe/d (35% oil, 25% gas, 40% NGL)
Corsair State 3H 30-day rate: 1,227 Boe/d (40% oil, 25% gas, 35% NGL)
Fortress State 1H 30-day rate: 1,520 Boe/d (25% oil, 36% gas, 39% NGL)
BHP 113-24x1 1H 30-day rate: 961 Boe/d (52% oil, 48% wet gas) BHP 113-23x14 1H
30-day rate: 2,022 Boe/d (32% oil, 68% wet gas)
BHP 113-10 1H 30-day rate: 1,110 Boe/d (48% oil, 52% wet gas)
3ROC Wise West State 0703WA 30-day rate: 1,399 Boe/d (40% oil, 60% gas)

CRZO 16 16 16
Delaware Basin Well Economics Summary
Type Curve Wolfcamp A
Total Well Cost $7.0 MM
Frac Stages 31
Lateral Length 7,000 ft.
EUR
Gross 1,862 Mboe
Oil 712 Mbo
Net 1,396 Mboe
F&D Cost $5.01 / Boe
IRR &
NPV (1)
$75 Oil IRR ~200%
NPV10 $18.3 MM
$65 Oil IRR >150%
NPV10 $14.7 MM
$55 Oil IRR 92%
NPV10 $11.1 MM
$45 Oil IRR 57%
NPV10 $7.6 MM
NYMEX NPV10 Breakeven $23.75
(1) Economics based on NYMEX prices and include $3.00/Mcf gas price, $4.00/Bbl deduct for oil, $0.97/Mcf deduct for gas, NGL pricing 30% of oil price.
(2) Water disposal is assumed to be $0.75/bbl. (3) Total well cost includes ~$500K for allocated infrastructure.
0
50
100
150
200
250
300
350
0
100
200
300
400
500
600
700
0 2 4 6 8 10 12 14 16 18 20 22 24
Cum
ulat
ive
Oil
- MBO
, Gas
- M
BOE
Oil
- BO
PD, G
as -
BOEP
D
Producing Months
Daily Oil Daily Wet GasCumulative Oil Cumulative Wet Gas

CRZO 17 17
Niobrara Formation Materially Improving Economics
Niobrara Formation Overview Net Acres 31,200
Net Undrilled Locations >640
EUR / Well (Mboe) 150-350
Spacing between Laterals (Ft.) 300/450
Effective Lateral Length (Ft.) 4,200
Net Undrilled Resource Potential (MMboe) >125
Acreage mostly HBP’d Stacked-pay nature provides development potential in the Niobrara A, B, and C benches New completion designs resulting in 20%-30% uplift in productivity Nearby industry testing of the deeper Codell formation could add another layer of potential
Project To Date 132 gross / 59 net wells drilled
CRZO 18 CRZO 18 18 CRZO 18
Acreage position provides years of high-return drilling inventory
Solid financial position provides ample flexibility to fund growth
Top-tier operational team with significant experience in unconventional plays
Positioned to capitalize on opportunities
Summary

Appendix

CRZO 20 CRZO 20 20 CRZO 20
Guidance Summary
Carrizo Production and Cost Guidance Trailing Four Quarter Actuals
Q2 2017 and FY 2017 Guidance
ACTUAL GUIDANCE*
Q2 2016 Q3 2016 Q4 2016 Q1 2017 Q2 2017 FY 2017
Production Volumes: Crude Oil (Bbls/d) 23,942 24,488 28,727 28,844 31,800 - 32,200 32,400 - 32,700 NGLs (Bbls/d) 5,217 4,730 5,048 4,508 4,800 - 5,000 5,300 - 5,500 Natural Gas (Mcf/d) 74,248 69,262 65,999 78,088 67,000 - 71,000 71,000 - 75,000 Equivalent Production (Boe/d) 41,533 40,762 44,775 46,367 47,767 - 49,033 49,533 - 50,700
Unhedged Price Realizations: Crude Oil (% of NYMEX oil) 92.2% 94.0% 94.6% 95.1% 94.0% - 96.0% N/A NGLs (% of NYMEX oil) 28.0% 28.7% 31.9% 35.3% 28.0% - 30.0% N/A Natural Gas (% of NYMEX gas) 63.8% 58.4% 68.4% 73.4% 67.0% - 72.0% N/A
Realized Gain on Derivatives ($MM) $27.3 $20.4 $20.5 $1.5 ($1.5) - $1.5 N/A
Costs and Expenses: Lease Operating ($/Boe) $6.12 $6.48 $6.71 $7.15 $7.25 - $7.75 $6.75 - $7.50 Production Taxes (% of Oil & Gas Revenues) 4.31% 4.40% 4.25% 4.10% 4.50% - 4.75% 4.25% - 4.75%
Ad Valorem Taxes ($MM) $0.5 $1.4 $1.6 $3.0 $2.8 - $3.3 $11.0 - $13.0 G&A Expense (Cash only, $MM) $8.8 $9.7 $10.9 $19.7 $10.0 - $10.5 $50.0 - $52.0 DD&A Expense ($/Boe) $13.75 $13.05 $12.98 $13.03 $13.25 - $14.25 $13.25 - $14.25 Interest Expense, net ($MM) $19.0 $21.2 $20.5 $20.6 $21.0 - $22.0 N/A
*Q2 and updated FY 2017 guidance provided on May 9, 2017.

CRZO 21 21 *Q2 2017 gas production guidance of 69.0 MMcf/d at midpoint, oil at 32,000 Bbls/d.
Period Type of Contract Daily Volume
(Bbl/d) Floor Price Ceiling Price Sub-floor Price % of Q2 Oil Forecast*
Q2 2017 Total Volume 12,000 38% Swaps 12,000 $50.13
Q3 2017 Total Volume 12,000 38% Swaps 12,000 $53.71
Q4 2017 Total Volume 9,000 28% Swaps 9,000 $53.86
Q2-Q4 2017 Total Volume 10,996 Swaps 10,996 $52.46
FY 2018 Total Volume 6,000 19% 3-Way Collars 6,000 $50.00 $65.00 $40.00
Hedge Position
Note: Crude oil hedge position includes sold call options in 2018-2020. Volumes sold and weighted average ceiling prices are as follow: 3,388 Bbls/d at ~$71/Bbl in FY 2018, 3,875 Bbls/d at ~$74/Bbl in FY 2019, 4,575 Bbls/d at ~$76/Bbl in FY 2020. Carrizo also sold 33,000 MMBtu/d of call options on natural gas in 2017-2020. The weighted average ceiling price for these call options each year are as follow: $3.00/MMBtu in FY 2017, $3.25/MMBtu in FY 2018, $3.25/MMBtu in FY 2019, $3.50/MMBtu in FY 2020.
Period Type of Contract Daily Volume (MMBtu/d) Floor Price Ceiling Price Sub-floor Price
% of Q2 Gas Forecast*
Q2 2017 Total Volume 20,000 28% Swaps 20,000 $3.30
Q3 2017 Total Volume 20,000 28% Swaps 20,000 $3.30
Q4 2017 Total Volume 20,000 28% Swaps 20,000 $3.30
Q2-Q4 2017 Total Volume 20,000 Swaps 20,000 $3.30
CRZO 22 22
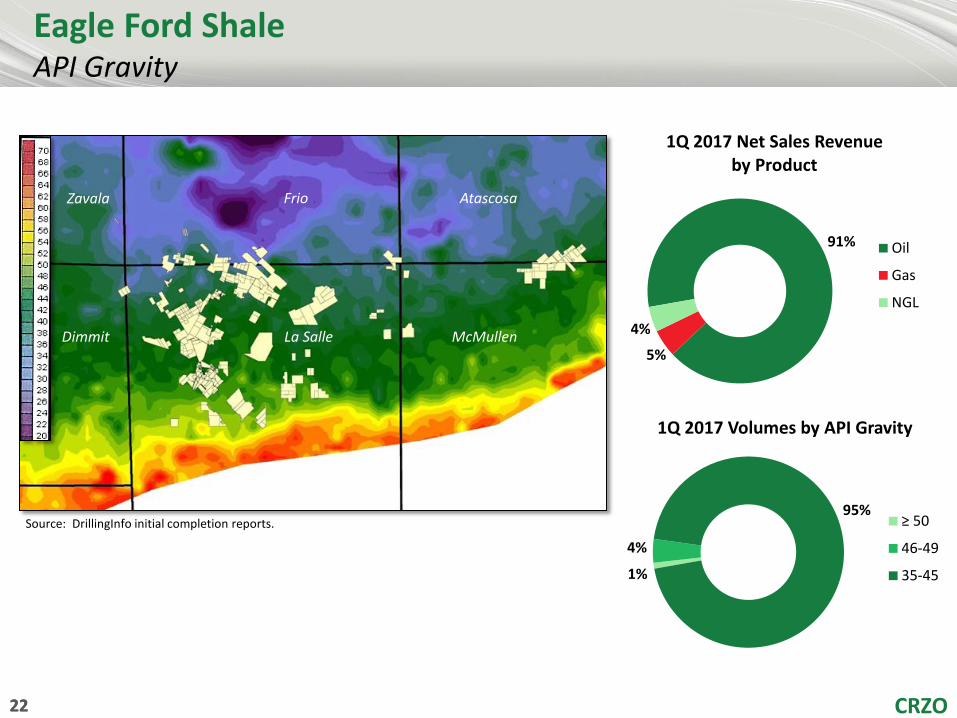
Eagle Ford Shale API Gravity
Source: DrillingInfo initial completion reports.
91%
5%
4%
1Q 2017 Net Sales Revenue by Product
Oil
Gas
NGL
1%
4%
95%
1Q 2017 Volumes by API Gravity
≥ 50
46-49
35-45
Zavala Frio Atascosa
Dimmit La Salle McMullen
CRZO 23 CRZO 23 23 CRZO 23
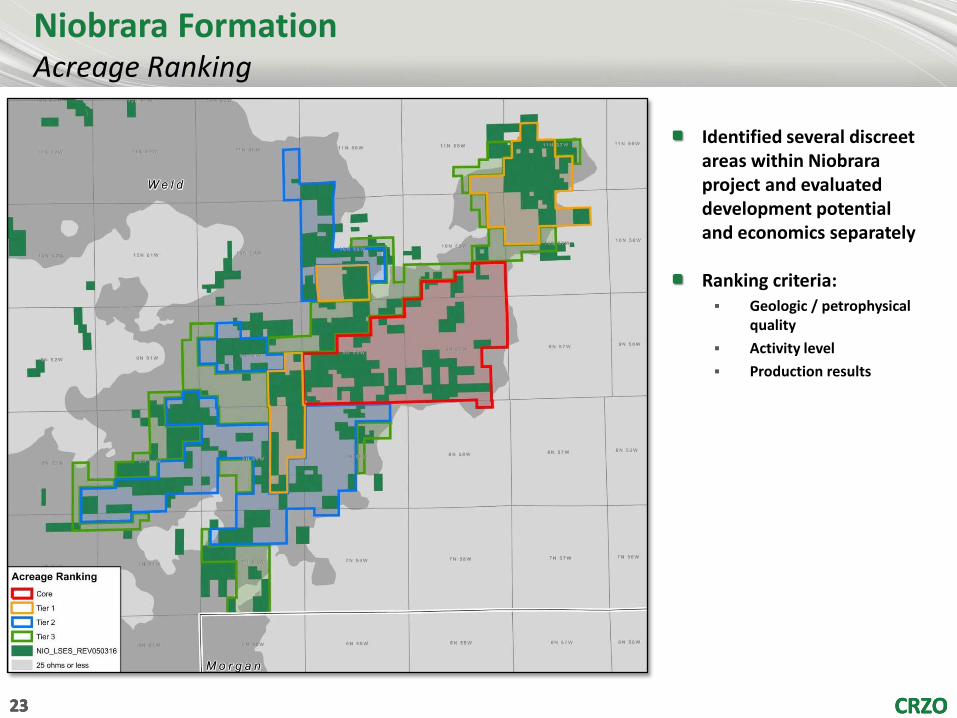
Niobrara Formation Acreage Ranking
Identified several discreet areas within Niobrara project and evaluated development potential and economics separately Ranking criteria: Geologic / petrophysical
quality Activity level Production results

CRZO 24 CRZO 24 24 CRZO 24
Niobrara Formation Type Curve Economics
(1) Economics based on NYMEX prices and include $2/Bbl deduct for oil, $3.00/Mcf NYMEX gas, NGL pricing 19% of NYMEX oil price.
(2) Total well cost includes ~$315K for allocated infrastructure and artificial lift.
Daily Production, BOPD Cum Production, MBO
Type Curve Core/Tier 1
Total Well Cost $2.2 MM
EUR
Gross 289 Mboe
Oil Only 217 Mbo
Net 243 Mboe
F&D Cost $9.05 / Boe
IRR &
NPV (1)
$75 Oil IRR 146%
NPV $3.2 MM
$65 Oil IRR 103%
NPV $2.3 MM
$55 Oil IRR 46%
NPV $1.4 MM
$45 Oil IRR 21%
NPV $0.6 MM
NYMEX NPV10 Breakeven $39.25