tuberculosis-related catastrophic costs since the
TRANSCRIPT

Tuberculosis-related Catastrophic Costs
Since the Implementation of
Universal Health Coverage
in Indonesia
Ahmad Fuady
Colofon Copyright © Ahmad Fuady, The Netherlands, 2020
All rights reserved. No part of this publication may be reproduced, stored in a retrieval system, or transmitted, in
any form or by any means, electronic, mechanical, photocopying, recording, or otherwise, without prior
permission of the author or the copyright-owning journals for previously published chapters.
Cover design and lay-out by Ahmad Fuady (www.aafuady.com)
Printing by Optima
ISBN 978-94-6361-434-4
This thesis was financially supported by the the Indonesian Endowment Fund for Education (Lembaga Pengelola
Dana Pendidikan, LPDP), Indonesia. Financial support for printing this thesis was kindly provided by Department
of Public Health, the Erasmus MC University Medical Center, Rotterdam, The Netherlands.
Tuberculosis-related Catastrophic Costs
Since the Implementation of
Universal Health Coverage
in Indonesia Tbc-gerelateerde Catastrofale Kosten Sedert de Implementatie van
Universele Ziektekostenverzekering in Indonesië
Proefschrift
ter verkrijging van de graad van doctor aan de
Erasmus Universiteit Rotterdam
op gezag van de rector magnificus
Prof.dr. R.C.M.E. Engels
en volgens het besluit van het College voor Promoties.
De openbare verdediging zal plaatsvinden op
dinsdag 9 juni 2020 om 13.30 uur
Ahmad Fuady geboren te Jakarta
Promotiecommissie:
Promotoren:
Prof. dr. J.H. Richardus
Overige leden:
Prof. dr. E.K.A van Doorslaer
Prof. dr. H.P. Endzt
Prof. dr. J. van der Velden
Copromotor:
Dr. T.A.J. Houweling
Contents
Chapter 1 General introduction 1
Chapter 2 Adaptation of the Tool to Estimate Patient Costs for
tuberculosis-affected households in Bahasa Indonesia
17
Acta Medica Indonesiana. 2018; 50 (1), 3-10
Chapter 3 Catastrophic total costs in tuberculosis-affected
households and their determinants since Indonesia’s
implementation of universal health coverage
31
Infectious Diseases of Poverty. 2018; 7:3
Chapter 4 Cost of seeking care for tuberculosis since the
implementation of universal health coverage in Indonesia
53
In review
Chapter 5 Catastrophic costs due to tuberculosis worsen treatment
outcomes: a prospective cohort study in Indonesia
71
In review
Chapter 6 Effect of financial support on reducing the incidence of
catastrophic costs among tuberculosis-affected
households in Indonesia: eight simulated scenarios
89
Infectious Diseases of Poverty. 2019; 8:10
Chapter 7 Discussion 115
Summary Summary 136
Samenvatting 139
Appendices Annexes 143
List of publications 181
About the author 182
Acknowledgement 183
Ph.D. portofolio 186


Chapter 1
General introduction

2
Tuberculosis
Tuberculosis (TB) is an infectious disease with a very long history. It has been
hypothesized that the origin of the genus Mycobacterium emerged during the Jurassic
era, more than 150 million years ago.1 In Ancient Greece, phthisis – a disease with
symptoms and lung lesions similar to those of TB in modern medicine – was well
known.2 In the Middle Ages, people found that the disease also affected the cervical
lymph nodes; it was called scrofula.3 In thirteenth-century England and France, where
it was believed that monarchs were endowed with supernatural power from God,3 it was
also believed that scrofula could be diagnosed and cured by the “royal touch” – a
practice used by French kings and English kings and queens to heal their people. The
illness was known as the King’s evil, and the “royal touch” was used until 1712 in
England and 1825 in France.2
During the industrial revolution, the disease spread widely in poor communities, due
largely to malnutrition, bad working conditions, bad sanitation, and overcrowded,
poorly ventilated housing.1, 2 In the late 19th century, many physicians and researchers
undertook experiments, including the sanatorium cure, which was introduced in
Germany by Herman Brehmer, who stated in his doctoral dissertation that TB was a
curable disease.2 On March 24, 1882, Dr. Robert Koch successfully identified
Mycobacterium tuberculosis as its cause.4 After centuries of speculation, this significant
event produced a new understanding of the disease. Eventually, this led to the
development of a strategy that combined drug discovery, effective treatment, and
socioeconomic development.
In the early 20th century, TB mortality rates in Europe, Japan, and North America
declined rapidly.5, 6 Due to this successful reduction in the incidence and mortality of
TB, the disease was often regarded as a disease of the past. But in other parts of the
world, particularly low and middle-income countries, the disease burden of TB was still
high. In 1993, the World Health Organization (WHO) declared that TB was a global
health emergency, and that national and global efforts to combat it should be
intensified.6
General introduction
3
Global TB epidemiology
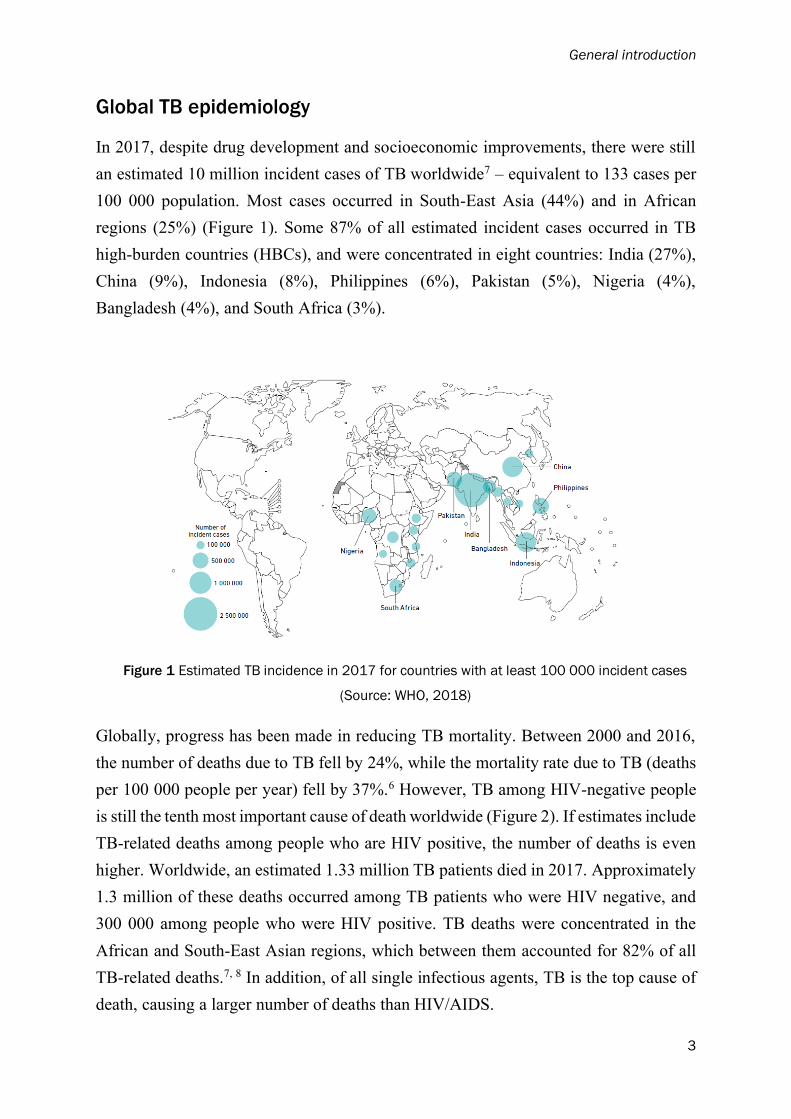
In 2017, despite drug development and socioeconomic improvements, there were still
an estimated 10 million incident cases of TB worldwide7 – equivalent to 133 cases per
100 000 population. Most cases occurred in South-East Asia (44%) and in African
regions (25%) (Figure 1). Some 87% of all estimated incident cases occurred in TB
high-burden countries (HBCs), and were concentrated in eight countries: India (27%),
China (9%), Indonesia (8%), Philippines (6%), Pakistan (5%), Nigeria (4%),
Bangladesh (4%), and South Africa (3%).
Figure 1 Estimated TB incidence in 2017 for countries with at least 100 000 incident cases
(Source: WHO, 2018)
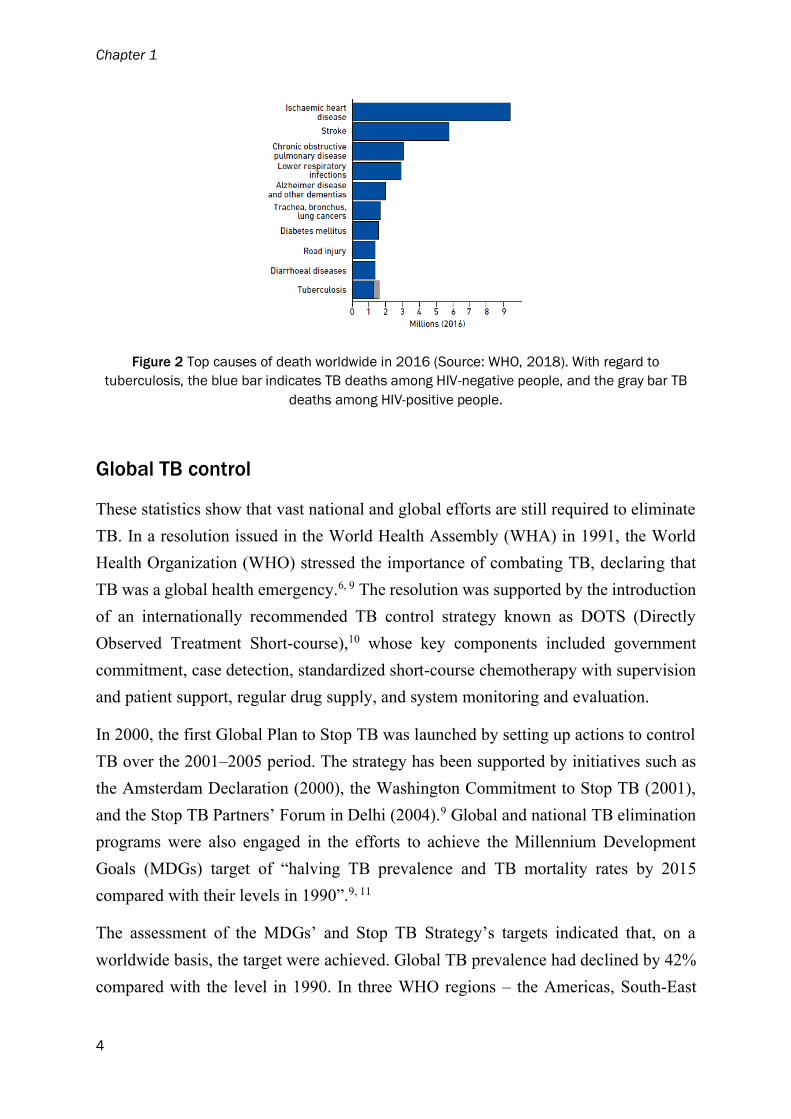
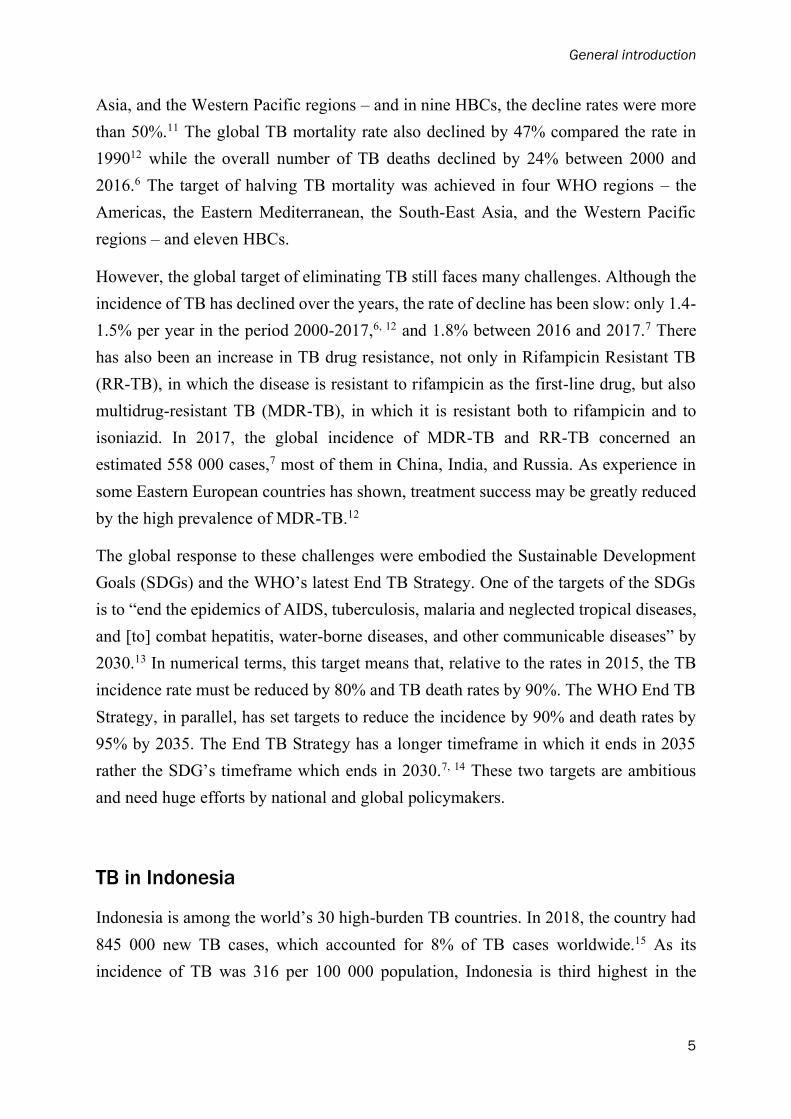
Globally, progress has been made in reducing TB mortality. Between 2000 and 2016,
the number of deaths due to TB fell by 24%, while the mortality rate due to TB (deaths
per 100 000 people per year) fell by 37%.6 However, TB among HIV-negative people
is still the tenth most important cause of death worldwide (Figure 2). If estimates include
TB-related deaths among people who are HIV positive, the number of deaths is even
higher. Worldwide, an estimated 1.33 million TB patients died in 2017. Approximately
1.3 million of these deaths occurred among TB patients who were HIV negative, and
300 000 among people who were HIV positive. TB deaths were concentrated in the
African and South-East Asian regions, which between them accounted for 82% of all
TB-related deaths.7, 8 In addition, of all single infectious agents, TB is the top cause of
death, causing a larger number of deaths than HIV/AIDS.
Chapter 1
4
Figure 2 Top causes of death worldwide in 2016 (Source: WHO, 2018). With regard to
tuberculosis, the blue bar indicates TB deaths among HIV-negative people, and the gray bar TB
deaths among HIV-positive people.
Global TB control
These statistics show that vast national and global efforts are still required to eliminate
TB. In a resolution issued in the World Health Assembly (WHA) in 1991, the World
Health Organization (WHO) stressed the importance of combating TB, declaring that
TB was a global health emergency.6, 9 The resolution was supported by the introduction
of an internationally recommended TB control strategy known as DOTS (Directly
Observed Treatment Short-course),10 whose key components included government
commitment, case detection, standardized short-course chemotherapy with supervision
and patient support, regular drug supply, and system monitoring and evaluation.
In 2000, the first Global Plan to Stop TB was launched by setting up actions to control
TB over the 2001–2005 period. The strategy has been supported by initiatives such as
the Amsterdam Declaration (2000), the Washington Commitment to Stop TB (2001),
and the Stop TB Partners’ Forum in Delhi (2004).9 Global and national TB elimination
programs were also engaged in the efforts to achieve the Millennium Development
Goals (MDGs) target of “halving TB prevalence and TB mortality rates by 2015
compared with their levels in 1990”.9, 11
The assessment of the MDGs’ and Stop TB Strategy’s targets indicated that, on a
worldwide basis, the target were achieved. Global TB prevalence had declined by 42%
compared with the level in 1990. In three WHO regions – the Americas, South-East
General introduction
5
Asia, and the Western Pacific regions – and in nine HBCs, the decline rates were more
than 50%.11 The global TB mortality rate also declined by 47% compared the rate in
199012 while the overall number of TB deaths declined by 24% between 2000 and
2016.6 The target of halving TB mortality was achieved in four WHO regions – the
Americas, the Eastern Mediterranean, the South-East Asia, and the Western Pacific
regions – and eleven HBCs.
However, the global target of eliminating TB still faces many challenges. Although the
incidence of TB has declined over the years, the rate of decline has been slow: only 1.4-
1.5% per year in the period 2000-2017,6, 12 and 1.8% between 2016 and 2017.7 There
has also been an increase in TB drug resistance, not only in Rifampicin Resistant TB
(RR-TB), in which the disease is resistant to rifampicin as the first-line drug, but also
multidrug-resistant TB (MDR-TB), in which it is resistant both to rifampicin and to
isoniazid. In 2017, the global incidence of MDR-TB and RR-TB concerned an
estimated 558 000 cases,7 most of them in China, India, and Russia. As experience in
some Eastern European countries has shown, treatment success may be greatly reduced
by the high prevalence of MDR-TB.12
The global response to these challenges were embodied the Sustainable Development
Goals (SDGs) and the WHO’s latest End TB Strategy. One of the targets of the SDGs
is to “end the epidemics of AIDS, tuberculosis, malaria and neglected tropical diseases,
and [to] combat hepatitis, water-borne diseases, and other communicable diseases” by
2030.13 In numerical terms, this target means that, relative to the rates in 2015, the TB
incidence rate must be reduced by 80% and TB death rates by 90%. The WHO End TB
Strategy, in parallel, has set targets to reduce the incidence by 90% and death rates by
95% by 2035. The End TB Strategy has a longer timeframe in which it ends in 2035
rather the SDG’s timeframe which ends in 2030.7, 14 These two targets are ambitious
and need huge efforts by national and global policymakers.
TB in Indonesia
Indonesia is among the world’s 30 high-burden TB countries. In 2018, the country had
845 000 new TB cases, which accounted for 8% of TB cases worldwide.15 As its
incidence of TB was 316 per 100 000 population, Indonesia is third highest in the

Chapter 1
6
worldwide ranking, with a TB mortality rate of 40 per 100 000 population. These stark
figures indicated that TB was still the top burden of diseases in Indonesia.
In the era of the MDGs (2000–2015), Indonesia had set two main indicators to monitor
achievement of the MDG target related to TB control: increasing the detection of new
smear-positive TB cases to 70%, and increasing the cure rate to 85% of such cases by
the year 2000.6, 9 Setting up the indicator of increasing new smear-positive TB case
detection to 70% based on the fact that TB case detection in practice was not effective.
There was a high proportion of detected smear-negative TB cases, which are more likely
found by X-ray test rather than by sputum smear examination, and are also less
contagious. In addition, there had been also a high number of undetected TB smear-
positive cases. To achieve this indicator, the Indonesian National Tuberculosis Program
(NTP) intensified the DOTS strategy – the internationally recommended strategy for
TB control. In 2015, at the end of the MDGs era, Indonesia had achieved these two
indicators (improving TB case detection and cure rate), but had failed to halve TB
prevalence and mortality rates.11, 16
The achievement and the failure both indicated the complex situation of TB in
Indonesia, which is characterized by three main problems. The first – a high number of
undetected cases7, 17 – results from the failure of healthcare providers to comply with
the standard of TB diagnosis recommended in the national TB practice guidelines. This
may be due to limited knowledge on the part of physicians, or to limited healthcare
facilities – particularly laboratory facilities – for the sputum smear examination. One
way and another, the high number of undetected cases leads to patient diagnostic delays,
the spread of TB in the community, and potentially high costs for patients and their
households.17-19
The second problem is a high number of cases that have been detected but not notified.
This problem was captured by a national inventory study in 2017.7, 17 Despite the
achievement that 85% of TB cases had been detected in 2015, the estimated incidence
– which was used to estimate the detection rate – had been generated from the data
stored in the NTP information system (the Integrated Information System for
Tuberculosis, or Sistem Informasi Tuberkulosis Terpadu, SITT). Only healthcare
providers linked with NTP report to the SITT. While a substantial proportion of TB
patients seek care from healthcare providers that are not linked to the NTP, many TB
cases are not captured by the SITT.7, 20 As a result, the TB cases detected in these health
General introduction
7
facilities were not notified to the NTP. This in turn led to an underestimation of TB
incidence, as it was based solely on the data in SITT, and also to a substantial
overestimation of the case-detection rate.
The third problem is the high number of patients who are lost to follow up, i.e., as having
missed TB treatment for more than two consecutive months. There are various reasons
a patient may stop treatment: lack of knowledge, unawareness of the consequences of
stopping TB treatment before completion, adverse effects of TB drugs, poor access to
healthcare facilities, and high costs incurred during TB treatment.19, 21
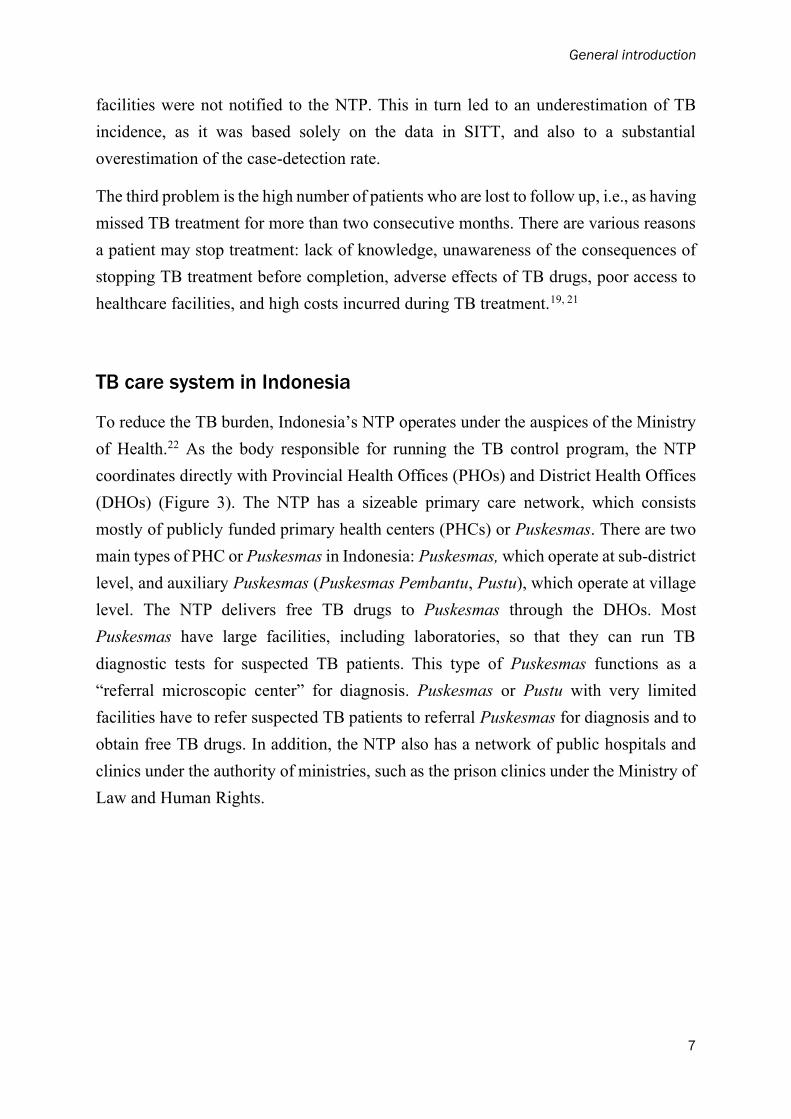
TB care system in Indonesia
To reduce the TB burden, Indonesia’s NTP operates under the auspices of the Ministry
of Health.22 As the body responsible for running the TB control program, the NTP
coordinates directly with Provincial Health Offices (PHOs) and District Health Offices
(DHOs) (Figure 3). The NTP has a sizeable primary care network, which consists
mostly of publicly funded primary health centers (PHCs) or Puskesmas. There are two
main types of PHC or Puskesmas in Indonesia: Puskesmas, which operate at sub-district
level, and auxiliary Puskesmas (Puskesmas Pembantu, Pustu), which operate at village
level. The NTP delivers free TB drugs to Puskesmas through the DHOs. Most
Puskesmas have large facilities, including laboratories, so that they can run TB
diagnostic tests for suspected TB patients. This type of Puskesmas functions as a
“referral microscopic center” for diagnosis. Puskesmas or Pustu with very limited
facilities have to refer suspected TB patients to referral Puskesmas for diagnosis and to
obtain free TB drugs. In addition, the NTP also has a network of public hospitals and
clinics under the authority of ministries, such as the prison clinics under the Ministry of
Law and Human Rights.

Chapter 1
8
Figure 3 Referral for diagnostic tests under the network of Indonesia’s national tuberculosis
program
Private clinics and private hospitals can be linked to the NTP through mutual
agreements with either a Puskesmas or a DHO. To be eligible for this, they must meet
various requirements: physicians in the clinics or hospitals must have completed a
DOTS training, and the clinics and hospitals must agree to comply with the national TB
guidelines and report TB case findings and management to the NTP. If clinics linked
with the NTP have a laboratory for TB diagnostic tests, they can provide these tests free
of charge. In other cases, they should refer suspected TB patients to a referral
Puskesmas, a hospital, or a provincial/district laboratory center. If the suspected patient
is TB-positive, a private clinic can, according to its mutual agreements, submit a request
for free TB drugs to either a Puskesmas or the DHO. The private clinic is then required
to submit a TB case-management report. Private hospitals linked to the NTP receive
free TB drugs from the DHO, to which they should then report on the TB case
management.
Until 2014, however, only about 11 000 of the 70 000 (16%) private healthcare
providers were linked to the NTP network.17, 23 According to the TB National
Prevalence Survey (2014), almost 75% of suspected TB patients first sought care with
private providers.17 As a result, the providers were unable to provide free access to TB
diagnostic tests and TB drugs.
General introduction
9
Universal health coverage in Indonesia
In 2014, Indonesia started a national health insurance program (Jaminan Kesehatan
Nasional, JKN) to achieve universal health coverage (UHC). It is run by a Social
Security Agency for Health (Badan Penyelenggara Jaminan Sosial – Kesehatan, BPJS-
K) that was set up for the purpose. In its first five years of operation, the program’s
population coverage increased from 46% to 75%.23 The government covers the monthly
contribution fee for poor households, which, using data from the National Statistical
Agency, was established on the basis of a household’s ability to fulfill its basic food
and non-food needs.24 Non-poor households pay a contribution fee that varies according
to the type of BPJS-K membership.
The BPJS-K has an extensive network of public and private providers, where patients
who are the beneficiaries of the national health insurance can access free essential health
services. All public healthcare providers are automatically linked to the BPJS-K. In
2018, there were also approximately 11 500 private providers in the BPJS-K network.25
The numbers of private healthcare providers linked to BPJS-K will continue to grow.
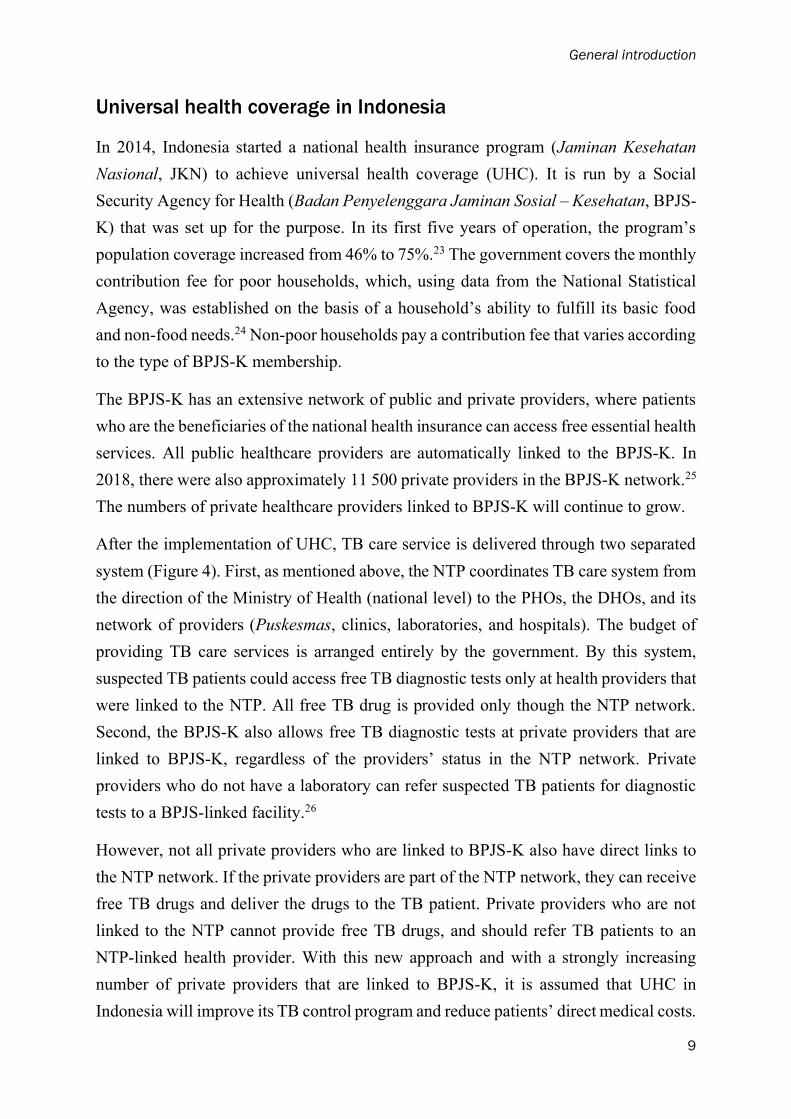
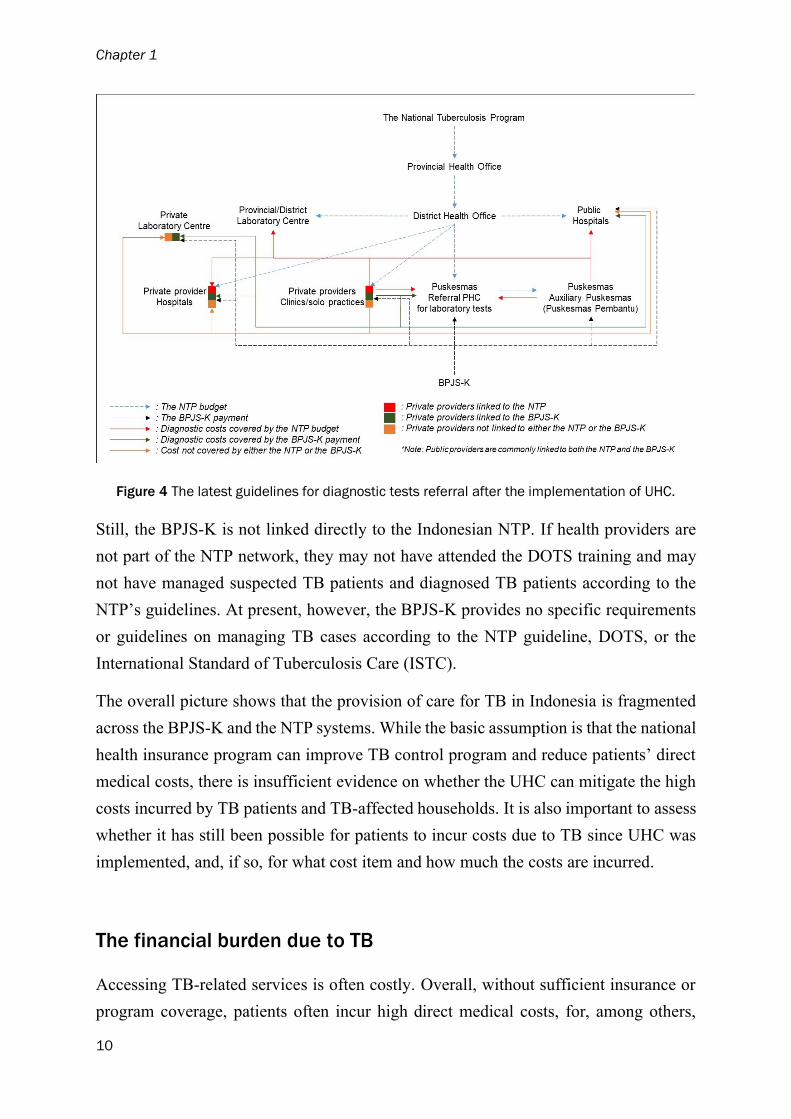
After the implementation of UHC, TB care service is delivered through two separated
system (Figure 4). First, as mentioned above, the NTP coordinates TB care system from
the direction of the Ministry of Health (national level) to the PHOs, the DHOs, and its
network of providers (Puskesmas, clinics, laboratories, and hospitals). The budget of
providing TB care services is arranged entirely by the government. By this system,
suspected TB patients could access free TB diagnostic tests only at health providers that
were linked to the NTP. All free TB drug is provided only though the NTP network.
Second, the BPJS-K also allows free TB diagnostic tests at private providers that are
linked to BPJS-K, regardless of the providers’ status in the NTP network. Private
providers who do not have a laboratory can refer suspected TB patients for diagnostic
tests to a BPJS-linked facility.26
However, not all private providers who are linked to BPJS-K also have direct links to
the NTP network. If the private providers are part of the NTP network, they can receive
free TB drugs and deliver the drugs to the TB patient. Private providers who are not
linked to the NTP cannot provide free TB drugs, and should refer TB patients to an
NTP-linked health provider. With this new approach and with a strongly increasing
number of private providers that are linked to BPJS-K, it is assumed that UHC in
Indonesia will improve its TB control program and reduce patients’ direct medical costs.
Chapter 1
10
Figure 4 The latest guidelines for diagnostic tests referral after the implementation of UHC.
Still, the BPJS-K is not linked directly to the Indonesian NTP. If health providers are
not part of the NTP network, they may not have attended the DOTS training and may
not have managed suspected TB patients and diagnosed TB patients according to the
NTP’s guidelines. At present, however, the BPJS-K provides no specific requirements
or guidelines on managing TB cases according to the NTP guideline, DOTS, or the
International Standard of Tuberculosis Care (ISTC).
The overall picture shows that the provision of care for TB in Indonesia is fragmented
across the BPJS-K and the NTP systems. While the basic assumption is that the national
health insurance program can improve TB control program and reduce patients’ direct
medical costs, there is insufficient evidence on whether the UHC can mitigate the high
costs incurred by TB patients and TB-affected households. It is also important to assess
whether it has still been possible for patients to incur costs due to TB since UHC was
implemented, and, if so, for what cost item and how much the costs are incurred.
The financial burden due to TB
Accessing TB-related services is often costly. Overall, without sufficient insurance or
program coverage, patients often incur high direct medical costs, for, among others,

General introduction
11
diagnostic procedures, TB drugs, and consultation fees.27 Patients may face high costs,
starting in the pre-diagnostic phase, i.e., the period between the occurrence of the first
symptoms or signs and TB diagnosis. Costs during this phase can be high due to
diagnostic or health-system delays, which are defined as the time that elapses between
a patient’s first healthcare facility visit and the date of starting of TB treatment.28-30
Since patients may seek care with multiple health providers before obtaining the
definitive diagnosis of TB, the length of such delays can vary. 27, 31
When a patient is diagnosed with TB, he or she needs to undergo a long TB treatment
without any interruption.32 Those who are newly infected (Category 1) should complete
a six-month course of treatment – two months in the intensive phase and four months
in the continuation phase. Those who have become re-infected (Category 2) should
complete eight months of treatment – three months in the intensive phase and five
months in the continuation phase.
Even though patients receive free TB drugs and medical consultations, they still incur
high costs for direct non-medical costs, such as transportation and food during their
visits to the healthcare facility.33, 34 Patients in Indonesia need to visit their healthcare
provider approximately 2-4 times a month during the intensive phase and 1-2 times a
month during the continuation phase. The number of visits is higher for those
undergoing Category 2 treatment. If a patient needs one or more family member to
accompany them during the healthcare visits, these costs may increase.
As well as direct medical and non-medical costs, TB patients or their guardians may,
due to their frequent visits to the healthcare provider, also face losses of income,
productivity, and time.27, 34, 35 Patients may also experience job loss, typically for
reasons such as the high frequency of healthcare visits, their worse health, or
stigmatization in the workplace.
Such economic consequences can be catastrophic, particularly for poor households. On
the one hand, accessing TB-related services may further reduce their financial capacity,
eventually casting them into a poverty trap.36, 37 On the other hand, catastrophic costs
may hamper their further access to healthcare.

Chapter 1
12
Catastrophic costs due to TB
In 2015, the WHO End TB Strategy set a target for the first milestone (2020): reducing
to zero percent the percentage of TB-affected households that faced catastrophic costs.38
This definition of “catastrophic costs” is different from that of another, similar-sounding
indicator, “catastrophic expenditures,” which is commonly used to measure progress
towards UHC.39, 40 While catastrophic costs are a UHC indicator that focuses on direct
medical costs only, the End TB indicator captures the total economic burden of TB, and
therefore incorporates indirect costs into its calculation of catastrophic costs.40-42
Measuring the economic impact of TB thus incorporates three types of cost. The first,
direct medical costs, represent actual spending on medical services, such as
administration and consultation fees, and costs for laboratory tests, treatment, and
hospitalization. The second, direct non-medical costs, are often incurred during
healthcare visits, and consist of indirect costs or income loss. They are associated with
healthcare utilization, such as transportation costs and food costs. The third, indirect
costs, are any loss of income that result from accessing TB-related services.
The WHO recommends two approaches to measuring catastrophic costs and whether or
not the zero-percent target of households facing such costs has actually been achieved.
The first approach defines catastrophic costs as the total costs incurred by TB-affected
households that exceed a specific threshold – such as 20% – of the household’s annual
income. The second approach defines catastrophic TB-related costs as the share of TB-
affected households that experience dissaving by taking a loan or selling property or
livestock to deal with TB-related costs.41
In Indonesia, no evidence has yet been produced on measurements of the incidence of
catastrophic costs due to TB according to the new approach introduced by the End TB
Strategy in 2015, i.e., measuring all direct and indirect costs. Neither is there currently
any evidence on the extent to which households still face catastrophic costs since UHC
was implemented through the JKN program. As we approach the 2020 milestone of the
End TB Strategy – i.e., a zero percent incidence of catastrophic costs – it is crucial to
assess the current situation in Indonesia. It is essential to assess whether Indonesia’s
universal health insurance program is sufficient to protect TB patients from catastrophic
costs, or whether they need additional protection against the economic impacts of TB.

General introduction
13
The aim, research questions, and outline of the thesis
In the context of UHC in Indonesia, this thesis aims to provide an evidence base on the
following: 1.) the household-level economic impact of TB, 2.) the relationship between
catastrophic costs and TB treatment outcomes, and 3.) the social-protection
improvements required to further reduce TB-related catastrophic costs. In more specific
terms, this thesis intended addresses the research questions below.
1. What is the economic impact of TB faced by TB-affected households?
2. What is the contribution of private health care providers to this economic impact of
TB?
3. Do catastrophic costs affect patients’ TB treatment adherence and treatment
outcome?
4. What is the potential effect on the incidence of catastrophic costs of further social
protection measures beyond UHC?
The thesis consists of seven chapters. Chapter 2 describes the development and
adaptation of the tool developed by the WHO to measure TB-related costs in the context
of Indonesia since the implementation of the UHC. In answer to the first research
question, Chapters 3 and 4 quantify the economic impact of TB, including the incidence
of TB-related catastrophic costs. Chapter 4 explores the contribution of private
healthcare providers to the economic impact due to TB. Chapter 5 describes whether or
not catastrophic costs, and at which percentage of costs related to annual household
income, affect TB treatment outcome and TB treatment adherence. After presenting a
simulation of eight financial support scenarios for reducing the incidence of
catastrophic costs, Chapter 6 explores the patients’ remaining needs for additional
financial or social protection. The general discussion in Chapter 7 summarizes and
discusses our findings, and makes recommendations for further research and policy
development regarding the TB-control program and social protection.

Chapter 1
14
References 1. Daniel TM. The history of tuberculosis. Respiratory Medicine. 2006;100(11):1862-70.
2. Barberis I, Bragazzi NL, Galluzzo L, Martini M. The history of tuberculosis: from the first historical
records to the isolation of Koch's bacillus. J Prev Med Hyg. 2017;58(1):E9-E12.
3. Murray JF, Rieder HL, Finley-Croswhite A. The King's Evil and the Royal Touch: the medical history
of scrofula. The International Journal of Tuberculosis and Lung Disease. 2016;20(6):713-6.
4. Sakula A. Robert Koch: centenary of the discovery of the tubercle bacillus, 1882. Thorax.
1982;37(4):246-51.
5. Grange JM, Gandy M, Farmer P, Zumla A. Historical declines in tuberculosis: nature, nurture and the
biosocial model [Counterpoint]. The International Journal of Tuberculosis and Lung Disease.
2001;5(3):208-12.
6. Floyd K, Glaziou P, Zumla A, Raviglione M. The global tuberculosis epidemic and progress in care,
prevention, and research: an overview in year 3 of the End TB era. The Lancet Respiratory Medicine.
2018;6(4):299-314.
7. World Health Organization. Global tuberculosis report 2018. Geneva: World Health Organization;
2018.
8. Kyu HH, Maddison ER, Henry NJ, Mumford JE, Barber R, Shields C, et al. The global burden of
tuberculosis: results from the Global Burden of Disease Study 2015. The Lancet Infectious Diseases.
2018;18(3):261-84.
9. World Health Organization. The Stop TB strategy : building on and enhancing DOTS to meet the TB-
related Millennium Development Goals. Geneva: WHO; 2006.
10. World Health Organization. WHO Tuberculosis Programme : framework for effective tuberculosis
control. Geneva: WHO; 1994.
11. World Health Organization. Global tuberculosis report 2015. Geneva: World Health Organization;
2016.
12. Raviglione M, Sulis G. Tuberculosis 2015: burden, challenges and strategy for control and elimination.
Infectious disease reports. 2016;8(2).
13. United Nations. Draft outcome document of the United Nations summit for the adoption of the post-
2015 development agenda. Sixty-ninth session of the General Assembly of the United Nations; August
2015. New York: United Nations; 2015.
14. Lonnroth K, Raviglione M. The WHO's new End TB Strategy in the post-2015 era of the Sustainable
Development Goals. Trans R Soc Trop Med Hyg. 2016;110(3):148-50.
15. World Health Organization. Global tuberculosis report 2019. Geneva: World Health Organization;
2019.
16. Ministry of National Development Planning Republic Indonesia. Report on the achievement of
Millennium Development Goals in Indonesia. Jakarta: Ministry of National Development Planning
Republic Indonesia; 2012.
17. Surya A, Setyaningsih B, Suryani Nasution H, Gita Parwati C, Yuzwar YE, Osberg M, et al. Quality
Tuberculosis Care in Indonesia: Using Patient Pathway Analysis to Optimize Public–Private
Collaboration. The Journal of Infectious Diseases. 2017;216(suppl_7):S724-S32.
18. Mahendradhata Y, Lestari T, Probandari A, Indriarini LE, Burhan E, Mustikawati D, et al. How do
private general practitioners manage tuberculosis cases? A survey in eight cities in Indonesia. BMC
research notes. 2015;8:564-.
19. Rutherford ME, Hill PC, Maharani W, Sampurno H, Ruslami R. Risk factors for treatment default
among adult tuberculosis patients in Indonesia. The International Journal of Tuberculosis and Lung
Disease. 2013;17(10):1304-9.
20. TB Inventory Study Team. Tuberculosis inventory study in Indonesia 2016-2017. Glion: Ministry of
Health, Republic Indonesia, 2018.
21. Ruru Y, Matasik M, Oktavian A, Senyorita R, Mirino Y, Tarigan LH, et al. Factors associated with
non-adherence during tuberculosis treatment among patients treated with DOTS strategy in Jayapura,
Papua Province, Indonesia. Global Health Action. 2018;11(1):1510592.
22. Ministry of Health Republic of Indonesia. Strategi nasional pengendalian TB di Indonesia 2010-2014.
Jakarta: Ministry of Health Republic Indonesia; 2011.
General introduction
15
23. Fuady A. Arsitektur jaminan kesehatan Indonesia: capaian, kritik dan tantangan masa depan. Jakarta:
Sagung Seto; 2019.
24. Badan Pusat Statistik. Kemiskinan dan ketimpangan: Badan Pusat Statistik; 2019 [Available from:
https://www.bps.go.id/subject/23/kemiskinan-dan-ketimpangan.html#subjekViewTab1.
25. Badan Penyelenggara Jaminan Sosial Kesehatan. Fasilitas kesehatan JKN: Badan Penyelenggara
Jaminan Sosial Kesehatan; 2019 [updated 1 November 2019. Available from: https://www.bpjs-
kesehatan.go.id/bpjs/.
26. Kementerian Kesehatan Republik Indonesia. Petunjuk teknis pelayanan tuberkulosis bagi peserta
Jaminan Kesehatan Nasional (JKN). Jakarta: Kementerian Kesehatan RI; 2015.
27. Tanimura T, Jaramillo E, Weil D, Raviglione M, Lonnroth K. Financial burden for tuberculosis patients
in low- and middle-income countries: a systematic review. Eur Respir J. 2014;43(6):1763-75.
28. Veesa KS, John KR, Moonan PK, Kaliappan SP, Manjunath K, Sagili KD, et al. Diagnostic pathways
and direct medical costs incurred by new adult pulmonary tuberculosis patients prior to anti-
tuberculosis treatment – Tamil Nadu, India. Plos One. 2018;13(2):e0191591.
29. Getnet F, Demissie M, Assefa N, Mengistie B, Worku A. Delay in diagnosis of pulmonary tuberculosis
in low-and middle-income settings: systematic review and meta-analysis. BMC Pulmonary Medicine.
2017;17(1):202.
30. World Health Organization. Diagnostic and treatment delay in tuberculosis. Geneva: WHO; 2006.
31. van den Hof S, Collins D, Hafidz F, Beyene D, Tursynbayeva A, Tiemersma E. The socioeconomic
impact of multidrug resistant tuberculosis on patients: results from Ethiopia, Indonesia and Kazakhstan.
BMC Infect Dis. 2016;16:470.
32. World Health Organization. Treatment of tuberculosis: guidelines. 4th ed ed. Geneva: World Health
Organization; 2010.
33. Ukwaja KN, Alobu I, lgwenyi C, Hopewell PC. The high cost of free tuberculosis services: patient and
household costs associated with tuberculosis care in Ebonyi State, Nigeria. Plos One.
2013;8(8):e73134.
34. Mauch V, Bonsu F, Gyapong M, Awini E, Suarez P, Marcelino B, et al. Free tuberculosis diagnosis
and treatment are not enough: patient cost evidence from three continents. Int J Tuberc Lung Dis.
2013;17(3):381-7.
35. Wingfield T, Boccia D, Tovar M, Gavino A, Zevallos K, Montoya R, et al. Defining catastrophic costs
and comparing their importance for adverse tuberculosis outcome with multi-drug resistance: a
prospective cohort study, Peru. PLoS Med. 2014;11(7):e1001675.
36. Lonnroth K, Glaziou P, Weil D, Floyd K, Uplekar M, Raviglione M. Beyond UHC: monitoring health
and social protection coverage in the context of tuberculosis care and prevention. PLoS Med.
2014;11(9):e1001693.
37. Ukwaja KN, Alobu I, Abimbola S, Hopewell PC. Household catastrophic payments for tuberculosis
care in Nigeria: incidence, determinants, and policy implications for universal health coverage.
Infectious Diseases of Poverty. 2013;2.
38. World Health Organization. Global strategy and targets for tuberculosis prevention, care and control
after 2015. Geneva: World Health Organization; 2013 29 November 2013.
39. Wagstaff A, van Doorslaer E. Catastrophe and impoverishment in paying for health care: with
applications to Vietnam 1993-1998. Health Econ. 2003;12(11):921-34.
40. WHO and World Bank. Tracking universal health coverage: first global monitoring report. Geneva:
World Health Organization; 2015.
41. World Health Organization. Protocol for survey to determine direct and indirect costs due to TB and to
estimate proportion of TB-affected households experiencing catastrophic total costs due to TB. Geneva:
World Health Organization; 2015 November 2015.
42. Pedrazzoli D, Borghi J, Viney K, Nishikiori N, Houben RMGJ, Siroka A, et al. Measuring the economic
burden for TB patients in the End TB Strategy and Universal Health Coverage frameworks. Int J Tuberc
Lung D. 2019;23(1):5-11.

17
Chapter 2
Adaptation of the Tool to Estimate Patient
Costs for tuberculosis-affected
households in Bahasa Indonesia
Ahmad Fuady1,2, Tanja A.J. Houweling1, Muchtaruddin Mansyur2, Jan Hendrik
Richardus1
1Department of Public Health, Erasmus MC, University Medical Center
Rotterdam, The Netherlands. 2Department of Community Medicine, Faculty of
Medicine, Universitas Indonesia, Indonesia.
Fuady et al. Acta Medica Indonesiana. 2018; 50 (1): 3-10

Chapter 2
18
Abstract
Aim:
To adapt the Tool to Estimate Patient Costs which measures total costs and catastrophic
total costs for tuberculosis-affected household to the Indonesian context.
Methods:
The Tool was adapted using best-practice guidelines. On the basis of pre-testing
performed in a previous study (referred to as Phase 1 Study), we refined the adaptation
process by comparing it with the generic tool introduced by the WHO. We also held an
expert committee review and did pre-testing by interviewing 30 TB patients. After pre-
testing and before finalization, the Tool was provided with complete explanation sheets.
Results:
Seventy-two major changes were made during the adaptation process including
changing choices to match the Indonesian context, refining the flow of questions,
deleting questions, changing some wordings, and restoring original questions that had
been changed in Phase 1 Study. Participants indicated that most questions were clear
and easy to understand. To solve recall difficulties, we made some adaptations to obtain
data that might be missing, such as tracking data to a patient’s medical records, making
a proxy of costs, and guiding interviewers to ask for a specific value when participants
were uncertain about the estimated market value of property they had sold.
Conclusions:
The adapted Tool to Estimate Patients’ Costs in Bahasa Indonesia is comprehensive,
ready for use in future studies on TB-related costs catastrophic costs, and suitable for
monitoring progress towards the target of the End TB Strategy.
Adaptation of the Tool
19
Introduction
Indonesia is achieving slow progress in its struggle to eliminate tuberculosis (TB). With
the world’s second-highest TB incidence worldwide,1 it urgently requires
improvements and innovations beyond the strategies currently being implemented
throughout the country. While training of healthcare workers is essential, it is also
important to note that access to healthcare often brings financial hardship to TB patients.
The most vulnerable are those living in poor families, who must deal not only with
medical costs, but also with non-medical costs, such as travel and supplementation
costs, which can drain up to half of their annual income.2,3 All these costs are
compounded by potential income loss.4
Challenges in eliminating TB therefore go beyond clinical management, and are often
related to socioeconomic problems. These problems can increase delay in TB diagnosis
and treatment, and plunge patients into a more severe state of TB illness and a higher
risk of treatment failure and MDR-TB development.2–4 This, in turn, will lead to more
complicated cases with substantial implications for clinical management. Clinicians
should therefore consider the financial problems faced by TB patients and their affected
families during consultations.
Many patients, because of embarrassment, prefer firstly seek care to private providers
rather than to public health facilities, regardless their financial capacity. Assessing
patients’ financial capability will help clinicians to decide whether they can prescribe
additional diagnostic tests, such as X-ray, and branded drugs that may be unaffordable
for patients. Otherwise, they should refer patients to public health facilities linked to
National Tuberculosis Program (NTP) that provide free-of-charge laboratory
examination and TB drugs. During TB treatment, clinicians should also assess whether
patients can afford transportation costs before deciding the number of visits per month.
Assessing all of these issues is important to increase patients’ adherence to the TB
diagnostic procedures and treatment, as well as TB treatment success.
Understanding the complexity of TB burden, the End TB Strategy acknowledges the
importance of these socio-economic determinants in its target that, by 2020, no TB-
affected family should face catastrophic spending due to TB.5–7 In countries such as
Indonesia, it is very important that progress towards this target is monitored properly.
One fundamental step in monitoring progress is preparing a validated tool for measuring
total patient costs and catastrophic total costs. The World Health Organization (WHO)

Chapter 2
20
recommends using a version of the generic questionnaire “The Tool to Estimate Patient
Costs”7,8 (henceforth referred to as the Generic Tool) that has been adapted to the local
cultural context in order to interpret findings correctly.9,10 Before Indonesia’s
implementation of universal health coverage (UHC) in 2014, Van den Hof et al. adapted
the Generic Tool for use in Indonesia; it was pretested in 2013. For the sake of
convenience, we refer to this study as the Phase 1 Study.11,12
However, due partly to the implementation of UHC, various answer categories in the
Phase 1 Tool (such as those relating to health insurance and healthcare facilities), no
longer matched the new situation. Also, as pretesting in the Phase 1 Study involved only
five multi-drug-resistant (MDR) TB patients, a larger sample size was needed to perfect
the adaptation.
To monitor progress towards the target of eliminating catastrophic spending on TB in
Indonesia, the present study aimed to further adapt the questionnaire resulted from the
Phase 1 Study.
Methods
Study design
The adaptation of the Tool consisted of two phases. The first phase had been conducted
separately by van den Hof et al.12 for a previous Indonesian study (the Phase 1 Study)
in 2013. Our study (referred to henceforth as the Phase 2 Study) comprised the second
phase of adapting the Generic Tool. Our study had a cross-sectional design and was
conducted in 2016. In line with existing guidelines,13,14 the whole process of adaptation
consisted of seven steps. While the Phase 1 Study went through all the steps from I to
VII, our Phase 2 Study re-ran steps V to VII, i.e. production of the definitive Bahasa
Indonesia version of the Tool. (Figure 1)

Adaptation of the Tool
21
Figure 1 Study design: adaptation of the Tool
Study population
We interviewed 30 TB patients who had undergone at least one month of TB treatment
in two sub-district Primary Health Centres (PHCs, Puskesmas), East Jakarta, which
were Puskesmas Cakung and Puskesmas Jatinegara. We tracked patients registered on
the TB patient list and chose patients who met the inclusion criteria consecutively from
the most recent starting date of treatment. In Puskesmas Cakung, we invited TB and
MDR-TB patients to come to PHC, and interviewed patient coming to the PHC
consecutively. In three consecutive days, we interviewed 18 patients. In Puskesmas
Jatinegara, we phoned patients to make an appointment, and visited them at home for
an interview until reaching 12 TB and MDR-TB patients. If a patient could not be
interviewed because he/she was unable to communicate or was not available at the time
of interview, we asked his/her caregiver (termed “drug observer”) to participate in the
study. This brought the total number of interviewees to 30.
Phase 1 Study
The principal investigator of the Phase 1 Study was a researcher from the KNCV
Tuberculosis Foundation in the Netherlands, where the Generic Tool was originally
developed. The study was prepared in Indonesia together with local researchers, one of
whom was appointed to prepare for the forward translation into Bahasa Indonesia.
Chapter 2
22
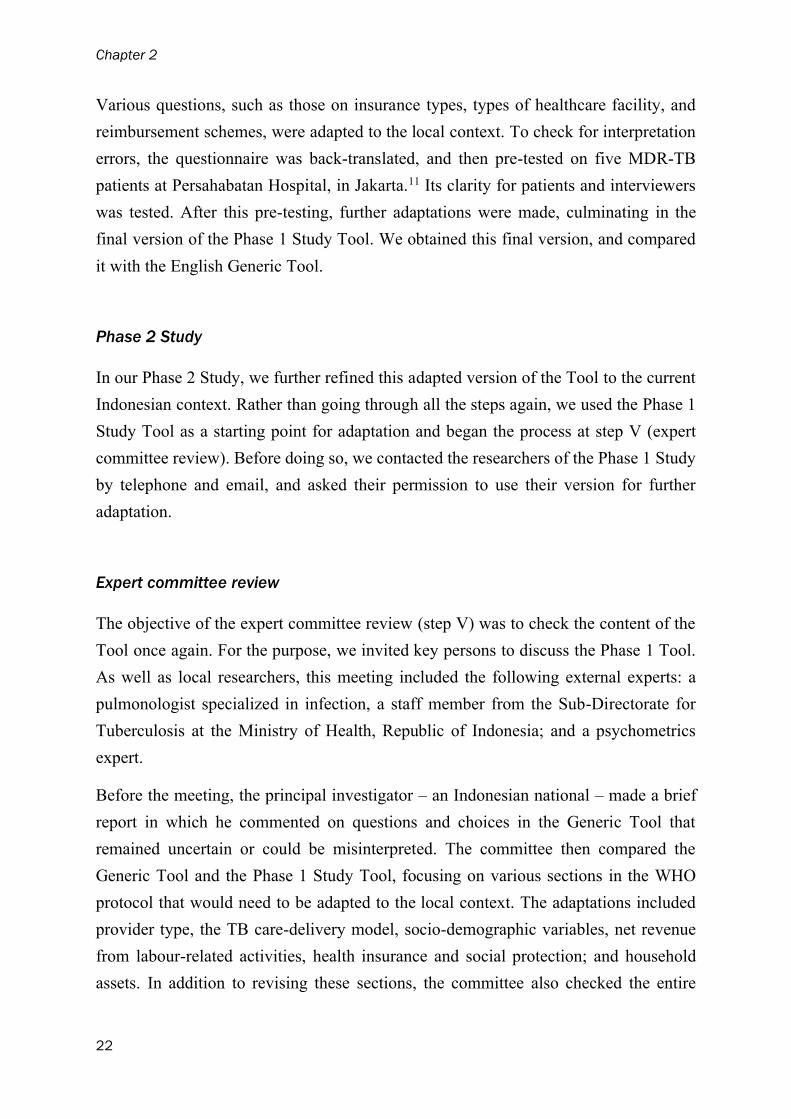
Various questions, such as those on insurance types, types of healthcare facility, and
reimbursement schemes, were adapted to the local context. To check for interpretation
errors, the questionnaire was back-translated, and then pre-tested on five MDR-TB
patients at Persahabatan Hospital, in Jakarta.11 Its clarity for patients and interviewers
was tested. After this pre-testing, further adaptations were made, culminating in the
final version of the Phase 1 Study Tool. We obtained this final version, and compared
it with the English Generic Tool.
Phase 2 Study
In our Phase 2 Study, we further refined this adapted version of the Tool to the current
Indonesian context. Rather than going through all the steps again, we used the Phase 1
Study Tool as a starting point for adaptation and began the process at step V (expert
committee review). Before doing so, we contacted the researchers of the Phase 1 Study
by telephone and email, and asked their permission to use their version for further
adaptation.
Expert committee review
The objective of the expert committee review (step V) was to check the content of the
Tool once again. For the purpose, we invited key persons to discuss the Phase 1 Tool.
As well as local researchers, this meeting included the following external experts: a
pulmonologist specialized in infection, a staff member from the Sub-Directorate for
Tuberculosis at the Ministry of Health, Republic of Indonesia; and a psychometrics
expert.
Before the meeting, the principal investigator – an Indonesian national – made a brief
report in which he commented on questions and choices in the Generic Tool that
remained uncertain or could be misinterpreted. The committee then compared the
Generic Tool and the Phase 1 Study Tool, focusing on various sections in the WHO
protocol that would need to be adapted to the local context. The adaptations included
provider type, the TB care-delivery model, socio-demographic variables, net revenue
from labour-related activities, health insurance and social protection; and household
assets. In addition to revising these sections, the committee also checked the entire
Adaptation of the Tool
23
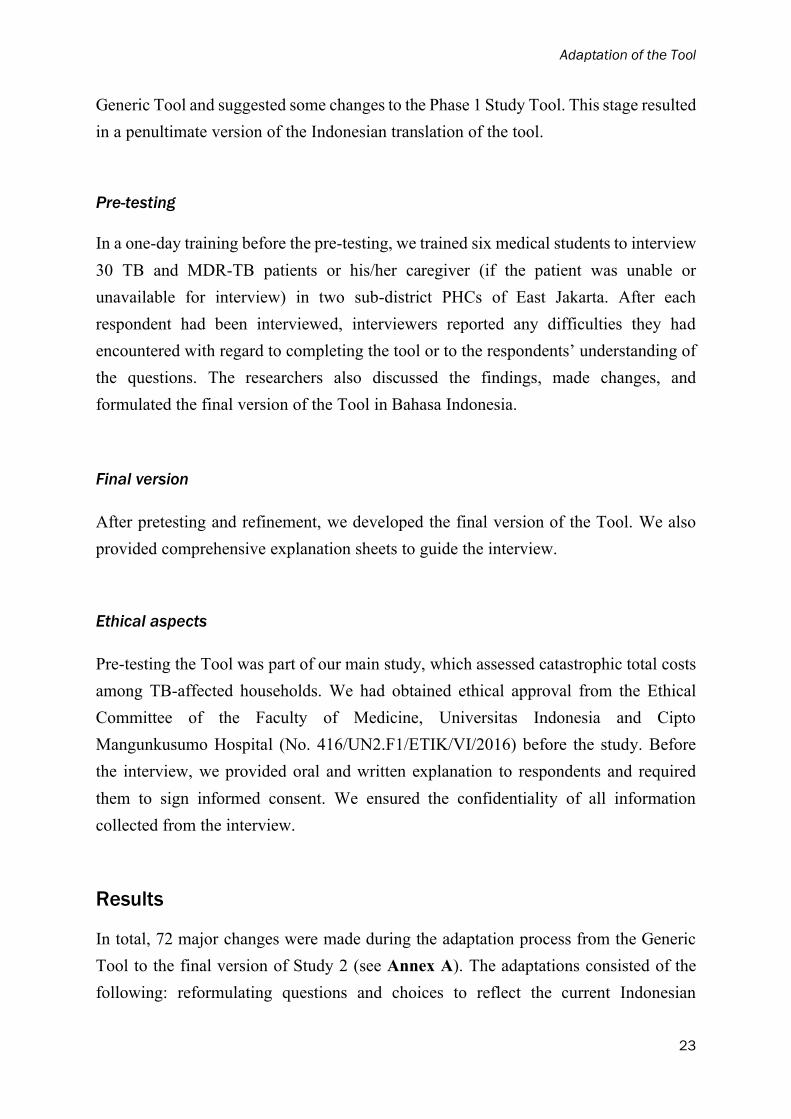
Generic Tool and suggested some changes to the Phase 1 Study Tool. This stage resulted
in a penultimate version of the Indonesian translation of the tool.
Pre-testing
In a one-day training before the pre-testing, we trained six medical students to interview
30 TB and MDR-TB patients or his/her caregiver (if the patient was unable or
unavailable for interview) in two sub-district PHCs of East Jakarta. After each
respondent had been interviewed, interviewers reported any difficulties they had
encountered with regard to completing the tool or to the respondents’ understanding of
the questions. The researchers also discussed the findings, made changes, and
formulated the final version of the Tool in Bahasa Indonesia.
Final version
After pretesting and refinement, we developed the final version of the Tool. We also
provided comprehensive explanation sheets to guide the interview.
Ethical aspects
Pre-testing the Tool was part of our main study, which assessed catastrophic total costs
among TB-affected households. We had obtained ethical approval from the Ethical
Committee of the Faculty of Medicine, Universitas Indonesia and Cipto
Mangunkusumo Hospital (No. 416/UN2.F1/ETIK/VI/2016) before the study. Before
the interview, we provided oral and written explanation to respondents and required
them to sign informed consent. We ensured the confidentiality of all information
collected from the interview.
Results
In total, 72 major changes were made during the adaptation process from the Generic
Tool to the final version of Study 2 (see Annex A). The adaptations consisted of the
following: reformulating questions and choices to reflect the current Indonesian
Chapter 2
24
context; re-structuring the ordering of several questions; deleting certain questions from
the Generic Tool; and later restoring questions which had previously been deleted in
the Phase 1 Study.
Phase 1 Study involved 60 changes relative to the Generic Tool. As well as the addition
of two question sets under new sub-topics (moving costs and adverse effect costs), these
changes included changing question sets into table form, adding seven questions and
one sub-question, altering five answer choices and two wordings, and deleting three
question sets (sub-topics) and 33 questions.
The most important change made in the Phase 1 Study was the overall flow of the Tool.
In the Generic Tool, the questions are grouped on the basis of the types of cost. This
required respondents to recall the costs they had incurred back and forth between the
pre-diagnostic, diagnostic, and treatment phases. To facilitate the flow of interview, the
Phase 1 Study had re-arranged the flow to match the time sequence. Other prominent
changes involved redesigning some questions into table form, which made it easier for
the interviewers to ask them and thereby to complete the Tool.
During the expert review meeting in Phase 2 Study, we changed the answer choices
relating to provider type from “Health Post (Pos Kesehatan)”, “PHC (Puskesmas), and
“district hospital (RSUD)” to “PHC (Puskesmas)”, “private clinic”, “public hospital”,
“private hospital”, and “other”. With reference to the TB delivery model, we changed
the term “DOT” (Directly Observed Treatment), which respondents may not know, to
“visit to take TB drugs” to make it easier for participants to understand the questions.
In the section with socio-demographic questions, we changed categories relating to
income payments (paid regularly, uncertain, paid in kind, not paid, and others). We also
changed a question from “currently formally employed” to “formally employed before
being diagnosed”, and followed with the question “Did you have to change or quit your
employment after being diagnosed with TB?”. We restored a question “how many
people regularly sleep in your household”, and modified it to “how many family
members live in your household?”.
As UHC had been implemented in Indonesia since the Phase 1 study, the insurance
system had changed. Using the abbreviation BPJS to indicate the national health-
insurance agency (Badan Penyelenggara Jaminan Sosial, BPJS), we adapted the types
of insurance to government-paid BPJS, self-paid BPJS, and private insurance. No
changes were made to questions in the revenue section. However, we made changes in
Adaptation of the Tool
25
the costs section, including the type of supplement taken (“drinks” to “milk”); the
frequency of taking supplementation (from “per month” to “per week”); and the coping
section (by changing the order of the questions on the amount of money gained from
selling property). We also changed some wordings to make it easier for participants to
understand questions, for example changing the term “smear” to “Basil Tahan Asam
(BTA)”, and “pengembalian asuransi” to “reimbursement asuransi”.
We retained 38 questions that were the result of adaptations made in the Phase 1 Study.
We also restored 12 original questions from the Generic Tool that had been changed,
and five original questions that had been deleted in the Phase 1 Tool. The restored
questions included “date of first diagnostic examination”, “date of starting treatment”,
“where did you seek treatment?”, “what symptoms did you experience?”, and “why
didn’t you go to a public facility?”. We also deleted three questions and three answer
choices that had been added in the Phase 1 Study.
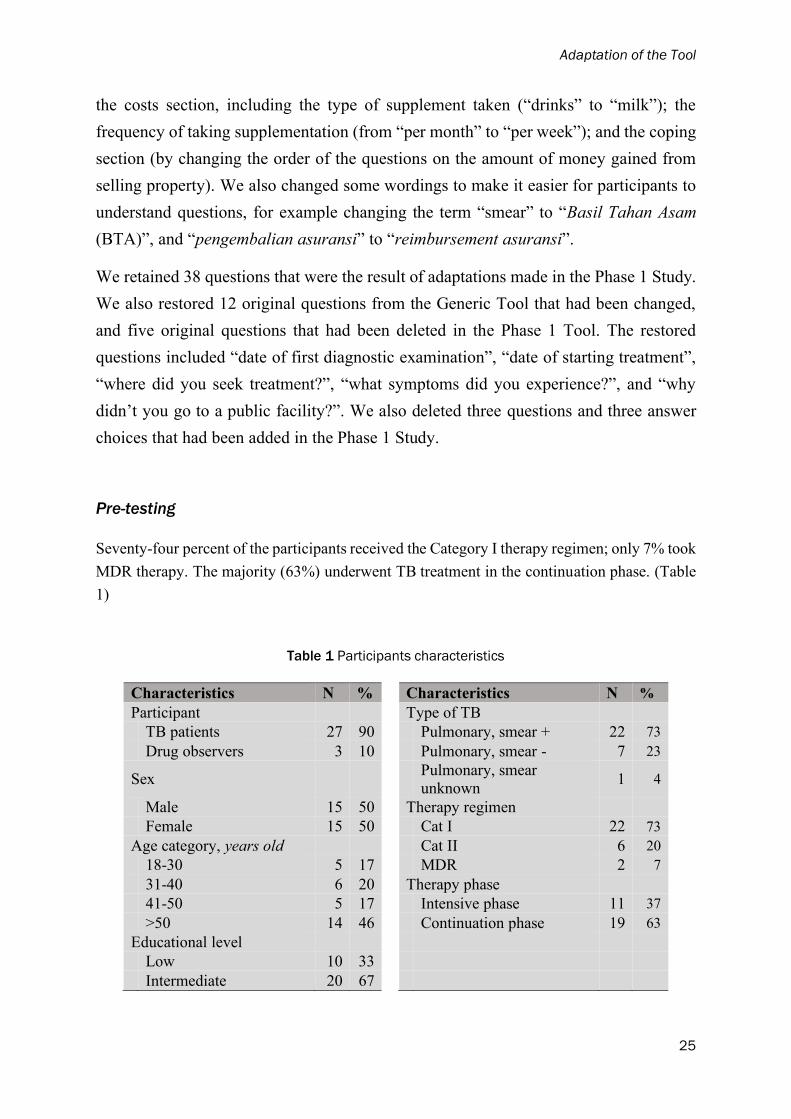
Pre-testing
Seventy-four percent of the participants received the Category I therapy regimen; only 7% took
MDR therapy. The majority (63%) underwent TB treatment in the continuation phase. (Table
1)
Table 1 Participants characteristics
Characteristics N % Characteristics N %
Participant Type of TB
TB patients 27 90 Pulmonary, smear + 22 73
Drug observers 3 10 Pulmonary, smear - 7 23
Sex
Pulmonary, smear
unknown 1 4
Male 15 50 Therapy regimen
Female 15 50 Cat I 22 73
Age category, years old Cat II 6 20
18-30 5 17 MDR 2 7
31-40 6 20 Therapy phase
41-50 5 17 Intensive phase 11 37
>50 14 46 Continuation phase 19 63
Educational level
Low 10 33
Intermediate 20 67
Chapter 2
26
The respondents indicated that the majority of questions were clear and easy to
understand. However, they had problems answering some others. Most respondents
forgot the date of their first TB examination (63%) and the date they started treatment
(57%). Neither did they know their HIV status (53%). We therefore added explanatory
notes for interviewers in the interview guidance. Instead of asking these data to
participants, interviewers should track the data in the patients’ medical records.
Respondents had difficulty to estimate transportation costs if they used their own
vehicle. To deal with that, we guided interviewers to ask transportation-related costs
such as parking or toll fees, but not fuel costs.
Many participants received bills from healthcare facilities that stated total amounts
without any itemization. They had difficulty to distinguish between administration,
laboratory, X-ray and drug costs. In such cases, we allowed interviewers to enter the
total amount under administration costs. We deleted sub-questions under hospitalization
costs and left only one question on total hospitalization costs since participants could
not detail hospital item costs. If a TB patient had sold property and did not know the
estimated market value, we added a question “Did the price conform to the estimated
market value?” and trained interviewers to ask the specific price when participants were
uncertain about the market value of property they had sold.
Annex B contains the final version of the questionnaire resulting from our Phase 2
study, together with the explanatory notes (Annex C).
Discussion
The Tool was successfully adapted to the current Indonesian context. It is now ready
for use in similar studies on TB cost measurement and for monitoring progress towards
the End TB Strategy target. Under the terms of the strategy, the government should
monitor this target until 2035. Monitoring TB related costs can help identify
determinants of TB treatment outcomes, and reduce the risk to treatment failure, severe
adverse outcome, and further spread of TB, MDR-TB, or even XDR-TB because of
socio-economic problems.2,4,15–17
In our view, the adapted Tool is suitable for the purpose: it is more comprehensive than
previous versions and is fully consistent with the situation that has pertained in

Adaptation of the Tool
27
Indonesia since the implementation of UHC. The Tool can measure not only total costs,
but – as recommended by the WHO – also catastrophic total costs.7
As well as the refinements made to the Phase 1 version of the Tool, the strengths of this
study include the relatively large number of respondents recruited, their wide age-range,
and the balance between the sexes. A limitation is the fact that we only interviewed
participants who were undergoing TB and MDR-TB treatment in PHCs. Thereby we
excluded those who underwent TB treatment in other types of health facility or who
dropped out of TB treatment. However, this limitation is acknowledged in the WHO
protocol, which excludes TB patients treated in facilities that are not linked to the
national tuberculosis program. This means that the adapted Tool is now the most
appropriate questionnaire for measuring catastrophic total costs.
The translation that followed from the Phase 1 Study was acceptable and easily
understood, and there was no need for re-translation from English to Bahasa Indonesia.
However, difficulties were encountered when seeking appropriate translations for terms
such “DOT”, “dispensary”, and “mission hospital” that have no specific equivalent in
Bahasa Indonesia. Another potential source of misunderstanding was how participants
define “primary income earner” or “pencari nafkah”, which may lead to confusion
between “pencari nafkah” (primary income earner/breadwinner) and “kepala
keluarga” (head of family). We therefore inserted an explanation of “primary income
earner” as the highest earners who actually spent their earnings on financing the
household.
In rural or remote areas of Indonesia where Bahasa Indonesia is not used in daily life,
future studies will need to further adapt the Tool to the cultural context and local
language. It is imperative that all question items are explained clearly in the local
languages.
The adaptation of the tool also provides useful insights for clinical practice. Instead of
merely focusing on clinical complaints of TB patients, clinicians should also take
socioeconomic problems into account, including the availability of health insurance,
traveling costs to visit the health facility, and potential income or job loss faced by the
patient and their families. Assessing patients’ financial capacity will help clinicians to
decide on appropriate prescription, including any additional supplements needed.
Clinicians may also refer patients to existing social protection programs, e.g., national
Chapter 2
28
health insurance or national employee insurance, if patients are uninsured, or refer them
to primary health centers that provide TB diagnostic and treatment freely.
Conclusion
Our adapted version of the Tool to Estimate Patient Costs proved to be acceptable for
use in Indonesia. Together with its explanations, it is easily understood by interviewers
and interviewees. It is ready for use in future studies on tuberculosis-related cost
estimation and catastrophic spending measurement.
Acknowledgements
Special thanks are due to Jahja Umar, Diah Handayani, and Budiyarti Setiyaningsih for their discussion,
valuable comments and inputs in the expert committee review. We also acknowledge Edine Tiemersma,
Firdaus Hafidz, and Bintari Dwi Hardiani who allowed and provided Phase 1 Tool for further
adaptation. We also thank David Alexander for language editing, and all interviewers who helped
collect the data.

Adaptation of the Tool
29
References 1. World Health Organization. Global tuberculosis report 2016. 21st Ed. Geneva: World Health
Organization; 2016.
2. Tanimura T, Jaramillo E, Weil D, Raviglione M, Lönnroth K. Financial burden for tuberculosis patients
in low- and middle-income countries: a systematic review. Eur Respir J. 2014 Jun;43(6):1763–75.
3. Ortblad KF, Salomon JA, Bärnighausen T, Atun R. Stopping tuberculosis: a biosocial model for
sustainable development. The Lancet. 2015 Dec 5;386(10010):2354–62.
4. Wingfield T, Boccia D, Tovar M, Gavino A, Zevallos K, Montoya R, et al. Defining Catastrophic Costs
and Comparing Their Importance for Adverse Tuberculosis Outcome with Multi-Drug Resistance: A
Prospective Cohort Study, Peru. PLOS Med. 2014 Jul 15;11(7):e1001675.
5. World Health Organization. WHO End TB Strategy. Geneva: World Health Organization; 2015.
Available from: http://www.who.int/tb/post2015_strategy/en/
6. World Health Organization. Global strategy and targets for tuberculosis prevention, care and control
after 2015. Geneva: World Health Organization; 2013. Report No.: EB134/12.
7. World Health Organization. Protocol for survey to determine direct and indirect costs due to TB and to
estimate proportion of TB-affected households experiencing catastrophic total costs due to TB. Geneva:
World Health Organization; 2015.
8. Mauch V, Woods N, Kirubi B, Kipruto H, Sitienei J, Klinkenberg E. Assessing access barriers to
tuberculosis care with the Tool to Estimate Patients’ Costs: pilot results from two districts in Kenya.
BMC Public Health. 2011;11:43.
9. Epstein J, Santo RM, Guillemin F. A review of guidelines for cross-cultural adaptation of
questionnaires could not bring out a consensus. J Clin Epidemiol. 2015 Apr;68(4):435–41.
10. Mokkink LB, Terwee CB, Patrick DL, Alonso J, Stratford PW, Knol DL, et al. The COSMIN checklist
for assessing the methodological quality of studies on measurement properties of health status
measurement instruments: an international Delphi study. Qual Life Res Int J Qual Life Asp Treat Care
Rehabil. 2010 May;19(4):539–49.
11. Tiemersma E, Hafidz F. Costs faced by (multidrug resistant) tuberculosis patients during diagnosis and
treatment: report from a pilot study in Indonesia. The Hague, the Netherlands: KNCV Tuberculosis
Foundation; 2014.
12. van den Hof S, Collins D, Hafidz F, Beyene D, Tursynbayeva A, Tiemersma E. The socioeconomic
impact of multidrug resistant tuberculosis on patients: results from Ethiopia, Indonesia and Kazakhstan.
BMC Infect Dis. 2016 Sep 5;16:470.
13. Bruyère O, Demoulin M, Beaudart C, Hill JC, Maquet D, Genevay S, et al. Validity and reliability of
the French version of the STarT Back screening tool for patients with low back pain. Spine. 2014 Jan
15;39(2):E123-128.
14. Beaton DE, Bombardier C, Guillemin F, Ferraz MB. Guidelines for the process of cross-cultural
adaptation of self-report measures. Spine. 2000 Dec 15;25(24):3186–91.
15. Dheda K, Barry CE, Maartens G. Tuberculosis. The Lancet. 2016 Mar 19;387(10024):1211–26.
16. Lawn SD, Badri M, Wood R. Tuberculosis among HIV-infected patients receiving HAART: long term
incidence and risk factors in a South African cohort. AIDS Lond Engl. 2005 Dec 2;19(18):2109–16.
17. Baral SC, Aryal Y, Bhattrai R, King R, Newell JN. The importance of providing counselling and
financial support to patients receiving treatment for multi-drug resistant TB: mixed method qualitative
and pilot intervention studies. BMC Public Health. 2014 Jan 17;14:46.


Chapter 3
Catastrophic total costs in tuberculosis-
affected households and their
determinants since Indonesia’s
implementation of universal health
coverage
Ahmad Fuady1,2, Tanja A.J. Houweling1, Muchtaruddin Mansyur2, Jan
Hendrik Richardus1
1Department of Public Health, Erasmus MC, University Medical Center
Rotterdam, The Netherlands. 2Department of Community Medicine,
Faculty of Medicine, Universitas Indonesia, Indonesia.
Fuady et al. Infectious Diseases of Poverty. 2018; 7:3
Chapter 3
32
Abstract
Background:
As well as imposing an economic burden on affected households, the high costs related
to tuberculosis (TB) can create access and adherence barriers. This highlights the
particular urgency of achieving one of the End TB Strategy’s targets: that no TB-
affected households have to face catastrophic costs by 2020. In Indonesia, as elsewhere,
there is also an emerging need to provide social protection by implementing universal
health coverage (UHC). We therefore assessed the incidence of catastrophic total costs
due to TB, and their determinants since the implementation of UHC.
Methods:
We interviewed adult TB and multidrug-resistant TB (MDR-TB) patients in urban,
suburban and rural areas of Indonesia who had been treated for at least one month or
had finished treatment no more than one month earlier. Following the WHO
recommendation, we assessed the incidence of catastrophic total costs due to TB. We
also analyzed the sensitivity of incidence relative to several thresholds, and measured
differences between poor and non-poor households in the incidence of catastrophic
costs. Generalized linear mixed-model analysis was used to identify determinants of the
catastrophic total costs.
Results:
We analyzed 282 TB and 64 MDR-TB patients. For TB-related services, the median
(interquartile range) of total costs incurred by households was USD 133 (55-576); for
MDR-TB-related services, it was USD 2804 (1008-4325). The incidence of catastrophic
total costs in all TB-affected households was 36% (43% in poor households and 25%
in non-poor households). For MDR-TB-affected households, the incidence was 83%
(83% and 83%). In TB-affected households, the determinants of catastrophic total costs
were poor households (adjusted odds ratio [aOR] = 3.7, 95% confidence interval [CI]:
1.7-7.8); being a breadwinner (aOR= 2.9,95%CI: 1.3-6.6); job loss (aOR= 21.2; 95%CI:
8.3-53.9); and previous TB treatment (aOR= 2.9; 95%CI: 1.4-6.1). In MDR-TB-
affected households, having an income-earning job before diagnosis was the only
determinant of catastrophic total costs (aOR= 8.7; 95%CI: 1.8-41.7).
Conclusions:
Despite the implementation of UHC, TB-affected households still risk catastrophic total
costs and further impoverishment. As well as ensuring access to healthcare, a cost-
mitigation policy and additional financial protection should be provided to protect the
poor and relieve income losses.
Catastrophic costs due to TB
33
Background
The estimated 1.4 million deaths to tuberculosis (TB) in 2015 exemplify the persisting
burden of TB. With a global incidence that declines by only 2% annually worldwide,
slow progress is being made towards the target for eliminating the disease by 2035.1,2
These stark figures show that global action should be taken to adjust strategies and to
combine initiatives such as promoting clinical adherence and providing socio-economic
support.3,4
Although TB patients in most high TB-burden countries have free access to anti-TB
drugs, they often incur high costs for travel and food, and suffer income losses that can
amount to over half of annual household income.5,6 Such financial hardship creates an
adherence barrier to diagnostic procedures and treatment, resulting in poor outcomes
and increasing the risk of transmission in the community.5-8 Accessing TB-related
services also has economic consequences. The job or income losses experienced by TB
patients, especially those in the productive age group, can reduce the financial capacity
of their households and cast them into the poverty trap.9-11
To address the socio-economic determinants and financial impact of TB, the WHO End
TB Strategy acknowledges the need for social protection by setting a clear first
milestone that no TB-affected families should face catastrophic TB-related costs after
2020.1,2 This target complements the Sustainable Development Goal (SDG) of
achieving universal health coverage (UHC) through the provision of more affordable
and high-quality healthcare services.3,12
Indonesia started its UHC program in 2014 by offering national public insurance and
by engaging more private providers in the network managed by the Social Security
Agency (Badan Penyelenggara Jaminan Sosial, BPJS), the Ministry of Health and the
Ministry of Social Affairs. It is assumed that direct medical costs, which are costs
incurred for diagnostic tests, treatment, and follow-up tests, will be reduced by the
national insurance scheme, which covers all medical costs in primary to tertiary care,
including TB-related services.13 Due to Indonesians people’s strong preference for
seeking care with private providers, the involvement of more private providers in the
BPJS network is also expected to have an impact by reducing medical expenses which
were reportedly three times higher than those charged by public providers,14 and by
reducing the number of people who develop TB but are not diagnosed or cannot access
Chapter 3
34
TB care services that conform with International Standard of Tuberculosis Care
(ISTC).9
Accessing healthcare services is time-consuming and costly.9,10,15-17 The Indonesian
National TB Program (NTP) has attempted to provide support in the form of
food/nutritional supplementation and travel vouchers, for example, in addition to
diagnostic examination and drug costs coverage. However, the policy has changed and
the support has been restricted or even ended. It leaves direct non-medical costs
including travel and food/nutritional supplement costs uncovered and can lead to
catastrophic health expenditure (CHE). As TB and multidrug-resistant TB (MDR-TB)
require a long period of treatment, and also worsen the health status, TB patients also
suffer from job or income losses that aggravate the risk of catastrophic costs and barriers
to treatment adherence.
The WHO has introduced a new term “Catastrophic total costs” as the TB-specific
indicator that differs in essence from CHE. CHE is defined as the share of the population
spending more than a given threshold and focuses on direct cash spending or out-of-
pocket (OOP) payments made by household to improve or restore health of household
members. The TB-specific indicator of “catastrophic total costs” incorporates direct
medical costs, direct non-medical costs, and overall indirect costs, and also helps to
capture the economic burden specific for TB.18,19 It is therefore crucial for TB
elimination programs to identify the main cost drivers, monitor financial hardship, and
establish which further health and social policy measures should be taken.18 For this
reason, we aimed not only to measure the incidence of catastrophic total costs caused
by TB and the sensitivity of the incidence relative to a range of specific thresholds, but
also to assess differences between poor and non-poor households in terms of the
incidence of catastrophic total costs and to identify the determinants of catastrophic
total costs since Indonesia’s implementation of UHC.
Methods
Study design
From July to September 2016, stratified clustered sampling was used to enroll TB
patients in an urban district (Jakarta), a suburban district (Depok) and a rural district

Catastrophic costs due to TB
35
(Tasikmalaya). Per district, we randomly selected 6-8 primary health centers (PHCs)
linked with the NTP. Until reaching our predetermined sample size, we enrolled all the
consecutive TB patients who attended these PHCs and who also met our inclusion
criteria: they were aged 18 years or above, had undergone the adult diagnostic
procedure, had been treated for at least one month or had finished treatment no more
than a month previously, and had signed informed consent. Extra-pulmonary TB cases
were excluded. Assuming a power of 0.80, a 1꞉1꞉1 ratio of urban to suburban to rural
districts, and that the incidence of TB-related catastrophic total costs in each district
was 20%, 25%, and 30%, we collected a minimum of 90 patients in each district.
MDR-TB patients were enrolled at Persahabatan Hospital, an MDR-TB referral hospital
in Jakarta. We selected those adult MDR-TB patients who came to the hospital
consecutively, had undergone MDR-TB treatment in the hospital for at least one month,
had recorded a diagnostic result as MDR-TB, either by GenXpert or sputum culture;
and had signed the informed consent form.
Cost measurement
Ten medical students and public health graduates were recruited and trained as
interviewers. Using the adapted Bahasa Indonesia version of the Tool to Estimate
Patient Costs, they then interviewed patients and/or their drug observer, i.e., a family
member who was selected as the patient’s direct-observation-of-treatment supporter.20-
22 Retrospectively, each respondent reported all types of cost related to the TB care
services they had incurred during the pre-diagnostic, diagnostic, and treatment phases.
(Table 1)
Pre-diagnostic and diagnostic costs
The pre-diagnostic and diagnostic costs were the sum of all the direct and indirect costs
incurred for pre-diagnostic and diagnostic visits. The direct costs included all OOP
payments incurred after any reimbursement for medical fees and all non-medical
expenditures made by patients or their guardian (i.e., a family member who
accompanied them during visits). Indirect costs consisted of the income loss reported
by patients and guardians.

Chapter 3
36
Table 1 Definition of costs and income used in this study
Variables Definition Direct costs Indirect
costs
Pre-diagnostic
and diagnostic
costs
All types of cost incurred
during the period between
the onset of symptoms and
diagnosis with TB in public
or private healthcare
facilities, at a pharmacy, or
by a practitioner of
alternative medicine.
Medical: Costs of
consultation, administration,
laboratory tests, X-ray
examinations, and drugs.
Non-medical: Costs of food
and travel for patient and/or
guardian.
Patient’s and
guardian’s
income
losses.
Treatment
costs
All types of cost incurred
after being diagnosed and
treated for TB, includes the
costs of hospitalization and
adverse events.
Medical: Costs of
administration, evaluation
(laboratory test, X-ray
examination, or others),
hospitalization, and adverse
events.
Non-medical: Costs of food
and travel (for patient and/or
guardian), and food
supplements.
Patient’s and
guardian’s
income
losses.
Treatment costs
The costs of anti-TB drugs are covered by the NTP. We calculated the administration
or registration fee, food and travel costs that were typical for each visit. To estimate the
costs per month, we then multiplied these cost items by the number of visits per month.
Any travel vouchers given to patients were included as a deduction of travel costs. We
also summed treatment evaluation costs according to the number of evaluation tests
conducted. We estimated patient’s income losses on the basis of income changes
reported after diagnosis with TB. To avoid underestimates for people such as taxibike
drivers who continued to earn uncertain monthly incomes from informal jobs, we also
estimated time-loss value. To calculate this time-loss value, we used the following
formula: round trip in minutes for a typical visit × patient’s income loss per minute ×
the number of visits per month.5
Catastrophic costs due to TB
37
We interviewed some patients in the intensive treatment phase and others in the
continuation treatment phase. For patients interviewed during the intensive phase, we
obtained the reported costs of the intensive phase from the patient and estimated the
costs in the continuation phase on the basis of the data of other patients in other PHCs
within a similar district. For patients interviewed during the continuation phase, we
obtained reported costs from the patient in both the intensive and continuation phases,
then extrapolated the reported costs to obtain the total costs of both phases. To estimate
the entire treatment costs, we extrapolated the monthly costs according to the
internationally defined durations of the intensive and continuation phases: (a) two
months (for the intensive phase) and four months (for the continuation phase) of new
TB treatment (Category I); (b) three and five months for re-treatment (Category II), and
(c) eight and twelve months for MDR-TB treatment.5,23,24
We summed other direct medical costs, e.g. hospitalization and any adverse event costs,
that were uncovered by health insurance. We also calculated monthly nutritional/food
supplement costs incurred by patients, such as vitamins, fruit, milk, meat, or other
supplements consumed as a result of TB treatment.
To measure income loss, we established the household income earned through the
incomes of patients and other family members, through government aid, and through
other income, before and after the patients had been diagnosed with TB. A household
earning below USD 1.9 per capita per day was classified as a poor household.25 As
many Indonesians live in extended families that may have more than one income earner
per household, we defined a patient as breadwinner if his/her income was at least 10%
higher than that of any other family member.26,27 All costs and incomes were converted
to US dollars using the average exchange rate calculated by the World Bank for 2015
(USD 1 = IDR 13389.41).28
Catastrophic total costs
The WHO protocol takes two approaches to measuring the percentage of patients
experiencing catastrophic total costs. The first is based on total costs, and defines
catastrophic total costs as total costs (direct and indirect costs) incurred by household
that exceed 20% of the household’s annual income. The second approach defines
catastrophic total costs as the share of TB patients who experience dissaving by taking
Chapter 3
38
a loan or selling property or livestock to deal with costs related to TB[18]. In this study,
we applied the first approach. Total costs due to TB were defined as the sum of the
OOPs incurred for medical diagnosis and treatment (OOPM), OOPs for non-medical
expenditures related to the use of TB care services (OOPNM), and patients’ and
guardians’ reported income losses or time losses valuations (IN), net of any
reimbursement and welfare payments. The denominator was reported annual household
income in the year before diagnosis with TB.18
𝐼𝑇𝐵
𝑁𝑇𝑃=
1
𝑛𝑇𝐵
𝑁𝑇𝑃
∑ 1 (∑𝑛𝑖
𝑗 = 1
𝑂𝑂𝑃𝑀𝑇𝐵, ℎ
𝑗 + 𝑂𝑂𝑃𝑁𝑀
𝑇𝐵, ℎ𝑗
+ 𝐼𝑁 𝑇𝐵, ℎ
𝑗
𝑦ℎ𝑖
> 𝜏𝑇𝐵
)
𝑛 𝑇𝐵𝑁𝑇𝑃
𝑖=1
As well as measuring the incidence of catastrophic total costs, referred to here as the
headcount (H), we established the sensitivity of this headcount (i.e. incidence) relative
to thresholds of 5%, 10%, 15%, 20%, and 25% as used in other previous studies.10,11
For each threshold, we also calculated mean gap indicators (G) and mean positive gap
(MPG). The G indicates the average amount by which payments, as a proportion of
household income, exceed the threshold. The MPG is equal to G/H, and helps to identify
how excessive the total costs are by indicating the excess expenditure per household
that experiences catastrophic total costs.7,11,31,32
To analyze the different pictures provided by the catastrophic total cost approach and
the CHE approach, we compared the H’s, G’s, and MPGs per threshold between these
two approaches.29,30 Per threshold, we also analyzed differences between poor and non-
poor households in the H’s, G’s, and MPGs of catastrophic total costs.
Fourteen patient variables were examined as potential determinants of catastrophic total
costs: (1) district (urban, suburban, rural), (2) household income (poor and non-poor),
(3) sex, (4) age group, (5) educational level (primary school as “low,” junior school and
senior high school as “intermediate”; and college and university as “high”), (6) being a
family breadwinner, (7) having had an income-earning job before diagnosis, (8) having
insurance before being diagnosed, (9) having had previous TB treatment, (10) HIV
status, (11) hospitalization for the current TB treatment, (12) first contact with the
facility after having symptoms of TB, (13) taking supplementation, and (14)
experiencing adverse effects.

Catastrophic costs due to TB
39
Data analysis
To ensure data quality, we used Microsoft Excel 2010 and EpiInfo version 7 (CDC,
Atlanta) to double-enter and to check the data. Abnormally distributed data were
displayed as median (inter-quartile range [IQR, q25-q75]), while categorical variables
were shown as numbers and proportions (%). The Mann-Whitney test was used to
compare all types of the cost incurred for access TB-related services between poor and
non-poor households.
We used random effects to adjust for our cluster sampling design (19 PHCs), and used
the generalized linear mixed model to examine determinants of the incidence with
which TB-affected households faced catastrophic total costs. For MDR-TB cases, we
used binary logistic regression to examine the determinants of catastrophic total costs.
In the univariate analysis, we estimated the significance (P), the crude odds ratios
(cORs), and their 95% confidence intervals (CIs). To identify the best model and
estimate the significances, adjusted ORs (aORs) and the 95% CIs of the determinants,
we included all variables with a P<0.25 in the univariate analysis in a multivariable
analysis.
Ethical issues
Before the interview, all respondents received written and oral explanations of the study
and signed an informed-consent form. Ethical clearance for this study was provided by
the Ethical Committee at the Faculty of Medicine of Universitas Indonesia–Cipto
Mangunkusumo Hospital, Jakarta, Indonesia (No. 416/UN2.F1/ETIK/VI/2016) and the
Ethical Committee at Persahabatan Hospital, Jakarta, Indonesia (No.
DL.01.03/II.3/3817/2016).
Results
Patients characteristics
As eight (3%) of the 354 eligible TB and MDR-TB patients did not report their
household income, we analyzed the data for 346 patients (282 TB and 64 MDR-TB
patients). (Table 2) Most patients were of working age, had an intermediate educational
background, and lived in a poor household. Thirty-two percent of the TB patients with

Chapter 3
40
an income-earning job had lost their job after diagnosis, against 69% of the MDR-TB
patients. Less than one-third (23%) of the TB patients in the urban study area did not
have health insurance, compared with 59% in the rural study area. Most patients had
smear-positive TB and were divided equally according to the phase of treatment.
Most TB patients first sought care at primary health center. Our results also show that
a high proportion of TB patients went first to a private provider; even in rural areas, this
figure was 46%. Investigation of the reasons for not choosing a public provider showed
that the distance to the public facility was a prominent issue, as were personal preference
and familiarity with a specific private facility. (See Annex D)
Table 2 Patient characteristics
Characteristics TB (%)
MDR-TB
(%)
Total Urban Suburban Rural
Sex n=282 n=95 n=90 n=97 n=64 Male 155 (55) 51 (54) 52 (58) 52 (54) 31 (48) Female 127 (45) 44 (46) 38 (42) 45 (46) 33 (52)
Age in years 18-40 137 (49) 45 (47) 47 (52) 45 (46) 34 (53)
41-64 123 (44) 44 (46) 38 (42) 41 (42) 29 (45)
>64 22 (8) 6 (6) 5 (6) 11 (11) 1 (2) Educational level
Low 99 (35) 25 (26) 18 (20) 56 (58) 12 (19) Intermediate 172 (61) 67 (71) 65 (72) 40 (41) 42 (65) High 11 (4) 3 (3) 7 (8) 1 (1) 10 (16)
Household income
Poor 175 (62) 46 (48) 45 (50) 84 (87) 23 (36)
Non-poor 107 (38) 49 (52) 45 (50) 13 (13) 41 (64) Breadwinner
Patient 124 (44) 48 (51) 38 (42) 38 (39) 25 (39) Not patient 158 (56) 47 (49) 52 (58) 59 (61) 39 (61)
Income-earning job
Yes 201 (71) 73 (77) 61 (68) 67 (69) 49 (77) No 81 (29) 22 (23) 29 (32) 30 (31) 15 (23)
Job loss
Job loss 64 (23) 17 (18) 18 (20) 29 (30) 34 (53) No job loss 218 (77) 78 (82) 72 (80) 68 (70) 30 (47)
Having health insurance
Yes 176 (62) 73 (77) 63 (70) 40 (41) 56 (87)
No 106 (38) 22 (23) 27 (30) 57 (59) 8 (13) Insurance type n=176 n=73 n=63 n=40 n=56
BPJS, (paid by
governmenta) 119 (68) 52 (71) 33 (52) 34 (85) 24 (43)
BPJS, (self-paidb) 53 (30) 19 (26) 28 (44) 6 (15) 32 (57) Private insurance 4 (2) 2 (3) 2 (3) 0 (0) 0 (0)

Catastrophic costs due to TB
41
Characteristics TB (%)
MDR-TB
(%)
Total Urban Suburban Rural
Monthly income n=201 n=73 n=61 n=67 n=49 Paid regularly 90 (45) 32 (44) 39 (64) 19 (28) 34 (69) Uncertain 105 (52) 37 (51) 20 (33) 48 (72) 13 (27) Others 6 (3) 4 (5) 2 (3) 0 (0) 2 (4)
n=282 n=95 n=90 n=97 n=64
Type of TB
Pulmonary, smear + 186 (66) 70 (74) 62 (69) 54 (56) 64 (100) Pulmonary, smear - 80 (28) 23 (24) 24 (27) 33 (34) 0 (0)
Pulmonary, smear unknown
16 (6) 2 (2) 4 (4) 10 (10) 0 (0)
Therapy phase Intensive phase 134 (48) 38 (40) 51 (57) 45 (46) 37 (58) Continuation phase 148 (52) 57 (60) 39 (43) 52 (54) 27 (42)
HIV status Positive 6 (2) 5 (5) 1 (1) 0 (0) 0 (0) Negative 92 (33) 51 (54) 17 (19) 24 (25) 32 (50) Not tested/unknown 184 (65) 39 (41) 72 (80) 73 (75) 32 (50)
Hospitalization
Yes 39 (14) 11 (12) 13 (14) 15 (16) 34 (53) No 243 (86) 84 (88) 77 (86) 82 (84) 30 (47)
Previous TB treatment Yes 58 (21) 29 (31) 20 (22) 9 (9) 56 (87) No 224 (79) 66 (69) 70 (78) 88 (91) 8 (13)
Completed previous TB
treatment n=58 n=29 n=20 n=8 n=56
Yes 35 (61) 19 (65) 10 (50) 6 (75) 34 (61) No 22 (39) 10 (35) 10 (50) 2 (25) 22 (39)
First contact
Primary health center
127 (45) 51 (54) 40 (44) 36 (37) 29 (45)
Private clinic 94 (33) 26 (27) 26 (29) 42 (43) 2 (3)
Public hospital 32 (11) 11 (12) 10 (11) 11 (11) 25 (39)
Private hospital 20 (7) 4 (4) 13 (14) 3 (3) 8 (13) Other facility 9 (3) 3 (3) 1 (1) 5 (5) 0 (0)
aTheir national public insurance (BPJS) premiums were paid by the government; bThey paid national public
insurance (BPJS) premium out of their pocket. TB-related total costs
The median (IQR) of total costs was USD 133 in the TB group (55-576) and USD 2804
in the MDR-TB group (1008-4325). (Table 3)
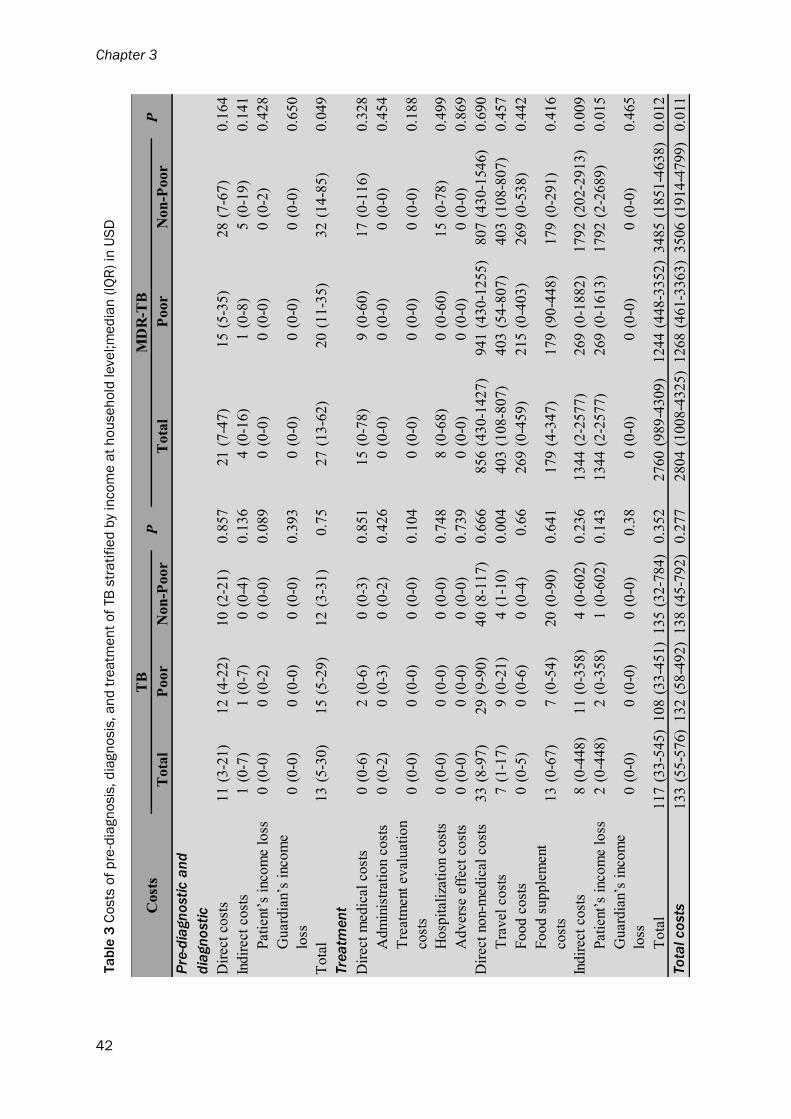
Chapter 3
42
11
(3-2
1)
12
(4-2
2)
10
(2-2
1)
0.8
57
21
(7-4
7)
15
(5-3
5)
28
(7-6
7)
0.1
64
1(0
-7)
1(0
-7)
0(0
-4)
0.1
36
4(0
-16)
1(0
-8)
5(0
-19)
0.1
41
Pat
ient
’s i
ncom
e lo
ss0
(0-0
)0
(0-2
)0
(0-0
)0.0
89
0(0
-0)
0(0
-0)
0(0
-2)
0.4
28
Guar
dia
n’s
inco
me
loss
0(0
-0)
0(0
-0)
0(0
-0)
0.3
93
0(0
-0)
0(0
-0)
0(0
-0)
0.6
50
13
(5-3
0)
15
(5-2
9)
12
(3-3
1)
0.7
527
(13-6
2)
20
(11-3
5)
32
(14-8
5)
0.0
49
0(0
-6)
2(0
-6)
0(0
-3)
0.8
51
15
(0-7
8)
9(0
-60)
17
(0-1
16)
0.3
28
Adm
inis
trat
ion
cost
s0
(0-2
)0
(0-3
)0
(0-2
)0.4
26
0(0
-0)
0(0
-0)
0(0
-0)
0.4
54
Tre
atm
ent
eval
uat
ion
cost
s0
(0-0
)0
(0-0
)0
(0-0
)0.1
04
0(0
-0)
0(0
-0)
0(0
-0)
0.1
88
Hosp
ital
izat
ion
cost
s0
(0-0
)0
(0-0
)0
(0-0
)0.7
48
8(0
-68)
0(0
-60)
15
(0-7
8)
0.4
99
Adver
se e
ffec
t co
sts
0(0
-0)
0(0
-0)
0(0
-0)
0.7
39
0(0
-0)
0(0
-0)
0(0
-0)
0.8
69
33
(8-9
7)
29
(9-9
0)
40
(8-1
17)
0.6
66
856
(430-1
427)
941
(430-1
255)
807
(430-1
546)
0.6
90
Tra
vel
cost
s7
(1-1
7)
9(0
-21)
4(1
-10)
0.0
04
403
(108-8
07)
403
(54-8
07)
403
(108-8
07)
0.4
57
Food c
ost
s0
(0-5
)0
(0-6
)0
(0-4
)0.6
6269
(0-4
59)
215
(0-4
03)
269
(0-5
38)
0.4
42
Food s
upple
men
t
cost
s13
(0-6
7)
7(0
-54)
20
(0-9
0)
0.6
41
179
(4-3
47)
179
(90-4
48)
179
(0-2
91)
0.4
16
8(0
-448)
11
(0-3
58)
4(0
-602)
0.2
36
1344
(2-2
577)
269
(0-1
882)
1792
(202-2
913)
0.0
09
Pat
ient
’s i
ncom
e lo
ss2
(0-4
48)
2(0
-358)
1(0
-602)
0.1
43
1344
(2-2
577)
269
(0-1
613)
1792
(2-2
689)
0.0
15
Guar
dia
n’s
inco
me
loss
0(0
-0)
0(0
-0)
0(0
-0)
0.3
80
(0-0
)0
(0-0
)0
(0-0
)0.4
65
Tota
l117
(33-5
45)
108
(33-4
51)
135
(32-7
84)
0.3
52
2760
(989-4
309)
1244
(448-3
352)
3485
(1851-4
638)
0.0
12
133
(55-5
76)
132
(58-4
92)
138
(45-7
92)
0.2
77
2804
(1008-4
325)
1268
(461-3
363)
3506
(1914-4
799)
0.0
11
P
To
tal co
sts
Indir
ect
cost
s
Dir
ect
non-
med
ical
cost
s
Tre
atm
en
t
Dir
ect
med
ical
cost
s
Indir
ect
cost
s
Tota
l
Poor
Non
-Poor
Pre
-dia
gn
osti
c a
nd
dia
gn
osti
c
Dir
ect
cost
sCost
sT
BP
MD
R-T
B
Tota
lP
oor
Non
-Poor
Tota
l
Ta
ble
3 C
osts
of
pre
-dia
gn
osi
s, d
iagn
osis
, a
nd
tre
atm
en
t o
f TB
str
ati
fie
d b
y in
co
me
at
ho
use
hold
le
ve
l;m
ed
ian
(IQ
R)
in U
SD
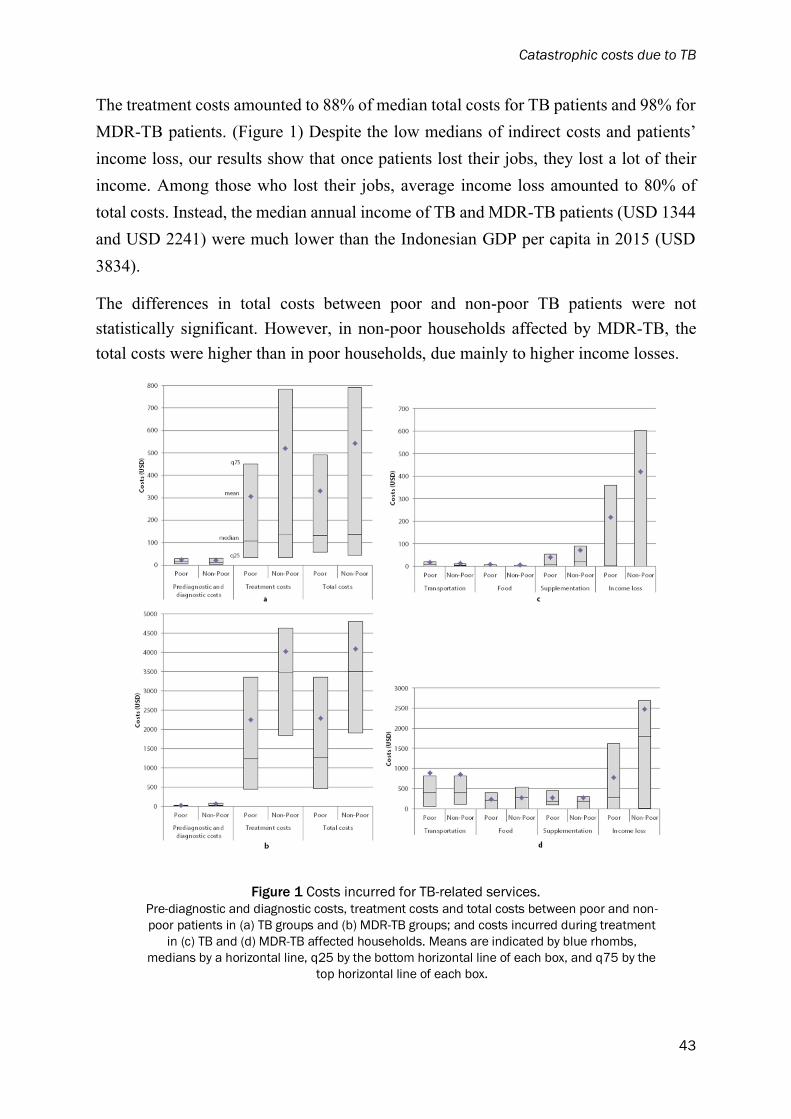
Catastrophic costs due to TB
43
The treatment costs amounted to 88% of median total costs for TB patients and 98% for
MDR-TB patients. (Figure 1) Despite the low medians of indirect costs and patients’
income loss, our results show that once patients lost their jobs, they lost a lot of their
income. Among those who lost their jobs, average income loss amounted to 80% of
total costs. Instead, the median annual income of TB and MDR-TB patients (USD 1344
and USD 2241) were much lower than the Indonesian GDP per capita in 2015 (USD
3834).
The differences in total costs between poor and non-poor TB patients were not
statistically significant. However, in non-poor households affected by MDR-TB, the
total costs were higher than in poor households, due mainly to higher income losses.
Figure 1 Costs incurred for TB-related services. Pre-diagnostic and diagnostic costs, treatment costs and total costs between poor and non-
poor patients in (a) TB groups and (b) MDR-TB groups; and costs incurred during treatment
in (c) TB and (d) MDR-TB affected households. Means are indicated by blue rhombs,
medians by a horizontal line, q25 by the bottom horizontal line of each box, and q75 by the
top horizontal line of each box.
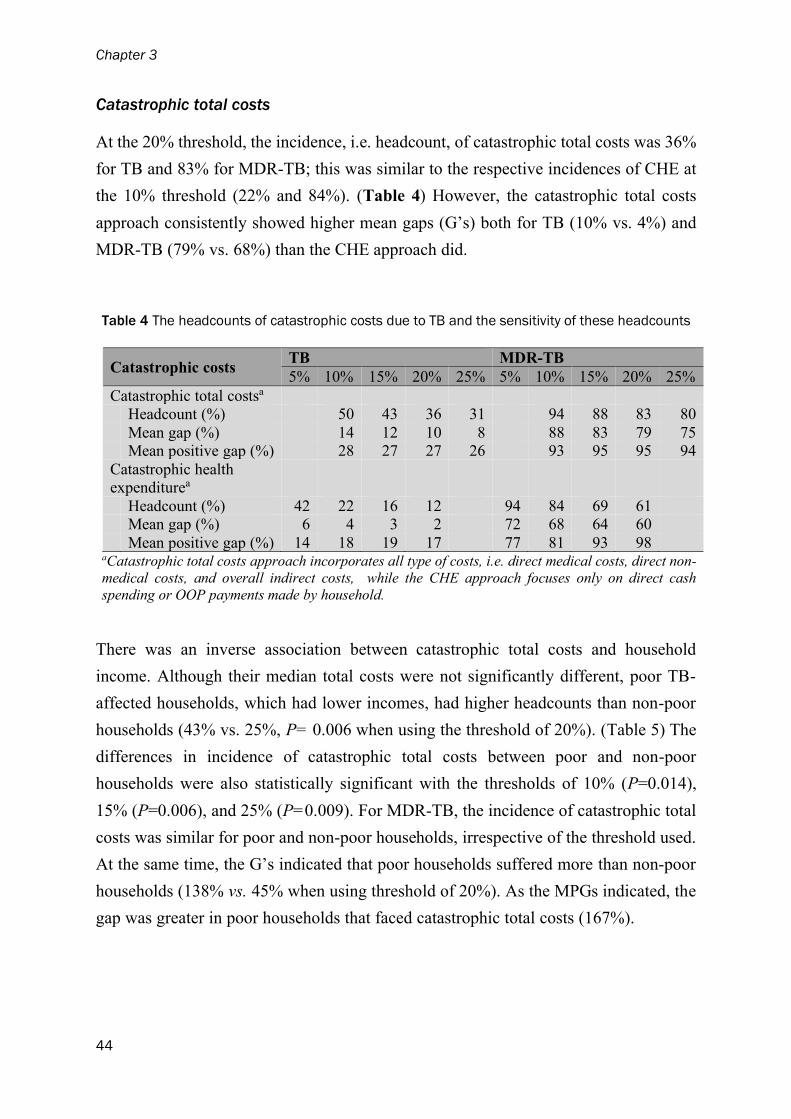
Chapter 3
44
Catastrophic total costs
At the 20% threshold, the incidence, i.e. headcount, of catastrophic total costs was 36%
for TB and 83% for MDR-TB; this was similar to the respective incidences of CHE at
the 10% threshold (22% and 84%). (Table 4) However, the catastrophic total costs
approach consistently showed higher mean gaps (G’s) both for TB (10% vs. 4%) and
MDR-TB (79% vs. 68%) than the CHE approach did.
Table 4 The headcounts of catastrophic costs due to TB and the sensitivity of these headcounts
Catastrophic costs TB MDR-TB
5% 10% 15% 20% 25% 5% 10% 15% 20% 25%
Catastrophic total costsa
Headcount (%) 50 43 36 31 94 88 83 80 Mean gap (%) 14 12 10 8 88 83 79 75 Mean positive gap (%) 28 27 27 26 93 95 95 94
Catastrophic health
expenditurea
Headcount (%) 42 22 16 12 94 84 69 61 Mean gap (%) 6 4 3 2 72 68 64 60 Mean positive gap (%) 14 18 19 17 77 81 93 98
aCatastrophic total costs approach incorporates all type of costs, i.e. direct medical costs, direct non-
medical costs, and overall indirect costs, while the CHE approach focuses only on direct cash
spending or OOP payments made by household.
There was an inverse association between catastrophic total costs and household
income. Although their median total costs were not significantly different, poor TB-
affected households, which had lower incomes, had higher headcounts than non-poor
households (43% vs. 25%, P= 0.006 when using the threshold of 20%). (Table 5) The
differences in incidence of catastrophic total costs between poor and non-poor
households were also statistically significant with the thresholds of 10% (P=0.014),
15% (P=0.006), and 25% (P=0.009). For MDR-TB, the incidence of catastrophic total
costs was similar for poor and non-poor households, irrespective of the threshold used.
At the same time, the G’s indicated that poor households suffered more than non-poor
households (138% vs. 45% when using threshold of 20%). As the MPGs indicated, the
gap was greater in poor households that faced catastrophic total costs (167%).
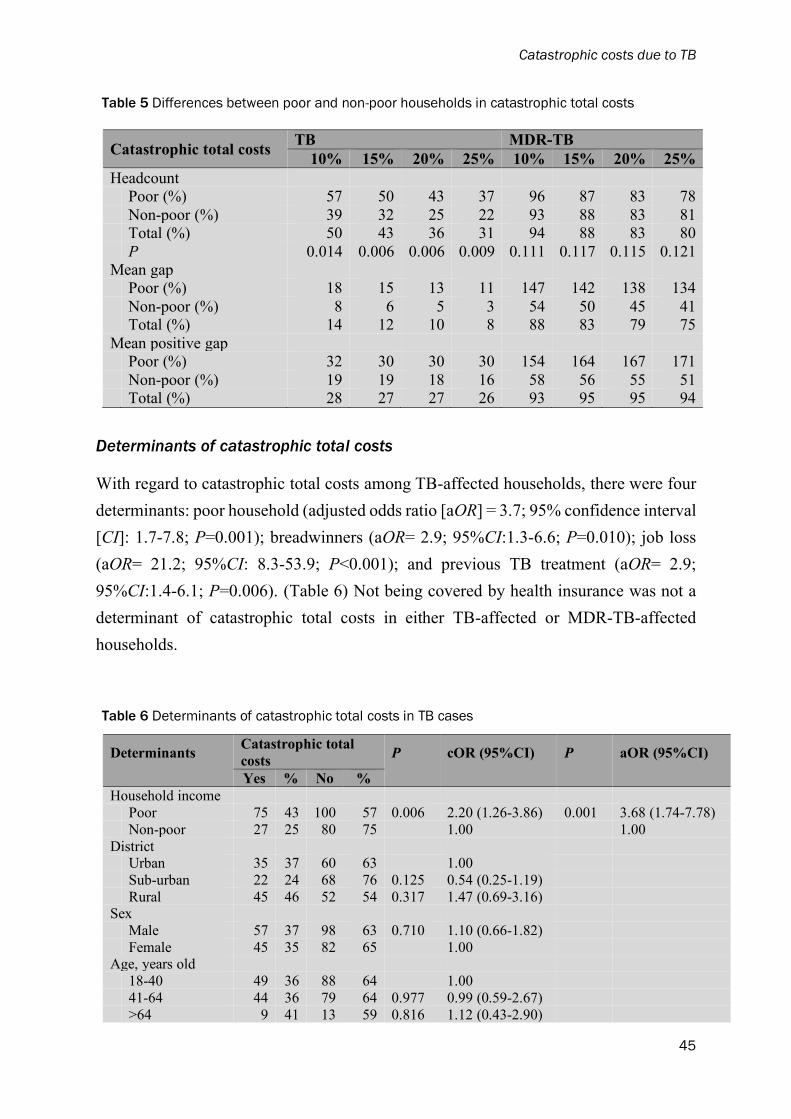
Catastrophic costs due to TB
45
Table 5 Differences between poor and non-poor households in catastrophic total costs
Catastrophic total costs TB MDR-TB
10% 15% 20% 25% 10% 15% 20% 25%
Headcount
Poor (%) 57 50 43 37 96 87 83 78 Non-poor (%) 39 32 25 22 93 88 83 81 Total (%) 50 43 36 31 94 88 83 80 P 0.014 0.006 0.006 0.009 0.111 0.117 0.115 0.121
Mean gap
Poor (%) 18 15 13 11 147 142 138 134 Non-poor (%) 8 6 5 3 54 50 45 41 Total (%) 14 12 10 8 88 83 79 75
Mean positive gap
Poor (%) 32 30 30 30 154 164 167 171 Non-poor (%) 19 19 18 16 58 56 55 51
Total (%) 28 27 27 26 93 95 95 94
Determinants of catastrophic total costs
With regard to catastrophic total costs among TB-affected households, there were four
determinants: poor household (adjusted odds ratio [aOR] = 3.7; 95% confidence interval
[CI]: 1.7-7.8; P=0.001); breadwinners (aOR= 2.9; 95%CI:1.3-6.6; P=0.010); job loss
(aOR= 21.2; 95%CI: 8.3-53.9; P<0.001); and previous TB treatment (aOR= 2.9;
95%CI:1.4-6.1; P=0.006). (Table 6) Not being covered by health insurance was not a
determinant of catastrophic total costs in either TB-affected or MDR-TB-affected
households.
Table 6 Determinants of catastrophic total costs in TB cases
Determinants
Catastrophic total
costs P
cOR (95%CI)
P
aOR (95%CI)
Yes % No %
Household income
Poor 75 43 100 57 0.006 2.20 (1.26-3.86) 0.001 3.68 (1.74-7.78) Non-poor 27 25 80 75 1.00 1.00
District
Urban 35 37 60 63 1.00
Sub-urban 22 24 68 76 0.125 0.54 (0.25-1.19) Rural 45 46 52 54 0.317 1.47 (0.69-3.16)
Sex
Male 57 37 98 63 0.710 1.10 (0.66-1.82) Female 45 35 82 65 1.00
Age, years old
18-40 49 36 88 64 1.00 41-64 44 36 79 64 0.977 0.99 (0.59-2.67)
>64 9 41 13 59 0.816 1.12 (0.43-2.90)

Chapter 3
46
Determinants
Catastrophic total
costs P
cOR (95%CI)
P
aOR (95%CI)
Yes % No %
Educational level Low 41 41 58 59 1.00
Intermediate 58 34 114 66 0.355 0.78 (0.45-1.33)
High 3 27 8 73 0.479 0.60 (0.14-2.51)
Breadwinner
Patient 65 52 59 48 <0.001 3.60 (2.16-6.00) 0.010 2.92 (1.29-6.60) Not patient 37 23 121 77 1.00 1.00
Income-earning job Yes 90 45 111 55 <0.001 4.66 (2.38-9.14) 0.881 1.08 (0.40-2.92) No 12 15 69 85 1.00 1.00
Job loss
Job loss 51 80 13 20 <0.001 14.07 (6.84-28.93)
<0.001 21.17 (8.31-53.90)
No job loss 51 23 167 77 1.00 1.00
Health insurance
No 43 41 63 59 0.390 1.26 (0.74-2.15)
Yes 59 34 117 66 1.00
HIV status Negative 44 48 48 52 1.00
Positive 0 0 6 100 0.953 0.00 (0.00-~)
Not
tested/unknown 58 32 126 68 0.863 0.46 (0.26-0.82)
Previous TB
treatment
Yes 31 53 27 47 0.001 2.93 (1.56-5.48) 0.006 2.86 (1.35-6.05) No 71 32 153 68 1.00 1.00 First contact with
facility
Private facility 46 37 77 63 0.622 1.14 (0.68-1.89)
Public facility 56 35 103 65 1.00
Hospitalization Yes 15 38 24 62 0.685 1.16 (0.56-2.38)
No 87 36 156 64 1.00
Food supplement
Yes 65 34 126 66 0.370 0.78 (0.5-1.3) No 37 41 54 59 1.00
Adverse effect
Yes 53 43 71 57 0.029 1.77 (1.06-2.95) 0.089 1.77 (0.92-3.40) No 49 31 109 69 1.00 1.00
cOR, crude Odds Ratio; aOR, adjusted Odds Ratio
With regard to MDR-TB-affected households, the multivariable analysis showed that
the only determinant of catastrophic total costs in these households was having had an
income-earning job before diagnosis (aOR= 8.7; 95%CI: 1.8-41.7; P=0.007). (Table 7)

Catastrophic costs due to TB
47
Table 7 Determinants of catastrophic total costs in MDR-TB cases
Determinants
Catastrophic total
costs P cOR (95% CI) P aOR (95%CI)
Yes % No %
Household income
Poor 19 83 4 17 0.974 0.98 (0.25-3.88)
Non-poor 34 83 7 17 1.00
Sex
Male 27 87 4 13 0.383 1.82 (0.48-6.95)
Female 26 79 7 21 1.00
Age in years
18-40 28 82 6 18 1.00
>40 25 83 5 17 0.917 1.07 (0.29-3.95)
Educational level Low 9 75 3 25 1.00
Intermediate 35 83 7 17 0.515 1.67 (0.36-7.76)
High 9 90 1 10 0.378 3.00 (0.26-34.58)
Breadwinner
Patient 21 84 4 16 0.840 1.15 (0.30-4.41)
Not patient 32 82 7 18 1.00
Income-earning
job
Yes 44 90 5 10 0.012 5.87 (1.47-23.47) 0.007 8.68 (1.81-41.70)
No 9 60 6 40 1.00 1.00
Job loss
Job loss 34 100 0 0 1.00 No job loss 19 63 11 37 0.998 0.00 (0.00-~)
Health insurance
Yes 46 82 10 18 1.00 No 7 87 1 13 0.709 1.52 (0.17-13.79)
HIV status
HIV negative 28 87 4 13 1.00
HIV not
tested/unknown 25 78 7 22 0.331 0.51 (0.13-2.01)
Previous TB
treatment
Yes 47 84 9 16 0.534 1.75 (0.29-2.01)
No 6 75 2 25 1.00
First contact
facility
Private facility 10 100 0 0 0.266 8.66 (0.19-403.74)
Public facility 43 80 11 20 1.00
Hospitalization
Yes 30 88 4 12 0.235 2.27 (0.58-8.91) 0.090 3.92 (0.81-19.01)
No 23 77 7 23 1.00 1.00
Food supplement
Yes 41 84 8 16 0.741 1.28 (0.29-5.77)
No 12 80 3 20 1.00
Adverse effect

Chapter 3
48
Determinants
Catastrophic total
costs P cOR (95% CI) P aOR (95%CI)
Yes % No %
Yes 38 86 6 14 0.270 0.47 (0.13-1.79)
No 15 75 5 25 1.00
cOR, crude Odds Ratio; aOR, adjusted Odds Ratio
Discussion
Despite the implementation of UHC in Indonesia, the country still has a high incidence
of catastrophic total costs due to TB, particularly among patients who live in poor
households and those who lose their jobs due to TB. In general, the greatest contribution
to total costs was made by travel and food/nutritional supplementation costs. However,
losing both job and income after diagnosis was also a critical point: once patients had
lost their jobs, income loss became the main driver of total costs. These findings
emphasize the importance not only of providing travel and nutritional supports but also
social protection for those who lose income due to TB.
Unlike CHE, the catastrophic total costs approach which incorporates direct medical
costs, direct non-medical costs, and overall indirect costs highlights the impact of
income loss. It also provides a clearer description of the severity of the financial impact
than the CHE approach does. This is indicated by the consistently higher mean gap in
the TB and MDR-TB groups.
The determinants of catastrophic total costs shown in this study highlight both the
magnitude of the problem of income loss and the need to address it properly. As well
as aggravating barriers to TB treatment adherence, thereby potentially worsening TB
outcomes, income loss increases the risk of catastrophic costs and even greater
impoverishment. If a TB patient is the family breadwinner, the incidence of catastrophic
total costs is doubled.
In MDR-TB patients, coming from a poor household was not a determinant of
catastrophic total costs. We had assumed that most MDR-TB cases would come from
poor households, but this proportion was in fact very low. Overall, the incidence of
catastrophic total costs was also very high: irrespective of their income level, over half
of MDR-TB-affected households experienced such costs.
Catastrophic costs due to TB
49
As our findings provide insights that contrast with the perspective of CHE, they provide
a new basis for estimating costs, and may thus have policy implications. As well as
supporting the WHO’s recommendation that the catastrophic total costs approach
should be used, the main implication of our study is a strong recommendation to
government that it should introduce a cost-mitigation policy and additional social
protection beyond free medical services.5,22 Forms of financial protection other than
food/nutritional supplementation and travel vouchers may be required. Cash transfers
could be made conditional on behavioral requirements such as continuing treatment.
Microfinance programs are also a potential form of financial support,33,34 but this
strategy requires complex and expensive inputs. The government should target
beneficiaries carefully, ensure the delivery to patients, provide incentives that induce
patients to adhere to treatment, and should therefore consider reserving a budget that is
large enough. As well as emphasizing financial incentives, it is imperative to tackle any
stigma and discrimination in workplaces that can lead to income loss. The government
should also strengthen the policy by supporting job protection or paid sick leave for
formally employed TB patients.
The high incidence of catastrophic total costs among poor patients requires inputs
within the UHC framework. The government should incorporate strategies for widening
population coverage, for improving the availability, accessibility, and quality of public
health facilities; and also for involving as many private health facilities as possible in
the BPJS network. To conform with the ISTC, they should also ensure proper training.
This study has several limitations. First, in line with the WHO protocol, we collected
data from TB patients who visited PHCs and excluded those who were treated in
facilities that were not linked to the NTP. Neither did we include TB nor suspected TB
patients who were unable to afford TB-related services or who dropped out of the
diagnostic procedure or out of treatment. This may have led to an underestimation of
the incidence of catastrophic total costs. Second, MDR-TB patients were only recruited
in a pulmonary hospital in an urban area with a low proportion of poor households. We
did not describe a situation in which patients were removed from the hospital to PHCs
for taking MDR-TB drugs after sputum conversion, and dropped out from treatment.
Third, although we interviewed patients with a structured questionnaire to help recall
their spending, our findings may have been affected by recall biases. Finally, while our
study results apply to the western part of Indonesia such as Java, Bali, and Sumatra,
which constitute 80% of the Indonesian population,35 some parts of Indonesia may have
Chapter 3
50
different characteristics that require careful generalization, especially the islands and
more remote areas.
Conclusions
Both TB and MDR-TB patients are in danger of falling into even deeper poverty. Travel
costs, food/nutritional supplementation costs, and income loss all contribute to the
incidence of catastrophic total costs. This risk is higher in patients from poor
households, especially when they are breadwinners who lose their jobs. These findings
suggest that measures beyond free medical services are required to mitigate the financial
burden of households affected by TB, particularly for patients living in at-risk groups.
Ethics approval and consent to participate
We confirmed that all respondents received written and oral explanations of the study, and signed an
informed consent form before the interview. Ethical clearance for this study was provided by the Ethical
Committee at the Faculty of Medicine of Universitas Indonesia–Cipto Mangunkusumo Hospital, Jakarta Indonesia (No. 416/UN2.F1/ETIK/VI/2016); and the Ethical Committee at Persahabatan Hospital,
Jakarta, Indonesia (No. DL.01.03/II.3/3817/2016).
Funding
This study was funded by Indonesian Endowment Fund for Education (Lembaga Pengelola Dana
Pendidikan, LPDP), Indonesia.
Acknowledgements
We thank all study participants for their time and valuable information, and all interviewers, who also
organized, collected and entered data. We are particularly grateful to Jahja Umar, Diah Handayani, Erlina Burhan, and Budiyarti Setiyaningsih for their valuable inputs at our expert committee review.
We acknowledge Edine Tiemersma, Firdaus Hafidz, and Bintari Dwi Hardiani for their support and for
allowing the further evaluation of their questionnaire in Bahasa Indonesia. Special thanks to Suzanne Polinder for inputs on the economic perspective and David Alexander for language editing. We also
thank the Head of the Sub-Directorate for Tuberculosis at the Ministry of Health, The Republic of
Indonesia, and his staff; those in charge of the TB programs at the Jakarta provincial health office and district health offices, at the Depok district health office, at the Tasikmalaya district health office; and
all those in charge of the TB program at the PHCs included in this study.
Catastrophic costs due to TB
51
References 1. World Health Organization. Global tuberculosis report 2016. 21st Ed. Geneva: World Health
Organization; 2016.
2. World Health Organization. The End TB Strategy. Global Strategy and Targets for Tuberculosis
Prevention, Care and Control after 2015. World Health Organization; 2015.
3. Lönnroth K, Raviglione M. The WHO’s new End TB Strategy in the post-2015 era of the Sustainable
Development Goals. Trans. R. Soc. Trop. Med. Hyg. 2016;110:148–50.
4. Ortblad KF, Salomon JA, Bärnighausen T, Atun R. Stopping tuberculosis: a biosocial model for
sustainable development. The Lancet. 2015;386:2354–62.
5. van den Hof S, Collins D, Hafidz F, Beyene D, Tursynbayeva A, Tiemersma E. The socioeconomic
impact of multidrug resistant tuberculosis on patients: results from Ethiopia, Indonesia and Kazakhstan.
BMC Infect. Dis. 2016;16:470.
6. Tanimura T, Jaramillo E, Weil D, Raviglione M, Lönnroth K. Financial burden for tuberculosis patients
in low- and middle-income countries: a systematic review. Eur. Respir. J. 2014;43:1763–75.
7. Ukwaja KN, Alobu I, Abimbola S, Hopewell PC. Household catastrophic payments for tuberculosis
care in Nigeria: incidence, determinants, and policy implications for universal health coverage. Infect.
Dis. Poverty. 2013;2:21.
8. Lönnroth K, Aung T, Maung W, Kluge H, Uplekar M. Social franchising of TB care through private
GPs in Myanmar: an assessment of treatment results, access, equity and financial protection. Health
Policy Plan. 2007;22:156–66.
9. Lönnroth K, Glaziou P, Weil D, Floyd K, Uplekar M, Raviglione M. Beyond UHC: monitoring health
and social protection coverage in the context of tuberculosis care and prevention. PLoS Med.
2014;11:e1001693.
10. Ukwaja KN, Alobu I, Hopewell PC, others. The high cost of free tuberculosis services: patient and
household costs associated with tuberculosis care in ebonyi state, Nigeria. PLoS One. 2013;8:e73134.
11. Zhou C, Long Q, Chen J, Xiang L, Li Q, Tang S, et al. Factors that determine catastrophic expenditure
for tuberculosis care: a patient survey in China. Infect. Dis. Poverty. 2016;5:6.
12. United Nation. Agenda Item 123: Global health and foreign policy in the UN. Geneva: United Nation;
2009.
13. Guinto RL, Curran UZ, Suphanchaimat R, Pocock NS. Universal health coverage in “One ASEAN”:
are migrants included? Glob. Health Action. 2015;8:1–16.
14. Mahendradhata Y, Probandari A, Ahmad RA, Utarini A, Trisnantoro L, Lindholm L, et al. The
Incremental Cost-Effectiveness of Engaging Private Practitioners to Refer Tuberculosis Suspects to
DOTS Services in Jogjakarta, Indonesia. Am. J. Trop. Med. Hyg. 2010;82:1131–9.
15. Ukwaja KN, Modebe O, Igwenyi C, Alobu I. The economic burden of tuberculosis care for patients
and households in Africa: a systematic review. Int. J. Tuberc. Lung Dis. 2012;16:733–739.
16. Storla DG, Yimer S, Bjune GA. A systematic review of delay in the diagnosis and treatment of
tuberculosis. BMC Public Health. 2008;8:15.
17. Mauch V, Bonsu F, Gyapong M, Awini E, Suarez P, Marcelino B, et al. Free tuberculosis diagnosis
and treatment are not enough: patient cost evidence from three continents. Int. J. Tuberc. Lung Dis.
2013;17:381–387.
18. World Health Organization. Protocol for survey to determine direct and indirect costs due to TB and to
estimate proportion of TB-affected households experiencing catastrophic total costs due to TB. Geneva:
World Health Organization; 2015.
19. Xu K, Evans DB, Kawabata K, Zeramdini R, Klavus J, Murray CJ. Household catastrophic health
expenditure: a multicountry analysis. The Lancet. 2003;362:111–7.
20. Tuberculosis Control Assistance Programme. The tool to estimate patients’ costs. The Hague, the
Netherlands: KNCV Tuberculosis Foundation; 2009.
21. Mauch V, Woods N, Kirubi B, Kipruto H, Sitienei J, Klinkenberg E. Assessing access barriers to
tuberculosis care with the Tool to Estimate Patients’ Costs: pilot results from two districts in Kenya.
BMC Public Health. 2011;11:43.
22. Mauch V, Bonsu F, Gyapong M, Awini E, Suarez P, Marcelino B, et al. Free tuberculosis diagnosis
and treatment are not enough: patient cost evidence from three continents. Int. J. Tuberc. Lung Dis.
2013;17:381–7.
23. World Health Organization. Guidelines for treatment of tuberculosis. 4th Ed. Geneva: World Health
Organization; 2010.

Chapter 3
52
24. World Health Organization. Guidelines for the programmatic management of drug-resistant
tuberculosis. Geneva: World Health Organization; 2011.
25. Chen S, Narayan A, Sangraula P, Dabalen AL, Serajuddin U, Yoshida N, et al. A global count of the
extreme poor in 2012 : data issues, methodology and initial results. The World Bank; 2015 Oct p. 1–
66. Report No.: WPS7432.
26. Drago R, Black D, Wooden M. Female breadwinner families Their existence, persistence and sources.
J. Sociol. 2005;41:343–362.
27. Wooden M, Hahn M. 8. Female breadwinner families. Fam. Incomes Jobs Vol. 9. 2014;57.
28. World Bank. Exchange rate (2016). http://databank.worldbank.org/data/reports.aspx?source
=2&series=PA.NUS.FCRF&country=#. Accessed 15 October 2016.
29. Wingfield T, Tovar MA, Huff D, Boccia D, Montoya R, Ramos E, et al. The economic effects of
supporting tuberculosis-affected households in Peru. Eur. Respir. J. 2016;48:1396–410.
30. Laokri S, Dramaix-Wilmet M, Kassa F, Anagonou S, Dujardin B. Assessing the economic burden of
illness for tuberculosis patients in Benin: determinants and consequences of catastrophic health
expenditures and inequities. Trop. Med. Int. Health TM IH. 2014;19:1249–58.
31. Onwujekwe O, Onoka C, Uzochukwu B, Hanson K. Constraints to universal coverage: inequities in
health service use and expenditures for different health conditions and providers. Int. J. Equity Health.
2011;10:50.
32. Ukwaja KN, Alobu I, Nweke CO, Onyenwe EC. Healthcare-seeking behavior, treatment delays and its
determinants among pulmonary tuberculosis patients in rural Nigeria: a cross-sectional study. BMC
Health Serv. Res. 2013;13:25.
33. Wei X, Zou G, Yin J, Walley J, Yang H, Kliner M, et al. Providing financial incentives to rural-to-
urban tuberculosis migrants in Shanghai: an intervention study. Infect. Dis. Poverty. 2012;1:9.
34. Boccia D, Hargreaves J, Lönnroth K, Jaramillo E, Weiss J, Uplekar M, et al. Cash transfer and
microfinance interventions for tuberculosis control: review of the impact evidence and policy
implications. Int. J. Tuberc. Lung Dis. Off. J. Int. Union Tuberc. Lung Dis. 2011;15:S37.
35. Badan Pusat Statistik. Distribusi persentase penduduk menurut provinsi, 2000-2015. Badan Pus. Stat.
https://www.bps.go.id/linkTableDinamis/view/id/843. Accessed 1 March 2017.

53
Chapter 4
Cost of seeking care for tuberculosis since
the implementation of universal health
coverage in Indonesia
Ahmad Fuady1,2* Tanja A.J. Houweling,1 Muchtaruddin Mansyur,2 Erlina Burhan,3 Jan Hendrik
Richardus1
1Department of Public Health, Erasmus MC, University Medical Center
Rotterdam, Rotterdam, The Netherlands; 2Department of Community
Medicine, Faculty of Medicine, Universitas Indonesia, Jakarta, Indonesia;
3Department of Respiratory and Pulmonology, Persahabatan Hospital –
Faculty of Medicine, Universitas Indonesia, Jakarta, Indonesia.
In Review
Chapter 4
54
Abstract
Background:
Although tuberculosis (TB) patients often incur high costs to access TB-related
services, it was unclear beforehand whether the implementation of universal health
coverage (UHC) in Indonesia in 2014 would reduce direct costs and change the pattern
of care-seeking behaviour. After its introduction, we therefore assessed TB patients’
care-seeking behaviour and the costs they incurred for diagnosis, and the determinants
of both.
Methods:
To assess their care-seeking behaviour, we interviewed adult TB patients in three areas
of Indonesia – one urban, one suburban and one rural – in July-September 2016. All
had been treated for at least one month. After establishing which direct and indirect
costs they had incurred during the pre-diagnostic phase, we calculated the total costs
(US Dollars). To identify the determinants of these costs, we applied a general linear
mixed model to adjust for our cluster-sampling design.
Results:
Ninety-three patients of the 282 included in our analysis (33%) first sought care at a
private clinic. The preference for such clinics was higher among those living in the rural
district (aOR 1.88, 95% CI 0.85-4.15, P=0.119) and among those with a low educational
level (aOR 1.69, 95% CI 0.92-3.10, P=0.090). Visiting a private clinic as the first
contact also led to more visits (β 0.90, 95% CI 0.57-1.24, P<0.001) and higher costs
than first visiting a Primary Health Centre, both in terms of direct costs (β=16.87,
95%CI 10.54-23.20, P<0.001) and total costs (β=18.41, 95%CI 10.35-26.47, P<0.001).
Conclusion:
Despite UHC, high costs of TB seeking care remain, with direct medical costs
contributing most to the total costs. First seeking care from private providers tends to
lead to more pre-diagnostic visits and higher costs. To reduce diagnostic delays and
minimize patients’ costs, it is essential to strengthen the public-private mix and reduce
the fragmented system between the national health insurance scheme and the National
TB Programme.
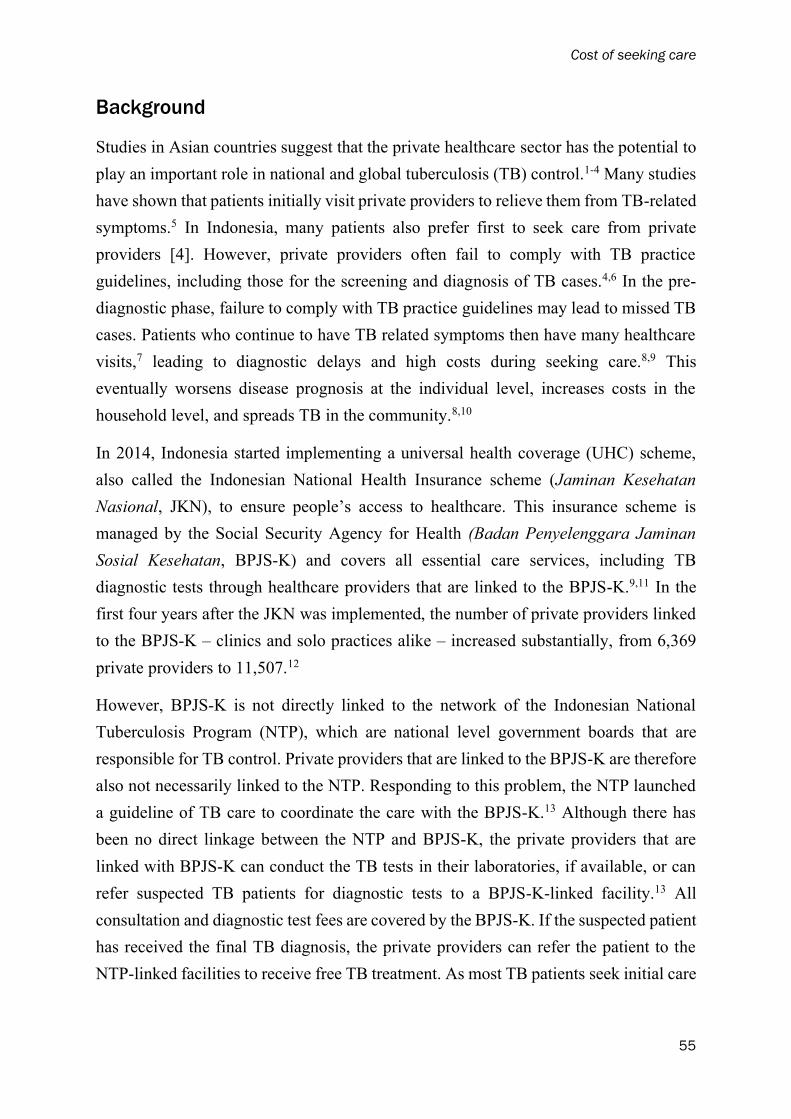
Cost of seeking care
55
Background
Studies in Asian countries suggest that the private healthcare sector has the potential to
play an important role in national and global tuberculosis (TB) control.1-4 Many studies
have shown that patients initially visit private providers to relieve them from TB-related
symptoms.5 In Indonesia, many patients also prefer first to seek care from private
providers [4]. However, private providers often fail to comply with TB practice
guidelines, including those for the screening and diagnosis of TB cases.4,6 In the pre-
diagnostic phase, failure to comply with TB practice guidelines may lead to missed TB
cases. Patients who continue to have TB related symptoms then have many healthcare
visits,7 leading to diagnostic delays and high costs during seeking care.8,9 This
eventually worsens disease prognosis at the individual level, increases costs in the
household level, and spreads TB in the community.8,10
In 2014, Indonesia started implementing a universal health coverage (UHC) scheme,
also called the Indonesian National Health Insurance scheme (Jaminan Kesehatan
Nasional, JKN), to ensure people’s access to healthcare. This insurance scheme is
managed by the Social Security Agency for Health (Badan Penyelenggara Jaminan
Sosial Kesehatan, BPJS-K) and covers all essential care services, including TB
diagnostic tests through healthcare providers that are linked to the BPJS-K.9,11 In the
first four years after the JKN was implemented, the number of private providers linked
to the BPJS-K – clinics and solo practices alike – increased substantially, from 6,369
private providers to 11,507.12
However, BPJS-K is not directly linked to the network of the Indonesian National
Tuberculosis Program (NTP), which are national level government boards that are
responsible for TB control. Private providers that are linked to the BPJS-K are therefore
also not necessarily linked to the NTP. Responding to this problem, the NTP launched
a guideline of TB care to coordinate the care with the BPJS-K.13 Although there has
been no direct linkage between the NTP and BPJS-K, the private providers that are
linked with BPJS-K can conduct the TB tests in their laboratories, if available, or can
refer suspected TB patients for diagnostic tests to a BPJS-K-linked facility.13 All
consultation and diagnostic test fees are covered by the BPJS-K. If the suspected patient
has received the final TB diagnosis, the private providers can refer the patient to the
NTP-linked facilities to receive free TB treatment. As most TB patients seek initial care
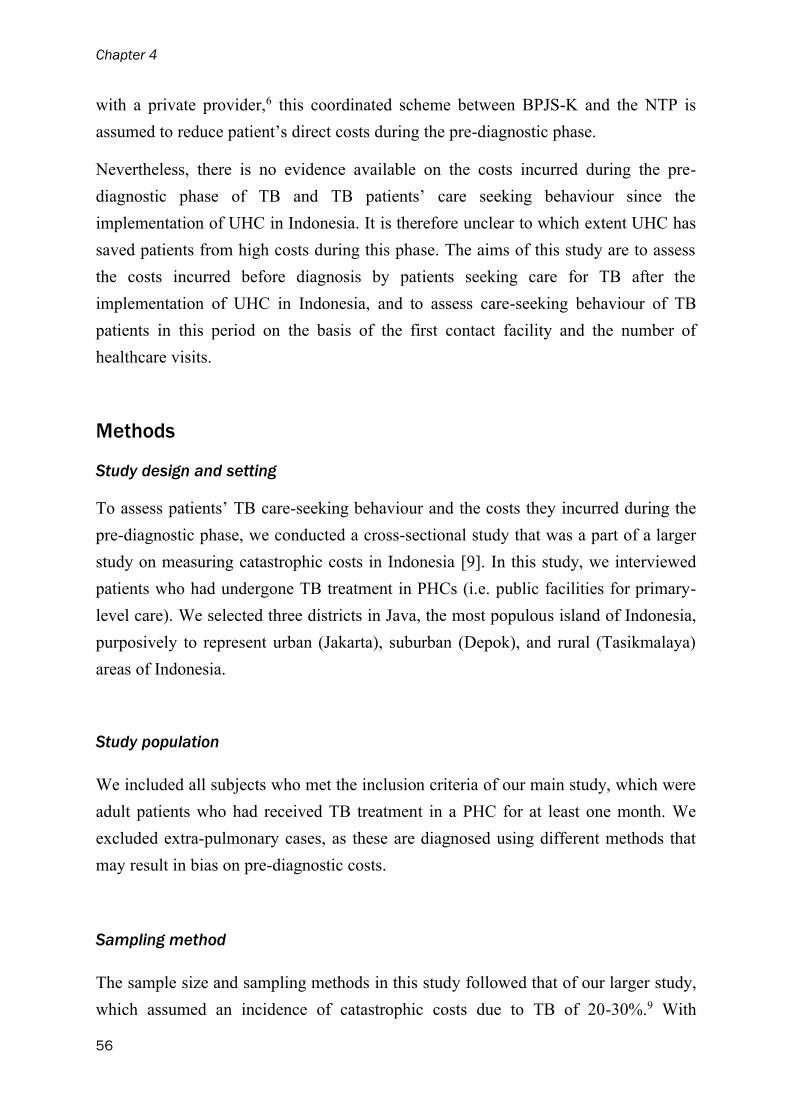
Chapter 4
56
with a private provider,6 this coordinated scheme between BPJS-K and the NTP is
assumed to reduce patient’s direct costs during the pre-diagnostic phase.
Nevertheless, there is no evidence available on the costs incurred during the pre-
diagnostic phase of TB and TB patients’ care seeking behaviour since the
implementation of UHC in Indonesia. It is therefore unclear to which extent UHC has
saved patients from high costs during this phase. The aims of this study are to assess
the costs incurred before diagnosis by patients seeking care for TB after the
implementation of UHC in Indonesia, and to assess care-seeking behaviour of TB
patients in this period on the basis of the first contact facility and the number of
healthcare visits.
Methods
Study design and setting
To assess patients’ TB care-seeking behaviour and the costs they incurred during the
pre-diagnostic phase, we conducted a cross-sectional study that was a part of a larger
study on measuring catastrophic costs in Indonesia [9]. In this study, we interviewed
patients who had undergone TB treatment in PHCs (i.e. public facilities for primary-
level care). We selected three districts in Java, the most populous island of Indonesia,
purposively to represent urban (Jakarta), suburban (Depok), and rural (Tasikmalaya)
areas of Indonesia.
Study population
We included all subjects who met the inclusion criteria of our main study, which were
adult patients who had received TB treatment in a PHC for at least one month. We
excluded extra-pulmonary cases, as these are diagnosed using different methods that
may result in bias on pre-diagnostic costs.
Sampling method
The sample size and sampling methods in this study followed that of our larger study,
which assumed an incidence of catastrophic costs due to TB of 20-30%.9 With

Cost of seeking care
57
assumptions of a power of 0.80, an error of 0.05, and a ratio of TB patients of 1:1:1 in
each district, we required 90 patients per district. In each district, we included all the
PHCs that were linked to the Indonesian NTP in our sampling framework, and then
randomly selected five PHCs per district. We chose only PHCs since most of TB
patients were treated in PHCs. In each PHC, we selected consecutive adult TB patients
until we reached at least 90 patients per district. If the sample size was not reached, we
randomly selected additional PHCs until we obtained at least 90 patients per district. In
total, 19 PHCs were included in our study.
Data collection
All patients were interviewed by four medical students and six public health graduates
we had recruited and trained for the purpose. As a part of our main study on measuring
catastrophic costs, the interview was conducted during the TB treatment phase – 48%
of patient in their intensive phase and 52% of patients in their continuous phase.9 To
interview the patients and/or the drug observer who accompanied each patient as a direct
observation of treatment (DOT) supporter, these interviewers used the adapted and
validated Bahasa Indonesia version of the Tool to Estimate Patient Costs.14
Retrospectively, each respondent listed each healthcare facility he or she had visited
between developing TB-related symptoms (e.g., chronic cough, bloody cough, weight
loss, or night sweating) and the establishment of their TB diagnosis.14 We also
calculated the number of healthcare visits and costs incurred during the pre-diagnostic
phase, and then assessed the determinants of the number of visits and costs.
Care seeking behaviour
First, to assess patients’ care-seeking behaviour, we established the nature of their first
contact facility, i.e., a primary health centre (PHC); a private clinic (whether a solo
practice or part of a multiple practice); a public hospital; a private hospital; or ‘other’,
such as a pharmacy, a practitioner of alternative medicine, or a mantri (i.e., a registered
nurse practicing as an unauthorized physician). We then assessed whether the first
contact facility was associated with the district (urban/suburban/rural), household
income level (poor/non-poor household), educational level (low/middle-high), health
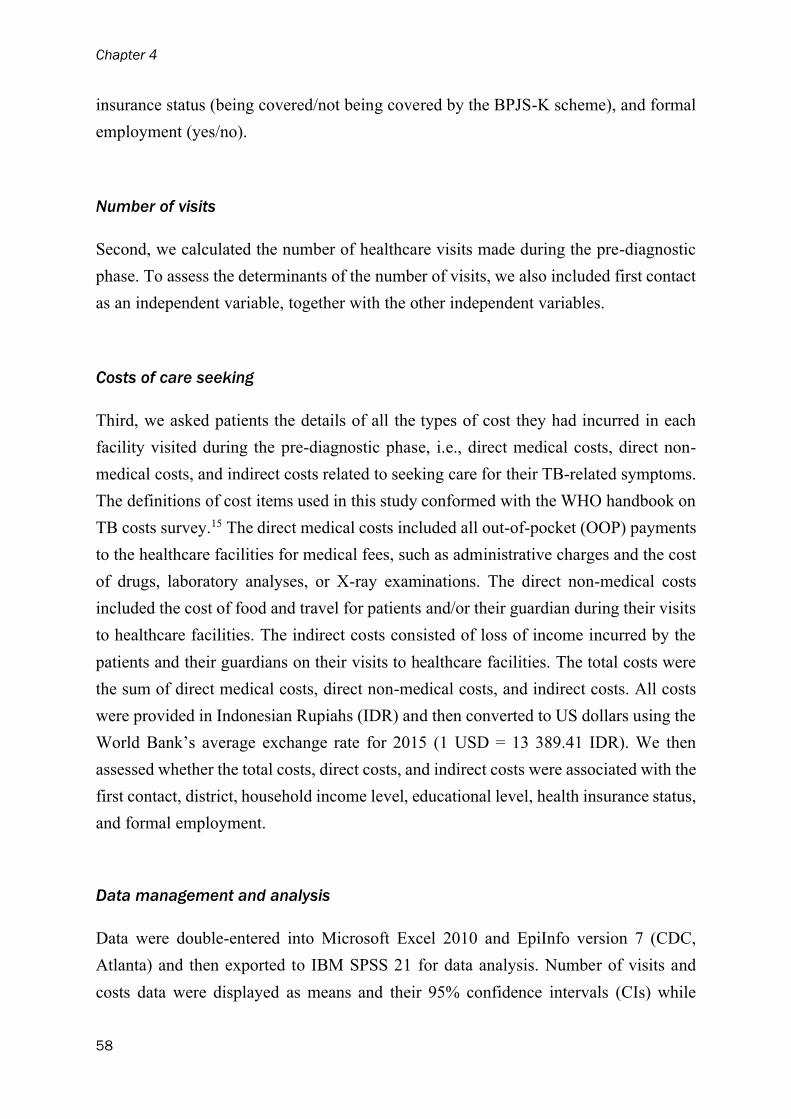
Chapter 4
58
insurance status (being covered/not being covered by the BPJS-K scheme), and formal
employment (yes/no).
Number of visits
Second, we calculated the number of healthcare visits made during the pre-diagnostic
phase. To assess the determinants of the number of visits, we also included first contact
as an independent variable, together with the other independent variables.
Costs of care seeking
Third, we asked patients the details of all the types of cost they had incurred in each
facility visited during the pre-diagnostic phase, i.e., direct medical costs, direct non-
medical costs, and indirect costs related to seeking care for their TB-related symptoms.
The definitions of cost items used in this study conformed with the WHO handbook on
TB costs survey.15 The direct medical costs included all out-of-pocket (OOP) payments
to the healthcare facilities for medical fees, such as administrative charges and the cost
of drugs, laboratory analyses, or X-ray examinations. The direct non-medical costs
included the cost of food and travel for patients and/or their guardian during their visits
to healthcare facilities. The indirect costs consisted of loss of income incurred by the
patients and their guardians on their visits to healthcare facilities. The total costs were
the sum of direct medical costs, direct non-medical costs, and indirect costs. All costs
were provided in Indonesian Rupiahs (IDR) and then converted to US dollars using the
World Bank’s average exchange rate for 2015 (1 USD = 13 389.41 IDR). We then
assessed whether the total costs, direct costs, and indirect costs were associated with the
first contact, district, household income level, educational level, health insurance status,
and formal employment.
Data management and analysis
Data were double-entered into Microsoft Excel 2010 and EpiInfo version 7 (CDC,
Atlanta) and then exported to IBM SPSS 21 for data analysis. Number of visits and
costs data were displayed as means and their 95% confidence intervals (CIs) while

Cost of seeking care
59
categorical variables as numbers and proportions (%). To examine the determinants of
the patients’ first contact facility, the number of visits, and their costs during the pre-
diagnostic phase, we applied the generalized linear mixed models (GLMMs) with
random effects to adjust for our cluster sampling design (19 PHCs), since we selected
the PHCs randomly. We assessed the goodness of fit for models by examining the
Akaike corrected and the Bayesian information criterion provided by SPSS. To analyse
the determinants of the first health-service contact, we estimated crude odds ratios
(cORs), adjusted odds ratios (aORs), and their 95% CIs with a target distribution of
multinomial regression. To analyse the determinants of number of visits and costs
incurred by patients and their family, we established crude and adjusted GLMM
regression coefficients (β) and their 95% CIs with a target distribution of linear
regression.
Ethical issues
Before the interview, we provided all respondents with a written and oral explanation
of the study. Only those who had signed an informed consent form were interviewed.
Before the study, we received ethical clearance from the Ethical Committee at the
Faculty of Medicine of Universitas Indonesia–Cipto Mangunkusumo Hospital, Jakarta,
Indonesia (No. 416/UN2.F1/ETIK/VI/2016).
Table 1 First point of care and place of TB diagnosis of a sample of 282 TB patients.
Healthcare service
First point
of care
Place of
diagnosis
n % N %
Primary health centre 127 45 164 58
Private clinic 93 33 43 15
Public hospital 32 11 50 18
Private hospital 20 7 25 9
Other health provider* 10 4 0 0
*Pharmacy, practitioner of alternative medicine, mantri, or other health provider.
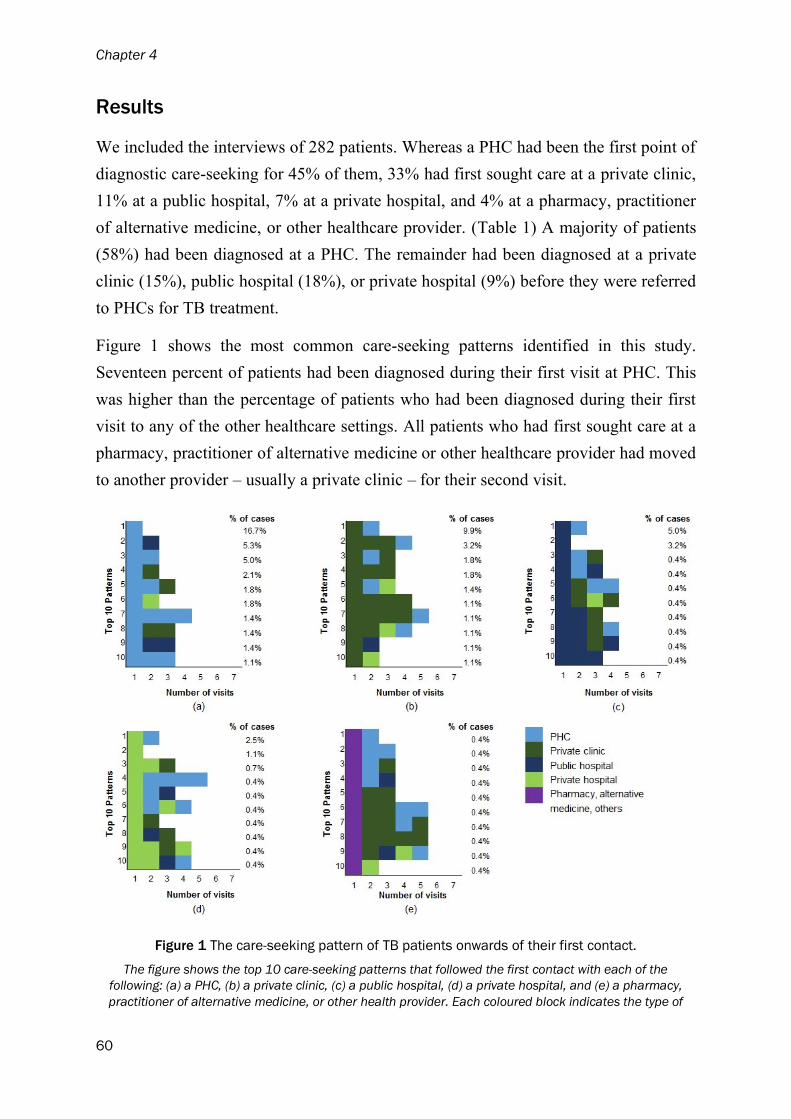
Chapter 4
60
Results
We included the interviews of 282 patients. Whereas a PHC had been the first point of
diagnostic care-seeking for 45% of them, 33% had first sought care at a private clinic,
11% at a public hospital, 7% at a private hospital, and 4% at a pharmacy, practitioner
of alternative medicine, or other healthcare provider. (Table 1) A majority of patients
(58%) had been diagnosed at a PHC. The remainder had been diagnosed at a private
clinic (15%), public hospital (18%), or private hospital (9%) before they were referred
to PHCs for TB treatment.
Figure 1 shows the most common care-seeking patterns identified in this study.
Seventeen percent of patients had been diagnosed during their first visit at PHC. This
was higher than the percentage of patients who had been diagnosed during their first
visit to any of the other healthcare settings. All patients who had first sought care at a
pharmacy, practitioner of alternative medicine or other healthcare provider had moved
to another provider – usually a private clinic – for their second visit.
Figure 1 The care-seeking pattern of TB patients onwards of their first contact.
The figure shows the top 10 care-seeking patterns that followed the first contact with each of the
following: (a) a PHC, (b) a private clinic, (c) a public hospital, (d) a private hospital, and (e) a pharmacy,
practitioner of alternative medicine, or other health provider. Each coloured block indicates the type of
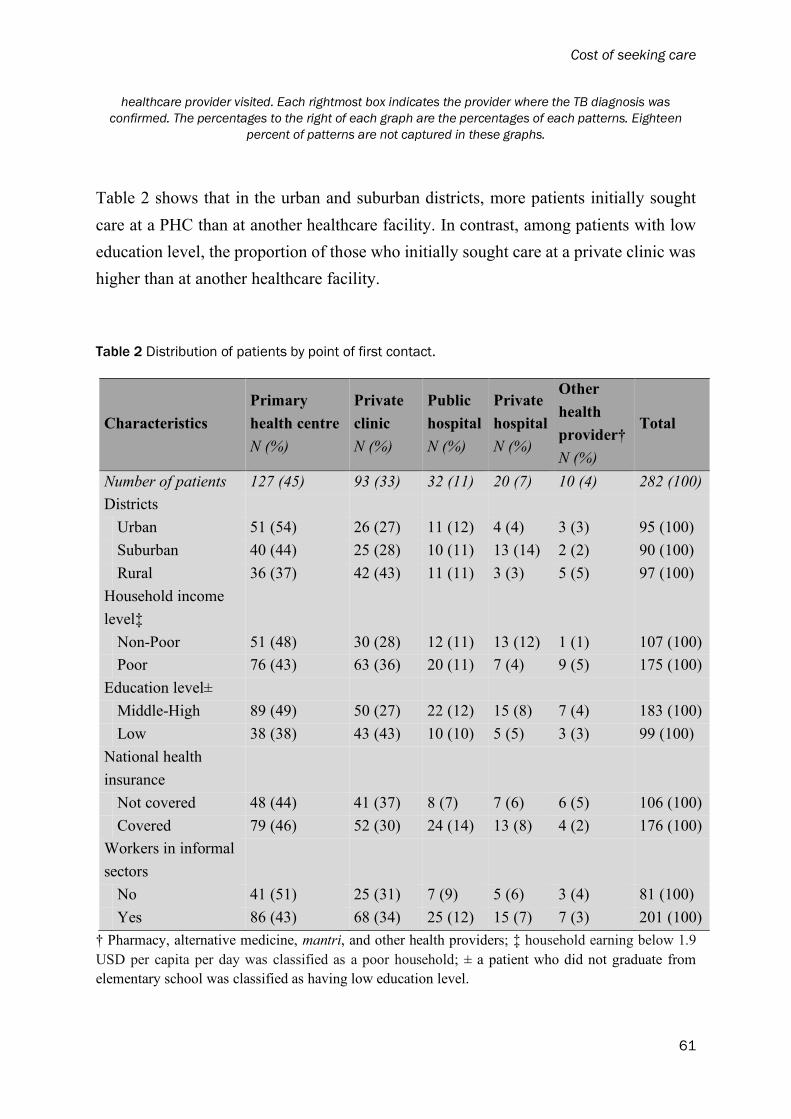
Cost of seeking care
61
healthcare provider visited. Each rightmost box indicates the provider where the TB diagnosis was
confirmed. The percentages to the right of each graph are the percentages of each patterns. Eighteen
percent of patterns are not captured in these graphs.
Table 2 shows that in the urban and suburban districts, more patients initially sought
care at a PHC than at another healthcare facility. In contrast, among patients with low
education level, the proportion of those who initially sought care at a private clinic was
higher than at another healthcare facility.
Table 2 Distribution of patients by point of first contact.
Characteristics
Primary
health centre
N (%)
Private
clinic
N (%)
Public
hospital
N (%)
Private
hospital
N (%)
Other
health
provider†
N (%)
Total
Number of patients 127 (45) 93 (33) 32 (11) 20 (7) 10 (4) 282 (100)
Districts
Urban 51 (54) 26 (27) 11 (12) 4 (4) 3 (3) 95 (100)
Suburban 40 (44) 25 (28) 10 (11) 13 (14) 2 (2) 90 (100)
Rural 36 (37) 42 (43) 11 (11) 3 (3) 5 (5) 97 (100)
Household income
level‡
Non-Poor 51 (48) 30 (28) 12 (11) 13 (12) 1 (1) 107 (100)
Poor 76 (43) 63 (36) 20 (11) 7 (4) 9 (5) 175 (100)
Education level±
Middle-High 89 (49) 50 (27) 22 (12) 15 (8) 7 (4) 183 (100)
Low 38 (38) 43 (43) 10 (10) 5 (5) 3 (3) 99 (100)
National health
insurance
Not covered 48 (44) 41 (37) 8 (7) 7 (6) 6 (5) 106 (100)
Covered 79 (46) 52 (30) 24 (14) 13 (8) 4 (2) 176 (100)
Workers in informal
sectors
No 41 (51) 25 (31) 7 (9) 5 (6) 3 (4) 81 (100)
Yes 86 (43) 68 (34) 25 (12) 15 (7) 7 (3) 201 (100)
† Pharmacy, alternative medicine, mantri, and other health providers; ‡ household earning below 1.9
USD per capita per day was classified as a poor household; ± a patient who did not graduate from
elementary school was classified as having low education level.

Chapter 4
62
Table 3 shows that more patients in the rural district preferred to seek care first at a
private clinic (cOR 2.27, 95% CI 1.14-4.53, P=0.020). Seeking inital care at a private
provider rather than a PHC was also greater among patients with a low educational level
than among those with a middle to high educational level (cOR 1.93, 95% CI 1.09-3.41,
P=0.024). Despite the borderline statistical significance of the result, multivariable
analysis showed that the odds of seeking care at a private clinic rather than at a PHC
was higher in the rural district (aOR 1.87, 95% CI 0.85-4.15, P=0.119) and in patients
with low education level (aOR 1.69, 95% CI 0.51-1.65, P=0.090). There were no
statistically significant differences regarding first contact preferences for the following:
between patients with insurance and without insurance; between patients living in a
poor household and a non-poor household; and between patients with and without
formal work.
Table 3 Determinants of the first point of health-service contact (private clinic or primary health
centre).
Characteristics
Private
clinic
N (%)
PHCa
N (%) P cOR (95% CI) P aOR (95% CI)
Districts
Urbana 26 (27) 51 (54) 1 1 Suburban 25 (28) 40 (44) 0.557 1.24 (0.60-2.55) 0.462 1.32 (0.63-2.76) Rural 42 (43) 36 (37) 0.020 2.27 (1.14-4.53) 0.119 1.88 (0.85-4.15)
Household income
level‡
Poor 63 (36) 76 (43) 0.355 1.32 (0.74-2.35) 0.824 1.07 (0.57-2.01) Non-Poora 30 (28) 51 (48) 1 1
Education level±
Low 43 (43) 38 (38) 0.024 1.93 (1.09-3.41) 0.090 1.69 (0.92-3.10) Middle to higha 50 (27) 89 (49) 1 1
National health
insurance
Covered 52 (30) 79 (46) 0.468 0.81 (0.46-1.43) 0.768 0.92 (0.51-1.65) Not covereda 41 (37) 48 (44) 1 1
Workers in
informal sectors
Yes 68 (34) 86 (43) 0.364 1.32 (0.72-2.41) 0.284 1.40 (1.76-2.58)
Noa 25 (31) 41 (51) 1 1 aReference category; ‡ household earning below 1.9 USD per capita per day was classified as a poor
household; ± a patient who did not graduate from elementary school was classified as having low
education level.
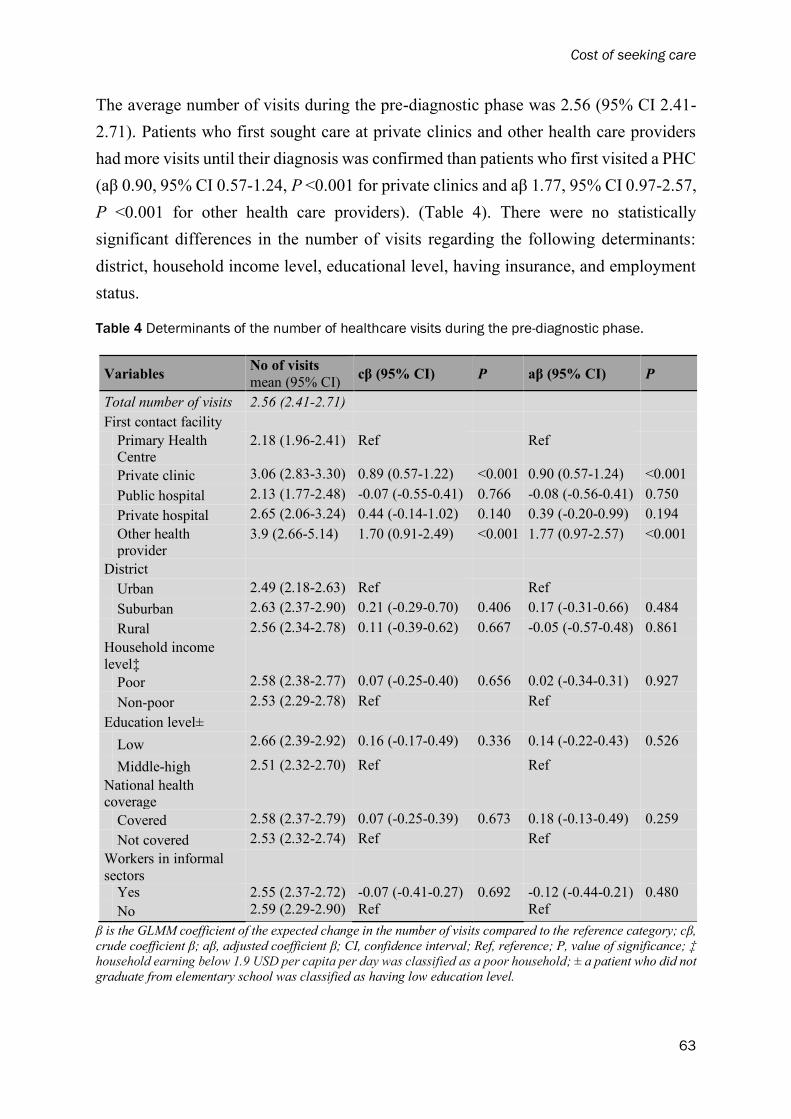
Cost of seeking care
63
The average number of visits during the pre-diagnostic phase was 2.56 (95% CI 2.41-
2.71). Patients who first sought care at private clinics and other health care providers
had more visits until their diagnosis was confirmed than patients who first visited a PHC
(aβ 0.90, 95% CI 0.57-1.24, P <0.001 for private clinics and aβ 1.77, 95% CI 0.97-2.57,
P <0.001 for other health care providers). (Table 4). There were no statistically
significant differences in the number of visits regarding the following determinants:
district, household income level, educational level, having insurance, and employment
status.
Table 4 Determinants of the number of healthcare visits during the pre-diagnostic phase.
Variables No of visits
mean (95% CI) cβ (95% CI) P aβ (95% CI) P
Total number of visits 2.56 (2.41-2.71) First contact facility
Primary Health
Centre 2.18 (1.96-2.41) Ref
Ref
Private clinic 3.06 (2.83-3.30) 0.89 (0.57-1.22) <0.001 0.90 (0.57-1.24) <0.001 Public hospital 2.13 (1.77-2.48) -0.07 (-0.55-0.41) 0.766 -0.08 (-0.56-0.41) 0.750 Private hospital 2.65 (2.06-3.24) 0.44 (-0.14-1.02) 0.140 0.39 (-0.20-0.99) 0.194
Other health provider
3.9 (2.66-5.14) 1.70 (0.91-2.49) <0.001 1.77 (0.97-2.57) <0.001
District
Urban 2.49 (2.18-2.63) Ref
Ref
Suburban 2.63 (2.37-2.90) 0.21 (-0.29-0.70) 0.406 0.17 (-0.31-0.66) 0.484 Rural 2.56 (2.34-2.78) 0.11 (-0.39-0.62) 0.667 -0.05 (-0.57-0.48) 0.861
Household income
level‡
Poor 2.58 (2.38-2.77) 0.07 (-0.25-0.40) 0.656 0.02 (-0.34-0.31) 0.927 Non-poor 2.53 (2.29-2.78) Ref
Ref
Education level±
Low 2.66 (2.39-2.92) 0.16 (-0.17-0.49) 0.336 0.14 (-0.22-0.43) 0.526
Middle-high 2.51 (2.32-2.70) Ref
Ref
National health coverage
Covered 2.58 (2.37-2.79) 0.07 (-0.25-0.39) 0.673 0.18 (-0.13-0.49) 0.259 Not covered 2.53 (2.32-2.74) Ref
Ref
Workers in informal
sectors
Yes 2.55 (2.37-2.72) -0.07 (-0.41-0.27) 0.692 -0.12 (-0.44-0.21) 0.480
No 2.59 (2.29-2.90) Ref
Ref
β is the GLMM coefficient of the expected change in the number of visits compared to the reference category; cβ,
crude coefficient β; aβ, adjusted coefficient β; CI, confidence interval; Ref, reference; P, value of significance; ‡
household earning below 1.9 USD per capita per day was classified as a poor household; ± a patient who did not
graduate from elementary school was classified as having low education level.

Chapter 4
64
The average total cost incurred during the pre-diagnostic phase was USD 22 (95% CI
18-26). It consisted mainly of direct costs (USD 16, 95% CI 13-19). (Table 5) Visiting
a private clinic as the first point of contact led to statistically significantly higher costs
than visiting a PHC as the first contact, both in terms of direct costs (β 16.87, CI 95%
0.54-23.20, P<0.001) and of total costs (β 18.41, CI 95% 10.35-26.47, P<0.001).
Patients who visited a private hospital as the first contact also incurred statistically
significantly higher direct costs (β 28.38, CI 95% 17.18-39.58, P<0.001) and total costs
(β 24.96, CI 95% 10.64-39.28, P=0.001) than those visiting a PHC as the first contact.
The direct medical costs incurred by patients who first sought care at private clinics
(USD 21; 95% CI USD 15-28) and private hospitals (USD 32; 95% CI USD 17-48)
were significantly higher than those who first sought care at PHCs (USD 5; 95% CI
USD 3-7), while travel costs between private providers and PHCs did not differ
significantly (See Annex E).
Despite involving a higher number of visits, first visiting a pharmacy, practitioner of
alternative medicine or other health provider did not lead to significantly higher costs
than those incurred by patients who first sought care at a PHC. Between districts,
insurance coverage, household income level, and education level, the differences in the
total costs, direct costs, and indirect costs incurred were not statistically significant.
Indirect costs during the pre-diagnostic phase were associated with employment status.
In addition, patients who were formally employed had higher indirect costs than patients
who did not have a job or were not formally employed (β 3.92, CI 95% 0.88-6.96,
P=0.012). No other variables determined the indirect costs.

Cost of seeking care
65
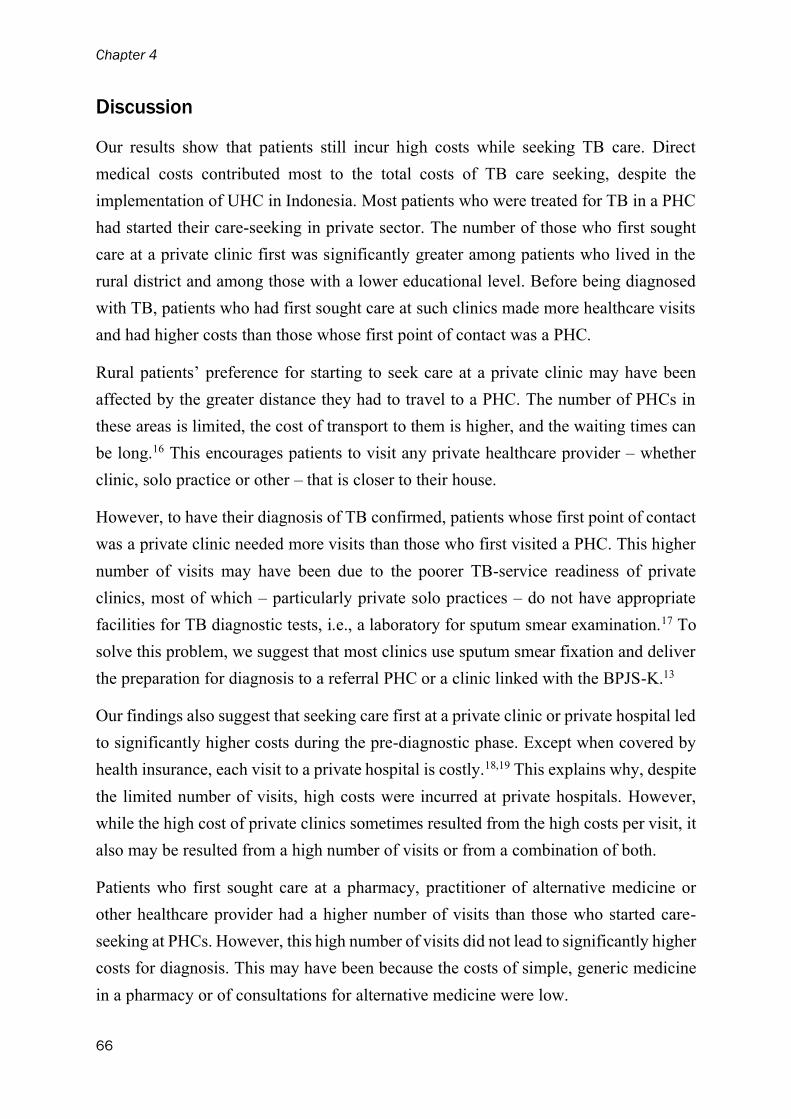
Chapter 4
66
Discussion
Our results show that patients still incur high costs while seeking TB care. Direct
medical costs contributed most to the total costs of TB care seeking, despite the
implementation of UHC in Indonesia. Most patients who were treated for TB in a PHC
had started their care-seeking in private sector. The number of those who first sought
care at a private clinic first was significantly greater among patients who lived in the
rural district and among those with a lower educational level. Before being diagnosed
with TB, patients who had first sought care at such clinics made more healthcare visits
and had higher costs than those whose first point of contact was a PHC.
Rural patients’ preference for starting to seek care at a private clinic may have been
affected by the greater distance they had to travel to a PHC. The number of PHCs in
these areas is limited, the cost of transport to them is higher, and the waiting times can
be long.16 This encourages patients to visit any private healthcare provider – whether
clinic, solo practice or other – that is closer to their house.
However, to have their diagnosis of TB confirmed, patients whose first point of contact
was a private clinic needed more visits than those who first visited a PHC. This higher
number of visits may have been due to the poorer TB-service readiness of private
clinics, most of which – particularly private solo practices – do not have appropriate
facilities for TB diagnostic tests, i.e., a laboratory for sputum smear examination.17 To
solve this problem, we suggest that most clinics use sputum smear fixation and deliver
the preparation for diagnosis to a referral PHC or a clinic linked with the BPJS-K.13
Our findings also suggest that seeking care first at a private clinic or private hospital led
to significantly higher costs during the pre-diagnostic phase. Except when covered by
health insurance, each visit to a private hospital is costly.18,19 This explains why, despite
the limited number of visits, high costs were incurred at private hospitals. However,
while the high cost of private clinics sometimes resulted from the high costs per visit, it
also may be resulted from a high number of visits or from a combination of both.
Patients who first sought care at a pharmacy, practitioner of alternative medicine or
other healthcare provider had a higher number of visits than those who started care-
seeking at PHCs. However, this high number of visits did not lead to significantly higher
costs for diagnosis. This may have been because the costs of simple, generic medicine
in a pharmacy or of consultations for alternative medicine were low.

Cost of seeking care
67
Despite the implementation of UHC in Indonesia, excessive visits and costs during the
pre-diagnostic phase remain. Although this study did not compare the situation before
and after the implementation of UHC, we showed that there were no significant
differences in number of visits and costs between patients who were and were not
covered by national health insurance.
Excessive visits and costs can result in diagnostic delays, potential catastrophic costs
during treatment, and poor outcome.10,20 To prevent high number of visits and high
costs, the integration between the national health insurance and the NTP, which is still
fragmented, should be improved.21 Currently, there has been no direct link between the
national health insurance system and the NTP. Private providers – despite linked to the
BPJS-K – often unaware of the national tuberculosis guidelines and of TB referral
system under the NTP.4 The current practice of TB current guidelines in private
providers seems not optimal. There has been also lack of incentives from the national
health insurance to improve the quality of TB care in private sector.22 Therefore,
comprehensive strategies are imperative.
To solve the fragmented system in TB care, the national health insurance needs to
develop a mechanism of incentives whereby private physicians and clinics can screen
and diagnose TB cases accurately and refer the case to facility where TB diagnostic
tests and treatment are fully covered. In its pay-for-performance criteria,22 for example,
BPJS-K should include the quality of the TB services a clinic provides. A contract of
service provision that is signed between the BPJS-K and private providers should
consider the readiness of the TB services including the availability of diagnostic tests,
the adherence with TB management guidelines, and prior attendance of TB training. In
addition, the strategies should include efforts to increase patients’ awareness, to reduce
stigma and discrimination, to improve TB diagnostic options, and to increase the
number of PHCs in rural districts.
This study has two main limitations. The first is our collection of data from patients
who had ended up at a PHC for TB treatment, and thus our exclusion of those who had
had TB treatment from a private provider. This may have led us to overestimate PHCs
as the first point of contact and to underestimate the number of pre-diagnostic visits and
the costs incurred during the pre-diagnostic phase. It may also have led to a misleadingly
high figure for the number of visits – by at least one visit – by patients whose first point
of care had not been a PHC, particularly if this visit had involved a healthcare provider

Chapter 4
68
that could not itself diagnose TB. The second limitation is that, since we relied on
patients’ memory to obtain the information, the number of visits and the costs incurred
may also have been affected by recall bias. A patient may not remember the frequency
and cost of buying medicine in a drug store or pharmacy, and thereby underestimate the
number of visits and the total pre-diagnostic costs.
The provision of TB services in Indonesia is similar to health-service delivery in other
high TB-burden countries in Asia that need to improve their public-private mix.
However, our findings require careful generalization before being applied to other
countries or even to other regions of Indonesia. As this study was conducted only on
the island of Java, it does not necessarily reflect the situation throughout Indonesia.
Conclusion
Despite the UHC, high costs of TB seeking care remain, with direct medical costs
contributing most to the total costs. The preference of people with TB first to seek
diagnosis from a private provider rather than a PHC leads to more pre-diagnostic visits
and higher costs. The UHC scheme alone is not enough to improve TB control and
reduce patients’ costs. A comprehensive strategy is required to improve TB-related
services in the private healthcare sectors. To reduce diagnostic delays and minimize
patients’ costs, it is essential to reduce the fragmented system between the national
health insurance scheme and the National TB Programme, to improve the quality of TB
care in the private sector, and to improve the availability of PHCs, particularly in rural
areas.
Ethics approval and consent to participation
We received ethical clearance for this study from the Ethical Committee at the Faculty of Medicine of
Universitas Indonesia – Cipto Mangunkusumo Hospital, Jakarta Indonesia (No.
416/UN2.F1/ETIK/VI/2016). Before interviewing selected TB patients, we provided them with written
and oral explanations, and also with the informed-consent form necessary for their approval as subjects
of this study.
Cost of seeking care
69
Funding
This study was funded by the Indonesian Endowment Fund for Education (Lembaga Pengelola Dana
Pendidikan, LPDP), Indonesia. The LPDP granted a funding for the study, but did not involve and
interfere in designing the study protocol, conducting data collection and data analysis, as well as
finalizing the manuscript.
Acknowledgments
We would like to thank the Heads of Jakarta Provincial Health Office, Tasikmalaya District Health
Office, and Depok District Health Office for issuing permits for data collection in their districts. We
also thank Dedi Suhendar, all TB Programme Officers in Primary Health Centres, and all enumerators,
for their support with data collection. Finally, we thank LPDP for funding this project and USAID,
SHERA, and CCR SMART CITY Universitas Indonesia for their support through the Smart City
Project. TAJH was supported by a Research Excellence Initiative Grant from Erasmus University
Rotterdam, The Netherlands.
Chapter 4
70
References 1. Putra IWGAE, Utami NWA, Suarjana IK, Duana IMK, Astiti CID, Putra IW, Probandari A, Tiemersma EW,
Wahyuni CU: Factors associated to referral of tuberculosis suspects by private practitioners to community
health centres in Bali Province, Indonesia. BMC Health Services Research 2013, 13(1):445.
2. Uplekar M, Juvekar S, Morankar S, Rangan S, Nunn P: Tuberculosis patients and practitioners in private
clinics in India. The International Journal of Tuberculosis and Lung Disease 1998, 2(4):324-329.
3. Lönnroth K, Thuong LM, Linh PD, Diwan VK: Utilization of private and public health-care providers for
tuberculosis symptoms in Ho Chi Minh City, Vietnam. Health Policy and Planning 2001, 16(1):47-54.
4. Mahendradhata Y, Lestari T, Probandari A, Indriarini LE, Burhan E, Mustikawati D, Utarini A: How do
private general practitioners manage tuberculosis cases? A survey in eight cities in Indonesia. BMC research
notes 2015, 8:564-564.
5. World Health Organization: Guide to develop a national action plan on public-private mix for tuberculosis
prevention and care Geneva: World Health Organization; 2017.
6. Surya A, Setyaningsih B, Suryani Nasution H, Gita Parwati C, Yuzwar YE, Osberg M, Hanson CL, Hymoff
A, Mingkwan P, Makayova J et al: Quality Tuberculosis Care in Indonesia: Using Patient Pathway Analysis
to Optimize Public–Private Collaboration. The Journal of Infectious Diseases 2017, 216(suppl_7):S724-
S732.
7. Wells WA, Uplekar M, Pai M: Achieving systemic and scalable private sector engagement in tuberculosis
care and prevention in Asia. PLOS Medicine 2015, 12(6):e1001842.
8. Padayatchi N, Daftary A, Naidu N, Naidoo K, Pai M: Tuberculosis: treatment failure, or failure to treat?
Lessons from India and South Africa. BMJ Global Health 2019, 4(1):e001097.
9. Fuady A, Houweling TAJ, Mansyur M, Richardus JH: Catastrophic total costs in tuberculosis-affected
households and their determinants since Indonesia's implementation of universal health coverage. Infect Dis
Poverty 2018, 7(1):3.
10. Cai J, Wang X, Ma A, Wang Q, Han X, Li Y: Factors associated with patient and provider delays for
tuberculosis diagnosis and treatment in Asia: a systematic review and meta-analysis. Plos One 2015,
10(3):e0120088.
11. Fuady A: Jaminan kesehatan universal dan pemenuhan hak kesehatan. Jakarta: Badan Penerbit FKUI; 2014.
12. Badan Penyelenggara Jaminan Sosial Kesehatan: Ringkasan eksekutif laporan pengelolaan program dan
laporan keuangan jaminan sosial kesehatan tahun 2017. In. Jakarta: BPJS Kesehatan; 2017.
13. Kementerian Kesehatan Republik Indonesia: Petunjuk teknis pelayanan tuberkulosis bagi peserta Jaminan
Kesehatan Nasional (JKN). Jakarta: Kementerian Kesehatan RI; 2015.
14. Fuady A, Houweling TA, Mansyur M, Richardus JH: Adaptation of the tool to estimate patient costs
questionnaire into Indonesian context for tuberculosis-affected households. Acta Med Indones 2018, 50(1):3-
10.
15. World Health Organization: Tuberculosis patient cost surveys: a handbook. Geneva: World Health
Organization; 2017.
16. Ekawati FM, Claramita M, Hort K, Furler J, Licqurish S, Gunn J: Patients’ experience of using primary care
services in the context of Indonesian universal health coverage reforms. Asia Pacific Family Medicine 2017,
16(1):4.
17. Rebecca S, Trish S, Edwin U, Sunaryo G, Nora T, Nugroho B, Vivek N, Hie S, Kezia S: Engaging private
providers to improve TB outcomes in Indonesia: USAID, Indonesia National TB Program; 2018.
18. van den Hof S, Collins D, Hafidz F, Beyene D, Tursynbayeva A, Tiemersma E: The socioeconomic impact
of multidrug resistant tuberculosis on patients: results from Ethiopia, Indonesia and Kazakhstan. BMC Infect
Dis 2016, 16:470.
19. Johns B, Probandari A, Mahendradhata Y, Ahmad RA: An analysis of the costs and treatment success of
collaborative arrangements among public and private providers for tuberculosis control in Indonesia. Health
Policy 2009, 93(2):214-224.
20. Getnet F, Demissie M, Assefa N, Mengistie B, Worku A: Delay in diagnosis of pulmonary tuberculosis in
low-and middle-income settings: systematic review and meta-analysis. BMC Pulmonary Medicine 2017,
17(1):202.
21. Purwaningsih E: Analisis kebijakan pembiayaan TB di fasilitas kesehatan milik pemerintah era JKN di kota
Samarinda. 2018 2018, 7(2):5.
22. Fuady A: Arsitektur jaminan kesehatan Indonesia: capaian, kritik dan tantangan masa depan. Jakarta: Sagung
Seto; 2019.

71
Chapter 5
Catastrophic costs due to tuberculosis
worsen treatment outcomes: a
prospective cohort study in Indonesia
Ahmad Fuady, MD, M.Sc1,2* Tanja A.J. Houweling, Ph.D,1 Muchtaruddin Mansyur, MD, PhD,2
Erlina Burhan, MD, Ph.D,3 Jan Hendrik Richardus, MD, Ph.D1
1Department of Public Health, Erasmus MC, University Medical Center Rotterdam,
Rotterdam, The Netherlands; 2Department of Community Medicine, Faculty of
Medicine, Universitas Indonesia, Jakarta, Indonesia; 3Department of Respiratory
and Pulmonology, Persahabatan Hospital – Faculty of Medicine, Universitas
Indonesia, Jakarta, Indonesia.
In Review

Chapter 5
72
Abstract
Background:
While the incidence of catastrophic costs due to tuberculosis (TB) remains high, there
is little evidence about their impact on TB treatment outcomes and adherence. We
assessed their effect on treatment outcomes and adherence in Indonesia.
Methods:
We interviewed 282 adult TB patients who underwent TB treatment in urban, suburban,
and rural districts of Indonesia. One year after the interview, we followed up treatment
adherence and outcomes. We applied multivariable analysis using generalized linear
mixed models.
Results:
Follow-up was complete for 252/282 patients. Eighteen (7%) patients had unsuccessful
treatment and 40 (16%) had poor adherence. At a threshold of 30% of annual household
income, catastrophic costs negatively impacted treatment outcomes (aOR=4.15,
95%CI=1.15-15.01). At other thresholds, the associations showed a similar pattern, but
were not statistically significant. The association between catastrophic costs and
treatment adherence is complex because of reverse causation. After adjustment,
catastrophic costs negatively affected treatment adherence at the 10% and 15%
threshold (aOR=2.11, 95%CI=0.97-4.59, P=0.059 and aOR=2.06, 95%CI=0.95-4.46,
P=0.07). At other thresholds, there was no evidence of such an effect.
Conclusions:
Catastrophic costs negatively affect TB treatment outcomes and treatment adherence.
To eliminate TB, it is essential to mitigate catastrophic costs.
Keywords: Catastrophic costs, Indonesia, Treatment adherence, Treatment outcomes,
Tuberculosis.

Catastrophic costs and treatment outcomes
73
Introduction
Tuberculosis (TB) often result in severe economic consequences for TB-affected
households.1 The latest World Health Organization (WHO) End TB Strategy aims by
2020 to reduce to zero percent the percentage of TB-affected families that face
catastrophic costs.2 However, attaining this target is challenging. In a simulation of eight
scenarios, Fuady et al. showed that, although the provision of a cash transfer to TB-
affected households would reduce the incidence of catastrophic costs due to TB, the
incidence would not reach the zero-percent target.3 This failure is due to the high
variability of costs between TB patients, particularly those due to income loss. If the
value of cash transfer provided were the same for all patients, it would not be possible
to eliminate catastrophic costs. This finding raises the question of whether eliminating
catastrophic costs –apart from its importance as a proxy of poverty– is a rational target
to be achieved.
There are various definitions of catastrophic costs. Given that eliminating the incidence
of catastrophic costs is a target of the WHO End TB Strategy, the definition of TB-
related catastrophic costs issued by the WHO is the most appropriate to use. The latest
TB costs survey handbook of the WHO defines catastrophic costs as the total costs—
i.e., all direct and indirect costs, including income loss, that exceed a specific threshold
of a household’s annual income.4 In Peru, Wingfield et al. showed that TB-related
catastrophic costs were associated with adverse TB outcomes and suggested a threshold
of 20% of annual household income to define catastrophic costs.5 However, there is a
paucity of evidence from other countries, especially from TB high-burden countries.
Indonesia is such a TB high-burden country. Despite the availability of free treatment,
Indonesia has a high incidence of TB-related catastrophic costs: 36% in TB-affected
households and 83% in MDR-TB-affected households.6 Income loss is the main driver
of these costs. Catastrophic costs during the course of treatment may affect treatment
adherence and treatment outcomes. Patients may quit treatment altogether or they may
interrupt it and thereby extend it, and –as a consequence– they may fail to be cured, or
may even die during treatment. There is nonetheless no evidence on the impact of
catastrophic costs on TB treatment outcomes and treatment adherence from this high-
burden country. We aimed to establish the extent to which catastrophic costs in TB-
affected Indonesian households affect TB treatment outcomes and adherence.

Chapter 5
74
Material and methods
Study design
To assess the effect of catastrophic costs on patients’ TB treatment adherence and
outcomes, we conducted a cohort study in three districts in Indonesia, each with a
different level of urbanization: Jakarta (urban), Depok (suburban), and Tasikmalaya
(rural). In each district, we identified all primary health centers (PHCs) that delivered
TB treatment services and were also linked to the Indonesian national tuberculosis
program (NTP). For inclusion in our study, we randomly selected 5-8 PHCs per district.
In total, 19 PHCs were included. In the baseline study (July-September 2016), we
interviewed 282 TB patients aged 18 years old or above who had undergone TB
treatment for at least one month, or had completed treatment no more than one month
previously.6 One year after the interview, we followed up their TB treatment adherence
and TB treatment outcomes. We excluded TB patients whose treatment had not been
evaluated, and patients who had been transferred to other health facilities.
Treatment outcome and adherence
As the WHO had set treatment outcome as an essential indicator in TB control
programs,7 treatment outcome was the primary outcome measured in this study. To
evaluate patients’ treatment outcomes, we examined their medical records (TB 01
forms) and cross-checked the data with the PHCs’ TB record (TB 03 form). We used
the definitions and classification of treatment outcome issued by the WHO, defining
treatment outcome as successful if a patient had been cured or had completed TB
treatment, and as unsuccessful if a patient had been lost to follow-up, had died, or if the
treatment had failed.8 (Table 1)

Catastrophic costs and treatment outcomes
75
Table 1 Primary and secondary outcomes in this study
Outcomes Definition
Primary outcome: treatment outcomes
Successful treatment The sum of cured and completed TB cases.
a. Cured A TB patient who had a positive sputum smear or culture at
the beginning of TB treatment but had a negative sputum
smear or culture in the last month of treatment and on at least
one previous occasion.
b. Completed A TB patient who completed treatment but who, in the last
month of treatment and on at least one previous occasion,
did not have any proof of a negative sputum smear or culture
result.
Unsuccessful treatment Died, failed, or lost to follow-up.
a. Died A TB patient who died for any reason during the course of
treatment.
b. Failed A TB patient who still had a positive sputum smear or
culture after 5 months or more of TB treatment.
c. Lost to follow-up A TB patient whose treatment had been interrupted for two
consecutive months or more.
Secondary outcome: treatment adherence
a. Good treatment
adherence
A patient who treatment had been successful and whose
treatment period had not exceeded the expected end-of-
treatment date by 14 days or more.
b. Poor treatment
adherence
Sum of patients whose treatment period had exceeded the
expected end-of-treatment date by 14 days or more than,
plus cases lost to follow-up.
Since catastrophic costs are also assumed to reduce treatment adherence, we evaluated
treatment adherence as a secondary outcome. However, there is no commonly agreed
definition of TB non-adherence. By defining non-adherent patients as those who had
missed at least one prescribed dose of TB drug, some studies use stringent criteria,9, 10
while other criteria are less stringent, such as having interrupted treatment for more than
one month, or never having been under supervision.11-15 We defined poor adherence as
applying (a) to a patient who had been lost to follow-up— indicating that he or she had
not adhered to treatment— or (b) to a patient whose treatment had been successful, but
the treatment period had exceeded the expected end-of-treatment date by 14 days or
Chapter 5
76
more. To assess the effect of catastrophic costs on treatment adherence, we excluded
patients who had died and those whose treatment had failed.
Catastrophic costs
In the baseline study, we interviewed patients about the total TB-related costs their
household had incurred since the pre-diagnostic phase until the patients stopped
treatment. We used the Tool to Estimate Patient Costs that has been adapted to the
Indonesian context.4, 16 In compliance with the definition in the WHO handbook, total
costs consisted of direct medical costs (i.e., administration costs, laboratory tests and
X-ray examination costs, drug costs, hospitalization costs, and adverse drug-effects
costs); direct non-medical costs (i.e., transportation costs, food costs, and the costs of
food supplements); and income loss.4
To calculate administration costs and food costs, we multiplied the number of visits by
the administration fees and food costs incurred during visits. To measure the total
transportation costs, we multiplied single travel costs for a return visit by the number of
visits during treatment. The number of visits was recorded in the patient’s medical
record. If these data were missing or if a patient had become lost to follow-up, we
calculated costs on the basis of patients’ average number of visits to the same PHC.
Income loss was estimated on the basis of the monthly income change reported in the
baseline study. The monthly income change was calculated as the difference in income
between that received before TB diagnosis and that received at the time of the interview.
The monthly income loss was multiplied by the number of months patients had
undergone TB treatment. Patients who earned an uncertain monthly income from jobs
in the informal sector, such as taxi-bike drivers, often were unable to provide exact
information on changes from one month to the next. To avoid underestimating the
income loss of these patients, we used the human capital approach to estimate their
income loss.4 We collected the self-reported time that patients took to seek and receive
healthcare and the hourly rate the patient working in the informal sector normally
charged for his/her informal work. We used the following formula to obtain total
income loss: return trip in minutes for a typical visit × patient’s income loss per minute
× the number of visits over the course of treatment.
Catastrophic costs and treatment outcomes
77
Patients may quit treatment due to their actual or expected future financial burden. Some
patients, may therefore not experience catastrophic costs at the time they quitted
treatment, but would have experienced such costs if they had continued until treatment
completion. For patients who were lost to follow-up, we therefore extrapolated the
direct and indirect costs by multiplying their direct unit cost by the average number of
visits of patients treated in the same PHC. To extrapolate their income loss, we
multiplied their monthly income loss by the number of months in a standard period of
full treatment.
In addition to TB-related costs, patients also reported their monthly household income.
Per patient, we calculated annual household income in the year before he or she had
been diagnosed with TB. We calculated total costs as a share of annual household
income, which was displayed as a proportion (%). If the proportion exceeded a specific
threshold, e.g., 30%, we defined this as catastrophic costs.17
Statistical analyses
First, we analyzed the association between catastrophic costs (as independent variable)
and treatment adherence and treatment outcomes (as dependent variables) using
generalized linear mixed models (GLMM) with a logit link function, generating crude
odds ratios (cORs) for these associations. We used random effects to adjust for our
cluster-sampling design (19 PHCs). To determine the threshold at which catastrophic
costs affect treatment outcomes and adherence, we ran the analysis using various
thresholds, i.e., 10%, 15%, 20%, 25%, 30%, and 35%. The threshold at which
catastrophic costs were statistically significantly associated with treatment outcomes
and treatment adherence was used for further analyses.
Next, we examined whether confounding had produced the association observed in the
univariate analysis between catastrophic costs, treatment outcomes, and treatment
adherence. To assess whether the effect of costs had been confounded by other
variables, we decided a priori to include all potential confounders for which we had
data (i.e., age, sex, district, education, previous TB treatment, initial sputum result,
hospitalization, and adverse drug effect). To obtain adjusted ORs (aORs) and 95% CIs,
the potential confounders were analyzed simultaneously in a multivariable analysis.
Since catastrophic costs incorporate income in their calculation, we did not include
Chapter 5
78
household income level, breadwinner, and job-loss variables as potential confounders
in our multivariable analysis.
To assess the contribution of catastrophic costs to unsuccessful treatment outcomes in
the population, we also estimated the population-attributable fraction (PAF) for our
study population. This was calculated as [Ppop x (OR-1)] / [Ppop x (OR-1) + 1], where
Ppop was the proportion of exposed subjects in the entire study population, and OR was
the odds ratio of catastrophic costs to unsuccessful treatment outcomes obtained from
the multivariable analysis.
Poor treatment adherence in this study included patients who had been lost to follow-
up and patients whose treatment period had been prolonged. As prolonged treatment
may lead to higher direct and indirect costs (e.g. more healthcare visits, higher income
loss), it may be the cause rather than the consequence of catastrophic costs. In our
univariate and multivariable analyses, we therefore examined whether the association
between catastrophic costs and treatment adherence was due to reverse causation. To
do so, we simulated cost data for patients with a prolonged treatment period by adjusting
their number of visits to the average number of visits of patients treated in the same
PHC, and, on the basis of their expected end-of-treatment date, by the number of months
they had lost income. After recalculating the costs, we compared (1) the incidence of
catastrophic costs between the actual costs and recalculated costs, and (2) the effect of
catastrophic costs on treatment outcomes. No such reverse effects were expected for
patients who had been lost to follow-up, for patients whose treatment had failed, or for
patients who had died, as these patients’ TB treatment had not been prolonged.
All data were cleaned and analyzed using IBM SPSS 21.18 Costs and income data were
entered in Indonesian Rupiah (IDR) and were then converted to US Dollars (USD) using
the average exchange rate for 2016 (USD 1 = IDR 13,389.41).19
Results
One year after patients had been interviewed, the medical records of 27 patients were
missing and could not be tracked for reasons such as storage relocation, the renovation
of a PHC building, and change of several persons in charge of the TB program in PHCs.
Three patients had moved to other healthcare facilities. In our analyses, we included
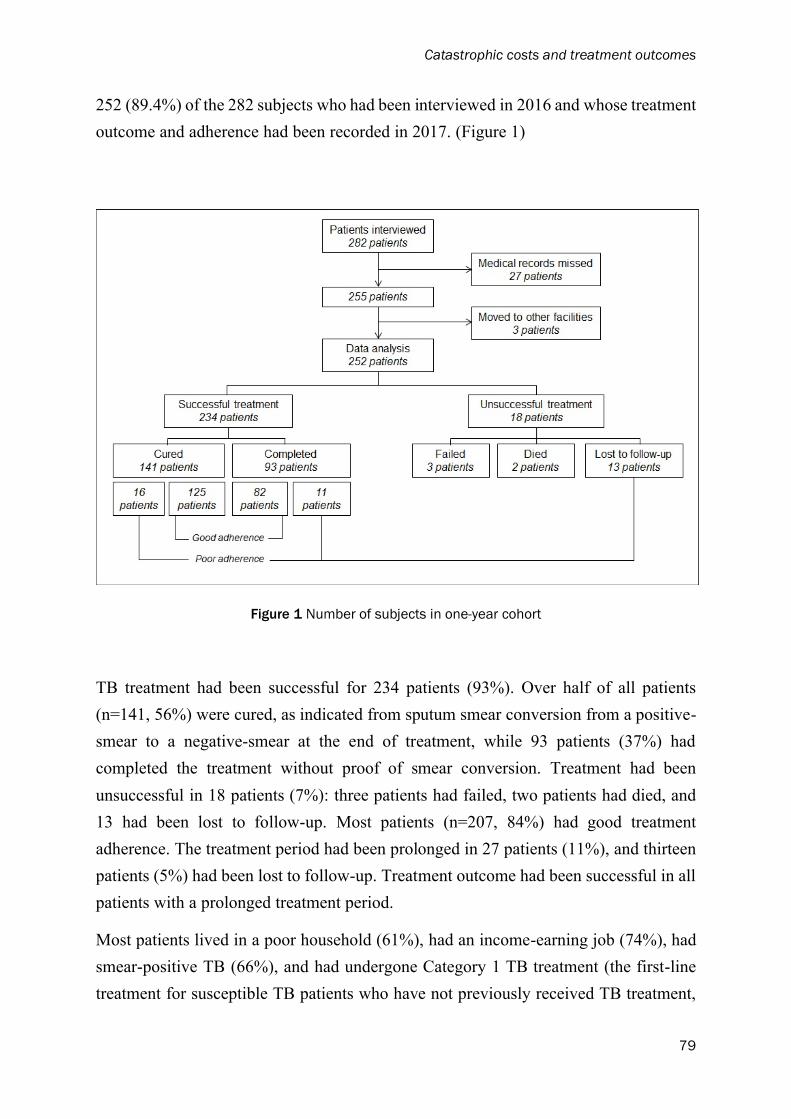
Catastrophic costs and treatment outcomes
79
252 (89.4%) of the 282 subjects who had been interviewed in 2016 and whose treatment
outcome and adherence had been recorded in 2017. (Figure 1)
Figure 1 Number of subjects in one-year cohort
TB treatment had been successful for 234 patients (93%). Over half of all patients
(n=141, 56%) were cured, as indicated from sputum smear conversion from a positive-
smear to a negative-smear at the end of treatment, while 93 patients (37%) had
completed the treatment without proof of smear conversion. Treatment had been
unsuccessful in 18 patients (7%): three patients had failed, two patients had died, and
13 had been lost to follow-up. Most patients (n=207, 84%) had good treatment
adherence. The treatment period had been prolonged in 27 patients (11%), and thirteen
patients (5%) had been lost to follow-up. Treatment outcome had been successful in all
patients with a prolonged treatment period.
Most patients lived in a poor household (61%), had an income-earning job (74%), had
smear-positive TB (66%), and had undergone Category 1 TB treatment (the first-line
treatment for susceptible TB patients who have not previously received TB treatment,
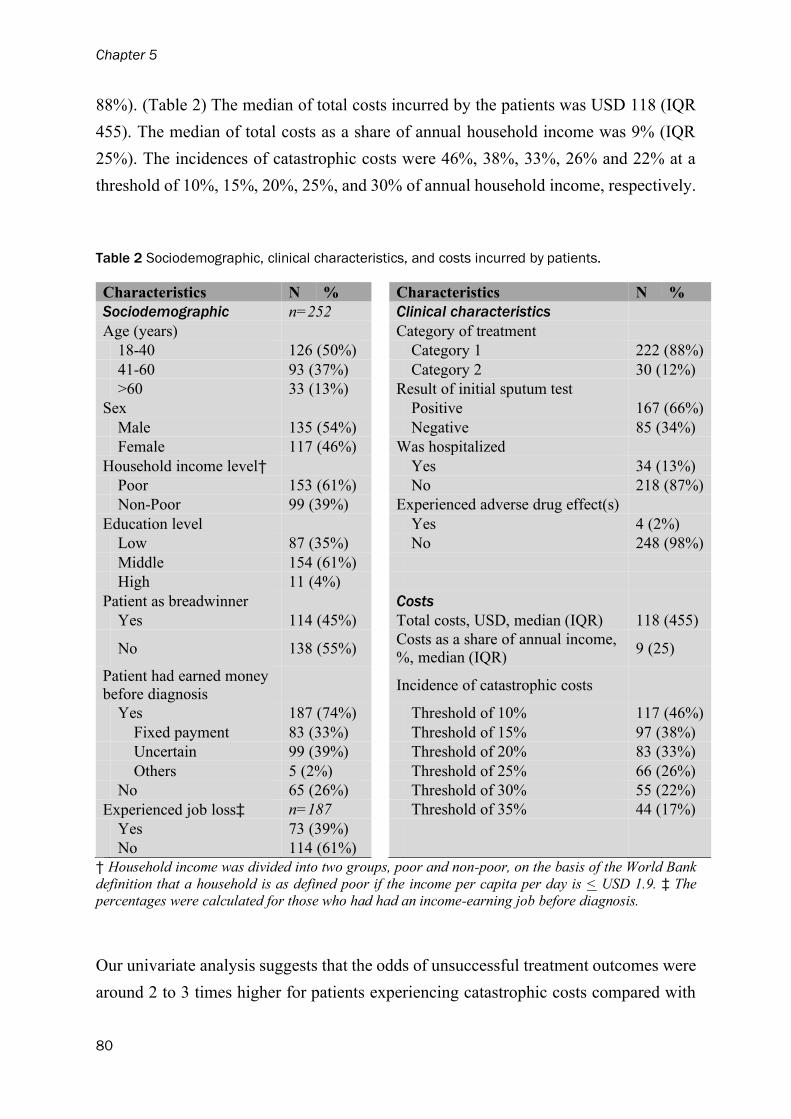
Chapter 5
80
88%). (Table 2) The median of total costs incurred by the patients was USD 118 (IQR
455). The median of total costs as a share of annual household income was 9% (IQR
25%). The incidences of catastrophic costs were 46%, 38%, 33%, 26% and 22% at a
threshold of 10%, 15%, 20%, 25%, and 30% of annual household income, respectively.
Table 2 Sociodemographic, clinical characteristics, and costs incurred by patients.
Characteristics N % Characteristics N %
Sociodemographic n=252 Clinical characteristics Age (years)
Category of treatment
18-40 126 (50%) Category 1 222 (88%)
41-60 93 (37%) Category 2 30 (12%)
>60 33 (13%) Result of initial sputum test Sex
Positive 167 (66%)
Male 135 (54%) Negative 85 (34%)
Female 117 (46%) Was hospitalized Household income level†
Yes 34 (13%)
Poor 153 (61%) No 218 (87%)
Non-Poor 99 (39%) Experienced adverse drug effect(s) Education level
Yes 4 (2%)
Low 87 (35%) No 248 (98%)
Middle 154 (61%)
High 11 (4%)
Patient as breadwinner Costs
Yes 114 (45%) Total costs, USD, median (IQR) 118 (455)
No 138 (55%) Costs as a share of annual income,
%, median (IQR) 9 (25)
Patient had earned money
before diagnosis
Incidence of catastrophic costs
Yes 187 (74%) Threshold of 10% 117 (46%)
Fixed payment 83 (33%) Threshold of 15% 97 (38%)
Uncertain 99 (39%) Threshold of 20% 83 (33%)
Others 5 (2%) Threshold of 25% 66 (26%)
No 65 (26%) Threshold of 30% 55 (22%)
Experienced job loss‡ n=187 Threshold of 35% 44 (17%)
Yes 73 (39%)
No 114 (61%) † Household income was divided into two groups, poor and non-poor, on the basis of the World Bank
definition that a household is as defined poor if the income per capita per day is < USD 1.9. ‡ The
percentages were calculated for those who had had an income-earning job before diagnosis.
Our univariate analysis suggests that the odds of unsuccessful treatment outcomes were
around 2 to 3 times higher for patients experiencing catastrophic costs compared with
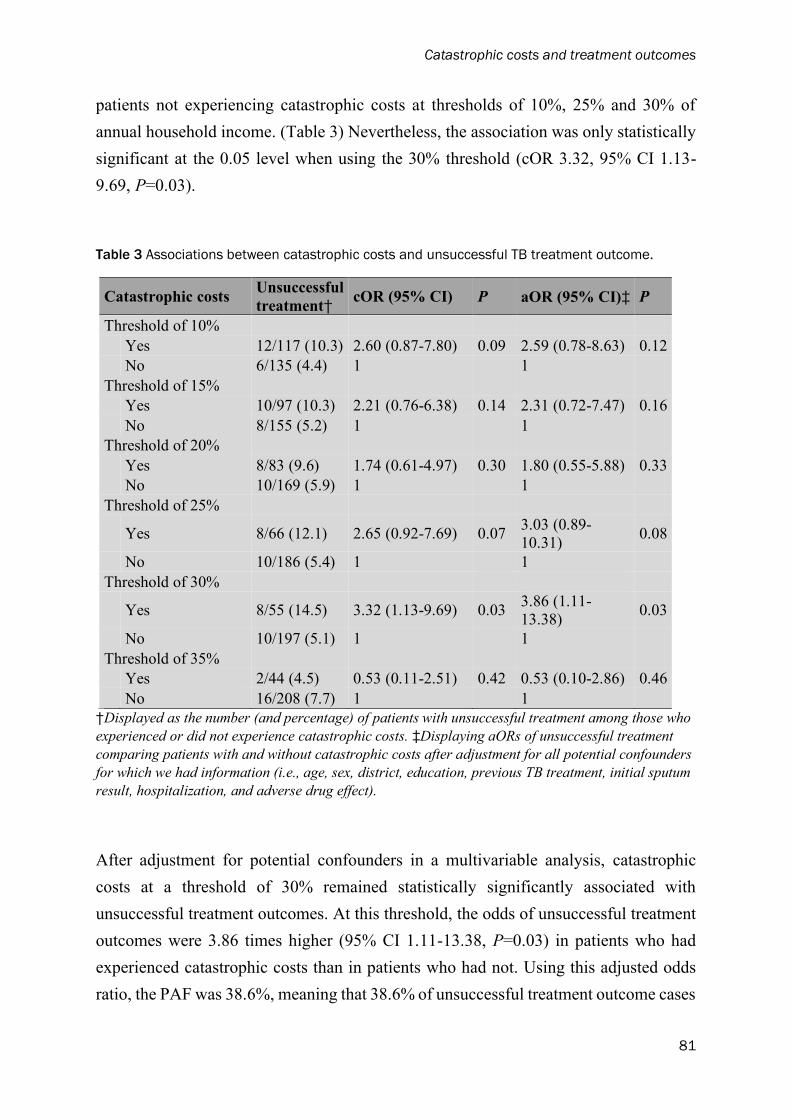
Catastrophic costs and treatment outcomes
81
patients not experiencing catastrophic costs at thresholds of 10%, 25% and 30% of
annual household income. (Table 3) Nevertheless, the association was only statistically
significant at the 0.05 level when using the 30% threshold (cOR 3.32, 95% CI 1.13-
9.69, P=0.03).
Table 3 Associations between catastrophic costs and unsuccessful TB treatment outcome.
Catastrophic costs Unsuccessful
treatment† cOR (95% CI) P aOR (95% CI)‡ P
Threshold of 10% Yes 12/117 (10.3) 2.60 (0.87-7.80) 0.09 2.59 (0.78-8.63) 0.12 No 6/135 (4.4) 1 1
Threshold of 15% Yes 10/97 (10.3) 2.21 (0.76-6.38) 0.14 2.31 (0.72-7.47) 0.16 No 8/155 (5.2) 1 1
Threshold of 20% Yes 8/83 (9.6) 1.74 (0.61-4.97) 0.30 1.80 (0.55-5.88) 0.33 No 10/169 (5.9) 1 1
Threshold of 25%
Yes 8/66 (12.1) 2.65 (0.92-7.69) 0.07 3.03 (0.89-
10.31) 0.08
No 10/186 (5.4) 1 1
Threshold of 30%
Yes 8/55 (14.5) 3.32 (1.13-9.69) 0.03 3.86 (1.11-
13.38) 0.03
No 10/197 (5.1) 1 1
Threshold of 35% Yes 2/44 (4.5) 0.53 (0.11-2.51) 0.42 0.53 (0.10-2.86) 0.46 No 16/208 (7.7) 1 1
†Displayed as the number (and percentage) of patients with unsuccessful treatment among those who
experienced or did not experience catastrophic costs. ‡Displaying aORs of unsuccessful treatment
comparing patients with and without catastrophic costs after adjustment for all potential confounders
for which we had information (i.e., age, sex, district, education, previous TB treatment, initial sputum
result, hospitalization, and adverse drug effect).
After adjustment for potential confounders in a multivariable analysis, catastrophic
costs at a threshold of 30% remained statistically significantly associated with
unsuccessful treatment outcomes. At this threshold, the odds of unsuccessful treatment
outcomes were 3.86 times higher (95% CI 1.11-13.38, P=0.03) in patients who had
experienced catastrophic costs than in patients who had not. Using this adjusted odds
ratio, the PAF was 38.6%, meaning that 38.6% of unsuccessful treatment outcome cases
Chapter 5
82
were attributable to catastrophic costs. At the 10%-25% thresholds, the pattern of
associations was similar, with estimated odds ratios of around 2 to 3, but these
associations were not statistically significant at conventional levels.
Our univariate analysis also suggests that catastrophic costs (at thresholds of 10%-25%)
were associated with poor treatment adherence: the odds of poor adherence were
approximately twice as high in patients who had experienced catastrophic costs as in
those who had not. (Table 4) However, these findings were statistically significant at
the 0.05 level only when using the 15% threshold. At this threshold, the odds of poor
adherence among patients who had experienced catastrophic costs were 2.12 times
higher (95% CI 1.01-4.45, P=0.046) than in those who had not. None of the other
variables were statistically significantly associated with poor treatment adherence.
The association between catastrophic costs and poor treatment adherence was partly
due to reverse causation. In other words, prolonged treatment had contributed to
catastrophic costs. We evaluated the extent of reverse causation by conducting a
simulation analysis for patients with prolonged treatment period. When we assumed
that patients with extended treatment duration had finished their treatment on time, the
strength of the association between catastrophic costs and treatment adherence fell, at
the 15% threshold from cOR 2.12 to 1.87, at the 25% threshold from cOR 1.94 to 1.35,
and at the 20% threshold from cOR 1.88 to 1.47. When also adjusting for potential
confounders, catastrophic costs at the 10% and 15% thresholds were associated with a
two-times higher odds of poor adherence compared to patients without catastrophic
costs (aOR 2.11, 95% CI 0.97-4.59, P=0.059 and aOR 2.06, 95% CI 0.95-4.46, P=0.07).
At other thresholds, we have no evidence of such an effect.

Catastrophic costs and treatment outcomes
83
Chapter 5
84
Discussion
Our study shows that catastrophic costs can have a negative impact on treatment
outcome. Generally, the odds of an unsuccessful treatment outcome were around two
to four times higher among patients who experienced catastrophic costs compared with
those who had not. While our findings were statistically significant at a threshold for
catastrophic costs of 30%, there was an indication that this may also be the case at
thresholds between 10% and 25%. The association between catastrophic costs and poor
treatment adherence was more complex. Poor adherence can lead to higher costs. After
adjustment for such reverse causation, we found that catastrophic costs at the 10% and
15% threshold were associated with an around two times higher odds of poor treatment
adherence compared to patients who had not experienced such costs, with no effect at
other thresholds.
While there is currently no agreement on the specific threshold of catastrophic costs for
research and policy-making, various studies have defined this threshold as 20% of
annual household income, as suggested by the WHO through their taskforce.3, 16, 20
However, there is little evidence on whether use of this threshold accurately reflects the
effect of catastrophic costs on treatment outcomes and treatment adherence. Until now,
the only study which assessed the association between catastrophic costs and poor
treatment outcome was the Peruvian study (2014) which it suggested a threshold of
20%.5 The study included multidrug-resistant (MDR)-TB patients who incurred higher
costs, and in that study, MDR-TB was found to be one of the determinants of poor
outcomes. Different from the Peruvian study, our study focused on susceptible TB
patients. We found that, at a 30% threshold, catastrophic costs lead to poor treatment
outcomes, which, in our study, mostly consisted of patients who were lost to follow-up.
At a lower threshold (15%) catastrophic costs were associated with poor treatment
adherence (prolonged treatment period or lost to follow-up). This association was due
partly to reverse causation. Patients who did not adhere to their treatment course had to
catch up with it, either under the orders of the PHC health staff (in order to comply with
NTP program guidelines), or because they were self-motivated and wished to minimize
the risk of recurrence. The additional visits needed to complete the full treatment course
led to higher costs and greater income loss, which in some cases led to catastrophic

Catastrophic costs and treatment outcomes
85
costs. At the same time, even after accounting for such reverse causation, catastrophic
costs still negatively affected treatment adherence at thresholds of 10%-15%. Due to
the size of our study and lack of statistical power, although there is indication of a
similar effect at the thresholds of 20-30%, we need to be cautious to draw firm
conclusion with respect to these levels.
With regard to future global policy, our study provides evidence that can inform a
review of the threshold at which catastrophic costs should be measured. If these
catastrophic costs are thought to affect patient adherence, the threshold of 15% of
annual household income, might be considered to define catastrophic costs. When
considering TB treatment outcomes, the threshold of 30% of annual household income,
might be used to define catastrophic costs. Nevertheless, as also suggested by the
WHO,20 the threshold for defining catastrophic costs may vary between countries, and
should be carefully assessed from one setting to the next.
This study is the first cohort study on TB-related catastrophic costs, treatment
adherence, and treatment outcomes in Indonesia. Although we collected data from
urban, suburban, and rural areas of Indonesia, all these areas were located on the island
of Java, which is home to 60% of the Indonesian population. Our findings may not
therefore apply directly to eastern Indonesia and to the country’s other remote areas,
where healthcare facilities are scarcer—a factor that may affect treatment outcomes and
treatment adherence. Similarly, as our study was conducted only in PHCs, its findings
may underestimate the costs of the treatment given by private providers (which are
assumed to be higher), while simultaneously overestimating treatment adherence,
which may be lower among patients who are treated by private providers.21 It is also
uncertain whether our findings will apply to TB high-burden countries in which TB
service delivery is different. Finally, the precise effect estimates in our study remain
uncertain due to the limited sample size of the study. While our study is the first to
provide evidence for Indonesia on the effects of catastrophic costs on treatment
outcomes and treatment adherence, and one of the very few studies that do so for TB
high-burden countries more generally, larger studies are warranted.
We conclude that catastrophic costs negatively impacted TB treatment outcomes and
TB adherence at the various thresholds of annual household income. This highlights the
Chapter 5
86
need for TB control interventions to properly address both the clinical and socio-
economic aspects of the disease.
Acknowledgments
We would like to thank the following: the Head of Jakarta Provincial Health Office, the Head of
Tasikmalaya District Health Office, and the Head of Depok District Health Office for issuing permit
for data collection in their institutions and areas; Dedi Suhendar, the TB Program Officers in Primary
Health Centres, and all enumerators for their support with data collection; the Indonesian Endowment
Fund for Education (Lembaga Pengelola Dana Pendidikan, LPDP) for funding this project, and USAID,
SHERA, CCR SMART CITY Universitas Indonesia for supports through Smart City Project.
Funding
This study was funded by the Indonesian Endowment Fund for Education (Lembaga Pengelola Dana
Pendidikan, LPDP), Indonesia. The LPDP granted a funding for the study, but did not involve and
interfere in designing the study protocol, conducting data collection and data analysis, as well as
finalizing the manuscript.
Ethics approval and consent to participation
Ethical clearance for this study was provided by the Ethical Committee at the Faculty of Medicine of
Universitas Indonesia–Cipto Mangunkusumo Hospital, Jakarta Indonesia (No.
416/UN2.F1/ETIK/VI/2016). We provided written and oral explanations to selected TB patients before
they decided to sign the informed-consent form.

Catastrophic costs and treatment outcomes
87
References 1. Tanimura T, Jaramillo E, Weil D, et al.; Financial burden for tuberculosis patients in low- and middle-income
countries: a systematic review. Eur Respir J 2014;43(6):1763-75. doi: 10.1183/09031936.00193413.
2. World Health Organization. Global strategy and targets for tuberculosis prevention, care and control after
2015. Geneva: World Health Organization, 2013.
3. Fuady A, Houweling TAJ, Mansyur M, et al.; Effect of financial support on reducing the incidence of
catastrophic costs among tuberculosis-affected households in Indonesia: eight simulated scenarios. Infect
Dis Poverty 2019;8(1):10. doi: 10.1186/s40249-019-0519-7.
4. World Health Organization. Tuberculosis patient cost surveys: a handbook. Geneva: World Health
Organization, 2017.
5. Wingfield T, Boccia D, Tovar M, et al.; Defining catastrophic costs and comparing their importance for
adverse tuberculosis outcome with multi-drug resistance: a prospective cohort study, Peru. PLoS Med
2014;11(7):e1001675. doi: 10.1371/journal.pmed.1001675.
6. Fuady A, Houweling TAJ, Mansyur M, et al.; Catastrophic total costs in tuberculosis-affected households
and their determinants since Indonesia's implementation of universal health coverage. Infect Dis Poverty
2018;7(1):3. doi: 10.1186/s40249-017-0382-3.
7. World Health Organization. Treatment of tuberculosis: guidelines. Geneva: World Health Organization,
2010.
8. World Health Organization; Definitions and reporting framework for tuberculosis–2013 revision. 2013.
9. Adane AA, Alene KA, Koye DN, et al.; Non-adherence to anti-tuberculosis treatment and determinant
factors among patients with tuberculosis in northwest Ethiopia. PloS one 2013;8(11):e78791.
10. Tang Y, Zhao M, Wang Y, et al.; Non-adherence to anti-tuberculosis treatment among internal migrants with
pulmonary tuberculosis in Shenzhen, China: a cross-sectional study. BMC Public Health 2015;15(1):474.
doi: 10.1186/s12889-015-1789-z.
11. Gopi PG, Vasantha M, Muniyandi M, et al.; Risk factors for non-adherence to directly observed treatment
(DOT) in a rural tuberculosis unit, South India. Indian Journal of Tuberculosis 2007;54(2):66-70.
12. Awofeso N; Anti-tuberculosis medication side-effects constitute major factor for poor adherence to
tuberculosis treatment. Bulletin of the World health Organization 2008;86:B-D.
13. Kulkarni PY, Akarte SV, Mankeshwar RM, et al.; Non-adherence of new pulmonary tuberculosis patients
to anti-tuberculosis treatment. Annals of medical and health sciences research 2013;3(1):67-74.
14. Woimo TT, Yimer WK, Bati T, et al.; The prevalence and factors associated for anti-tuberculosis treatment
non-adherence among pulmonary tuberculosis patients in public health care facilities in South Ethiopia: a
cross-sectional study. BMC public health 2017;17(1):269.
15. Herrero MB, Ramos S, Arrossi S; Determinants of non adherence to tuberculosis treatment in Argentina:
barriers related to access to treatment. Revista Brasileira de Epidemiologia 2015;18:287-298.
16. Fuady A, Houweling TA, Mansyur M, et al.; Adaptation of the tool to estimate patient costs questionnaire
into Indonesian context for tuberculosis-affected households. Acta Med Indones 2018;50(1):3-10.
17. World Health Organization. Protocol for survey to determine direct and indirect costs due to TB and to
estimate proportion of TB-affected households experiencing catastrophic total costs due to TB. Geneva:
World Health Organization, 2015.
18. IBM Corp; IBM SPSS Statistics for Windows, Version 24.0. Armonk, NY: IBM Corp, 2016.
19. World Bank. Exchange rate.
http://databank.worldbank.org/data/reports.aspx?source=2&series=PA.NUS.FCRF&country (Date
Accessed 2016 Accessed, date last accessed)
20. Pedrazzoli D, Borghi J, Viney K, et al.; Measuring the economic burden for TB patients in the End TB
Strategy and Universal Health Coverage frameworks. International Journal of Tuberculosis and Lung
Disease 2019;23(1):5-11. doi: 10.5588/ijtld.18.0318.
21. Rondags A, Himawan AB, Metsemakers JFM, et al.; Factors influencing non-adherence to tuberculosis
treatment in Jepara, Central Java, Indonesia. Southeast Asian Journal of Tropical Medicine and Public
Health 2014;45(4):859


Chapter 6
Effect of financial support on reducing
the incidence of catastrophic costs
among tuberculosis-affected
households in Indonesia: eight
simulated scenarios
Ahmad Fuady,1,2 Tanja A.J. Houweling,1 Muchtaruddin Mansyur,2
Erlina Burhan,3 Jan Hendrik Richardus1
1Department of Public Health, Erasmus MC, University Medical
Centre Rotterdam, Rotterdam, The Netherlands; 2Department of
Community Medicine, Faculty of Medicine, Universitas Indonesia,
Jakarta, Indonesia; 3Department of Respiratory and
Pulmonology, Persahabatan Hospital – Faculty of Medicine,
Universitas Indonesia, Jakarta, Indonesia
Fuady et al. Infectious Diseases of Poverty. 2019; 8:10

Chapter 6
90
Abstracts
Background:
The World Health Organization’s End Tuberculosis Strategy states that no
tuberculosis (TB)-affected households should endure catastrophic costs due to
TB. To achieve this target, it is essential to provide adequate social protection.
As only a few studies in many countries have evaluated social-protection
programs to determine whether the target is being reached, we assessed the effect
of financial support on reducing the incidence of catastrophic costs due to TB in
Indonesia.
Methods:
From July to September 2016, we interviewed adult patients receiving treatment
for TB in 19 primary health centres in urban, sub-urban and rural area of
Indonesia, and those receiving multidrug-resistant (MDR) TB treatment in an
Indonesian national referral hospital. Based on the need assessment, we
developed eight scenarios for financial support. We assessed the effect of each
simulated scenario by measuring reductions in the incidence of catastrophic
costs.
Results:
We analysed data of 282 TB and 64 MDR-TB patients. The incidences of
catastrophic costs in affected households were 36% and 83%, respectively.
Patients’ primary needs for social protection were financial support to cover
costs related to income loss, transportation, and food supplements. The optimum
scenario, in which financial support would be provided for these three items,
would reduce the respective incidences of catastrophic costs in TB and MDR-
TB-affected households to 11% and 23%. The patients experiencing catastrophic
costs in this scenario would, however, have to pay high remaining costs (median
of USD 910; interquartile range [IQR] 662) in the TB group, and USD 2613;
[IQR 3442] in the MDR-TB group).
Conclusions:
Indonesia’s current level of social protection is not sufficient to mitigate the
socioeconomic impact of TB. Financial support for income loss, transportation
costs, and food-supplement costs will substantially reduce the incidence of
catastrophic costs, but financial support alone will not be sufficient to achieve
the target of 0% TB-affected households facing catastrophic costs. This would
require innovative social-protection policies and higher levels of domestic and
external funding.
Effect of financial support
91
Background
Poverty is closely related to tuberculosis (TB), both as a risk and as an effect.
People in low-income households not only have a higher risk of TB infection,
but once they are infected, the high costs associated with diagnosis and treatment
may reduce them to poverty.1,2 Although almost all countries provide drugs free
of charge to patients with susceptible TB and multidrug-resistant TB (MDR-TB),
TB patients still face high direct non-medical costs such as those for travel, food,
and nutritional supplements.3-5 Indonesia has the world’s third largest number of
estimated TB cases with the incidence of 842 000 (95% Confidence Interval [CI]
767 000 – 919 000) cases. Despite its free TB services, our recent study revealed
that the costs incurred during the treatment phase constituted more than three-
quarters of the total costs.6 These high costs can negatively affect treatment
adherence, clinical outcomes, and drop-out rates, thereby further increasing
future costs. The high costs also carry the risk of plunging TB patients and their
families into poverty, or into even deeper poverty for those already living in
poverty.7-11
In response to this socioeconomic burden, the World Health Organization’s
(WHO’s) End TB Strategy aims by 2020 to reduce to zero the percentage of TB-
affected families that face catastrophic costs. Catastrophic costs due to TB are
defined as the total costs – i.e., all direct and indirect costs, including income
loss — that exceed a specific threshold (e.g., 20%) of a household’s annual
incom.12 One obvious option for attaining this target is by providing adequate
social protection. In 2014, the Indonesian government started a national health
insurance scheme that covers all the medical costs – including those of TB
treatment – incurred in primary, secondary and tertiary healthcare. This scheme
has substantially reduced direct medical costs. However, direct medical costs are
not the only costs patients face in the trajectory from the pre-diagnostic phase to
treatment completion.4,13 In 2016, the previous study we conducted in Indonesia
showed that total costs consisted largely of direct non-medical costs and income
loss.6 As these are not covered by the health insurance scheme, TB patients are
still at a high risk of facing catastrophic costs. This highlights the importance of
providing additional financial protection to cover direct non-medical costs and
income loss.13

Chapter 6
92
There are three approaches to delivering additional social protection.14 The first
is the TB-specific approach, which offers protection only to TB patients or TB-
affected households, for example by providing food-supplements or travel
vouchers to those undergoing TB treatment in health facilities that are linked to
the network of the National Tuberculosis Program (NTP).14,15 The second, the
TB-inclusive approach, is a broader intervention in which TB patients or TB-
affected households are one of the inclusion criteria in a social-protection
program. The third, the TB-inclusive approach, involves protection policies that
do not explicitly include TB patients or TB-affected families in their eligibility
criteria but include TB risk-reduction strategies for groups at a high risk for TB
infection, such as general cash transfers and premium-free national health
insurance for people in poor households.
However, there is little evidence on the effectiveness of financial protection
(including cash transfers) in reducing the incidence of catastrophic costs due to
TB, particularly in TB high-burden countries (HBCs). Although recent studies
have shown that cash transfers could defray the costs endured by TB-affected
households,15,16 the transfers in question were either given conditionally (on the
basis of adherence to the intervention program), or were given on the basis of
published national average cost data rather than of patients’ actual needs. There
is limited evidence on the effect of social-protection schemes that take account
of patients’ needs and preferences.17
In this study we therefore aimed to measure the socioeconomic impact of TB and
MDR-TB (including the incidence of catastrophic costs), and to assess patients’
perceived needs for social protection in Indonesia. Additionally, to assess the
effects of financial support on the incidence of catastrophic costs due to TB and
MDR-TB in poor and non-poor households, we developed and ran hypothetical
scenarios in which patients were offered different combinations of financial
support.

Effect of financial support
93
Methods
Study design
To measure the socioeconomic impacts of TB and the perceived needs for social
protection, we interviewed TB and MDR-TB patients. For TB patients, we
applied stratified clustered sampling in three districts of Java, one representing
an urban area of Indonesia (Jakarta), one representing a suburban area (Depok),
and one representing a rural area (Tasikmalaya). In each district, we randomly
selected 5‒8 primary health centres (PHCs) that were linked with the Indonesian
NTP. Then, from July to September 2016, we selected consecutive TB patients
consecutive TB patients as they registered at these PHCs. Assuming that the
incidences of TB-affected household facing catastrophic costs were 20%
(urban), 25% (suburban) and 30% (rural), assuming a 1:1:1 ratio of TB incidence
in urban, suburban and rural district, and assuming a power of 0.80, we required
a minimum of 90 TB patients who met the inclusion criteria in each district. We
included adults aged 18 years or above who had been diagnosed with TB and
had either received TB treatment for at least one month or had finished the
treatment no more than one month previously. In this study, we focused on
pulmonary TB and excluded extra-pulmonary TB patients because of potentially
different seeking care pattern and costs. With regard to MDR-TB, we
interviewed adult patients who had been diagnosed on the basis of GeneXpert®
(Cepheid, Sunnyvale, CA, USA) or sputum culture and had been undergoing
treatment for at least one month in Persahabatan Hospital, an MDR-TB referral
hospital in Jakarta.
In both groups of patients, we assessed the following variables: the incidence of
catastrophic costs, the socioeconomic impacts of TB or MDR-TB, and patients’
perceived needs for social protection. On the basis of the needs assessment, we
then developed several scenarios for financial support. In each scenario, we
measured the reduction in the incidence of catastrophic costs after the
hypothetical provision of financial support.

Chapter 6
94
Socioeconomic impacts due to TB and MDR-TB
To measure the socioeconomic impacts of TB, we used the Tool to Estimate
Patient Costs,12,18 which we adapted to the Indonesian context, also translating it
to Indonesian Bahasa. We recruited ten medical students and public health
graduates as interviewers and trained them in the use of the adapted tool. The
socioeconomic impacts we studied the incidence of TB-affected households
facing catastrophic costs; patients’ perception of the their TB or MDR-TB is
having on their households’ financial capacity expressed on a scale of 1‒5, from
no problem to a very serious problem; coping strategy (loaning money or selling
property); job and income loss due to TB; and the proportional reduction in
patients’ and households’ income. Patient and household income loss were
calculated both in absolute terms (in United States dollars, USD) and in relative
terms (percentage of loss of previous income).
As well as collecting information on all types of cost (i.e., direct medical costs,
direct non-medical costs, and indirect costs) that had been incurred by the TB-
affected households in the period between the pre-diagnostic phase and treatment
completion, we also collected information on these households’ annual income.
Following the latest WHO protocol, we measured the incidence of catastrophic
costs (defined as total direct and indirect costs) that exceeded 20% of each TB-
affected household’s annual income [6,12]. Details of the methods we used to
calculate the incidence of catastrophic costs due to TB are provided in our
previous study.6
Perceived needs for social protection
To assess patients’ knowledge of social protection and their perceived needs for
additional social protection, we added three questions at the end of the adapted
tool: “Have you ever heard of social protection?”, followed by an open question:
“If yes, what is social protection? Can you explain it?”
Patients’ answers were grouped according to six types of social protection:
general government aid for the poor; government aid for healthcare; direct
government aid (general cash transfer); government aid for education:
government aid for transportation costs; and other government aid. A patient’s
Effect of financial support
95
inability to name or explain any type of social protection was defined as ‘did not
know’. These questions were important to our ability to assess patients’
knowledge before questioning them on their needs for social protection. After
obtaining the patients’ answers, the interviewers explained the definition of
social protection and gave examples of several types of social-protection
scheme.19 They then asked the patients whether they needed any social
protection, or additional protection if they already receiving.
Patients who stated that they needed social protection were asked to choose one
cost item they wanted to be covered, and its value in Indonesian Rupiahs (IDR).
These items comprised consultation fee per visit, transportation costs per visit,
food costs per visit, drug costs per month, income loss per month, and food-
supplement costs per month. Food-supplement costs were defined as a patient’s
monthly spending on nutritional or food supplements such as vitamins, fruits,
milk, meats, or other nutritional supplements that were consumed either with or
without a doctor’s TB-related recommendation [19]. After the patients’ answers
had been obtained, the cost items that needed to be covered were listed in order
of priority (from those that had been indicated most to those that had been
indicated least). The median (interquartile range [IQR]) of these cost items was
then calculated. In the scenarios that we developed, we then used the median
values of these cost items as the value of financial support.
Effects of financial support
On the basis of the needs assessment, we selected the three cost items that
patients chose, and then developed several hypothetical scenarios for financial
support. These comprised the following: no provision of a cash transfer
(baseline); the provision of a cash transfer to cover a single cost item (i.e., income
loss, transportation costs, or food-supplementation); and the provision of a cash
transfer to cover a combination of two or three cost items. In total, we developed
eight such scenarios. As well as the baseline scenario (no cash transfers; Scenario
I), we formulated seven hypothetical cash-transfer scenarios for the following:
(II) transportation costs for all patients, (III) food-supplement costs for all
patients, (IV) income loss for patients who had lost their jobs, (V) income loss
for patients who lost their income whether or not they had lost their jobs, (VI) a

Chapter 6
96
combination of transportation costs and income loss, (VII) a combination of
food-supplement costs and income loss, and (VIII) a combination of
transportation costs, food-supplement costs, and income loss.
We simulated the hypothetical scenarios in the people who had been included in
this study, assuming that the cash transfers had been made after patients had
started TB or MDR-TB treatment. The value of the cash transfer (𝐶𝑇) for
specific cost items was extrapolated to a complete treatment period (denoted
𝐶𝑇 𝐶𝐼, ℎ
𝑖 in which 𝐶𝐼 identifies a specific cost item, 𝑖 identifies the patient, and
ℎ identifies his/her household). For transportation costs, the total cash transfer
was calculated by multiplying 𝐶𝑇 by the number of PHC or hospital visits during
the intensive phase 𝑉 𝐼𝑃𝑖
and continuation phase 𝑉 𝐶𝑃
𝑖 until the expected end date
of treatment. For income loss and food-supplement costs, the total value of the
cash transfer was calculated by multiplying 𝐶𝑇 by the duration (in months) of
the patients’ complete treatment, 𝑀.
Box 1 Cash-transfers formula
𝑇𝑜𝑡𝑎𝑙 𝐶𝑇 𝑡𝑟𝑎𝑛𝑠𝑝𝑜𝑟𝑡𝑎𝑡𝑖𝑜𝑛 = ∑((𝐶𝑇𝑖𝐶𝐼,ℎ𝑥 𝑉𝑖
𝐼𝑃) + (𝐶𝑇𝑖𝐶𝐼,ℎ𝑥 𝑉𝑖
𝐶𝑃))
𝑛
𝑖=1
𝑇𝑜𝑡𝑎𝑙 𝐶𝑇 𝑖𝑛𝑐𝑜𝑚𝑒 𝑙𝑜𝑠𝑠 = ∑(𝐶𝑇𝑖𝐶𝐼,ℎ𝑥 𝑀)
𝑛
𝑖=1
𝑇𝑜𝑡𝑎𝑙 𝐶𝑇 𝑓𝑜𝑜𝑑 𝑠𝑢𝑝𝑝𝑙𝑒𝑚𝑒𝑛𝑡 = ∑(𝐶𝑇𝑖𝐶𝐼,ℎ𝑥 𝑀)
𝑛
𝑖=1
Total costs were defined as the sum of all types of cost, including out-of-pocket
payments (OOPs) for medical diagnosis and treatment (OOPM); OOPs for non-
medical expenditures (OOPNM); and patients’ and guardians’ income losses
(IN). After calculating the total simulated costs after the cash transfer (total costs
for TB-related services minus the total cash transfer), we estimated the incidence
of catastrophic costs after the cash transfer in each scenario. To define
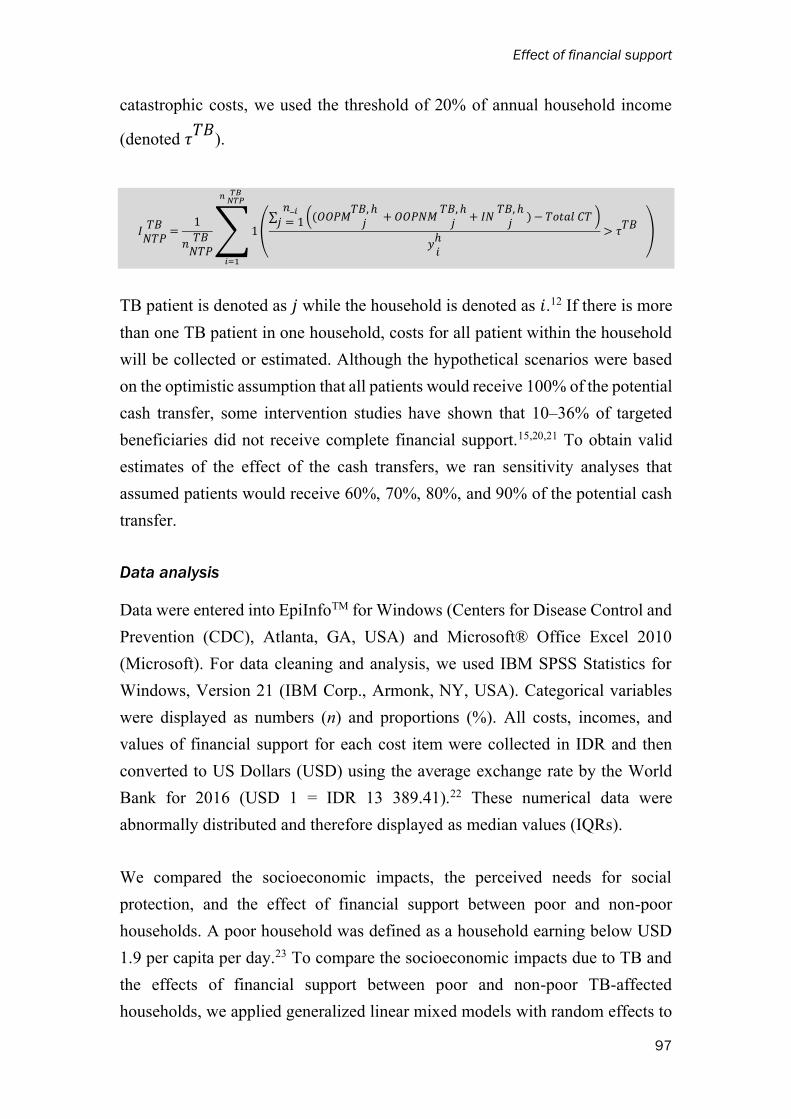
Effect of financial support
97
catastrophic costs, we used the threshold of 20% of annual household income
(denoted 𝜏𝑇𝐵
).
𝐼𝑇𝐵
𝑁𝑇𝑃=
1
𝑛𝑇𝐵
𝑁𝑇𝑃
∑ 1 (∑
𝑛_𝑖
𝑗 = 1 ((𝑂𝑂𝑃𝑀𝑇𝐵, ℎ
𝑗 + 𝑂𝑂𝑃𝑁𝑀
𝑇𝐵, ℎ𝑗
+ 𝐼𝑁 𝑇𝐵, ℎ
𝑗 ) − 𝑇𝑜𝑡𝑎𝑙 𝐶𝑇 )
𝑦ℎ𝑖
> 𝜏𝑇𝐵
)
𝑛 𝑇𝐵𝑁𝑇𝑃
𝑖=1
TB patient is denoted as 𝑗 while the household is denoted as 𝑖.12 If there is more
than one TB patient in one household, costs for all patient within the household
will be collected or estimated. Although the hypothetical scenarios were based
on the optimistic assumption that all patients would receive 100% of the potential
cash transfer, some intervention studies have shown that 10‒36% of targeted
beneficiaries did not receive complete financial support.15,20,21 To obtain valid
estimates of the effect of the cash transfers, we ran sensitivity analyses that
assumed patients would receive 60%, 70%, 80%, and 90% of the potential cash
transfer.
Data analysis
Data were entered into EpiInfoTM for Windows (Centers for Disease Control and
Prevention (CDC), Atlanta, GA, USA) and Microsoft® Office Excel 2010
(Microsoft). For data cleaning and analysis, we used IBM SPSS Statistics for
Windows, Version 21 (IBM Corp., Armonk, NY, USA). Categorical variables
were displayed as numbers (n) and proportions (%). All costs, incomes, and
values of financial support for each cost item were collected in IDR and then
converted to US Dollars (USD) using the average exchange rate by the World
Bank for 2016 (USD 1 = IDR 13 389.41).22 These numerical data were
abnormally distributed and therefore displayed as median values (IQRs).
We compared the socioeconomic impacts, the perceived needs for social
protection, and the effect of financial support between poor and non-poor
households. A poor household was defined as a household earning below USD
1.9 per capita per day.23 To compare the socioeconomic impacts due to TB and
the effects of financial support between poor and non-poor TB-affected
households, we applied generalized linear mixed models with random effects to
Chapter 6
98
adjust for a cluster sampling design (19 PHCs). For the MDR-TB group, we used
chi-square, Fisher, and Mann-Whitney tests to analyze the impacts between poor
and non-poor households. To compare the effects of financial support between
scenarios, we used McNemar tests with stratification for cluster sampling for TB
(19 PHCs), and without stratification for MDR-TB. For each scenario we used
bootstrapping for internal validations of the incidence of catastrophic costs after
cash transfer and the average budget per patient required in each scenario
(N=1000). The difference was considered statistically significant if P-value was
below than 0.05.
Ethical statement
Ethical clearances for this study were obtained from the Ethical Committee at
the Faculty of Medicine of Universitas Indonesia–Cipto Mangunkusumo
Hospital, Jakarta Indonesia (No. 416/UN2.F1/ETIK/VI/2016) and the Ethical
Committee at Persahabatan Hospital, Jakarta, Indonesia (No.
DL.01.03/II.3/3817/2016). We provided written and oral explanations to patients
before their decision to sign the informed-consent form.
Results
In total, we analysed the data for 282 TB and 64 MDR-TB patients. The details
of patients’ characteristics are provided in our previous study on catastrophic
costs due to TB.6
Socioeconomic impacts of TB or MDR-TB
The incidence of catastrophic costs due to TB was high, and was significantly
higher among MDR-TB-affected households (83%) than among TB-affected
ones (36%, P < 0.001). Most MDR-TB patients (78%) perceived that TB created
moderate to severe problems for the financial capacity of their household. This
proportion was lower among TB patients (48%; P-value for the difference
between MDR-TB and TB patients = 0.009). These financial problems led more

Effect of financial support
99
MDR-TB patients than TB patients to loan money (50% vs 32%, P = 0.042) and
to sell property (28% vs 12%, P = 0.008) (see Table 1).
Among TB-affected households, poor households suffered much more than non-poor
households: they had a higher incidence of catastrophic costs (43% vs 25%, P = 0.006)
and a higher proportion of patients who loaned money (38% vs 22%, P = 0.014) and
sold property (15% vs 6%, P = 0.029). A more substantial proportion also suffered from
moderate to severe financial problems (54% vs 38%, P = 0.030). Conversely, in MDR-
TB-affected households, these economic impacts did not differ significantly between
poor and non-poor households.
Before diagnosis, more than three-quarters of all patients had an income-earning job.
Among them, TB and MDR-TB caused a high rate of job loss, which was higher in
MDR-TB patients than in TB patients (69% vs 32%, P = 0.001). In addition to job loss,
TB also caused income loss: although some patients maintained their jobs after
diagnosis, their income decreased. The proportion of patients who lost income was
much higher than the proportion who experienced job loss, and was higher among
MDR-TB patients than among TB patients (86% vs 61%, P = 0.011).
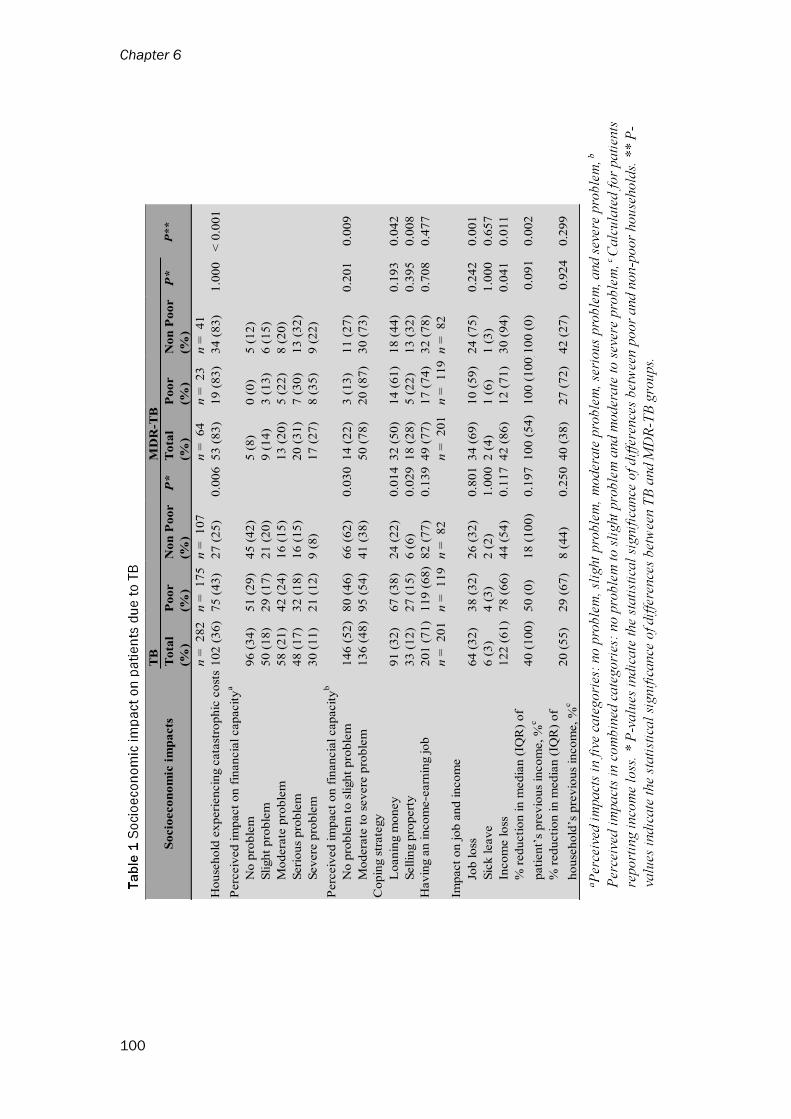
Chapter 6
100
To
tal
(%)
Po
or
(%)
No
n P
oo
r
(%)
P*
To
tal
(%)
Po
or
(%)
No
n P
oo
r
(%)
P*
n =
282
n =
175
n =
107
n =
64
n =
23
n =
41
102 (
36)
75 (
43)
27 (
25)
0.0
06
53 (
83)
19 (
83)
34 (
83)
1.0
00
< 0
.00
1
No
pro
ble
m96 (
34)
51 (
29)
45 (
42)
5 (
8)
0 (
0)
5 (
12)
Sligh
t p
roble
m50 (
18)
29 (
17)
21 (
20)
9 (
14)
3 (
13)
6 (
15)
Mo
dera
te p
roble
m58 (
21)
42 (
24)
16 (
15)
13 (
20)
5 (
22)
8 (
20)
Seri
ou
s p
roble
m48 (
17)
32 (
18)
16 (
15)
20 (
31)
7 (
30)
13 (
32)
Sev
ere
pro
ble
m30 (
11)
21 (
12)
9 (
8)
17 (
27)
8 (
35)
9 (
22)
No
pro
ble
m t
o s
ligh
t p
roble
m146 (
52)
80 (
46)
66 (
62)
0.0
30
14 (
22)
3 (
13)
11 (
27)
0.2
01
0.0
09
Mo
dera
te t
o s
ev
ere
pro
ble
m136 (
48)
95 (
54)
41 (
38)
50 (
78)
20 (
87)
30 (
73)
Lo
an
ing m
on
ey
91 (
32)
67 (
38)
24 (
22)
0.0
14
32 (
50)
14 (
61)
18 (
44)
0.1
93
0.0
42
Sellin
g p
ropert
y33 (
12)
27 (
15)
6 (
6)
0.0
29
18 (
28)
5 (
22)
13 (
32)
0.3
95
0.0
08
201 (
71)
119 (
68)
82 (
77)
0.1
39
49 (
77)
17 (
74)
32 (
78)
0.7
08
0.4
77
n =
201
n =
119
n =
82
n =
201
n =
119
n =
82
Job
lo
ss64 (
32)
38 (
32)
26 (
32)
0.8
01
34 (
69)
10 (
59)
24 (
75)
0.2
42
0.0
01
Sic
k leav
e6 (
3)
4 (
3)
2 (
2)
1.0
00
2 (
4)
1 (
6)
1 (
3)
1.0
00
0.6
57
Inco
me lo
ss122 (
61)
78 (
66)
44 (
54)
0.1
17
42 (
86)
12 (
71)
30 (
94)
0.0
41
0.0
11
% r
ed
ucti
on
in
med
ian
(IQ
R)
of
pati
en
t’s
pre
vio
us
inco
me,
%c
40 (
100)
50 (
0)
18 (
100)
0.1
97
100 (
54)
100 (
100)1
00 (
0)
0.0
91
0.0
02
% r
ed
ucti
on
in
med
ian
(IQ
R)
of
ho
use
ho
ld’s
pre
vio
us
inco
me,
%c
20 (
55)
29 (
67)
8 (
44)
0.2
50
40 (
38)
27 (
72)
42 (
27)
0.9
24
0.2
99
P*
*
MD
R-T
BT
B
Imp
act
on
jo
b a
nd
in
co
me
Co
pin
g s
trate
gy
Hav
ing a
n in
co
me-e
arn
ing jo
b
Perc
eiv
ed
im
pact
on
fin
an
cia
l cap
acit
yb
Ho
use
ho
ld e
xp
eri
en
cin
g c
ata
stro
phic
co
sts
Perc
eiv
ed
im
pact
on
fin
an
cia
l cap
acit
ya
So
cio
eco
no
mic
im
pa
cts
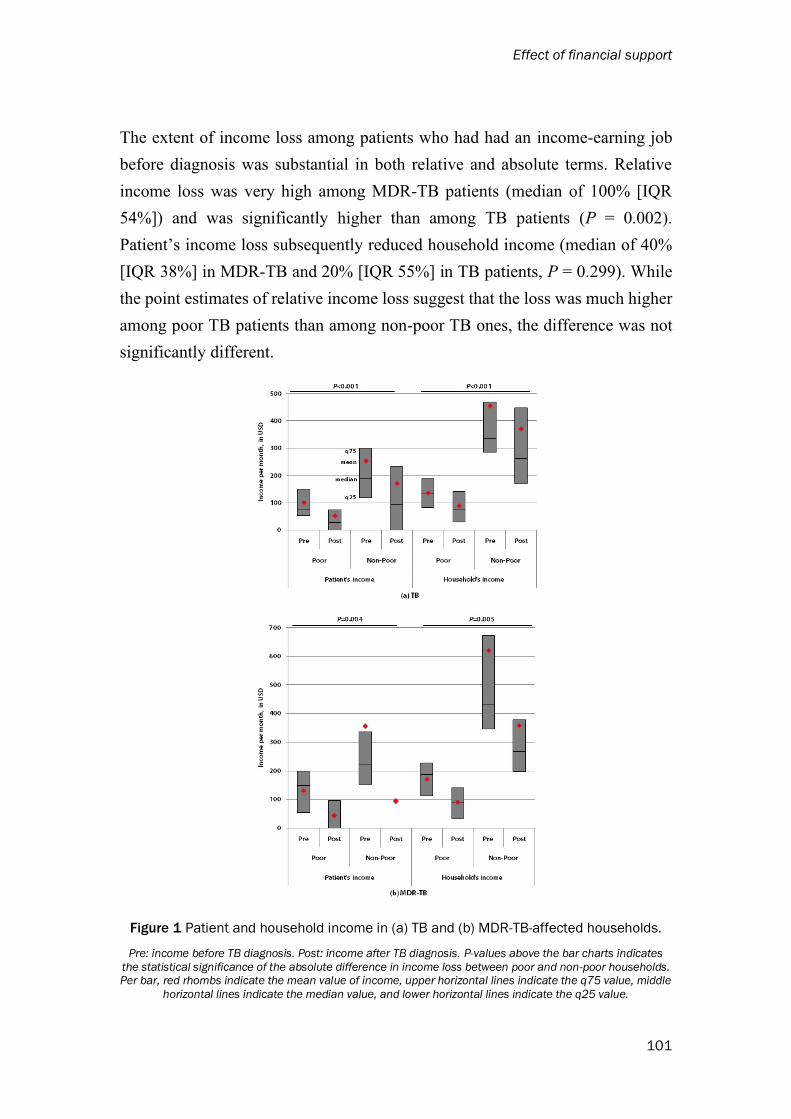
Effect of financial support
101
The extent of income loss among patients who had had an income-earning job
before diagnosis was substantial in both relative and absolute terms. Relative
income loss was very high among MDR-TB patients (median of 100% [IQR
54%]) and was significantly higher than among TB patients (P = 0.002).
Patient’s income loss subsequently reduced household income (median of 40%
[IQR 38%] in MDR-TB and 20% [IQR 55%] in TB patients, P = 0.299). While
the point estimates of relative income loss suggest that the loss was much higher
among poor TB patients than among non-poor TB ones, the difference was not
significantly different.
Figure 1 Patient and household income in (a) TB and (b) MDR-TB-affected households.
Pre: income before TB diagnosis. Post: income after TB diagnosis. P-values above the bar charts indicates
the statistical significance of the absolute difference in income loss between poor and non-poor households. Per bar, red rhombs indicate the mean value of income, upper horizontal lines indicate the q75 value, middle
horizontal lines indicate the median value, and lower horizontal lines indicate the q25 value.

Chapter 6
102
Absolute loss (in USD) in patient’s monthly income was higher in non-poor
households than in poor households, both in the TB (P-value for difference poor
and non-poor: < 0.001) and MDR-TB group (P = 0.004) (Figure 1). Household
income loss was also greater in non-poor households than in poor households,
both in the TB (P < 0.001) and MDR-TB group (P = 0.005).
Patients’ perceived needs for social protection
Most patients (84% of TB patients and 80% of MDR-TB patients) did not know
existing social-protection schemes (Table 2). Even 81% of patients who had
health insurance did not know what social protection was and were unable to
name existing social-protection schemes. Knowledge of existing schemes did not
differ significantly between TB and MDR-TB patients (P = 0.794), or between
those with and without health insurance (P = 0.112). The forms of social
protection that were most commonly named by those who knew of such schemes
were government aid for poor people (in general) and government aid for
healthcare.
Table 2 TB and MDR-TB patients’ knowledge of social-protection schemes
Knowledge of existing social-
protection scheme
Type of TB P
Having
insurance P
TB
n (%)
MDR-TB
n (%)
Yes
n (%)
No
n (%)
Did not know what social
protection was
236
(84) 51 (80) 0.794
187
(81) 100 (88) 0.112
Knew and could name the
following social-protection
schemes: 46 (16) 13 (20) 45 (19) 14 (12)
Government aid for poor
people (in general) 19 (7) 4 (6) 19 (8) 4 (4)
Government aid for
healthcare 13 (5) 2 (3) 11 (5) 4 (4)
Direct government aid, cash
transfer a 11 (4) 1 (2) 9 (4) 3 (3)
Government aid for
transportation costs 0 (0) 3 (5) 3 (1) 0 (0)
Government aid for education 1 (0) 2 (3) 2 (1) 1 (1) Other government aid 0 (0) 1 (2) 0 (0) 1 (1)
a known as Bantuan Langsung Tunai in Indonesian Bahasa

Effect of financial support
103
After it had been explained what social protection was, most patients perceived
that they needed social protection. The perceived need was higher among MDR-
TB patients than among TB patients (95% vs 73%, P = 0.004). Perceived need
did not differ significantly between poor and non-poor patients in either the TB
group (75% vs 70%, P = 0.334) or the MDR-TB group (100% vs 93%, P =
0.547).
TB and MDR-TB patients all indicated that the three cost items that most needed
to be covered were income loss (indicated by 24% of TB patients and 34% of
MDR-TB patients); transportation costs (19% and 42%); and costs for food
supplements (15% and 8%) (Table 3). Patients who reported that they required
financial support were asked about the value of support they needed. As the wide
interquartile ranges show, the value of financial support required varied strongly
per cost item. MDR-TB patients perceived a need for a much higher value of
financial support per month for their income loss than TB patients (median of
USD 205 [IQR 121] vs USD 75 (IQR 112), P < 0.001). However, with regard to
transportation costs per treatment visit and food-supplement costs per month, the
values of the financial support required did not differ between the groups.
Among MDR-TB patients, the values of the financial support needed did not
differ between poor and non-poor households. But in the TB group, non-poor
households perceived a need for a slightly higher value of financial support for
income loss, transportation, and food supplements (P < 0.001).
The needs perceived by patients who indicated that they needed financial support
were compared with the actual costs incurred by all patients. For income loss,
we compared the value of perceived needs with the actual income loss suffered
by (a) patients who had experienced job loss after diagnosis and (b) patients who
had experienced any income loss due to TB regardless of whether or not they
had experienced job loss. Among TB patients, the median value of the perceived
need for financial support to cover income loss was lower than the actual costs.
Conversely, among MDR-TB patients, the perceived value of financial support
was higher than their actual costs. For transportation and food-supplement costs,
we compared the value of perceived needs with the costs actually incurred by all
patients. The values of financial support needed for these two cost items among
patients who expressed the need for support were higher than the actual median
costs among all patients.
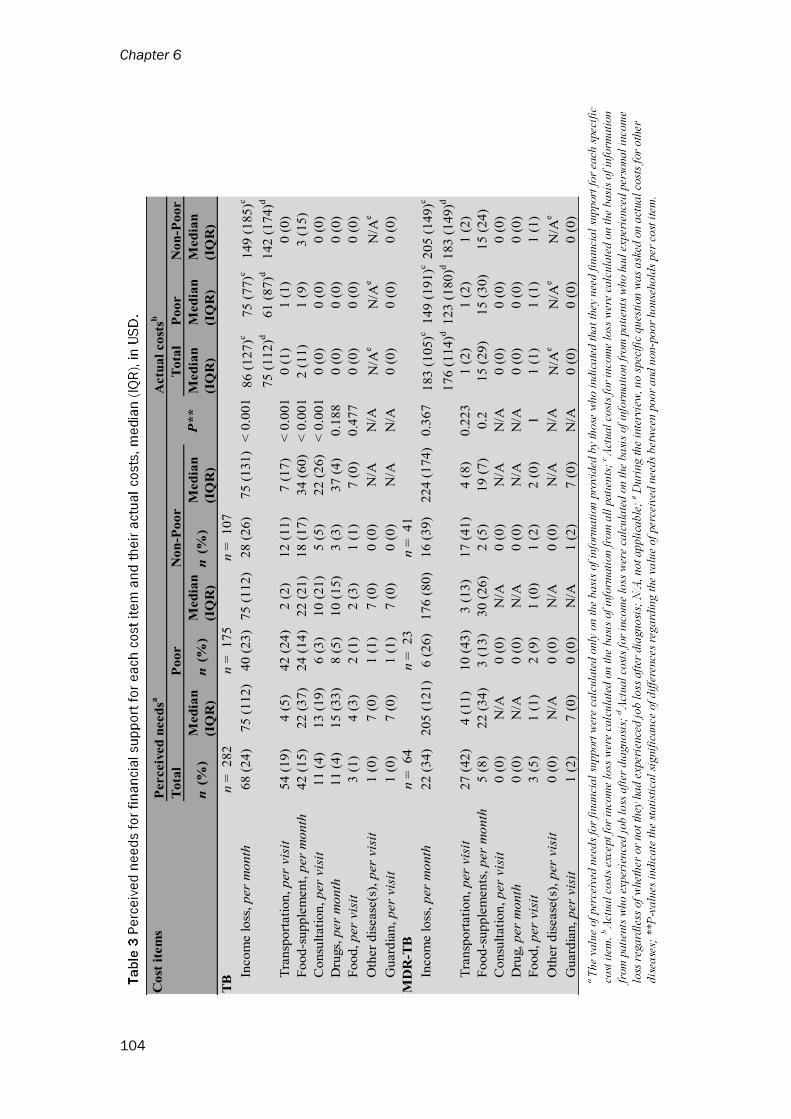
Chapter 6
104
C
ost
ite
ms
Perceiv
ed
need
saA
ctu
al
co
stsb
To
tal
Po
or
No
n-P
oo
rT
ota
lP
oo
rN
on
-Po
or
n (
%)
Med
ian
(IQ
R)
n (
%)
Med
ian
(IQ
R)
n (
%)
Med
ian
(IQ
R)
Med
ian
(IQ
R)
Med
ian
(IQ
R)
Med
ian
(IQ
R)
TB
n =
282
n =
175
n =
107
Inco
me lo
ss,
per
mo
nth
68 (
24)
75 (
112)
40 (
23)
75 (
112)
28 (
26)
75 (
131)
< 0
.00
186 (
127)c
75 (
77)c
149 (
185)c
75 (
112)d
61 (
87)d
142 (
174)d
Tra
nsp
ort
ati
on
, p
er
vis
it
54 (
19)
4 (
5)
42 (
24)
2 (
2)
12 (
11)
7 (
17)
< 0
.00
10 (
1)
1 (
1)
0 (
0)
Fo
od-s
up
ple
men
t, p
er
mo
nth
42 (
15)
22 (
37)
24 (
14)
22 (
21)
18 (
17)
34 (
60)
< 0
.00
12 (
11)
1 (
9)
3 (
15)
Co
nsu
ltati
on
, p
er
vis
it11 (
4)
13 (
19)
6 (
3)
10 (
21)
5 (
5)
22 (
26)
< 0
.00
10 (
0)
0 (
0)
0 (
0)
Dru
gs,
per
mo
nth
11 (
4)
15 (
33)
8 (
5)
10 (
15)
3 (
3)
37 (
4)
0.1
88
0 (
0)
0 (
0)
0 (
0)
Fo
od,
per
vis
it
3 (
1)
4 (
3)
2 (
1)
2 (
3)
1 (
1)
7 (
0)
0.4
77
0 (
0)
0 (
0)
0 (
0)
Oth
er
dis
ease
(s),
per
vis
it1 (
0)
7 (
0)
1 (
1)
7 (
0)
0 (
0)
N/A
N/A
N/A
eN
/Ae
N/A
e
Gu
ard
ian
, p
er
vis
it1 (
0)
7 (
0)
1 (
1)
7 (
0)
0 (
0)
N/A
N/A
0 (
0)
0 (
0)
0 (
0)
MD
R-T
Bn =
64
n =
23
n =
41
Inco
me lo
ss,
per
mo
nth
22 (
34)
205 (
121)
6 (
26)
176 (
80)
16 (
39)
224 (
174)
0.3
67
183 (
105)c
149 (
191)c
205 (
149)c
176 (
114)d
123 (
180)d
183 (
149)d
Tra
nsp
ort
ati
on
, p
er
vis
it
27 (
42)
4 (
11)
10 (
43)
3 (
13)
17 (
41)
4 (
8)
0.2
23
1 (
2)
1 (
2)
1 (
2)
Fo
od-s
up
ple
men
ts,
per
mo
nth
5 (
8)
22 (
34)
3 (
13)
30 (
26)
2 (
5)
19 (
7)
0.2
15 (
29)
15 (
30)
15 (
24)
Co
nsu
ltati
on
, p
er
vis
it0 (
0)
N/A
0 (
0)
N/A
0 (
0)
N/A
N/A
0 (
0)
0 (
0)
0 (
0)
Dru
g,
per
mo
nth
0 (
0)
N/A
0 (
0)
N/A
0 (
0)
N/A
N/A
0 (
0)
0 (
0)
0 (
0)
Fo
od,
per
vis
it
3 (
5)
1 (
1)
2 (
9)
1 (
0)
1 (
2)
2 (
0)
11 (
1)
1 (
1)
1 (
1)
Oth
er
dis
ease
(s),
per
vis
it0 (
0)
N/A
0 (
0)
N/A
0 (
0)
N/A
N/A
N/A
eN
/Ae
N/A
e
Gu
ard
ian
, p
er
vis
it1 (
2)
7 (
0)
0 (
0)
N/A
1 (
2)
7 (
0)
N/A
0 (
0)
0 (
0)
0 (
0)
P*
*
Effect of financial support
105
Effect of financial support on the incidence of catastrophic costs
In our simulated scenarios, we used the median values of the financial support required
(see Table 3) to determine the value of cash transfers. The value of the cash transfer for
transportation costs used in the simulations was USD 4 per visit. Due to differences in
the number of visits per month, this suggests that the hypothetical monthly transfer for
transportation costs would vary according to treatment regimen and treatment phase
(intensive and continuation phase). For TB patients undergoing Category I treatment,
the average number of visits was 4 visit per month during intensive phase and one visit
per month during continuation phase. These resulted in the average value of the monthly
cash transfer of USD 16 in the intensive phase and USD 4 in the continuation phase.
For TB patients undergoing Category II treatment, with daily visit during intensive
phase, the average value of the monthly cash transfer would be USD 120 in the intensive
phase and USD 4 in the continuation phase. For MDR-TB patients, the average value
of the monthly cash transfer for transportation would be USD 120 in both the intensive
and continuation phases. The value of the cash transfer used in the simulations for food
supplements was USD 22 per month, both for TB and MDR-TB patients. For income
loss, the value of the cash transfer used in the simulations was USD 75 per month for
TB patients and USD 205 per month for MDR-TB patients.
If TB-affected households were given support for transportation, food supplements and
income loss (Scenario VIII), the incidence of catastrophic costs would be reduced by
25 percentage points, from 36% to 11% (Table 4). This scenario would have the greatest
effects on reducing the incidence of catastrophic costs than any other scenario, reducing
it by 17 percentage points if patients received only 60% of the potential cash transfer
(Annex F). In this scenario, total median costs for TB patients would be reduced from
USD 133 (IQR 522) to USD 0 (IQR 106) (results not reported in the table). Even so,
catastrophic costs would still be faced by 11% of TB-affected households (95%
confidence interval [CI] 8‒15%). Among TB patients who still faced catastrophic costs
after cash transfer, the total median costs would be reduced from USD 1527 (IQR 1023)
to USD 910 (IQR 662).
Although having lower effects than Scenario VIII, cash-transfer modalities for two cost
items (Scenarios VI and VII) would substantially reduce the incidence of catastrophic
costs: between these two scenarios, there was no significant difference (Annex G). Of
the cash-transfer modalities that would provide support for one cost item, Scenario V

Chapter 6
106
would provide the most substantial effect. Other modalities of providing support for one
cost item (Scenarios II-IV) would provide much smaller effects than Scenario VIII (P
< 0.001). Between Scenarios II-IV, there were no significant differences.
Table 4 The incidence of catastrophic costs in eight hypothetical scenarios
Simulated hypothetical scenario
Incidence of
catastrophic costs
Average budget per
patient for full
duration of
treatment, in USD
% (95% CI) Mean (95% CI)
TB
I Baseline (no cash transfer) 36 (31‒42) -
II Transportation costs 28 (23‒33) 114 (100‒127)
III Food-supplement costs 26 (21‒30) 143 (141‒145)
IV Income lossa 26 (21‒30) 110 (88‒134)
V Income lossb 17 (13‒21) 210 (183‒236)
VI Transportation costs and income loss 17 (13‒22) 224 (197‒253)
VII Food-supplement costs and income loss 16 (12‒20) 253 (231‒278)
VIII Transportation, food supplement, and income
loss 11 (8‒15) 367 (338‒398)
MDR-TB
I Baseline (no cash transfer) 83 (73‒92) -
II Transportation costs 59 (47‒71) 1337 (1327‒1344)
III Food-supplement costs 77 (65‒87) 269 (269‒269)
IV Income lossa 58 (46‒70) 1309 (1010‒1617)
V Income lossb 52 (39‒65) 1617 (1338‒1899)
VI Transportation costs and income loss 28 (18‒40) 2647 (2351‒2958)
VII Food-supplement costs and income loss 53 (41‒66) 1578 (1279‒1886)
VIII Transportation, food supplement, and income
loss 23 (13‒35) 2916 (2620‒3227)
aThe hypothetical cash transfer was assumed to have been delivered to TB patients who had experienced job
loss, bThe hypothetical cash transfer was assumed to have been delivered to TB patients who had experienced
any income loss regardless of whether or not they had experienced job loss.
In the MDR-TB group, cash transfers for transportation, food supplements and income
loss (Scenario VIII) would reduce the incidence of catastrophic costs by 60 percentage
points, from 83% to 23%. Of all the scenarios, Scenario VIII would have the greatest
effect on reducing the incidence of catastrophic costs. Under Scenario VIII, median total
costs for MDR-TB patients would decrease from USD 2804 (IQR 3317) to USD 0 (IQR
801). Twenty-three percent of MDR-TB-affected households would nonetheless face
catastrophic costs after the transfer (95% CI: 13‒35%). Under the same scenario,

Effect of financial support
107
median total costs for MDR-TB patients who still faced catastrophic costs after cash
transfer would be reduced from USD 5606 (IQR 4430) to USD 2613 (IQR 3442).
Using the above cash-transfer values for each scenario, we estimated the average budget
required per patient for the full duration of treatment under a social-protection program
(Table 4, Figure 3) Scenario VIII would produce the most significant effect, but would
also require the highest average budget per patient. For the MDR-TB group, the effect
and the average budget of Scenario VI were only slightly smaller than those of Scenario
VIII. Other scenarios would produce a much lower effect for a much lower average
budget.
Figure 2 The incidence of catastrophic costs in poor and non-poor households in (a) TB and (b)
MDR-TB-affected households. P-values indicate the differences per scenario between poor and
non-poor households.
In the TB group, cash transfers would reduce the incidence of catastrophic costs to a
much greater extent in poor households than in non-poor households (Figure 2). In
Scenarios V-VIII, the gap between poor and non-poor households would disappear. A
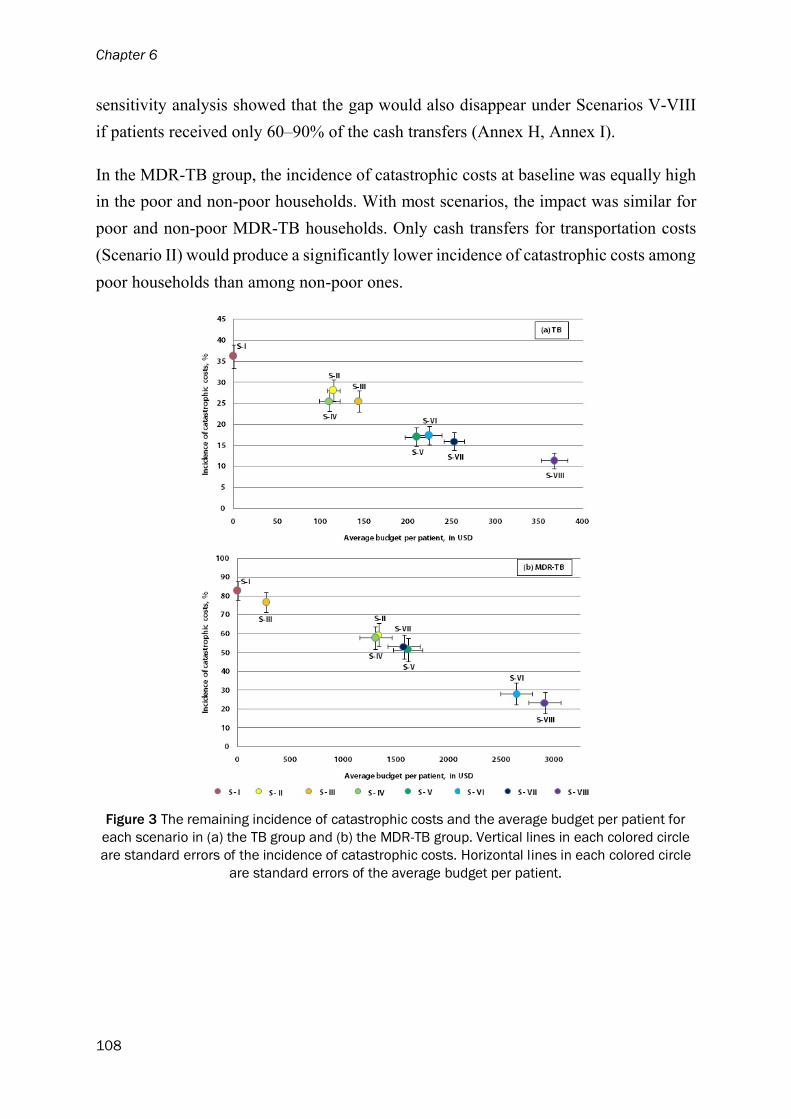
Chapter 6
108
sensitivity analysis showed that the gap would also disappear under Scenarios V-VIII
if patients received only 60‒90% of the cash transfers (Annex H, Annex I).
In the MDR-TB group, the incidence of catastrophic costs at baseline was equally high
in the poor and non-poor households. With most scenarios, the impact was similar for
poor and non-poor MDR-TB households. Only cash transfers for transportation costs
(Scenario II) would produce a significantly lower incidence of catastrophic costs among
poor households than among non-poor ones.
Figure 3 The remaining incidence of catastrophic costs and the average budget per patient for
each scenario in (a) the TB group and (b) the MDR-TB group. Vertical lines in each colored circle
are standard errors of the incidence of catastrophic costs. Horizontal lines in each colored circle
are standard errors of the average budget per patient.
Effect of financial support
109
Discussion
Our results suggest that current levels of social protection in Indonesia are not enough
to mitigate the socioeconomic impacts of TB, which include a high incidence of
catastrophic costs, high rates of job and income loss, and a high proportion of patients
who have to borrow money and sell their property. Due to these enormous impacts, TB
patients urgently need social protection, mainly to cover the three costs they had
indicated as most important: income loss, transportation costs, and food-supplement
costs. In our simulations, the incidences of catastrophic costs were substantially reduced
by a hypothetical scenario (Scenario VIII) that provided financial support for these three
cost items. Nevertheless, a financial support system in which patients received fixed
amounts of money for income loss, transport and food-supplement costs would not be
able to reduce the incidence of catastrophic costs to zero percent, the target set by the
WHO.
Our findings suggest that future policies should not rely on cash transfers for only one
cost item. Although cash transfers to cover patient income loss can make a substantial
contribution to reducing catastrophic costs, a single cash transfer of the sort examined
in our study would not be enough to eliminate catastrophic costs. The existing types of
support that patients may currently receive are equally inadequate; these mainly cover
direct non-medical costs, such as food or nutritional supplement packages and travel
vouchers from either government or international donors.21,24,25 The impacts of financial
support would be greater if cash transfers were provided for a combination of income
loss, travel costs, and food-supplement costs.
Despite their substantial impact on reducing catastrophic costs, the cash transfers in our
scenarios would not be enough to achieve the WHO’s target of zero percent of
households facing catastrophic costs. This failure is likely to be due to the high
variability of costs between patients, and particularly of the cost due to income loss,
which was the greatest component of the total costs incurred due to TB. Actual monthly
income losses were also higher than the cash transfers simulated in our hypothetical
scenarios. For example, while the transfer was set at USD 75 per month, actual median
monthly income loss among TB patients who experienced job loss was USD 75 (IQR
77) for poor patients, and USD 149 (IQR 185) for non-poor patients.

Chapter 6
110
As actual costs and the perceived needs for financial support vary greatly between
patients, it is difficult to determine the value of any cash transfer to be delivered. We
based the value of cash transfers on the median value of patients’ perceived needs.
Although the median value of cash transfer to cover transportation and food-supplement
costs was higher than the median value of their actual costs, the actual value of transport
and food supplements latter was sometimes higher than the cash transfer. The transfer
in these cases did not cover the actual costs. However, the cash transfers simulated in
our study would increase the NTP budget per capita by between approximately 46%
(Scenario II) and 148% (Scenario VIII) for TB patients, and by between approximately
8% (Scenario II) and 20% (Scenario VIII) for MDR-TB patients.26 While increasing the
value of the cash transfers might be effective in terms of further reducing catastrophic
costs, its affordability and sustainability should be carefully considered.
A way of reducing the incidence of catastrophic costs more effectively might be to
target the financial support to those patients most likely to experience catastrophic
expenditures. The targeting system could differ between settings, and could use various
criteria to identify patients who need financial support.14 Such criteria might include the
determinants of catastrophic costs, such as household poverty level, job status before
and after diagnosis, breadwinner status in the family, having had previous TB treatment,
and experiencing adverse effects.6 The disadvantages of such an approach would
include the risks of greater stigmatization and of the greater bureaucracy needed to
manage the targeting system, and may also prompt patients to pretend to remain sick in
order to keep their entitlement to financial support.14,24
Our findings stress that the WHO’s target of eliminating the incidence of catastrophic
costs requires innovations in social-protection programs. If this objective is to be
attained, a combination of strategies will be required to reduce the costs patients incur
in the trajectory between the pre-diagnostic phase and the end of treatment. To reduce
medical costs in the pre-diagnostic and diagnostic phases, TB service delivery under
the NTP – which currently provides free TB treatment in NTP-linked health services
only after diagnosis – should be fully integrated into the national health insurance
scheme. In turn, such integration would speed up diagnostic procedures and improve
access to TB treatment, possibly reducing transport costs and potentially even income
loss. However, as the proportion of costs incurred in this phase is much smaller than the
proportion of costs in the treatment phase,6 the strategy would have limited impact on

Effect of financial support
111
total cost reduction. The strategy should therefore be combined with strategies for
preventing socioeconomic impacts in the treatment phase of TB.
Since income loss was the greatest cost in the treatment phase, income loss must be
limited by preventing unnecessary job loss. In the formal sector, this could be done by
strengthening job-security policies so as to avoid the dismissal of workers with TB and
MDR-TB. In the informal sector, resolving the problem of income loss would be more
of a challenge. Whatever the case, it is important to design a legal framework that
provides additional social protection, not only to compensate patient’s income loss, but
also to prevent further severe TB-related socioeconomic impact by ensuring that
patients are covered by national health insurance, .
Another possible way of reducing treatment costs is to shorten the TB treatment
period.15,27 The development of a new TB drug regimen with a shorter treatment period
is currently being evaluated.28 Positive evidence that this shorter period is just as cost-
effective would allow a reduction in direct non-medical costs and, as a result, a
reduction in the likelihood of catastrophic cost.29 For patients with MDR-TB, a possible
way of reducing transportation costs and possible income loss is to increase the number
of MDR-TB drug-delivery centres.
Unfortunately, the strategies for eliminating catastrophic costs named above would
require considerable resources, while most of the TB high-burden countries are low- to
middle-income countries with limited resources for social-protection policies.3 If global
action to combat TB does not become more innovative and is not given more funding,
such countries will be left with very little chance of attaining the target stipulated in the
WHO’s 2020 and 2025 milestones of zero percent of families that face catastrophic
costs.
The limitations of this study fall into two main categories. First, we enrolled only TB
and MDR-TB patients who had been treated in public health services, and thus not in
the private sector. We did not interview patients who had dropped out of treatment, and
we excluded any TB patients or suspected TB patients who had not followed standard
TB diagnostic and treatment procedures. Similarly, the only MDR-TB patients we
interviewed were those who had been treated in a national pulmonary referral hospital
in an urban area (Jakarta). With regard to the extent of patients’ needs for social
protection and to the value of cash transfers, these strict inclusion criteria may have led
us to underestimate the needs of TB patients and to overestimate the needs of MDR-TB
Chapter 6
112
patients. MDR-TB patients treated in other MDR-TB centers or referred to PHCs after
culture conversion may have lower direct non-medical costs, and may thus have lower
requirements with regard to social protection.
Secondly, while these findings may apply to the island of Java, which constitutes 60%
of the Indonesian population,30 they may not apply directly to the eastern part and other
remote areas of Indonesia, where travel costs may be much higher than in Java, and
where income loss may be much lower. It is also uncertain whether these findings will
apply to other TB high-burden countries with a low- to middle-income.
Conclusions
Indonesia’s current level of social protection is not sufficient to mitigate the
socioeconomic impact of TB. Financial support for income loss, transportation costs,
and food-supplement costs will substantially reduce the incidence of catastrophic costs,
but financial support alone will not be sufficient to achieve the target of 0% TB-affected
households facing catastrophic costs. This would require innovative social-protection
policies and higher levels of domestic and external funding.
Ethics approval and consent to participation
Ethical clearance for this study was provided by the Ethical Committee at the Faculty of Medicine of
Universitas Indonesia–Cipto Mangunkusumo Hospital, Jakarta Indonesia (No.
416/UN2.F1/ETIK/VI/2016); and the Ethical Committee at Persahabatan Hospital, Jakarta, Indonesia
(No. DL.01.03/II.3/3817/2016). Before their decision to sign the informed-consent form, patients were
provided with written and oral explanations. We confirmed that all respondents had received written
and oral explanations of the study, and that they had signed an informed consent form before the
interview.
Funding
This study was funded by the Indonesian Endowment Fund for Education (Lembaga Pengelola Dana
Pendidikan, LPDP), Indonesia.
Acknowledgments
We would like to thank the following: Daan Nieboer for his support with the statistical analysis; the
Director of Persahabatan Hospital, the Head of Jakarta Provincial Health Office, the Head of
Tasikmalaya District Health Office, and the Head of Depok District Health Office for allowing data
collection in their institutions and areas; and Diah Handayani, Dedi Suhendar, the TB Program Officers
in Primary Health Centres, and all enumerators for their support with data collection.

Effect of financial support
113
References 1. Siroka A, Law I, Macinko J, et al. The effect of household poverty on tuberculosis. Int J Tuberc Lung
D. 2016;20:1603-8.
2. Oxlade O, Murray M. Tuberculosis and poverty: why are the poor at greater risk in India? Plos One.
2012; 7:11.
3. World Health Organization. Global tuberculosis report 2017. Geneva: World Health Organization; 2017.
4. Tanimura T, Jaramillo E, Weil D, Raviglione M, Lonnroth K. Financial burden for tuberculosis patients
in low- and middle-income countries: a systematic review. Eur Respir J. 2014;43:1763-75.
5. Mauch V, Bonsu F, Gyapong M, et al. Free tuberculosis diagnosis and treatment are not enough: patient
cost evidence from three continents. Int J Tuberc Lung Dis. 2013;17:381-7.
6. Fuady A, Houweling TAJ, Mansyur M, Richardus JH. Catastrophic total costs in tuberculosis-affected
households and their determinants since Indonesia’s implementation of universal health coverage.
Infectious Diseases of Poverty. 2018;7:3.
7. Foster N, Vassall A, Cleary S, Cunnama L, Churchyard GJ, Sinanovic E. The economic burden of TB
diagnosis and treatment in South Africa. Social Science & Medicine. 2015;130.
8. Laokri S, Dramaix-Wilmet M, Kassa F, Anagonou S, Dujardin B. Assessing the economic burden of
illness for tuberculosis patients in Benin: determinants and consequences of catastrophic health
expenditures and inequities. Trop Med Int Health. 2014;19:1249-58.
9. Daftary A, Padayatchi N. Social constraints to TB/HIV healthcare: accounts from coinfected patients in
South Africa. AIDS Care. 2012;24:1480-6.
10. Richter LM, Lönnroth K, Desmond C, Jackson R, Jaramillo E, Weil D. Economic support to patients in
HIV and TB grants in rounds 7 and 10 from the Global Fund to fight AIDS, tuberculosis and malaria.
Plos One. 2014;9: e86225.
11. Ukwaja KN, Alobu I, Igwenyi C, Hopewell PC. The high cost of free tuberculosis services: patient and
household costs associated with tuberculosis care in Ebonyi state, Nigeria. Plos One. 2013;8:8.
12. World Health Organization. Protocol for survey to determine direct and indirect costs due to TB and to
estimate proportion of TB-affected households experiencing catastrophic total costs due to TB. Geneva:
World Health Organization; 2015.
13. Lonnroth K, Glaziou P, Weil D, Floyd K, Uplekar M, Raviglione M. Beyond UHC: monitoring health
and social protection coverage in the context of tuberculosis care and prevention. PLoS Med.
2014;11:e1001693.
14. Boccia D, Pedrazzoli D, Wingfield T, et al. Towards cash transfer interventions for tuberculosis
prevention, care and control: key operational challenges and research priorities. BMC Infect Dis.
2016;16:307.
15. Wingfield T, Tovar MA, Huff D, et al. Socioeconomic support to improve initiation of tuberculosis
preventive therapy and increase tuberculosis treatment success in Peru: a household-randomised,
controlled evaluation. Lancet. 2017;389:16.
16. Rudgard WE, Evans CA, Sweeney S, et al. Comparison of two cash transfer strategies to prevent
catastrophic costs for poor tuberculosis-affected households in low- and middle-income countries: An
economic modelling study. Plos Medicine. 2017;14:11.
17. Hidrobo M, Hoddinott J, Peterman A, Margolies A, Moreira V. Cash, food, or vouchers? Evidence from
a randomized experiment in northern Ecuador. J Dev Econ. 2014;107:144-56.
18. TB-CTA. The tool to estimate patient's costs. The Hague: KNCV; 2009.
19. Fuady A, Houweling TA, Mansyur M, Richardus JH. Adaptation of the tool to estimate patient costs
questionnaire into Indonesian context for tuberculosis-affected households. Acta Med Indones.
2018;50:3-10.
20. Lutge E, Lewin S, Volmink J. Economic support to improve tuberculosis treatment outcomes in South
Africa: a qualitative process evaluation of a cluster randomized controlled trial. Trials. 2014;15:236.
Chapter 6
114
21. Lutge E, Lewin S, Volmink J, Friedman I, Lombard C. Economic support to improve tuberculosis
treatment outcomes in South Africa: a pragmatic cluster-randomized controlled trial. Trials.
2013;14:154.
22. World Bank. Exchange rate. 2016. http://databank.worldbank.org/data/
reports.aspx?source=2&series=PA.NUS.FCRF&country. Accessed 15 October 2016.
23. Ferreira FHG, Chen S, Dabalen AL, Dikhanov YM, Hamadeh N, Jolliffe DM, et al. A global count of
the extreme poor in 2012 : data issues, methodology and initial results (English). Policy Research
working paper No. WPS 7432. Washington, D.C.: World Bank Group; 2015.
24. Lutge EE, Wiysonge CS, Knight SE, Sinclair D, Volmink J. Incentives and enablers to improve
adherence in tuberculosis. Cochrane Database of Systematic Reviews. 2015; 9:1-51.
25. Martins N, Morris P, Kelly PM. Food incentives to improve completion of tuberculosis treatment:
randomised controlled trial in Dili, Timor-Leste. BMJ. 2009;339:b4248.
26. Jarrah Z, Collins D, Hafidz F. The cost of scaling up TB services in Indonesia. TB CARE I –
Management Sciences for Health. Cambridge: Management Science for Health; 2013.
27. Wingfield T, Tovar MA, Huff D, et al. The economic effects of supporting tuberculosis-affected
households in Peru. European Respiratory Journal. 2016;48:1396-410.
28. Moodley R, Godec TR, Team ST. Short-course treatment for multidrug-resistant tuberculosis: the
STREAM trials. Eur Respir Rev. 2016;25:29-35.
29. Gomez GB, Dowdy DW, Bastos ML, et al. Cost and cost-effectiveness of tuberculosis treatment
shortening: a model-based analysis. BMC Infectious Diseases. 2016;16:726.
30. Badan Pusat Statistik. Distribusi persentase penduduk menurut provinsi, 2000-2015. 2015.
https://www.bps.go.id/linkTableDinamis/view/id/843. Accessed 1 March 2017.

Chapter 7
Discussion
Chapter 7
116
This thesis is intended to provide three evidence bases related to TB in the context of
UHC in Indonesia: the household-level economic impact of TB, the relationship
between catastrophic costs and TB treatment outcomes, and the social-protection
improvements that are required to further reduce TB-related catastrophic costs. Below,
I first describe the economic impact of TB and the contribution made by private
healthcare providers to the economic impact of TB. Next, I present evidence on the
relationship between catastrophic costs, treatment adherence and treatment outcomes.
Finally, I explore the potential effect of further social-protection measures (i.e. those
beyond UHC) on the incidence of catastrophic costs.
To answer the research questions outlined in my Introduction, this chapter provides a
detailed discussion of the main findings. It also addresses several methodological issues
and the implications for further research and policy making.
Main findings
The economic impact of TB
Research Question 1: What is the economic impact of TB faced by TB-affected
households?
Despite the implementation of UHC in Indonesia, we found that TB-affected
households still incurred high costs to access TB-related services. These costs were
often catastrophic. We also found that, after diagnosis, many TB patients quit their jobs,
had to deal with high costs by borrowing money or selling property, and found that
access to TB-related services causes them moderate to severe financial problems.
The incidence of catastrophic costs is an important indicator of the economic impact of
TB. It is one of the targets addressed in the WHO’s End TB Strategy: to reduce to zero
percent the incidence of catastrophic costs faced by TB-affected households. In Chapter
3, we show that the incidence of catastrophic costs in Indonesia remains high: 36% for
TB-affected households and 83% for MDR-TB-affected households.
The households most affected by catastrophic costs were poor ones – even though, in
absolute terms, they spent less than non-poor households to access TB-related services.
On the basis of a threshold of 20% of annual household income, the incidence of
catastrophic costs faced by poor TB-affected households (43%) was significantly higher
Discussion
117
than that faced by non-poor TB-affected households (25%). As well as this higher
incidence of catastrophic costs (H), poor households also had to deal with a mean gap
(G) of 13%. This gap, which represents the average amount whereby total costs as a
proportion of household income exceed the threshold of catastrophic costs, was much
higher than the mean gap of 5% faced by non-poor households. In terms of the mean
positive gap (MPG), which is calculated by G/H in order quantify the excessive cost
incurred by households experiencing catastrophic costs, poor households also suffered
much more than non-poor households: 30% vs 18%. Among MDR-TB-affected
households, poor households also suffered more than non-poor households. Although
the incidences of catastrophic costs were the same in poor and non-poor households
(83% when we used a threshold of 20% of annual household income), poor households
faced a deeper impact; this is indicated by both the G (138% vs 45%) and the MPG
(167% vs 55%).
As shown Chapters 3 and 4, patients incurred high costs even during the pre-diagnostic
phase, i.e. the period between starting to seek care to relieve TB-related signs and
symptoms and finally obtaining a diagnosis of TB. It is important to note that it was in
this phase that the effect of Indonesia’s national health insurance program on TB-related
costs for households was expected to become apparent. This is because, if patients
received TB treatment at facilities linked to the National Tuberculosis Program (NTP),
the direct medical costs incurred during the treatment phase would already have been
covered. The introduction of Indonesia’s national health insurance program in 2014 had
also ensured that, provided diagnosis was sought at healthcare providers linked with
BPJS-K – the national health insurance agency (Badan Penyelenggara Jaminan Sosial
Kesehatan) – direct medical costs incurred during the pre-diagnostic phase would also
be covered.
However, despite the national health insurance program, the reality is that patients still
faced high direct costs during the pre-diagnostic phase – not only direct medical costs
such as consultation fees and diagnostic tests, but also direct non-medical costs, such as
transportation and food costs. The direct medical costs incurred during the pre-
diagnostic phase resulted mainly from medical consultations with private health
providers. These providers are discussed in detail below, under the sub-heading ‘Private
healthcare providers and the economic impacts of TB.’
Chapter 7
118
Chapters 3 and 5 nonetheless demonstrate that most of the costs of accessing TB-related
services were indeed faced during the treatment phase, amounting to 88% of the median
total costs for TB-affected households, and 98% for MDR-TB-affected households.
Although the NTP covers the direct medical costs, including free TB and MDR-TB
drugs, these were not the only direct medical costs patients incurred: there were also
others, such as administrative costs for patients with TB, and hospitalization for those
with MDR-TB. Nevertheless, the contribution of these two items to the total costs was
very small (<1% of the median total costs). During the treatment phase, direct costs
consisted mostly of non-medical costs: those for transportation (5% of the median total
costs in TB-affected households and 14% in MDR-TB-affected households) and for
food supplements (10% and 6% respectively).
After being diagnosed with TB, the proportion of patients who lost their jobs was high:
32% of those who had had an income-earning job before the diagnosis of TB, and 69%
of those with MDR-TB. These people quit their jobs for various reasons, including
stigmatization in the workplace,1 frequent visits to healthcare services,2 and worse
health.3, 4 The impact of job loss is clear: once patients lose their job, they also lose
much of their income, thereby reducing the financial capacity of their households. The
average income loss to those who lost their job amounted to 80% of total costs. Even
though some patients maintained their jobs during the treatment phase, healthcare visits
often caused their incomes to fall, particularly in the case of those working in the
informal sector. Indeed, our data show that income loss was high, even among patients
who kept their jobs: the income of TB patients who had maintained their job, their
income reduced by 24% (95% CI 18-30%) compared to their previous income. In the
case of MDR-TB patients, this was 24% (95% CI 8-21%). As a result, household
incomes fell by 15% (95% CI 8-22%) in TB-affected households and 20% (95% CI 7-
33%) in MDR-TB affected households.
For many patients, the perceived economic impact of TB was severe. In Chapter 6, we
found in the context of UHC that TB and MDR-TB patients perceived a need for
financial support to cover direct non-medical costs (transportation costs and food
supplements costs) and indirect costs (income loss). The need for support to recover
income loss was higher than for support to cover other costs. This highlights the critical
nature of the impact of TB on income and job loss – a problem that should be addressed
properly in the global and national frameworks for combating TB.
Discussion
119
The effect of Indonesia’s national health insurance program on catastrophic costs for
TB and MDR TB patients is limited because of two reasons. First, most medical costs
incurred for TB treatment in PHCs were already covered by the NTP, while the national
health insurance covered medical costs incurred during the pre-diagnostic phase. In the
pre-diagnostic phase, nonetheless the effect of national health insurance is indeed
limited according to TB-related costs incurred between patients who were beneficiaries
and patients who were non-beneficiaries of the national health insurance program.
While some 61% of TB patients were beneficiaries, statistically, the direct medical costs
they incurred in the pre-diagnostic phase were not significantly lower than those
incurred by non-beneficiaries. This indicates that, despite their health-insurance
coverage, many patients sought care for diagnosis at private healthcare facilities that
were not linked to the NTP and the BPJS-K. Neither did the incidence of catastrophic
costs between the insurance beneficiaries and the non-beneficiaries differ significantly.
Second, while the national health insurance covers direct medical costs, the largest part
of the total costs incurred by TB-affected household consisted of indirect costs.
Our findings suggest that the economic impact of TB remains high. While this is due
partly to the role of private healthcare providers in the pre-diagnostic phase, the most
important factor is income loss in the treatment phase. In the context of UHC,
Indonesia’s national health insurance program is similar to the universal health
insurance programs elsewhere that cover most direct medical costs. But while it is
essential to these costs, they are only part of the financial burden, and covering them is
not enough to mitigate the impact. A much higher economic burden is often imposed
by direct non-medical costs and the indirect costs caused by job and income loss.
Private healthcare providers and the economic impacts of TB Research Question 2: What is the contribution of private healthcare providers to this
economic impact of TB?
During the pre-diagnostic phase we found that private healthcare providers had
contributed significantly to the economic impact of TB. Despite the national health
insurance, suspected TB patients often sought care first either at private clinics (33%)
or at private hospitals (7%). The preference for these private institutes as a first point of
care was significantly more common in the rural district than in the urban district, and
the costs incurred at them during this phase were significantly higher than those incurred

Chapter 7
120
by patients who had first visited a PHC. These high costs were due to higher direct
medical costs (e.g., diagnostic tests) and direct non-medical costs (e.g., transportation
costs).
The higher preference for first seeking care from a private provider (rather than at a
public provider) in the rural district than in the urban may have been due to the limited
number of PHCs in the rural and their limited opening hours. If so, patients may have
felt encouraged to visit private healthcare providers – whether clinics, solo practices, or
hospitals – that were closer to their homes or were open in the afternoon or evening. In
principle, such a preference would save time and money on transportation, and avoid
potential income loss. But many patients in the urban district (27%) had also sought
care first from a private provider, even though their choice of public health providers
was much greater. Various factors may have affected this preference: unawareness of
the free TB service provided by the PHCs, the inconvenient consultation hours and long
waiting times at PHCs, or perceptions that the quality of care provided there was low.5
In Chapter 4, we also reported that the preference for first seeking care from a private
clinic had led to a significantly higher average number of healthcare visits (3.06, 95%
CI 2.83-3.30) than first seeking care from a PHC (2.18, 95% CI 1.96-2.41). This higher
average number may have resulted from additional visits needed for referral for
diagnostic tests. As many private providers have no laboratory facilities, they referred
suspected TB patients for diagnostic tests to a PHC, hospital, or referral laboratory.6
The higher number of visits may also have been due to the low quality of TB diagnostic
care given by a private healthcare provider, or to its poor adherence to the TB care
guidelines.7
Although it is assumed that the UHC provided through the national health insurance
program would reduce costs in the pre-diagnostic phase, we found no difference
between insurance beneficiaries and non-beneficiaries with regard to the following:
their choice of public or private providers as the first point of care, the number of
healthcare visits they had made, and the costs they had incurred during the pre-
diagnostic phase. Instead, we did find that average total pre-diagnostic costs were higher
for patients whose first point of contact had been a private clinic (USD 32; 95% CI USD
23-41) or a private hospital (USD 37; 95% CI USD 22-52) than whose first point of
contact had been a PHC (USD 14; 95% CI USD 10-17).

Discussion
121
In principle there are four main explanations for the higher TB-related costs incurred
by those who visited private providers. First, as many private providers are not linked
to the BPJS-K, patients still pay for medical costs. Our additional analysis did indeed
show that the medical costs incurred at private clinics (USD 21; 95% CI USD 15-28)
and private hospitals (USD 32; 95% CI USD 17-48) were significantly higher than those
at PHCs (USD 5; 95% CI USD 3-7), while travel costs between private providers and
PHCs did not differ significantly (see Annex E).
Second, patients who first sought care from private hospitals breached the referral
system. It is also the case that the national health insurance program does not allow
patients to visit a private hospital unless they have been referred by a provider at
primary-care level; the costs are otherwise paid out-of-pocket, which is very expensive.
Nonetheless, in Chapter 4, we found that 7% of TB patients had first sought care from
a private hospital rather than from a primary healthcare facility.
The third possible explanation for the higher TB-related costs incurred by those who
visited private providers is that while private providers may be linked to the BPJS-K,
their poor quality of TB service leads patients to misdiagnosis or delays in undergoing
diagnostic TB tests, both of which can result in higher direct and indirect costs.
The fourth possible explanation lies in the fragmented connection between the national
health insurance program and the system under the NTP. Despite their linkage to the
BPJS-K, private providers may be unaware of the current guidelines for TB care
management5 and the free TB diagnostic tests available from BPJS-K-linked or NTP-
linked facilities.8 Such unawareness might have led to the higher direct medical costs
during pre-diagnostic phase. On the other hand, coordination between BPJS-K and
private providers is often poor, as is the exchange of information between them. In many
cases, private providers are also afraid that if they refer a patient to another facility, the
patient will be transferred completely, thereby losing them the patient and the income
from the capitation payment – payment system based on the number of members
registered in a primary-level healthcare provider.9 As a result, private providers prefer
to keep their patients, and not to refer them to other healthcare facilities. Potentially this
leads to misdiagnosis, delay to diagnosis, and eventually higher costs incurred by
patients.
In summary, as a high proportion of suspected TB patients first seek care from private
healthcare providers, the costs they incur in the pre-diagnostic phase are higher than

Chapter 7
122
they would have been at a PHC. This is due largely to the higher medical costs (e.g.,
consultation fee, drug costs, and diagnostic tests costs). However, the costs incurred in
this phase make only a limited contribution to the total TB-related costs, the greater part
of which is incurred during the treatment phase, and consists mainly of indirect costs
due to income loss. These findings makes it imperative to develop a comprehensive
strategy for overcoming the economic impact of TB, which could be mitigated by taking
action on three fronts: bridging the gap between the BPJS-K and the NTP in the TB
care-delivery system, improving the quality of the TB care given by private providers,
and, once a patient has been diagnosed, following a suitable strategy to ensure that he
or she does not suffer income loss.
Catastrophic costs, treatment outcome and treatment adherence Research Question 3: Do catastrophic costs affect patients’ TB treatment adherence and
treatment outcome?
Our study shows that TB-related catastrophic costs have a negative impact on treatment
outcome. The odds of an unsuccessful treatment outcome were two to three times higher
among patients who had experienced catastrophic costs than among those who had not.
While our findings were statistically significant at a threshold for catastrophic costs of
30%, there was an indication that this may also be the case at thresholds between 10%
and 25%. Due to the possibility of reverse causation, the association between
catastrophic costs and TB treatment adherence is more complicated. Catastrophic costs,
on one side, may cause poor adherence. On the other side, poor adherence can also lead
to prolonged treatment that results in a higher proportion of households to face
catastrophic costs. After adjustment for such reverse causation, we found at thresholds
of 10% and 15% that catastrophic costs had negatively affected treatment adherence.
The odds of poor treatment adherence were approximately twice as high for patients
who had experienced catastrophic costs than for those who had not.
In Chapter 5, we found at a threshold of 30% that catastrophic costs had had a
statistically significantly negative impact on treatment outcome; we also found an
indication that this may also be the case at thresholds between 10% and 25%. At a
threshold of 30% of annual household, the odds of unsuccessful treatment outcome were
3.86 times higher (95% CI 1.11-13.38, P=0.03) in patients who had experienced
catastrophic costs than in those who had not. On the basis of this adjusted odds ratio,
Discussion
123
the population-attributable fraction (PAF) is 38.6%, meaning that the unsuccessful
outcome experienced by 38.6% of patients cases whose treatment outcome were
unsuccessful could be attributed to catastrophic costs.
The association between catastrophic costs and TB treatment adherence is more
complicated than the association between catastrophic costs and treatment outcomes.
This is due mainly to potential reverse causation. We found that higher costs, including
catastrophic costs, were associated with poor treatment adherence. At a threshold of
15% of annual household income, the odds of poor treatment adherence were 2.35 (95%
CI 1.08-5.14, P=0.03) times higher in patients who had experienced catastrophic costs
than in those who had not. However, it is possible that, due to financial constraints, a
patient does not visit the PHC regularly, but still remains in treatment. Despite poor
adherence, a patient may remain in TB treatment, either out of a feeling of obligation
towards medical staff to finish TB treatment, or because he or she wishes to avoid any
future recurrence. Such behaviour may extend TB treatment in a way that eventually
leads not only to higher costs for transportation and food, but also to higher loss of
income loss. Eventually, such a sequence would lead to a higher incidence of
catastrophic costs. After adjusting for such reverse causation, we found that, at the 10%
threshold, the odds of poor adherence were 2.11 times higher (95% CI 0.97-4.59,
P=0.059) in patients who had experienced catastrophic costs than in those who had not.
Findings were similar at the 15% threshold (aOR 2.06, 95% CI 0.95-4.46, P=0.07).
However, due to the size of our study and lack of statistical power, although there is
indication of a similar effect at the thresholds of 20-30%, we need to be cautious with
drawing firm conclusions with respect to these levels.
Our findings provide evidence of the effect of catastrophic costs on treatment outcomes
and treatment adherence in a middle-income, TB high-burden country. Until now, the
only study which assessed the association between catastrophic costs and poor
treatment outcome was the Peruvian study (2014) which suggested a threshold of
20%.10 Apart the evidence provided by that Peruvian study, there is very little evidence
on the effect of catastrophic costs on treatment outcomes. Although the WHO now
recommends that sensitivity analyses use several thresholds to measure the incidence
of catastrophic costs,11 it is also essential to define which indicators are important in the
context of a TB-control program at national and regional levels. Our findings suggest
that if poor treatment adherence is an important issue, it would be better to consider
defining catastrophic costs on the basis of a lower threshold, i.e., 15% of annual
Chapter 7
124
household income. If TB treatment outcome is an important issue, a higher threshold –
30% of annual household income – might be considered.
TB-related catastrophic costs negatively affect TB treatment outcomes and adherence.
The new evidence provided by our findings can inform a review of the threshold at
which these costs should be measured in future global policy. However, the effect of
catastrophic costs on treatment outcomes and adherence – and at which threshold –
should be carefully assessed according to the definition of variable measurement, the
national burden of TB, and the targets of the TB control program. These findings
highlight the need for TB control interventions to properly address the socioeconomic
aspects of the disease.
Potential effect of further social protection beyond UHC
Research Question 4: What is the potential effect on the incidence of catastrophic costs
of further social-protection measures beyond UHC?
Indonesia’s current national health insurance program covers the direct medical costs
incurred at healthcare providers linked to the BPJS-K, while the NTP provides free TB
treatment with healthcare providers linked to the NTP. Nonetheless, these two programs
are not enough to mitigate the economic impact of TB, and the incidence of catastrophic
costs remains high. Patients therefore need additional financial support to cover three
prominent cost items: income loss, transportation costs, and food supplement costs. The
simulation study we present in Chapter 6 shows that the provision of support for a
combination of these three items would substantially reduce the incidence of
catastrophic costs. But as financial support alone will not be enough to eliminate this
incidence to zero percent, other social-protection measures – such as job security policy
and social community support – are also necessary.
In short, TB-affected households need additional financial protection to mitigate the
socioeconomic impact of TB. Our study shows that 48% of TB patients and 78% of
MDR-TB patients perceive TB to cause moderate to severe financial problems in their
households. The proportion of patients who face income loss is also high (61% in TB-
affected households and 86% in MDR-TB-affected households). As 24% of TB patients
and 34% of MDR-TB patients indicate, income loss is at the top of the list of items that
Discussion
125
most need to be covered. Next on the list are financial protection to cover transportation
costs (19% and 42%) and food supplements (15% and 8%).
As our simulation studies show, providing cash transfers beyond UHC would
substantially reduce the incidence of catastrophic costs. Cash transfers for a
combination of three cost items – income loss, transportation, and food supplements –
would do most to reduce the incidence of catastrophic costs: by 25 percentage points in
TB-affected households (from 36% to 11%), and by 60 percentage points in MDR-TB-
affected households (from 83% to 23%). However, these alternative scenarios did not
consider patients or households’ behavioural effects in response to the cash transfer. In
the case of cash transfer, patients or houesholds may consume it for other purposes that
are not related to TB treatment, such as for covering transportation costs to healthcare
facility. Therefore, we need to be cautious with drawing firm conclusions with regards
to the effect of the cash transfers.
Cash transfers to TB-affected households would have a greater effect in poor
households than in non-poor households: in the baseline scenario without cash transfers,
it is in poor households that the incidence of catastrophic costs is significantly higher.
If both groups were provided with a cash transfer consisting of the same amount for
everyone, the gap between poor and non-poor households would disappear. On the other
hand, in the baseline scenario without cash transfer, the incidence of catastrophic costs
among poor and non-poor MDR-TB-affected households is equally high. In most
simulated scenarios, the incidence of catastrophic costs would fall, but would still
remain equally high in both.
Implementing cash transfer for TB- and MDR-TB-affected households beyond UHC
nevertheless requires careful assessment. First, it is difficult to determine the value of a
cash transfer that would fit all patients, as the value of the cash transfers required covers
a very wide range.
Second, cash transfers would demand an additional budget, whose affordability and
sustainability should be considered carefully. Our simulations suggest that providing
cash transfers would lead to a substantial increase in government spending on the TB
and MDR-TB programs. With regard to TB-affected households, public spending on
the TB program would increase by between 46% (to provide cash transfers for
transportation) and 148% (cash transfers for a combination of income loss,
transportation, and food supplements). With regard to MDR-TB-affected households,

Chapter 7
126
the expected increase in public spending would be less: between 8% (cash transfers for
transportation) and 20% (cash transfers for a combination of income loss,
transportation, and food supplements). This is because MDR-TB already requires high
costs for treatment.
The third matter to assess is this: to avoid the risk of stigmatization and moral hazard,
the provision of cash transfers would require a systematic targeting and delivery
system.12
As well as the national health insurance program, Indonesia has another social-
protection program, the Hope Family Program (Program Keluarga Harapan, PKH).
Previously known as the ‘cash-transfer program’ (Bantuan Langsung Tunai),13 this
targets poor households as beneficiaries of cash transfers, irrespective of whether a
household member suffers from TB. Since 2019, the cash transfer has consisted of
several components: a fixed cash transfer; a health-related cash transfer (if a household
has one or more pregnant women and/or one or more child under five years of age); an
education-related cash transfer (if a household has one or more school-aged child); a
socially-related cash transfer (if a household has one or more person aged over 60; or
one or more person with a disability). According to its components, the amount of cash
transferred ranges between USD 67 to USD 778 per year. The transfer is made every
three months, and is conditional on the household beneficiary fulfilling certain criteria,
such as a minimum of four pregnancy visits for a pregnant woman and a minimum
attendance of >85% of the total annual number of school days for school-aged
children.14
In the context of TB, the PKH is a TB-sensitive initiative that has the potential to
improve TB prevention, access to TB-related services, or TB treatment outcome, as
poor people have a higher risk of TB and are vulnerable to deeper impoverishment as a
result of it.12 However, although the PKH is conditional, the indicator focuses much
more on mother-and-child health, does not includes a TB-related indicator in the health
component, and does not specifically includes access to healthcare services. To date,
there has been no evidence of its effect on improving the TB control program or
reducing the economic impact of TB.
Despite the UHC, additional financial support is needed for TB-affected households.
Potentially, financial support in the form of cash transfers to these households can
substantially reduce the incidence of catastrophic costs. Support that was specific for
Discussion
127
TB-affected households would have a greater impact on reducing the incidence of TB-
related catastrophic costs than support that was provided to a broad, non-TB-specific
group, such as the support to poor households provided under the PKH. The
combination of TB-specific and TB-sensitive initiatives would have a greater effect of
financial support to reduce the incidence of catastrophic costs. Nevertheless, developing
a cash transfer system for TB patients would be a complex process, as the amount of
cash transfer that was affordable and sustainable would have to be formulated. Since
cash transfers based on our simulated scenarios would require a 46-148% increase on
the current TB program budget and a 8-20% increase on the current MDR-TB program
budget, a strong commitment from government is imperative. To improve the effect of
financial support, other innovative social-protection policies would also be required,
such as strengthening policies on job security in order to avoid income loss. Neither
should an income-protection system be also restricted only to TB-affected households.
Instead, it should include other chronic illnesses that are in danger of leading to income
loss after diagnosis.
Methodological issues
Generalizability is one of the methodological issues in our studies. While these studies
captured the incidence of catastrophic costs, their association with treatment outcome
and adherence, and the effect of financial support in reducing the incidence of
catastrophic costs in urban, suburban, and rural districts, the districts in question were
all on the island of Java. While this is the most populous island in Indonesia, and is
home to 60% of Indonesian population, Indonesia covers a very wide geographical area,
with many islands and remote areas. For this reason, our findings are not necessarily
generalizable to parts of Indonesia whose sociodemographic and geographical
characteristics and whose levels of health-service readiness differ.
It is clear that different sociodemographic and geographical characteristics may lead to
different cost levels. In islands and remote areas, transportation costs are much higher
than in Java, as many patients travel by boat, ferry, or taxi-bike, all of which are more
expensive than more usual forms of public transport.15 Similarly, the proportions of
patients who work in the informal sector may be higher on other islands and in remote
areas. While we assume that incomes will be lower than in Java, income losses may –
Chapter 7
128
arguably – also be lower. Nonetheless, as patients in other parts of Indonesia incur
higher transportation costs15 but lower income losses16 than the patients in our study,
the incidence of catastrophic costs may differ only slightly from the incidence we found
in our study. While income loss contributed most to catastrophic costs, we would not
expect the need for additional socioeconomic support in other parts of Indonesia to
differ greatly from that in our study. Meanwhile, the value of financial support that
needed to be covered might be slightly lower.
With regard to other islands and other areas, it is equally clear that different levels of
health-service readiness and access to healthcare services may also affect TB treatment
outcomes and treatment adherence, and the relationship of both with catastrophic costs.
If the number of healthcare facilities is limited and the quality of TB care is poor, this
may lead to poor treatment adherence and to outcomes that prolong treatment, and thus
to higher costs and greater loss of income. In such areas, the associations between
catastrophic costs, treatment outcome and treatment adherence are therefore likely to
be stronger than those we found in our study.
The generalizability of our findings was also limited by our inclusion criteria, which
were restricted to TB patients who had undergone TB treatment in a PHC. In other
words, as we did not consider TB patients treated by private providers, we did not
consider the costs they incurred, the socioeconomic impact of TB, their treatment
adherence, or their treatment outcomes. However, as we discussed before, the high costs
incurred at private providers that were not linked to the NTP and the BPJS-K may also
have increased not only the risk of poor adherence or loss to follow up, but also have
led to a high number of cases with unsuccessful treatment. Private providers that are not
linked to the NTP have no obligation to notify new TB cases, to follow up treatment, or
to report treatment outcomes. They are also assumed to provide low quality of TB care.7
In this context, the relationship between catastrophic costs and treatment adherence and
treatment outcome may be more noticeable.
We should also indicate that private providers in Indonesia are concentrated in urban
areas and in Java – all densely populated areas. Since patients elsewhere rely much more
on PHCs than on private providers,17 we believe that our restriction of inclusion to
patients who had been treated in a PHC was reasonably representative for the 40% of
the Indonesian population that does not live in Java.

Discussion
129
With regard to their application to other countries, our findings naturally require careful
appraisal. Private providers’ levels of engagement in TB-control programs vary from
one country to another.18 The provision of UHC may also vary, especially with regard
to population levels, service, and cost coverage, and also to the degree of linkage
between national health insurance and private providers. For all these reasons, UHC in
other countries may or may not mitigate the economic impact of TB to a greater extent
than in Indonesia.
Recommendation for further research and policy
It is vital that the target for eliminating the incidence of TB-related catastrophic costs is
achieved. Our studies provide evidence that might improve TB policy in this regard, but
further investigations are required.
Recommendations for further research
In 2020, Indonesia will conduct a national survey of TB costs. The most important
quality it should ensure is the generalizability of the study through a robust sampling
method and a sample size that is sufficient to capture the situation throughout Indonesia.
It is also important that it captures the TB costs incurred by patients of private healthcare
providers. For comparative purposes, samples of private providers should therefore
include private providers that have links to the NTP only, those that have links to the
BPJS-K only, those that have links to both, and those that have no affiliation to either
the NTP or the BPJS-K. The 2020 cost survey can use the adapted questionnaire
provided in this thesis.
While the incidence of catastrophic costs is obvious, it is essential that further research
determines how social protection should ensure that future costs of this sort are avoided.
This study has already highlighted the need for additional social-protection measures in
terms of cost items and the value of cash transfers.
A further step towards formulating financial protection for an intervention study is to
involve as many TB-related stakeholders as possible. Protection should not be limited
to finances alone, but should also include social issues such as the provision of

Chapter 7
130
community support19, 20 and workplace-based interventions for avoiding unnecessary
job loss.
Before a final recommendation for social-protection measures is produced, qualitative
studies through interviews and focus group discussions are also necessary. These will
also help harmonize social-protection measures not only for TB patients, but also for
other groups.
Recommendations for further policy
As there is no single recipe for formulating a social-protection package, the context
needs to be considered carefully. Eliminating catastrophic costs requires a clear
understanding not just of patients’ needs and the government resources required, but
also of the strategies that can be combined.
First, we recommend that the TB control program is integrated into the national health
system. Any strategy for this should ensure that the referral system between healthcare
providers for TB diagnosis and treatment is redefined in ways that allow (1) TB drugs
to be covered by the national health insurance benefit package, (2) TB-related indicators
to be incorporated with the performance-based capitation payment, and (3)
improvements in the quality of TB care in both public and private healthcare providers.
Second, action should be undertaken to increase patients’ – and potential patients’ –
awareness not only of the signs and symptoms of TB, but also of the wider range of
facilities they can approach. The number of public healthcare facilities, particularly in
rural districts, should be increased. If the role of community health workers (CHWs) is
reinforced, it may be possible to avoid (or at least reduce) the transportation costs and
income loss caused by visits to healthcare facilities
Third, our findings show that the incidence of catastrophic costs would be reduced by
combining the financial support. However, to formulate the support that could be
provided, needs assessment will be necessary. To establish the affordability and
sustainability of providing socioeconomic support, we recommend consultation with
key stakeholders including the NTP, local government, public and private healthcare
providers, community health workers, and patients.
Discussion
131
Fourth, we recommend that TB control programs should incorporate a broader social-
protection strategy. This should include improvement of TB awareness and education
in the workplace, reinforcement of the national job security policy (to avoid unnecessary
job loss); and enhancement of the sickness fund policy in order to cover situations in
which TB patients need to take temporary leave. Finally, as a high proportion of workers
in informal sectors are still not covered by Indonesian national health insurance,21 the
financial burden imposed upon them by medical costs must be reduced by bringing
these workers into the national health insurance program.
Chapter 7
132
References
1. World Health Organization. Working together with businesses: guidance on TB and TB/HIV
prevention, diagnosis, treatment and care in the workplace. Geneva: World Health Organization; 2012.
2. Ukwaja KN, Alobu I, lgwenyi C, Hopewell PC. The high cost of free tuberculosis services: patient and
household costs associated with tuberculosis care in Ebonyi State, Nigeria. Plos One.
2013;8(8):e73134.
3. Ralph AP, Kenangalem E, Waramori G, Pontororing GJ, Sandjaja, Tjitra E, et al. High morbidity during
treatment and residual pulmonary disability in pulmonary tuberculosis: under-recognised phenomena.
Plos One. 2013;8(11):e80302.
4. Cramm JM, van Exel J, Møller V, Finkenflügel H. Patient Views on Determinants of Compliance with
Tuberculosis Treatment in the Eastern Cape, South Africa. The Patient: Patient-Centered Outcomes
Research. 2010;3(3):159-72.
5. Mahendradhata Y, Lestari T, Probandari A, Indriarini LE, Burhan E, Mustikawati D, et al. How do
private general practitioners manage tuberculosis cases? A survey in eight cities in Indonesia. BMC
research notes. 2015;8:564-.
6. Lestari BW, Arisanti N, Siregar AYM, Sihaloho ED, Budiman G, Hill PC, et al. Feasibility study of
strengthening the public–private partnership for tuberculosis case detection in Bandung City, Indonesia.
BMC Research Notes. 2017;10(1):404.
7. Surya A, Setyaningsih B, Suryani Nasution H, Gita Parwati C, Yuzwar YE, Osberg M, et al. Quality
Tuberculosis Care in Indonesia: Using Patient Pathway Analysis to Optimize Public–Private
Collaboration. The Journal of Infectious Diseases. 2017;216(suppl_7):S724-S32.
8. Kementerian Kesehatan Republik Indonesia. Petunjuk teknis pelayanan tuberkulosis bagi peserta
Jaminan Kesehatan Nasional (JKN). Jakarta: Kementerian Kesehatan RI; 2015.
9. Kurniawati A, Mahendradhata Y, Padmawati RS. Acceptability notifikasi wajib tuberkulosis (TB) pada
dokter praktik mandiri dan klinik pratama swasta di kota Yogyakarta. Jurnal Kebijakan Kesehatan
Indonesia: JKKI. 2019;8(1):1-9.
10. Wingfield T, Boccia D, Tovar M, Gavino A, Zevallos K, Montoya R, et al. Defining catastrophic costs
and comparing their importance for adverse tuberculosis outcome with multi-drug resistance: a
prospective cohort study, Peru. PLoS Med. 2014;11(7):e1001675.
11. Pedrazzoli D, Borghi J, Viney K, Nishikiori N, Houben RMGJ, Siroka A, et al. Measuring the economic
burden for TB patients in the End TB Strategy and Universal Health Coverage frameworks. Int J Tuberc
Lung D. 2019;23(1):5-11.
12. Boccia D, Pedrazzoli D, Wingfield T, Jaramillo E, Lonnroth K, Lewis J, et al. Towards cash transfer
interventions for tuberculosis prevention, care and control: key operational challenges and research
priorities. BMC Infect Dis. 2016;16:307.
13. Nazara S, Rahayu SK. Program Keluarga Harapan (PKH): Indonesian conditional cash transfer
programme. International Policy Centre for Inclusive Growth, 2013.
14. Tim Nasional Percepatan Penanggulangan Kemiskinan. Rangkuman informasi Program Keluarga
Harapan (PKH) 2019. Jakarta: TNP2K; 2019.
15. Ruru Y, Matasik M, Oktavian A, Senyorita R, Mirino Y, Tarigan LH, et al. Factors associated with
non-adherence during tuberculosis treatment among patients treated with DOTS strategy in Jayapura,
Papua Province, Indonesia. Global Health Action. 2018;11(1):1510592.
16. Wicaksono E, Amir H, Nugroho A. The sources of income inequality in Indonesia: A regression-based
inequality decomposition. Tokyo: ADBI Working Paper, 2017 Fevruary 2017. Report No.: Contract
No.: 667.
17. Mahendradhata Y, Trisnantoro L, Listyadewi S, Soewondo P, Marthias T, Harimurti P, et al. The
Republic of Indonesia health system review. Health Systems in Transition India: World Health
Organization. 2017.
18. Uplekar M. Public-private mix for tuberculosis care and prevention. What progress? What prospects?
The International Journal of Tuberculosis and Lung Disease. 2016;20(11):1424-9.

Discussion
133
19. Wingfield T, Tovar MA, Huff D, Boccia D, Montoya R, Ramos E, et al. Socioeconomic support to
improve initiation of tuberculosis preventive therapy and increase tuberculosis treatment success in
Peru: a household-randomised, controlled evaluation. Lancet. 2017;389:16-.
20. Wingfield T, Tovar MA, Huff D, Boccia D, Montoya R, Ramos E, et al. The economic effects of
supporting tuberculosis-affected households in Peru. European Respiratory Journal. 2016;48(5):1396-
410.
21. Fuady A. Arsitektur jaminan kesehatan Indonesia: capaian, kritik dan tantangan masa depan. Jakarta:
Sagung Seto; 2019.


Summary
Summary
136
Summary
Tuberculosis (TB) is an infectious disease with a very long history. Although there have
been strategies including drug development, effective treatment and socioeconomic
development to eliminate TB, still an estimated 10 million TB incident cases and 1.33
million TB patients died in 2017. The incidence of TB also remains high in Indonesia
– a country with the third highest incidence in the worldwide.
Meanwhile, accessing TB-related services is often costly, and can be catastrophic for
TB-affected households. In addition to eliminate the incidence of TB, the WHO End
TB Strategy also sets a target to reduce to zero percent the percentage of TB-affected
households that faced catastrophic costs – defined as the total costs incurred by TB-
affected households that exceed a specific threshold of the household’s annual income.
In 2014, Indonesia started a national health insurance program (Jaminan Kesehatan
Nasional, JKN) to achieve universal health coverage (UHC). An extensive network of
public and private providers has been improving. As beneficiaries of the national health
insurance can access free essential health services, this program is assumed to reduce
TB-related direct medical costs. Even though patients receive free TB drugs and
medical consultations, they still incur high costs for direct non-medical costs, such as
transportation and food during their visits to the healthcare facility, indirect costs that
are resulted from income or job loss. Such economic consequences can be still
catastrophic, particularly for poor households. In Indonesia, no evidence has yet been
produced on measurements of the incidence of catastrophic costs due to TB, neither is
there currently any evidence on the extent to which households still face catastrophic
costs since UHC was implemented through the JKN program.
In the context of UHC in Indonesia, this thesis aims to provide an evidence-base on the
household-level economic impact of TB, the relationship between catastrophic costs
and TB treatment outcomes, and the social-protection improvements required to further
reduce TB-related catastrophic costs.
We find that, despite the implementation of UHC in Indonesia, TB-affected households
still incur high costs to access TB-related services. The incidence of catastrophic costs
is high: 36% for TB-affected households and 83% for MDR-TB-affected households.
Also, TB patients often quit their job after diagnosis, must cope with the high cost by
borrowing money and selling property, and perceive that accessing TB-related services

Summary
137
causes moderate to severe financial problems. In the context of UHC, the national health
insurance program in Indonesia is comparable to universal health insurance programs
in many countries that cover most direct medical costs. Although covering direct
medical costs is essential, it is only a part of the financial burden; and it is not enough
to mitigate the financial impact of TB. Direct non-medical costs and indirect costs due
to job and income loss often constitute a much higher economic burden than the direct
medical costs.
There is still a high proportion of suspected TB patients seeking care first with private
healthcare providers. A first contact with a private provider contributes to higher costs
during the pre-diagnostic phase compared to a first contact at a PHC. The higher costs
in this phase largely result from the higher medical costs (e.g., consultation fee, drug
costs, and diagnostic tests costs). However, the costs incurred in the pre-diagnostic
phase have limited contribution to the total costs due to TB because the largest part of
the total costs are incurred during the treatment phase – and mostly consist of indirect
costs due to income loss. To mitigate the economic impact of TB, bridging the gap
between the national health insurance agency (Badan penyelenggaran Jaminan Sosial
Kesehatan, BPJS-K) and the National Tuberculosis Program (NTP) in TB care delivery
system and improving the quality of TB care in private providers should be combined
with a strategy to avoid income loss once a patient is diagnosed with TB.
Mitigating TB-related costs is important since catastrophic costs due to TB – according
to our findings – negatively affect TB treatment outcomes and adherence. Our findings
provide new evidence that can inform a review of the threshold at which catastrophic
costs should be measured in the future global policy. However, the effect of catastrophic
costs – and at which threshold – on treatment outcomes and adherence should be
carefully assessed according to how an NTP defines treatment outcome and adherence
in its national context, and targets of the TB control program.
Additional financial support beyond UHC is needed for TB-affected households.
Potentially, financial support in the form of cash transfers to these households can
substantially reduce the incidence of catastrophic costs. The financial support that
combine TB-specific and TB-sensitive approach would provide a greater effect on
reducing the incidence of catastrophic costs. Nevertheless, developing a cash transfer
system for TB patients would be a complex process, as the amount of cash transfer that
is affordable and sustainable would have to be formulated. To improve the effect of

Summary
138
financial support, other innovative social-protection policies are required, such as
strengthening policies on job security in order to avoid income loss. Neither should an
income-protection system be restricted to TB-affected households. Instead, it should
include other chronic illnesses that may lead to income loss after diagnosis.
As there is no single recipe for formulating a social-protection package, the context
needs to be considered carefully. Eliminating catastrophic costs requires a clear
understanding not just of patients’ needs and the government resources required, but
also of the strategies that can be combined including (1) the integration between the TB
control program and the national health system, (2) the improvement of awareness of
the signs and symptoms of TB, as well as of the wider range of facilities patients can
approach, (3) the combination of the financial support, and (4) the incorporation of the
TB control program into a broader social-protection strategy.
Summary
139
Samenvatting
Tuberculose (tbc) is een besmettelijke ziekte met een zeer lange geschiedenis. Hoewel
er gecombineerde strategieën zijn geweest, waaronder de ontwikkeling van
geneesmiddelen, effectieve behandeling en sociaaleconomische ontwikkeling om tbc te
elimineren, waren er in 2017 nog steeds naar schatting 10 miljoen gevallen van tbc en
stierven 1,33 miljoen tbc-patiënten. De incidentie van tbc blijft ook hoog in Indonesië -
een land met de derde hoogste incidentie in de wereld.
Ondertussen is toegang tot tbc-gerelateerde diensten vaak duur en kan het financieel
catastrofaal zijn voor huishoudens met tbc. Naast het elimineren van de incidentie van
tbc, heeft de WHO End TB-strategie ook de doelstelling geformuleerd om het
percentage tbc-getroffen huishoudens met catastrofale kosten tot nul procent terug te
brengen. Catastrofale kosten worden hierbij gedefinieerd als de totale kosten gemaakt
door tbc-getroffen huishoudens die, als proportie van het jaarinkomen van huishoudens,
een specifieke drempel overschrijden.
In 2014 startte Indonesië een nationaal ziekteverzekeringsprogramma (Jaminan
Kesehatan Nasional, JKN) om een nationale dekking van ziektekostenverzekering
(UHC) te bereiken. Een uitgebreid netwerk van publieke en private
gezondheidszorgaanbieders is verbeterd. Omdat begunstigden van de nationale
ziektekostenverzekering toegang hebben tot gratis essentiële gezondheidszorg, wordt
ervan uitgegaan dat dit programma de tbc-gerelateerde directe medische kosten
vermindert. Hoewel patiënten gratis tbc-medicijnen en medische consulten ontvangen,
maken ze nog steeds hoge directe niet-medische kosten, zoals voor vervoer en voedsel
tijdens hun bezoeken aan de kliniek, en indirecte kosten die het gevolg zijn van
inkomensverlies of zelfs het verlies van hun baan. Dergelijke economische gevolgen
kunnen nog steeds catastrofaal zijn, vooral voor arme huishoudens. In Indonesië is er
nog geen wetenschappelijke bewijs over de incidentie van catastrofale kosten als gevolg
van tbc. Er is momenteel ook geen bewijs voor de mate waarin huishoudens nog steeds
geconfronteerd worden met catastrofale kosten sinds UHC werd geïmplementeerd via
het JKN-programma.
In de context van UHC in Indonesië beoogt dit proefschrift wetenschappelijke evidentie
te leveren met betrekking tot de economische impact van tbc op huishoudensniveau, de
relatie tussen catastrofale kosten en de effecten van tbc-behandeling, en de
Summary
140
verbeteringen in het sociale zekerheidsstelsel die nodig zijn om tbc-gerelateerde
catastrofen verder te verminderen..
We constateren dat, ondanks de implementatie van UHC in Indonesië, tbc-getroffen
huishoudens nog steeds hoge kosten maken om toegang te krijgen tot tbc-gerelateerde
diensten. De incidentie van catastrofale kosten is hoog: 36% voor huishoudens met tbc
en 83% voor huishoudens met MDR-tbc (multiresistente tbc). Ook moesten tbc-
patiënten na diagnose vaak hun baan opzeggen en moesten ze manieren vinden om om
te gaan met de hoge kosten door geld te lenen en onroerend goed te verkopen. Tbc-
patiënten waren van mening dat het gebruik van tbc-gerelateerde diensten matige tot
ernstige financiële problemen veroorzaakten. In de context van UHC is het nationale
ziekteverzekeringsprogramma in Indonesië vergelijkbaar met universele ziektekosten-
verzekeringsprogramma's in veel andere landen waar de meeste directe medische kosten
worden gedekt. Hoewel het dekken van directe medische kosten essentieel is, is het
slechts een deel van de financiële last; en het is niet voldoende om de impact te
verzachten. Directe niet-medische kosten en indirecte kosten als gevolg van verlies van
baan en inkomsten vormen vaak een veel hogere financiële last dan de directe medische
kosten.
Nog steeds zoekt een groot deel van vermoedelijke tbc-patiënten eerst hulp bij
particuliere zorgverleners. Een eerste contact met een particuliere zorgverlener draagt
bij aan hogere kosten tijdens de pre-diagnostische fase in vergelijking met een eerste
contact bij een PHC. De hogere kosten in deze fase zijn grotendeels het gevolg van de
hogere medische kosten (bijvoorbeeld consultatiekosten, medicijnkosten en
diagnostische testkosten). De kosten in de pre-diagnostische fase hebben echter een
beperkte bijdrage aan de totale kosten als gevolg van tbc omdat het grootste deel van de
totale kosten wordt gemaakt tijdens de behandelingsfase - en meestal bestaan uit
indirecte kosten als gevolg van inkomensverlies. Om de financiële gevolgen van tbc te
verzachten, moet de kloof tussen de nationale zorgverzekeraar (Badan Penyelenggaran
Jaminan Sosial Kesehatan, BPJS-K) en het nationale tbc-programma (NTP) in het
zorgsysteem voor tbc worden gedicht en de kwaliteit van de tbc-zorg door particuliere
zorgverleners worden verbeterd en gecombineerd met een strategie om inkomensverlies
te voorkomen zodra een patiënt wordt gediagnosticeerd met tbc.
Het verminderen van tbc-gerelateerde kosten is belangrijk omdat catastrofale kosten als
gevolg van tbc, volgens onze bevindingen, een negatieve invloed hebben op de
Summary
141
behandelingsresultaten en therapietrouw bij tbc. Onze bevindingen kunnen een
evaluatie van de drempelwaarde voor catastrofale kosten in toekomstig beleid
informeren. Het effect van catastrofale kosten - en bij welke drempelwaarde - op de
behandelresultaten en therapietrouw moet echter zorgvuldig worden beoordeeld aan de
hand van hoe een NTP de behandeluitkomst en therapietrouw definieert in de nationale
context en in de doelstellingen van het tbc-bestrijdingsprogramma.
Aanvullende financiële ondersteuning naast de nationale ziektekostenverzekering is
nodig voor huishoudens die getroffen zijn door tbc. Financiële steun in de vorm van
contant geldoverdrachten aan deze huishoudens kan de incidentie van catastrofale
kosten aanzienlijk verminderen. De financiële steun die een tbc-specifieke en tbc-
gevoelige aanpak combineert, zou een groter effect hebben op het verminderen van de
incidentie van catastrofale kosten. Desalniettemin zal het ontwikkelen van een systeem
voor financiële uitkeringen aan tbc-patiënten een ingewikkeld proces zijn, aangezien de
hoogte van het uit te keren bedrag zodanig moet worden vastgesteld dat het programma
betaalbaar en duurzaam is. Om het effect van financiële steun te versterken, zullen ook
andere innovatieve beleidsmaatregelen op het gebied van sociale zekerheid nodig zijn,
zoals een versterking van het beleid om baanverlies en inkomstenverlies bij ziekte te
voorkomen. Een inkomensbeschermingssysteem mag niet alleen worden beperkt tot
huishoudens die door tbc zijn getroffen. In plaats daarvan zou het ook andere chronische
ziekten moeten omvatten die na diagnose kunnen leiden tot inkomensverlies.
Er is geen uniform recept voor het formuleren van een pakket van sociale
zekerheidsmaatregelen. De context waarin dergelijke maatregelen worden
geformuleerd moet zorgvuldig worden overwogen. Het elimineren van catastrofale
kosten vereist een duidelijk inzicht, niet alleen in de behoeften van patiënten en de
benodigde overheidsmiddelen, maar ook van de strategieën die kunnen worden
gecombineerd, waaronder (1) de integratie tussen het tbc-bestrijdingsprogramma en het
nationale gezondheidssysteem, (2) de verbetering van kennis in de bevolking van de
symptomen van tbc, evenals van het bredere scala aan gezondheidszorgfaciliteiten die
ze kunnen benaderen, (3) de combinatie van de financiële steun en (4) de integratie van
het tbc-bestrijdingsprogramma in een bredere strategie voor sociale zekerheid.


Annexes
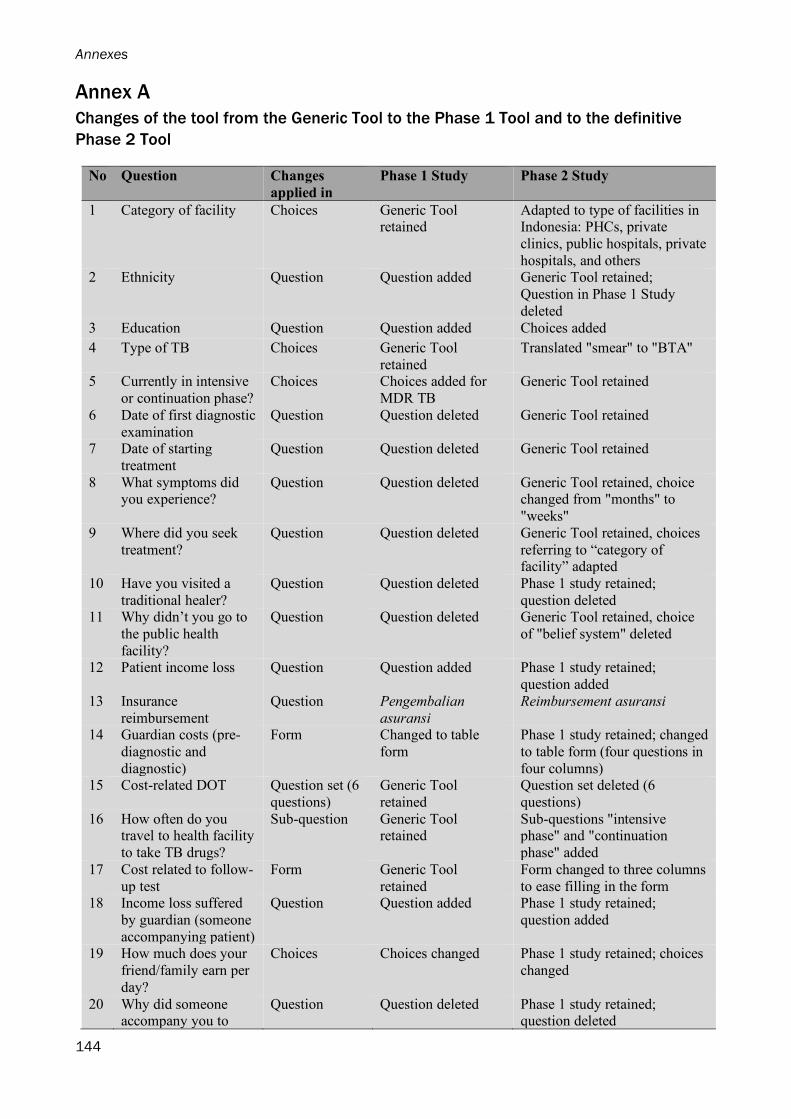
Annexes
144
Annex A
Changes of the tool from the Generic Tool to the Phase 1 Tool and to the definitive
Phase 2 Tool
No Question Changes
applied in
Phase 1 Study Phase 2 Study
1 Category of facility Choices Generic Tool retained
Adapted to type of facilities in Indonesia: PHCs, private
clinics, public hospitals, private
hospitals, and others 2 Ethnicity Question Question added Generic Tool retained;
Question in Phase 1 Study
deleted 3 Education Question Question added Choices added
4 Type of TB Choices Generic Tool
retained
Translated "smear" to "BTA"
5 Currently in intensive
or continuation phase?
Choices Choices added for
MDR TB
Generic Tool retained
6 Date of first diagnostic
examination
Question Question deleted Generic Tool retained
7 Date of starting
treatment
Question Question deleted Generic Tool retained
8 What symptoms did you experience?
Question Question deleted Generic Tool retained, choice changed from "months" to
"weeks" 9 Where did you seek
treatment?
Question Question deleted Generic Tool retained, choices
referring to “category of facility” adapted
10 Have you visited a
traditional healer?
Question Question deleted Phase 1 study retained;
question deleted 11 Why didn’t you go to
the public health
facility?
Question Question deleted Generic Tool retained, choice
of "belief system" deleted
12 Patient income loss Question Question added Phase 1 study retained;
question added 13 Insurance
reimbursement
Question Pengembalian
asuransi
Reimbursement asuransi
14 Guardian costs (pre-
diagnostic and
diagnostic)
Form Changed to table
form
Phase 1 study retained; changed
to table form (four questions in
four columns) 15 Cost-related DOT Question set (6
questions)
Generic Tool
retained
Question set deleted (6
questions)
16 How often do you travel to health facility
to take TB drugs?
Sub-question Generic Tool retained
Sub-questions "intensive phase" and "continuation
phase" added 17 Cost related to follow-
up test
Form Generic Tool
retained
Form changed to three columns
to ease filling in the form 18 Income loss suffered
by guardian (someone
accompanying patient)
Question Question added Phase 1 study retained;
question added
19 How much does your
friend/family earn per
day?
Choices Choices changed Phase 1 study retained; choices
changed
20 Why did someone accompany you to
Question Question deleted Phase 1 study retained; question deleted
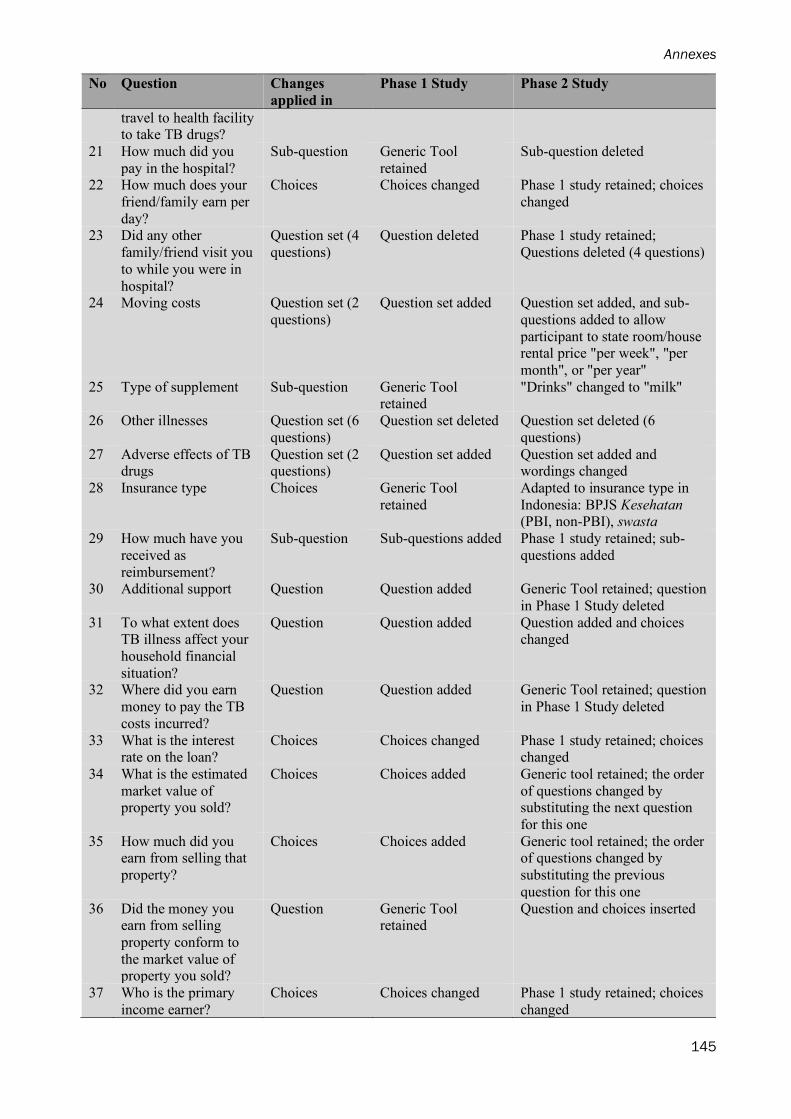
Annexes
145
No Question Changes
applied in
Phase 1 Study Phase 2 Study
travel to health facility to take TB drugs?
21 How much did you
pay in the hospital?
Sub-question Generic Tool
retained
Sub-question deleted
22 How much does your
friend/family earn per
day?
Choices Choices changed Phase 1 study retained; choices
changed
23 Did any other
family/friend visit you
to while you were in
hospital?
Question set (4
questions)
Question deleted Phase 1 study retained;
Questions deleted (4 questions)
24 Moving costs Question set (2
questions)
Question set added Question set added, and sub-
questions added to allow
participant to state room/house rental price "per week", "per
month", or "per year" 25 Type of supplement Sub-question Generic Tool
retained "Drinks" changed to "milk"
26 Other illnesses Question set (6
questions)
Question set deleted Question set deleted (6
questions)
27 Adverse effects of TB drugs
Question set (2 questions)
Question set added Question set added and wordings changed
28 Insurance type Choices Generic Tool
retained
Adapted to insurance type in
Indonesia: BPJS Kesehatan (PBI, non-PBI), swasta
29 How much have you
received as
reimbursement?
Sub-question Sub-questions added Phase 1 study retained; sub-
questions added
30 Additional support Question Question added Generic Tool retained; question
in Phase 1 Study deleted 31 To what extent does
TB illness affect your
household financial
situation?
Question Question added Question added and choices changed
32 Where did you earn
money to pay the TB
costs incurred?
Question Question added Generic Tool retained; question
in Phase 1 Study deleted
33 What is the interest rate on the loan?
Choices Choices changed Phase 1 study retained; choices changed
34 What is the estimated
market value of property you sold?
Choices Choices added Generic tool retained; the order
of questions changed by substituting the next question
for this one 35 How much did you
earn from selling that
property?
Choices Choices added Generic tool retained; the order of questions changed by
substituting the previous
question for this one 36 Did the money you
earn from selling
property conform to
the market value of property you sold?
Question Generic Tool retained
Question and choices inserted
37 Who is the primary
income earner?
Choices Choices changed Phase 1 study retained; choices
changed

Annexes
146
No Question Changes
applied in
Phase 1 Study Phase 2 Study
38 What is the level of
education of…
Question set (4
questions)
Question set deleted Question set deleted (4
questions)
39 Are you currently
formally employed?
Question Generic Tool
retained
"Currently" changed to "before
being diagnosed with TB" 40 Is the (patient’s)
reason for not working
related to TB?
Question Question deleted Phase 1 study retained;
question deleted
41 If Yes, when was the
last time you were
working?
Question Question deleted Phase 1 study retained;
question deleted
42 How were you usually
paid?
Choices Generic Tool
retained
Adapted to situation in
Indonesia 43 What was your
estimated personal take home earning per
month BEFORE the
TB illness?
Question Question deleted Phase 1 study retained;
question deleted
44 What is your
estimated personal
take home earning per
month NOW?
Question Question deleted Phase 1 study retained;
question deleted
45 Is the change related
to TB illness?
Question Question deleted Phase 1 study retained;
question deleted
46 If Yes (stopped working/going to
school/doing
housework): for how long?
Choices Generic Tool retained
Choices deleted; question changed to open question
47 How regularly did you
work before you fell
ill with TB?
Question Question deleted Phase 1 study retained;
question deleted
48 Did you have to
change jobs before
you came ill with TB?
Question Question deleted Phase 1 study retained;
question deleted
49 What is your main
occupation?
Question Question deleted Phase 1 study retained;
question deleted 50 How many hours did
you work on average
before you came ill
with TB?
Question Question deleted Phase 1 study retained; question deleted
51 How many hours do you work on average
now?
Question Question deleted Phase 1 study retained; question deleted
52 Is the change related to TB illness?
Question Question deleted Phase 1 study retained; question deleted
53 Is someone doing the
work that you used to
do?
Choices Choices changed Phase 1 study retained; choices
changed
54 Do you have children
of or below school
age?
Question Question deleted Phase 1 study retained;
question deleted
55 Do all of your children
attend school
regularly?
Question Question deleted Phase 1 study retained;
question deleted
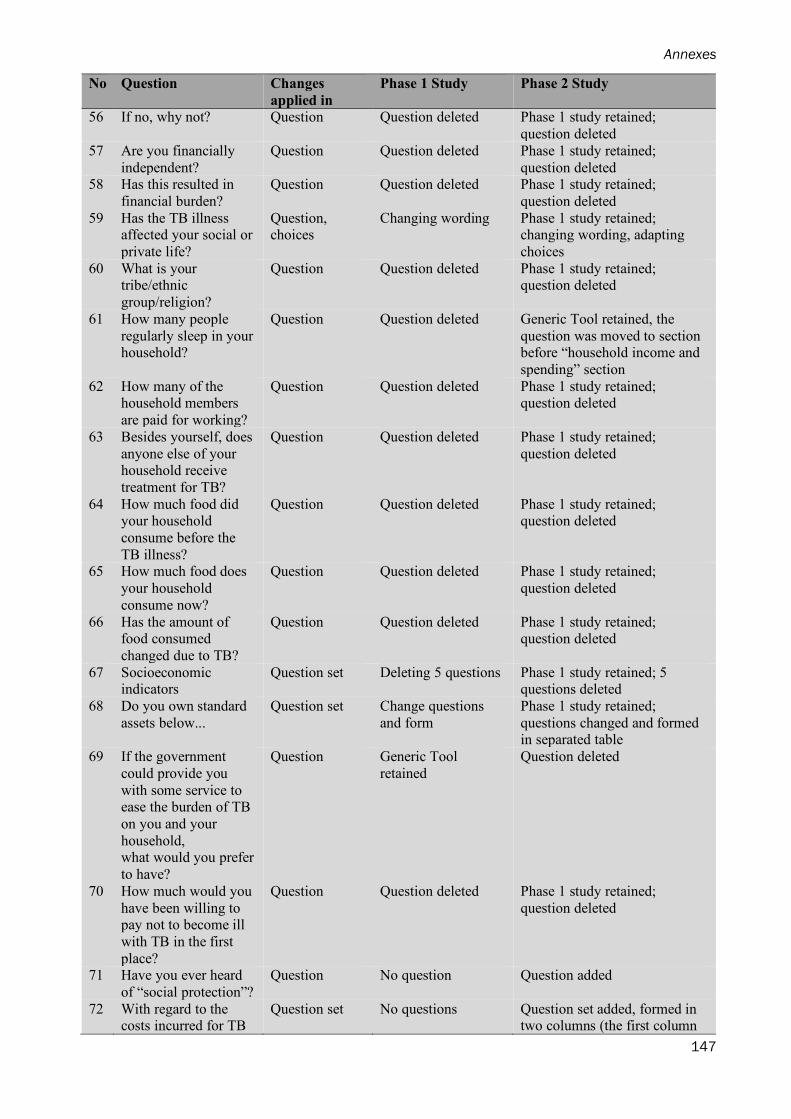
Annexes
147
No Question Changes
applied in
Phase 1 Study Phase 2 Study
56 If no, why not? Question Question deleted Phase 1 study retained;
question deleted 57 Are you financially
independent?
Question Question deleted Phase 1 study retained;
question deleted 58 Has this resulted in
financial burden?
Question Question deleted Phase 1 study retained;
question deleted
59 Has the TB illness affected your social or
private life?
Question, choices
Changing wording Phase 1 study retained; changing wording, adapting
choices 60 What is your
tribe/ethnic
group/religion?
Question Question deleted Phase 1 study retained; question deleted
61 How many people
regularly sleep in your household?
Question Question deleted Generic Tool retained, the
question was moved to section before “household income and
spending” section 62 How many of the
household members
are paid for working?
Question Question deleted Phase 1 study retained; question deleted
63 Besides yourself, does
anyone else of your household receive
treatment for TB?
Question Question deleted Phase 1 study retained;
question deleted
64 How much food did your household
consume before the
TB illness?
Question Question deleted Phase 1 study retained; question deleted
65 How much food does
your household
consume now?
Question Question deleted Phase 1 study retained;
question deleted
66 Has the amount of food consumed
changed due to TB?
Question Question deleted Phase 1 study retained; question deleted
67 Socioeconomic indicators
Question set Deleting 5 questions Phase 1 study retained; 5 questions deleted
68 Do you own standard
assets below...
Question set Change questions
and form
Phase 1 study retained;
questions changed and formed in separated table
69 If the government
could provide you
with some service to ease the burden of TB
on you and your
household, what would you prefer
to have?
Question Generic Tool
retained
Question deleted
70 How much would you
have been willing to pay not to become ill
with TB in the first
place?
Question Question deleted Phase 1 study retained;
question deleted
71 Have you ever heard
of “social protection”?
Question No question Question added
72 With regard to the costs incurred for TB
Question set No questions Question set added, formed in two columns (the first column
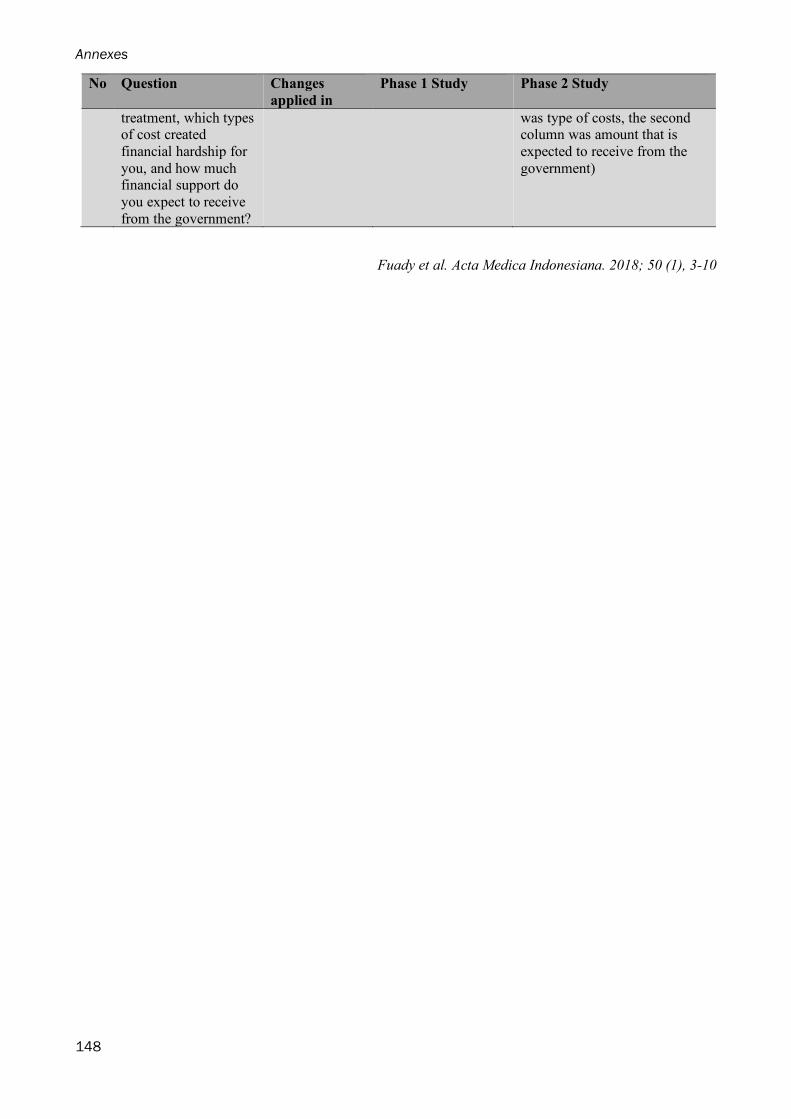
Annexes
148
No Question Changes
applied in
Phase 1 Study Phase 2 Study
treatment, which types of cost created
financial hardship for
you, and how much financial support do
you expect to receive
from the government?
was type of costs, the second column was amount that is
expected to receive from the
government)
Fuady et al. Acta Medica Indonesiana. 2018; 50 (1), 3-10
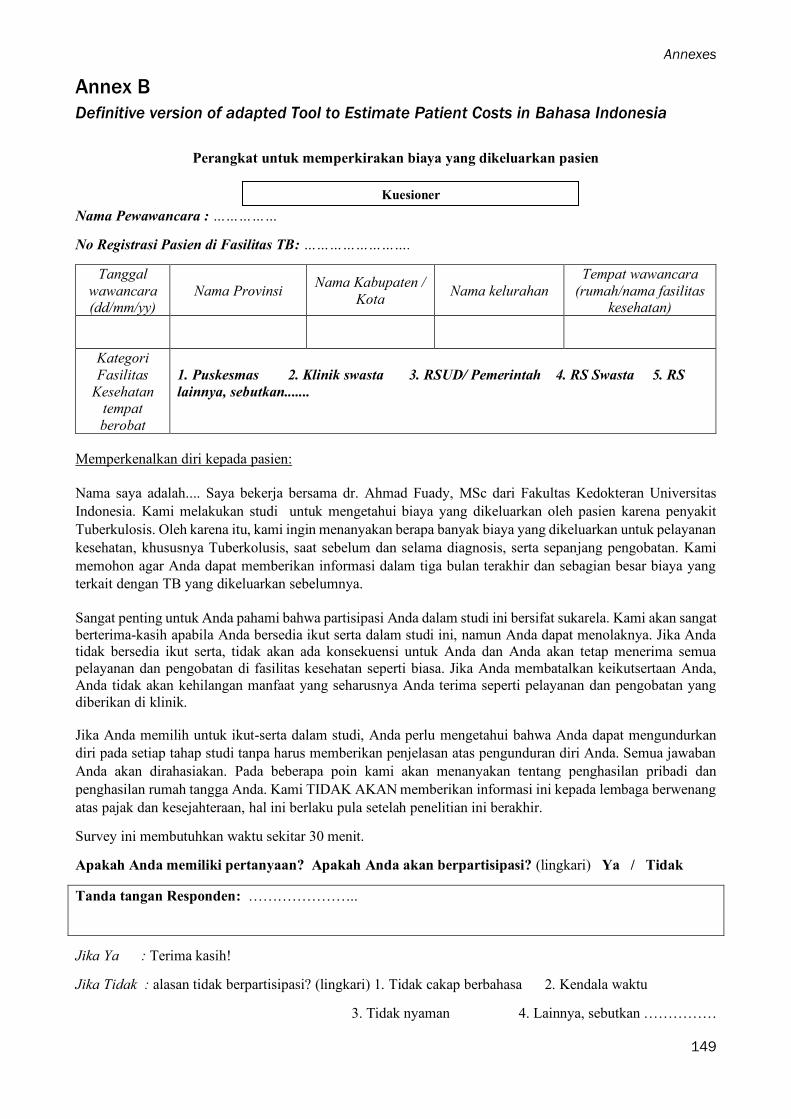
Annexes
149
Annex B
Definitive version of adapted Tool to Estimate Patient Costs in Bahasa Indonesia
Perangkat untuk memperkirakan biaya yang dikeluarkan pasien
Nama Pewawancara : ……………
No Registrasi Pasien di Fasilitas TB: …………………….
Tanggal
wawancara (dd/mm/yy)
Nama Provinsi Nama Kabupaten /
Kota Nama kelurahan
Tempat wawancara
(rumah/nama fasilitas kesehatan)
Kategori
Fasilitas
Kesehatan tempat
berobat
1. Puskesmas 2. Klinik swasta 3. RSUD/ Pemerintah 4. RS Swasta 5. RS
lainnya, sebutkan.......
Memperkenalkan diri kepada pasien:
Nama saya adalah.... Saya bekerja bersama dr. Ahmad Fuady, MSc dari Fakultas Kedokteran Universitas
Indonesia. Kami melakukan studi untuk mengetahui biaya yang dikeluarkan oleh pasien karena penyakit
Tuberkulosis. Oleh karena itu, kami ingin menanyakan berapa banyak biaya yang dikeluarkan untuk pelayanan
kesehatan, khususnya Tuberkolusis, saat sebelum dan selama diagnosis, serta sepanjang pengobatan. Kami
memohon agar Anda dapat memberikan informasi dalam tiga bulan terakhir dan sebagian besar biaya yang
terkait dengan TB yang dikeluarkan sebelumnya.
Sangat penting untuk Anda pahami bahwa partisipasi Anda dalam studi ini bersifat sukarela. Kami akan sangat
berterima-kasih apabila Anda bersedia ikut serta dalam studi ini, namun Anda dapat menolaknya. Jika Anda tidak bersedia ikut serta, tidak akan ada konsekuensi untuk Anda dan Anda akan tetap menerima semua
pelayanan dan pengobatan di fasilitas kesehatan seperti biasa. Jika Anda membatalkan keikutsertaan Anda,
Anda tidak akan kehilangan manfaat yang seharusnya Anda terima seperti pelayanan dan pengobatan yang
diberikan di klinik.
Jika Anda memilih untuk ikut-serta dalam studi, Anda perlu mengetahui bahwa Anda dapat mengundurkan
diri pada setiap tahap studi tanpa harus memberikan penjelasan atas pengunduran diri Anda. Semua jawaban
Anda akan dirahasiakan. Pada beberapa poin kami akan menanyakan tentang penghasilan pribadi dan
penghasilan rumah tangga Anda. Kami TIDAK AKAN memberikan informasi ini kepada lembaga berwenang
atas pajak dan kesejahteraan, hal ini berlaku pula setelah penelitian ini berakhir.
Survey ini membutuhkan waktu sekitar 30 menit.
Apakah Anda memiliki pertanyaan? Apakah Anda akan berpartisipasi? (lingkari) Ya / Tidak
Tanda tangan Responden: …………………..
Jika Ya : Terima kasih!
Jika Tidak : alasan tidak berpartisipasi? (lingkari) 1. Tidak cakap berbahasa 2. Kendala waktu
3. Tidak nyaman 4. Lainnya, sebutkan ……………
Kuesioner

Annexes
150
Informasi Pasien (diisi oleh Pewawancara, tambahkan keterangan dari kartu pasien; diisi juga bila pasien menolak
diwawancarai untuk analisis non-response )
Responden
1. Pasien
2. Pengawas Minum Obat (PMO)1 / wali yang tinggal di rumah tangga
yang sama dengan pasien
1. Jenis Kelamin 1. Laki-laki
2. Perempuan Usia: …… tahun
2. Apakah pendidikan tertinggi Anda?
1. Tidak Sekolah 2. SD 3. SMP 4.SMA 5. Diploma 6. Sarjana 7. Pasca sarjana
3. Tipe TB (lingkari) 1. Paru BTA + 2. Paru BTA - 3. Paru, tidak tahu status BTA 4. Ekstra Paru
4. Regimen Terapi
(lingkari)
1. Kat I (penderita baru) 2. Kat II (terapi kambuh atau gagal)
3. Terapi MDR
5. Fase terapi dan lama
terapi? 1. Intensif 2. Lanjutan
6. Status HIV
(lihat di kartu pasien!) 1. Positif 2. Negatif 3. Tidak dites 4. Tidak ada informasi
7. Tanggal pemeriksaan dahak atau Foto toraks
pertama (dd/mm/yy)
8. Tanggal mulai pengobatan (dd/mm/yy)
9. Berapa lama waktu yang diperlukan untuk mencapai
tempat pengobatan Anda saat ini dari rumah Anda?
…… menit dengan berjalan kaki/bersepeda…… menit dengan
kendaraan pribadi atau angkutan umum
Pengobatan Sebelumnya
10. a) Pernahkah Anda mendapatkan pengobatan TB
sebelumnya? Cocokkan dengan kartu pasien;
Jika Tidak,lanjut ke11
1. Ya. (mm/yy pengobatan selesai)…………….
2. Tidak
b) Jika YA: Apakah Anda menyelesaikan pengobatan
TB Anda terdahulu? 1. Ya
2. Tidak
c) Jika TIDAK, mengapa?
1. Kekurangan biaya untuk pengobatan
2. Efek samping obat
3. Jarak tempuh ke fasilitas kesehatan
4. Lainnya (sebutkan): ……
Keterlambatan, Biaya Pradiagnosis dan Diagnosis
11. Gejala apa yang Anda alami sehingga Anda memutuskan pergi berobat untuk penyakit Anda yang sekarang? Berapa
lama Anda mengalami gejala-gejala tersebut sebelum Anda pergi mencari pengobatan?
1. Batuk YA □ TIDAK □
_______minggu
2. Keringat malam YA □ TIDAK □ _______
minggu
3. Batuk berdarah YA □ TIDAK □
_______minggu
4. Berat badan turun YA □ TIDAK □ ______ minggu
5. Lainnya (Jelaskan ) YA □ TIDAK □ _____ minggu
______________
12. Ke mana saja Anda mencari pengobatan untuk mengatasi gejala-gejala tersebut? Centang semua yang sesuai
1 PMO: Pengawas Minum Obat yang secara khusus ditunjuk oleh pasien/penyedia layanan

Annexes
151
1. RSUD YA □ TIDAK □
2. RS Swasta YA □ TIDAK □
3. Puskesmas YA □ TIDAK □
4. Klinik Swasta YA □ TIDAK □
5. Lainnya (Jelaskan □ ________
Ke mana Anda pergi pertama kali? Lingkari tempat pertama pengobatan tersebut di atas
Jika selain dari fasilitas kesehatan pemerintah yang dipilih di 12):
13. Mengapa Anda tidak pergi ke fasilitas kesehatan pemerintah, seperti Puskesmas atau RSUD, ketika Anda pertama kali
ingin berobat? Lingkari yang paling sesuai.
1. Jarak terlalu jauh
2. Biaya terlalu mahal
3. Waktu tunggu terlalu lama
4. Fasilitas tidak lengkap/tersedia
5. Tidak percaya pada kualitas fasilitas kesehatan
pemerintah
6. Tidak ada obat-obatan tersedia
7. lainnya (Jelaskan) : ________________________
14. Berapa banyak biaya yang Anda habiskan untuk setiap kunjungan sebelum Anda didiagnosis TB,
termasuk kunjungan ketika Anda benar-benar menerima diagnosis Anda?
Untuk pasien MDR-TB, tanyakan hanya tentang biaya untuk diagnosis MDR-TB; untuk pasien TB lainnya,
tanyakan tentang biaya untuk diagnosis TB. Untuk semua yang tidak berhubungan, tandai dengan N/A, isi
satu baris per kunjungan. Untuk pertanyaan biaya, bila pasien tidak bisa menjawab, tulis “tidak tahu”.
Jangan hanya dikosongkan
Ku
nju
ngan
Pen
yed
ia L
ayan
an
Tota
l W
ak
tu t
iap
ku
nju
ngan
(dala
m j
am
, te
rmasuk w
aktu
perj
ala
nan)
Bia
ya A
dm
inis
trasi
(konsult
asi,
pendaft
ara
n)
Bia
ya T
es L
ab
(untu
k t
es
dahak a
tau l
ain
nya k
ecuali
Foto
tora
ks)
Bia
ya F
oto
torak
s
(term
asuk
pengir
iman
Foto
tora
ks k
e
spesia
lis r
adio
logi,
perj
ala
nan
dan b
iaya-b
iaya)
Bia
ya O
bat-
ob
ata
n (
tota
l
sem
ua j
enis
)
Bia
ya p
erja
lan
an
(to
tal
pula
ng p
erg
i, t
erm
asuk u
ntu
k
ke l
ab,
Foto
tora
ks d
ll)
Bia
ya M
ak
an
(to
tal)
Bia
ya A
kom
od
asi
(tota
l)
Su
b-T
ota
l b
iaya t
iap
ku
nju
ngan
Kunjungan 1
Kunjungan 2
Kunjungan 3
Kunjungan 4
Kunjungan 5
Kunjungan 6
Kunjungan 7
Total
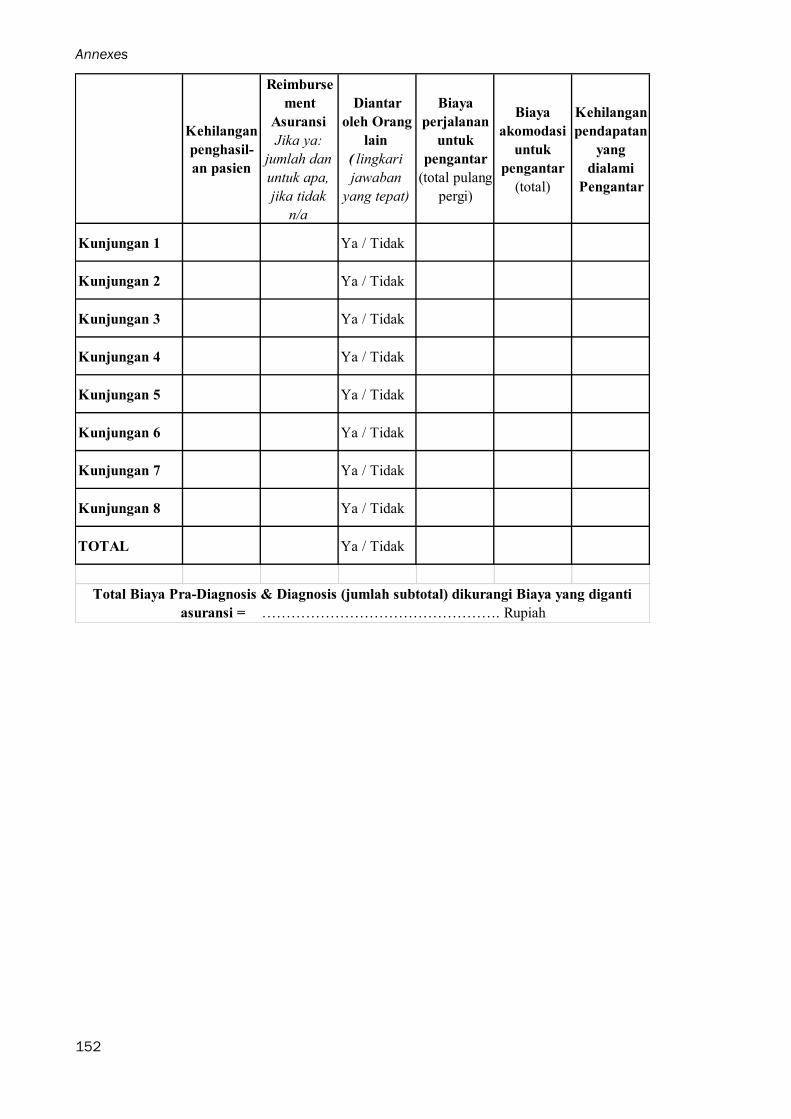
Annexes
152
Kehilangan
penghasil-
an pasien
Reimburse
ment
Asuransi
Jika ya:
jumlah dan
untuk apa,
jika tidak
n/a
Diantar
oleh Orang
lain
( lingkari
jawaban
yang tepat)
Biaya
perjalanan
untuk
pengantar
(total pulang
pergi)
Biaya
akomodasi
untuk
pengantar
(total)
Kehilangan
pendapatan
yang
dialami
Pengantar
Kunjungan 1 Ya / Tidak
Kunjungan 2 Ya / Tidak
Kunjungan 3 Ya / Tidak
Kunjungan 4 Ya / Tidak
Kunjungan 5 Ya / Tidak
Kunjungan 6 Ya / Tidak
Kunjungan 7 Ya / Tidak
Kunjungan 8 Ya / Tidak
TOTAL Ya / Tidak
Total Biaya Pra-Diagnosis & Diagnosis (jumlah subtotal) dikurangi Biaya yang diganti
asuransi = …………………………………………. Rupiah

Annexes
153
Biaya Pengobatan (Untuk pertanyaan biaya, bila pasien tidak bisa menjawab, tulis “tidak tahu”.
Jangan hanya dikosongkan
Biaya yang dikeluarkan untuk pengantar saat mengambil obat dan pemeriksaan/tes evaluasi atau tindak
lanjut selama pengobatan. Untuk pertanyaan biaya, bila pasien tidak bisa menjawab, tulis “tidak tahu”.
Jangan hanya dikosongkan
23. a) Apakah ada yang menemani Anda pada waktu mengambil obat dan
melakukan pemeriksaan laboratorium/Foto toraks lanjutan, atau menggantikan Anda untuk mengambilkan obat Anda? Jika tidak, lanjut ke P 244.
1. Ya
2. Tidak
b) Jika YA, Apakah orang tersebut kehilangan pendapatannya karena pergi
menemani Anda?
1. Ya 2. Tidak
Jika ya, berapa
jumlah total
………
Biaya untuk pengambilan obat, baik yang langsung diminum di fasilitas tersebut, atau diminum di rumah
Biaya yang dikeluarkan untuk pemeriksaan dan tes selama pengobatan.
15. Apakah Anda pernah menjalani pemeriksaan/tes untuk evaluasi
pengobatan sejak pengobatan dimulai? Jika TIDAK, lanjut ke P 23.
Sputum /Tes lab Berapa kali? _____ kali Biaya Sputum (total)
Rp ____________
Foto toraks Berapa kali? _____ kali Biaya foto toraks
(total) Rp ____________
Pemeriksaan lain Berapa kali? _____ kali Biaya Pemeriksaan
lain (total) Rp ____________
1. Ya
2. Tidak
16. Seberapa sering Anda pergi ke fasilitas kesehatan untuk mengambil obat TB
Anda? a. Fase intensif
b. Fase lanjutan
…… kali / bulan
…… kali / bulan
17. Berapa lama waktu yang Anda butuhkan untuk
sampai ke tempat tersebut (sekali perjalanan)?
.... menit berjalan kaki ..... menit dengan
kendaraan pribadi
...... menit dengan angkutan umum
18. Berapa rata-rata total waktu yang dibutuhkan untuk sekali kunjungan, termasuk
waktu perjalanan dan waktu tunggu (total waktu hingga selesai)? ….. menit
19. Dari rumah ke fasilitas kesehatan, berapa biaya transportasi yang Anda
keluarkan? (pulang pergi) …….
20. Jika Anda pergi ke fasilitas kesehatan untuk mengambil obat Anda, berapa
biaya yang Anda keluarkan untuk makanan dan minuman pada hari tersebut? (di
jalan, saat menunggu, dll)
Total
………………
……
21. a) Apakah Anda harus membayar biaya administrasi pada saat mengambil obat TB?
Jika TIDAK, lanjut ke P 21.
b) Jika YA, berapa?
1. Ya
2.Tidak
………….
22. a) Apakah ada biaya akomodasi yang harus Anda tanggung saat mengambil
obat TB Anda?
Jika TIDAK, lanjut ke P 22.
b) Jika YA: berapa?
1. Ya 2.
Tidak
…………
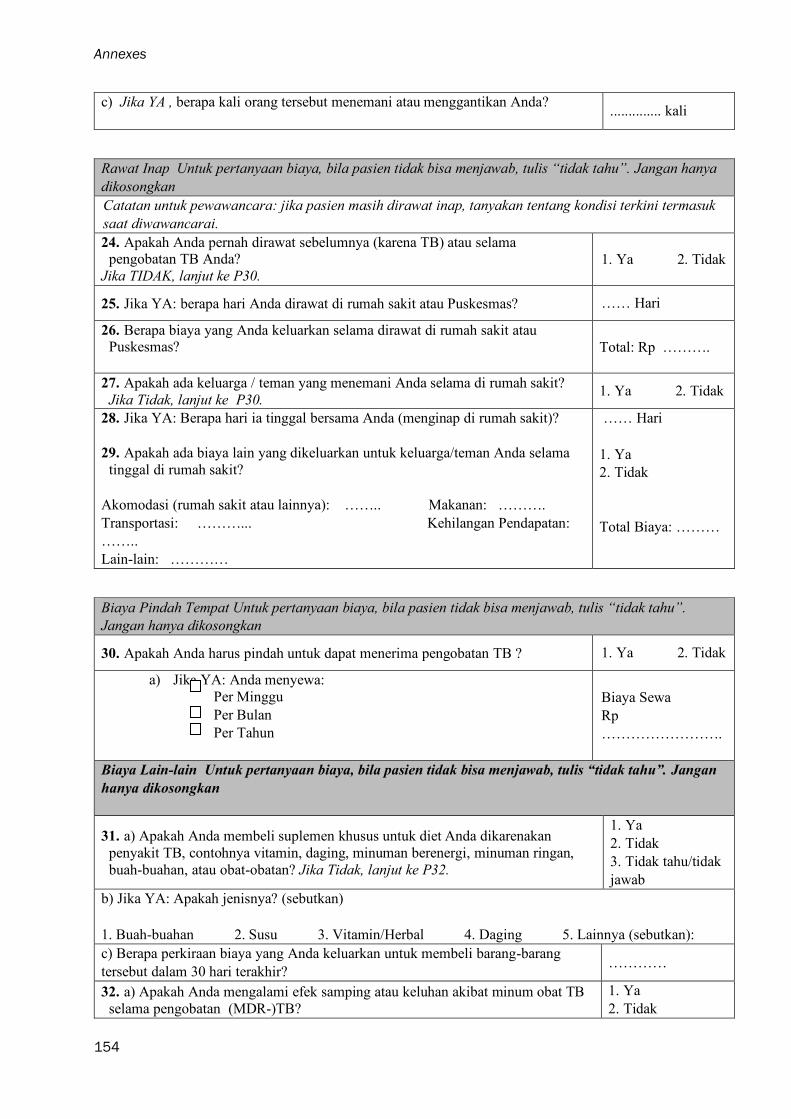
Annexes
154
c) Jika YA , berapa kali orang tersebut menemani atau menggantikan Anda?
.............. kali
Rawat Inap Untuk pertanyaan biaya, bila pasien tidak bisa menjawab, tulis “tidak tahu”. Jangan hanya
dikosongkan
Catatan untuk pewawancara: jika pasien masih dirawat inap, tanyakan tentang kondisi terkini termasuk
saat diwawancarai.
24. Apakah Anda pernah dirawat sebelumnya (karena TB) atau selama pengobatan TB Anda?
Jika TIDAK, lanjut ke P30. 1. Ya 2. Tidak
25. Jika YA: berapa hari Anda dirawat di rumah sakit atau Puskesmas? …… Hari
26. Berapa biaya yang Anda keluarkan selama dirawat di rumah sakit atau Puskesmas?
Total: Rp ……….
27. Apakah ada keluarga / teman yang menemani Anda selama di rumah sakit?
Jika Tidak, lanjut ke P30. 1. Ya 2. Tidak
28. Jika YA: Berapa hari ia tinggal bersama Anda (menginap di rumah sakit)?
29. Apakah ada biaya lain yang dikeluarkan untuk keluarga/teman Anda selama
tinggal di rumah sakit?
Akomodasi (rumah sakit atau lainnya): …….. Makanan: ……….
Transportasi: ………... Kehilangan Pendapatan:
……..
Lain-lain: …………
…… Hari
1. Ya
2. Tidak
Total Biaya: ………
Biaya Pindah Tempat Untuk pertanyaan biaya, bila pasien tidak bisa menjawab, tulis “tidak tahu”.
Jangan hanya dikosongkan
30. Apakah Anda harus pindah untuk dapat menerima pengobatan TB ? 1. Ya 2. Tidak
a) Jika YA: Anda menyewa:
Per Minggu
Per Bulan
Per Tahun
Biaya Sewa
Rp
…………………….
Biaya Lain-lain Untuk pertanyaan biaya, bila pasien tidak bisa menjawab, tulis “tidak tahu”. Jangan
hanya dikosongkan
31. a) Apakah Anda membeli suplemen khusus untuk diet Anda dikarenakan
penyakit TB, contohnya vitamin, daging, minuman berenergi, minuman ringan,
buah-buahan, atau obat-obatan? Jika Tidak, lanjut ke P32.
1. Ya
2. Tidak
3. Tidak tahu/tidak
jawab
b) Jika YA: Apakah jenisnya? (sebutkan)
1. Buah-buahan 2. Susu 3. Vitamin/Herbal 4. Daging 5. Lainnya (sebutkan):
c) Berapa perkiraan biaya yang Anda keluarkan untuk membeli barang-barang
tersebut dalam 30 hari terakhir? …………
32. a) Apakah Anda mengalami efek samping atau keluhan akibat minum obat TB
selama pengobatan (MDR-)TB?
1. Ya
2. Tidak

Annexes
155
(Efek samping adalah permasalahan kesehatan tambahan yang muncul selama
pengobatan (MDR-) TB dan kemungkinan berhubungan dengan pengobatan) Jika
Tidak, lanjut ke P33
b) Jika YA: Apakah Anda sampai menghentikan minum obat TB karena keluhan
tersebut dan butuh pengobatan untuk mengatasinya? Termasuk perubahan regimen
obat TB!
1. Ya
2. Tidak
c) Jika YA, Berapa perkiraan biaya yang Anda keluarkan untuk membeli obat
untuk mengatasi efek samping obat TB?
Total:
Rp
………………..…
Asuransi
Untuk pertanyaan biaya, bila pasien tidak bisa menjawab, tulis “tidak tahu”. Jangan hanya
dikosongkan
33. a) Apakah Anda memiliki asuransi kesehatan baik dari pemerintah maupun swasta?
Jika Tidak, lanjut ke P 34
1. Ya 2.
Tidak
3. Tidak tahu/tidak
jawab
b) Jika YA: Tipe Asuransi?
1. BPJS Kesehatan (Penerima Bantuan Iuran)
2. BPJS Kesehatan (Ditanggung Institusi)
3. BPJS Kesehatan (Mandiri)
4. Asuransi Swasta (Reimbursement)
5. Asuransi Swasta (Tanpa Reimbursement)
c) Apakah Anda telah mendapatkan penggantian biaya yang berkaitan dengan
penyakit TB?
Cocokkan dengan P Error! Reference source not found. (tabel biaya pra-
diagnosis & diagnosis) Jika Tidak, lanjut ke Poin 34
1. Ya
2. Tidak
d) Jika ya, berapa jumlah penggantian biaya yang telah Anda terima?
Untuk diagnosis: …….
Untuk pengobatan: …….
Untuk biaya transportasi:……
Lainnya: …………..
Total: ………..
Penyelesaian Masalah Keuangan
Untuk pertanyaan biaya, bila pasien tidak bisa menjawab, tulis “tidak tahu”. Jangan hanya
dikosongkan
34. Sejauh mana penyakit TB mempengaruhi kondisi keuangan
keluarga?* (lingkari)
0 = tidak ada masalah
1 = kecil
2 = cukup serius
3 = serius
4 = sangat serius
35. a) jika Anda meminjam uang untuk membantu pembiayaan
penyakit Anda, berapa jumlah uang yang Anda pinjam? Jika Tidak
meminjam, lanjut ke P36.
b) Kepada siapa Anda melakukan pinjaman (paling banyak)?
Lingkari yang paling sesuai
Jumlah uang yang dipinjam:
…….

Annexes
156
1. Keluarga 2. Tetangga/Teman 3. Bank Swasta 4.
Koperasi
5. Lainnya (sebutkan): ……………
c) Berapa besar bunga dari hutang tersebut? (%)
1. ….. %
2. Saya tidak membayar bunga.
3. Saya tidak diminta
mengembalikan pinjaman uang
tersebut.
36. a) Apakah Anda menjual properti Anda untuk membayar biaya dari penyakit
TB?
Jika Tidak, lanjut ke P37.
1. Ya 2.
Tidak
b) Jika YA: Apa yang telah Anda jual? Lingkari yang paling sesuai
1. Tanah 2. Ternak 3. Alat Transportasi/Kendaraan 4. Alat rumah tangga 5. Hasil
Pertanian
6. Lainnya (sebutkan): ………
c) Berapa jumlah yang Anda dapatkan dari hasil penjualan properti Anda? Rp
………………………………..
d) Apakah harga tersebut sesuai dengan harga pasaran?
1. Ya, sesuai harga pasar
2. Lebih rendah dari harga pasaran 3. Lebih tinggi dari harga pasaran
e) Jika TIDAK: berapa perkiraan harga pasarannya? Rp
……………………………
Informasi Sosial-Ekonomi Situasi dan Pendapatan
Untuk pertanyaan biaya, bila pasien tidak bisa menjawab, tulis “tidak tahu”. Jangan hanya
dikosongkan
37. Siapa pencari nafkah utama dalam rumah tangga?
1. Pasien 2. Lainnya (sebutkan): …….
38. Apakah Anda bekerja sebelum didiagnosis TB (termasuk pekerjaan non-formal)?
1. Ya 2. Tidak (lanjut ke P 43)
39. Bagaimana biasanya Anda digaji sebelum didiagnosis TB?
1. Digaji
2. Tidak menentu (misalnya, berdagang atau parkir) 3. Dibayar barang
4. Tidak dibayar
5. Lainnya ..............
40. Apakah Anda harus mengganti atau berhenti dari pekerjaan pada saat
Anda mengidap TB? 1. Ya 2. Tidak
41. Bila Anda masih bekerja, berapa hari rata-rata Anda absen dari
pekerjaan Anda dalam sebulan, pada 3 bulan terakhir, sejak Anda sakit TB ….. hari
Jika jawaban untuk P 41 adalah “1 hari” atau lebih: 42. Apakah seseorang melakukan pekerjaan yang seharusnya Anda
kerjakan?
1. Ya, anggota keluarga
2. Ya, orang lain
3. Tidak ada
43. Apakah ada orang lain yang melakukan pekerjaan rumah tangga Anda
dan Anda membayarnya karena Anda mengidap TB?
1. Tidak 2. Ya, jumlah total (sampai sekarang)?
Jumlah Total: ……………
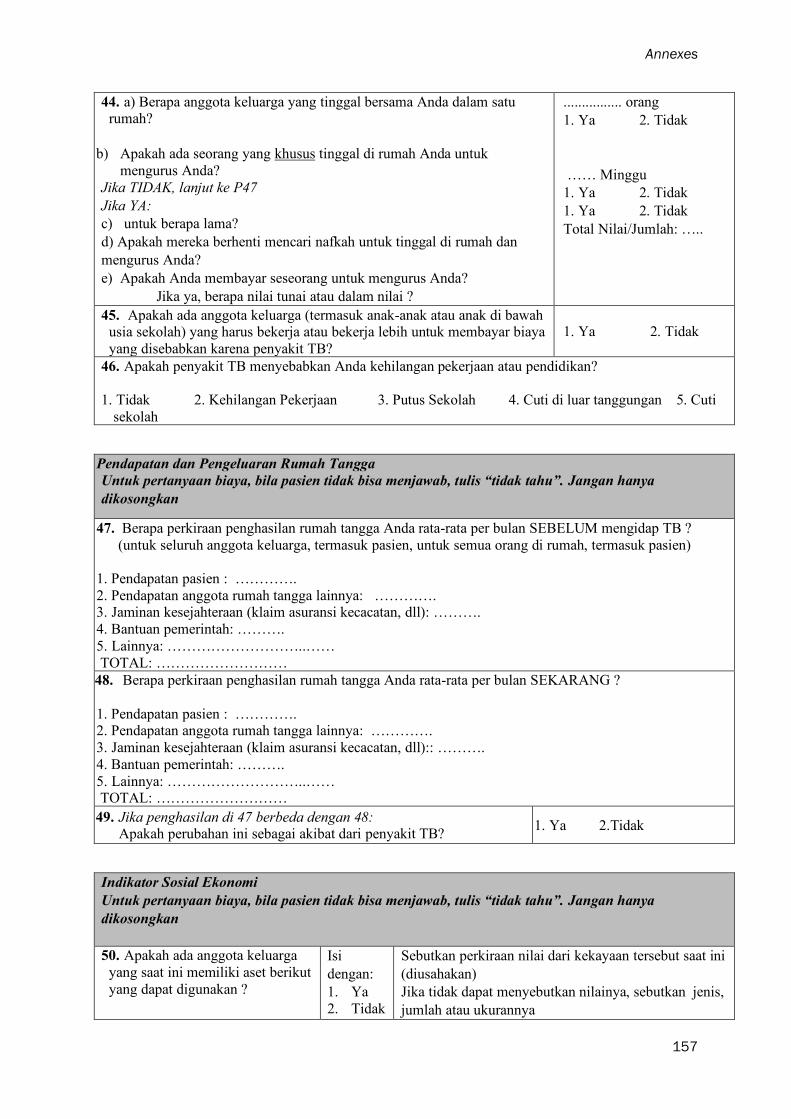
Annexes
157
44. a) Berapa anggota keluarga yang tinggal bersama Anda dalam satu rumah?
b) Apakah ada seorang yang khusus tinggal di rumah Anda untuk
mengurus Anda?
Jika TIDAK, lanjut ke P47
Jika YA:
c) untuk berapa lama?
d) Apakah mereka berhenti mencari nafkah untuk tinggal di rumah dan
mengurus Anda?
e) Apakah Anda membayar seseorang untuk mengurus Anda?
Jika ya, berapa nilai tunai atau dalam nilai ?
................ orang
1. Ya 2. Tidak
…… Minggu
1. Ya 2. Tidak
1. Ya 2. Tidak
Total Nilai/Jumlah: …..
45. Apakah ada anggota keluarga (termasuk anak-anak atau anak di bawah usia sekolah) yang harus bekerja atau bekerja lebih untuk membayar biaya
yang disebabkan karena penyakit TB?
1. Ya 2. Tidak
46. Apakah penyakit TB menyebabkan Anda kehilangan pekerjaan atau pendidikan?
1. Tidak 2. Kehilangan Pekerjaan 3. Putus Sekolah 4. Cuti di luar tanggungan 5. Cuti
sekolah
Pendapatan dan Pengeluaran Rumah Tangga
Untuk pertanyaan biaya, bila pasien tidak bisa menjawab, tulis “tidak tahu”. Jangan hanya
dikosongkan
47. Berapa perkiraan penghasilan rumah tangga Anda rata-rata per bulan SEBELUM mengidap TB ?
(untuk seluruh anggota keluarga, termasuk pasien, untuk semua orang di rumah, termasuk pasien)
1. Pendapatan pasien : ………….
2. Pendapatan anggota rumah tangga lainnya: …………. 3. Jaminan kesejahteraan (klaim asuransi kecacatan, dll): ……….
4. Bantuan pemerintah: ……….
5. Lainnya: ………………………..……
TOTAL: ………………………
48. Berapa perkiraan penghasilan rumah tangga Anda rata-rata per bulan SEKARANG ?
1. Pendapatan pasien : …………. 2. Pendapatan anggota rumah tangga lainnya: ………….
3. Jaminan kesejahteraan (klaim asuransi kecacatan, dll):: ……….
4. Bantuan pemerintah: ……….
5. Lainnya: ………………………..…… TOTAL: ………………………
49. Jika penghasilan di 47 berbeda dengan 48: Apakah perubahan ini sebagai akibat dari penyakit TB?
1. Ya 2.Tidak
Indikator Sosial Ekonomi
Untuk pertanyaan biaya, bila pasien tidak bisa menjawab, tulis “tidak tahu”. Jangan hanya
dikosongkan
50. Apakah ada anggota keluarga
yang saat ini memiliki aset berikut
yang dapat digunakan ?
Isi
dengan:
1. Ya
2. Tidak
Sebutkan perkiraan nilai dari kekayaan tersebut saat ini
(diusahakan)
Jika tidak dapat menyebutkan nilainya, sebutkan jenis,
jumlah atau ukurannya
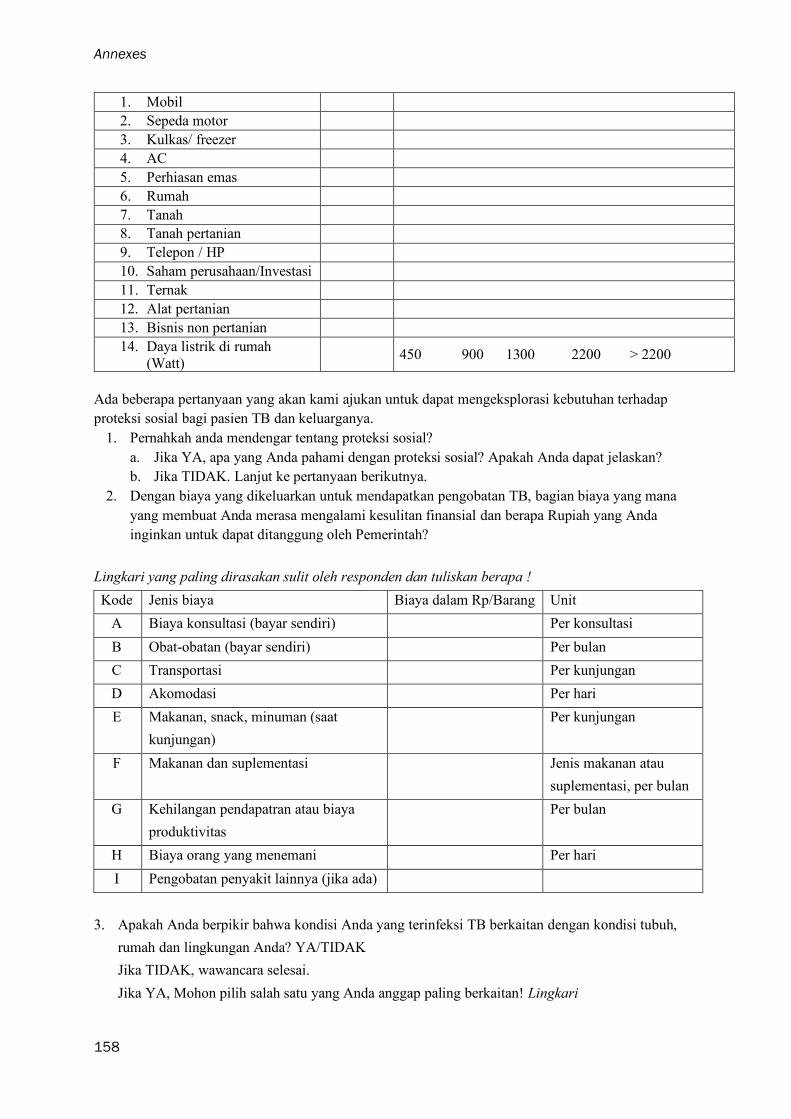
Annexes
158
1. Mobil
2. Sepeda motor
3. Kulkas/ freezer
4. AC
5. Perhiasan emas
6. Rumah
7. Tanah
8. Tanah pertanian
9. Telepon / HP
10. Saham perusahaan/Investasi
11. Ternak
12. Alat pertanian
13. Bisnis non pertanian
14. Daya listrik di rumah
(Watt) 450 900 1300 2200 > 2200
Ada beberapa pertanyaan yang akan kami ajukan untuk dapat mengeksplorasi kebutuhan terhadap
proteksi sosial bagi pasien TB dan keluarganya.
1. Pernahkah anda mendengar tentang proteksi sosial?
a. Jika YA, apa yang Anda pahami dengan proteksi sosial? Apakah Anda dapat jelaskan?
b. Jika TIDAK. Lanjut ke pertanyaan berikutnya.
2. Dengan biaya yang dikeluarkan untuk mendapatkan pengobatan TB, bagian biaya yang mana
yang membuat Anda merasa mengalami kesulitan finansial dan berapa Rupiah yang Anda
inginkan untuk dapat ditanggung oleh Pemerintah?
Lingkari yang paling dirasakan sulit oleh responden dan tuliskan berapa !
Kode Jenis biaya Biaya dalam Rp/Barang Unit
A Biaya konsultasi (bayar sendiri) Per konsultasi
B Obat-obatan (bayar sendiri) Per bulan
C Transportasi Per kunjungan
D Akomodasi Per hari
E Makanan, snack, minuman (saat
kunjungan)
Per kunjungan
F Makanan dan suplementasi Jenis makanan atau
suplementasi, per bulan
G Kehilangan pendapatran atau biaya
produktivitas
Per bulan
H Biaya orang yang menemani Per hari
I Pengobatan penyakit lainnya (jika ada)
3. Apakah Anda berpikir bahwa kondisi Anda yang terinfeksi TB berkaitan dengan kondisi tubuh,
rumah dan lingkungan Anda? YA/TIDAK
Jika TIDAK, wawancara selesai.
Jika YA, Mohon pilih salah satu yang Anda anggap paling berkaitan! Lingkari

Annexes
159
Kode Kondisi
A Makanan (tidak mampu memperoleh cukup makanan
sehat
B Tubuh (malnutrisi, akibat penyakit/kondisi lain)
C Rumah (kurang ventilasi)
D Tidak punya rumah
E Lingkungan (kumuh, padat)
4. Apa yang Anda sarankan kepada Pemerintah untuk memecahkan masalah tersebut?
Terima kasih atas kerjasama Anda! Apakah ada yang ingin Anda tanyakan atau katakan?
………………………………………………………………………………………………………
………………………………………………………………………………………………………
………….……………………………………………………………………………………………
………………………………………………………………………………………………………
………………………………………..
Komentar oleh pewawancara:
Antusiasme subyek :
0 1 2 3 4 5
Sama sekali tidak antusias Sangat antusias
………………………………………………………………………………………………………
………………………………………………………………………………………………………
…………………..……………………………………………………………………………………
………………………………………………………………………………………………………
……………………………………..
Tanggal dan Tanda tangan pewawancara
dd/mm/yy
…………… ……………………….
Fuady et al. Acta Medica Indonesiana 50 (1), 3-10

Annexes
160
Annex C
Explanations of the Tool and guidance for researcher and interviewers
Penjelasan Kuesioner
Perangkat untuk memperkirakan biaya yang dikeluarkan pasien
No Pertanyaan Pilihan Penjelasan
Pendahuluan
ID Responden X – X – XX Diisi kode (Provinsi) –
(Kabupaten/Kota) – (Urutan ID
Subyek, dari 01-xx)
Nama Pewawancara Jelas
No Registrasi pasien di
Fasilitas TB
No Rekam medik pasien. Dapat
dikosongkan
Tanggal wawancara
(dd/mm/yy)
Jelas
Nama provinsi Jelas
Nama Kabupaten/Kota Jelas
Nama Kelurahan Jelas
Tempat wawancara Rumah/Nama fasilitas
kesehatan
Jelas. Dapat diisi dengan nama
Puskesmas atau RS jika dilakukan
di Puskesmas atau RS
Kategori fasilitas
kesehatan tempat berobat
1. Puskesmas
2. Klinik swasta
3. RSUD/ Pemerintah
4. RS Swasta
5. RS lainnya,
sebutkan.......
Tempat berobat utama saat ini atau
saat diwawancara
Apakah Anda memiliki
pertanyaan? Apakah Anda
akan berpartisipasi?
Ya / Tidak Jelas
Tanda tangan Responden Responden dapat menandatangani
di sini atau cukup di lembar
informed consent di ampiran
tersendiri
Jika Tidak : alasan tidak
berpartisipasi?
1. Tidak cakap berbahasa
2. Kendala waktu
3. Tidak nyaman
4. Lainnya, sebutkan……
Jelas
Informasi Pasien
Responden 1. Pasien
2. Pengawas Minum Obat
(PMO) / wali yang
tinggal di rumah tangga
yang sama dengan pasien
Jelas
PMO: Pengawas Minum Obat yang
secara khusus ditunjuk oleh
pasien/penyedia layanan
1 Jenis kelamin 1. Laki-laki
2. Perempuan
Jelas
Usia …. Tahun Jelas
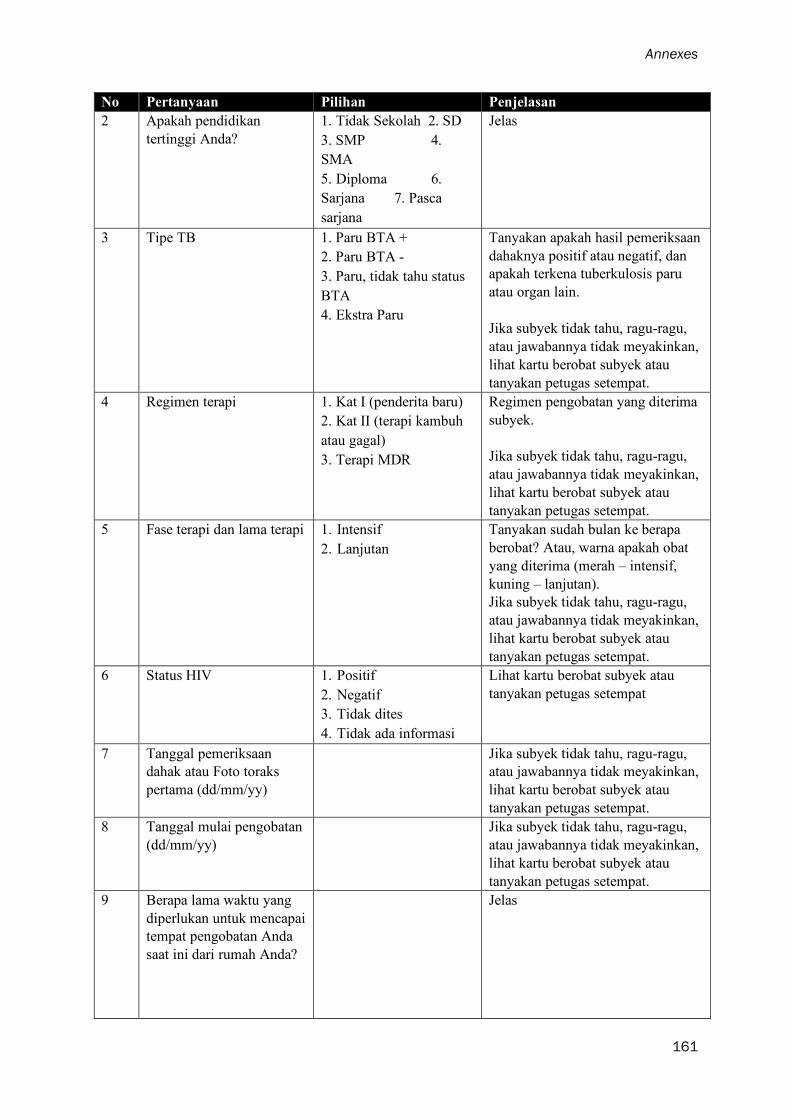
Annexes
161
No Pertanyaan Pilihan Penjelasan
2 Apakah pendidikan
tertinggi Anda?
1. Tidak Sekolah 2. SD
3. SMP 4.
SMA
5. Diploma 6.
Sarjana 7. Pasca
sarjana
Jelas
3 Tipe TB 1. Paru BTA +
2. Paru BTA -
3. Paru, tidak tahu status
BTA
4. Ekstra Paru
Tanyakan apakah hasil pemeriksaan
dahaknya positif atau negatif, dan
apakah terkena tuberkulosis paru
atau organ lain.
Jika subyek tidak tahu, ragu-ragu,
atau jawabannya tidak meyakinkan,
lihat kartu berobat subyek atau
tanyakan petugas setempat.
4 Regimen terapi 1. Kat I (penderita baru)
2. Kat II (terapi kambuh
atau gagal)
3. Terapi MDR
Regimen pengobatan yang diterima
subyek.
Jika subyek tidak tahu, ragu-ragu,
atau jawabannya tidak meyakinkan,
lihat kartu berobat subyek atau
tanyakan petugas setempat.
5 Fase terapi dan lama terapi 1. Intensif
2. Lanjutan
Tanyakan sudah bulan ke berapa
berobat? Atau, warna apakah obat
yang diterima (merah – intensif,
kuning – lanjutan).
Jika subyek tidak tahu, ragu-ragu,
atau jawabannya tidak meyakinkan,
lihat kartu berobat subyek atau
tanyakan petugas setempat.
6 Status HIV 1. Positif
2. Negatif
3. Tidak dites
4. Tidak ada informasi
Lihat kartu berobat subyek atau
tanyakan petugas setempat
7 Tanggal pemeriksaan
dahak atau Foto toraks
pertama (dd/mm/yy)
Jika subyek tidak tahu, ragu-ragu,
atau jawabannya tidak meyakinkan,
lihat kartu berobat subyek atau
tanyakan petugas setempat.
8 Tanggal mulai pengobatan
(dd/mm/yy)
Jika subyek tidak tahu, ragu-ragu,
atau jawabannya tidak meyakinkan,
lihat kartu berobat subyek atau
tanyakan petugas setempat.
9 Berapa lama waktu yang
diperlukan untuk mencapai
tempat pengobatan Anda
saat ini dari rumah Anda?
Jelas

Annexes
162
No Pertanyaan Pilihan Penjelasan
Pengobatan sebelumnya
10a Pernahkah Anda
mendapatkan pengobatan
TB sebelumnya?
1. Ya
2. Tidak
Jelas
Jika subyek tidak tahu, ragu-ragu,
atau jawabannya tidak meyakinkan,
lihat kartu berobat subyek atau
tanyakan petugas setempat.
Konfirmasi dengan jawaban no 4.
10b Jika YA: Apakah Anda
menyelesaikan pengobatan
TB Anda terdahulu?
1. Ya
2. Tidak
Jelas
10c Jika TIDAK: Mengapa? 1. Kekurangan biaya
untuk pengobatan
2. Efek samping obat
3. Jarak tempuh ke
fasilitas kesehatan
4. Lainnya (sebutkan):
……
Pilih salah satu yang paling tepat
atau mendekati.
11 Gejala apa yang Anda
alami sehingga Anda
memutuskan pergi berobat
untuk penyakit Anda yang
sekarang?
Berapa lama Anda
mengalami gejala-gejala
tersebut sebelum Anda
pergi mencari pengobatan?
1. Batuk
2. Keringat malam
3. Batuk berdarah
4. Berat badan turun
5. Lainnya
Tanyakan satu per satu dan contreng
(YA/TIDAK)
Jawab dalam minggu.
- Jika subyek menjawab dalam
HARI, gunakan ANGKA
DESIMAL atau PECAHAN,
misalnya 3/7 atau tuliskan X
HARI
- Jika subyek menjawab dalam
bulan, kalikan jumlah bulan
dengan 4 atau tuliskan XX
BULAN
12 Ke mana saja Anda
mencari pengobatan untuk
mengatasi gejala-gejala
tersebut?
1. RSUD
2. RS Swasta
3. Puskesmas
4. Klinik Swasta
5. Lainnya
Tanyakan satu per satu dan contreng
(YA/TIDAK)
Ke mana Anda pergi
pertama kali?
Lingkari tempat pertama
pengobatan tersebut di atas
Lingkari NOMOR PILIHAN di
POIN 12 yang disebutkan subyek
sebagai tempat pertama subyek
berobat
13 Jika selain dari fasilitas
kesehatan pemerintah
yang dipilih di 12):
8. Jarak terlalu jauh
9. Biaya terlalu mahal
10. Waktu tunggu
terlalu lama
Pilih salah satu yang paling tepat
atau mendekati.

Annexes
163
No Pertanyaan Pilihan Penjelasan
Mengapa Anda tidak pergi
ke fasilitas kesehatan
pemerintah, seperti
Puskesmas atau RSUD,
ketika Anda pertama kali
ingin berobat?
Lingkari yang paling
sesuai.
11. Fasilitas tidak
lengkap/tersedia
12. Tidak percaya
pada kualitas fasilitas
kesehatan pemerintah
13. Tidak ada obat-
obatan tersedia
14. Lainnya
(Jelaskan)
14 Berapa banyak biaya yang
Anda habiskan untuk
setiap kunjungan sebelum
Anda didiagnosis TB,
termasuk kunjungan ketika
Anda benar-benar
menerima diagnosis Anda?
Penyedia Layanan :
Total Waktu (bolak balik)
Biaya administrasi
Biaya Tes Lab
Biaya Foto toraks
Biaya Obat-obatan
Biaya perjalanan
1. RSUD
2. RS Swasta
3. Puskesmas
4. Klinik Swasta
5. Lainnya, misalnya
klinik alternatif,
dukun, mantri, bidan,
dsb
Untuk pasien MDR-TB, tanyakan
hanya tentang biaya untuk
diagnosis MDR-TB; untuk pasien
TB lainnya, tanyakan tentang biaya
untuk diagnosis TB. Untuk semua
yang tidak berhubungan, tandai
dengan N/A, isi satu baris per
kunjungan.
Untuk pertanyaan biaya, bila pasien
tidak bisa menjawab, tulis “tidak
tahu”. Jangan hanya dikosongkan
Diurut dari pertama kali subyek
berobat ketika mengalami keluhan
yang dijawab di POIN 11
SELF MEDICATION atau beli obat
sendiri tidak dimasukkan.
Dalam jam. Jelas
Biaya pendaftaran, konsultasi
dokter (di luar biaya obat-obatan).
Untuk tes dahak atau darah, bukan
Foto toraks
Khusus untuk Foto toraks
Khusus untuk biaya obat-obatan
Jika subyek tidak dapat
membedakan item biaya antara
administrasi, tes lab, Foto toraks,
dan obat-obatan, TOTAL BIAYA
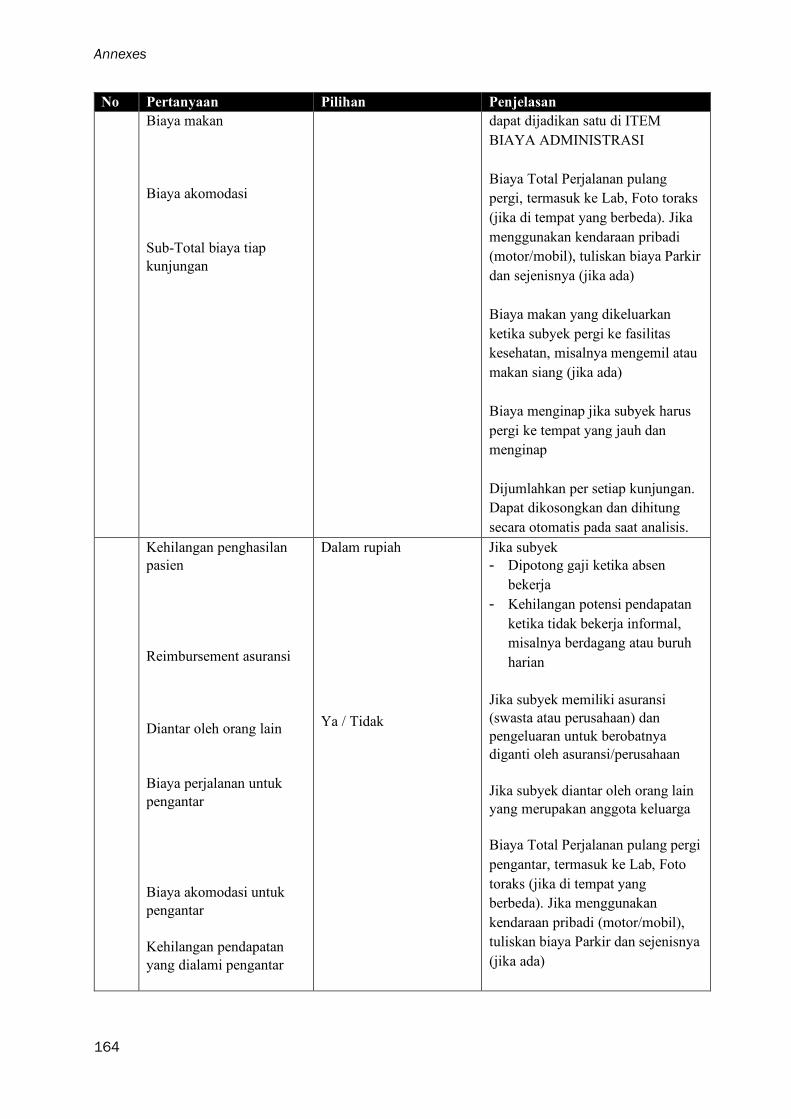
Annexes
164
No Pertanyaan Pilihan Penjelasan
Biaya makan
Biaya akomodasi
Sub-Total biaya tiap
kunjungan
dapat dijadikan satu di ITEM
BIAYA ADMINISTRASI
Biaya Total Perjalanan pulang
pergi, termasuk ke Lab, Foto toraks
(jika di tempat yang berbeda). Jika
menggunakan kendaraan pribadi
(motor/mobil), tuliskan biaya Parkir
dan sejenisnya (jika ada)
Biaya makan yang dikeluarkan
ketika subyek pergi ke fasilitas
kesehatan, misalnya mengemil atau
makan siang (jika ada)
Biaya menginap jika subyek harus
pergi ke tempat yang jauh dan
menginap
Dijumlahkan per setiap kunjungan.
Dapat dikosongkan dan dihitung
secara otomatis pada saat analisis.
Kehilangan penghasilan
pasien
Reimbursement asuransi
Diantar oleh orang lain
Biaya perjalanan untuk
pengantar
Biaya akomodasi untuk
pengantar
Kehilangan pendapatan
yang dialami pengantar
Dalam rupiah
Ya / Tidak
Jika subyek
- Dipotong gaji ketika absen
bekerja
- Kehilangan potensi pendapatan
ketika tidak bekerja informal,
misalnya berdagang atau buruh
harian
Jika subyek memiliki asuransi
(swasta atau perusahaan) dan
pengeluaran untuk berobatnya
diganti oleh asuransi/perusahaan
Jika subyek diantar oleh orang lain
yang merupakan anggota keluarga
Biaya Total Perjalanan pulang pergi
pengantar, termasuk ke Lab, Foto
toraks (jika di tempat yang
berbeda). Jika menggunakan
kendaraan pribadi (motor/mobil),
tuliskan biaya Parkir dan sejenisnya
(jika ada)
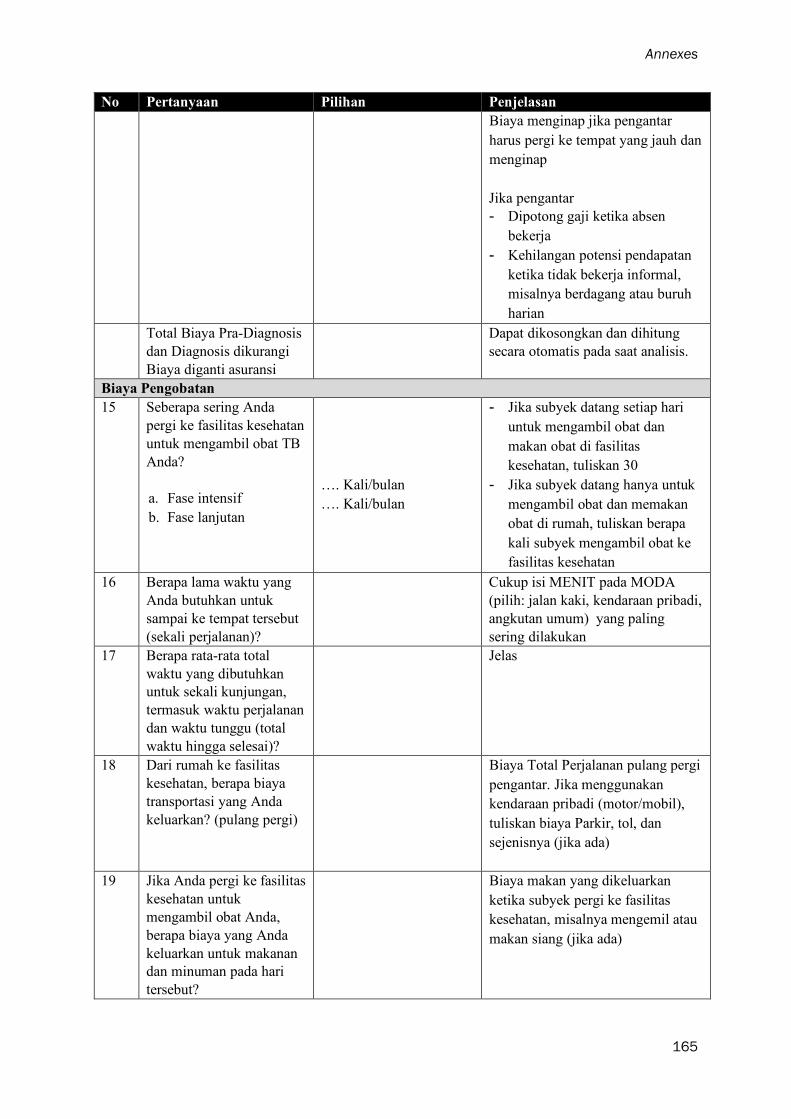
Annexes
165
No Pertanyaan Pilihan Penjelasan
Biaya menginap jika pengantar
harus pergi ke tempat yang jauh dan
menginap
Jika pengantar
- Dipotong gaji ketika absen
bekerja
- Kehilangan potensi pendapatan
ketika tidak bekerja informal,
misalnya berdagang atau buruh
harian
Total Biaya Pra-Diagnosis
dan Diagnosis dikurangi
Biaya diganti asuransi
Dapat dikosongkan dan dihitung
secara otomatis pada saat analisis.
Biaya Pengobatan
15 Seberapa sering Anda
pergi ke fasilitas kesehatan
untuk mengambil obat TB
Anda?
a. Fase intensif
b. Fase lanjutan
…. Kali/bulan
…. Kali/bulan
- Jika subyek datang setiap hari
untuk mengambil obat dan
makan obat di fasilitas
kesehatan, tuliskan 30
- Jika subyek datang hanya untuk
mengambil obat dan memakan
obat di rumah, tuliskan berapa
kali subyek mengambil obat ke
fasilitas kesehatan
16 Berapa lama waktu yang
Anda butuhkan untuk
sampai ke tempat tersebut
(sekali perjalanan)?
Cukup isi MENIT pada MODA
(pilih: jalan kaki, kendaraan pribadi,
angkutan umum) yang paling
sering dilakukan
17 Berapa rata-rata total
waktu yang dibutuhkan
untuk sekali kunjungan,
termasuk waktu perjalanan
dan waktu tunggu (total
waktu hingga selesai)?
Jelas
18 Dari rumah ke fasilitas
kesehatan, berapa biaya
transportasi yang Anda
keluarkan? (pulang pergi)
Biaya Total Perjalanan pulang pergi
pengantar. Jika menggunakan
kendaraan pribadi (motor/mobil),
tuliskan biaya Parkir, tol, dan
sejenisnya (jika ada)
19 Jika Anda pergi ke fasilitas
kesehatan untuk
mengambil obat Anda,
berapa biaya yang Anda
keluarkan untuk makanan
dan minuman pada hari
tersebut?
Biaya makan yang dikeluarkan
ketika subyek pergi ke fasilitas
kesehatan, misalnya mengemil atau
makan siang (jika ada)
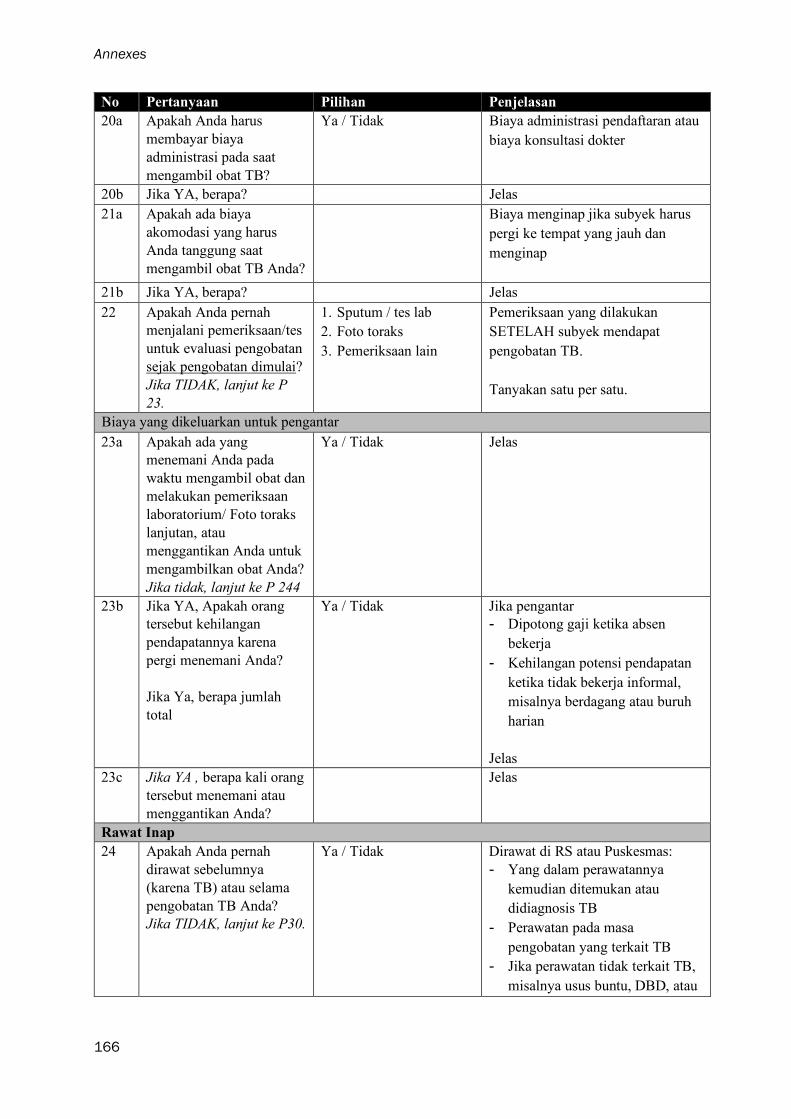
Annexes
166
No Pertanyaan Pilihan Penjelasan
20a Apakah Anda harus
membayar biaya
administrasi pada saat
mengambil obat TB?
Ya / Tidak Biaya administrasi pendaftaran atau
biaya konsultasi dokter
20b Jika YA, berapa? Jelas
21a Apakah ada biaya
akomodasi yang harus
Anda tanggung saat
mengambil obat TB Anda?
Biaya menginap jika subyek harus
pergi ke tempat yang jauh dan
menginap
21b Jika YA, berapa? Jelas
22 Apakah Anda pernah
menjalani pemeriksaan/tes
untuk evaluasi pengobatan
sejak pengobatan dimulai?
Jika TIDAK, lanjut ke P
23.
1. Sputum / tes lab
2. Foto toraks
3. Pemeriksaan lain
Pemeriksaan yang dilakukan
SETELAH subyek mendapat
pengobatan TB.
Tanyakan satu per satu.
Biaya yang dikeluarkan untuk pengantar
23a Apakah ada yang
menemani Anda pada
waktu mengambil obat dan
melakukan pemeriksaan
laboratorium/ Foto toraks
lanjutan, atau
menggantikan Anda untuk
mengambilkan obat Anda?
Jika tidak, lanjut ke P 244
Ya / Tidak Jelas
23b Jika YA, Apakah orang
tersebut kehilangan
pendapatannya karena
pergi menemani Anda?
Jika Ya, berapa jumlah
total
Ya / Tidak
Jika pengantar
- Dipotong gaji ketika absen
bekerja
- Kehilangan potensi pendapatan
ketika tidak bekerja informal,
misalnya berdagang atau buruh
harian
Jelas
23c Jika YA , berapa kali orang
tersebut menemani atau
menggantikan Anda?
Jelas
Rawat Inap
24 Apakah Anda pernah
dirawat sebelumnya
(karena TB) atau selama
pengobatan TB Anda?
Jika TIDAK, lanjut ke P30.
Ya / Tidak Dirawat di RS atau Puskesmas:
- Yang dalam perawatannya
kemudian ditemukan atau
didiagnosis TB
- Perawatan pada masa
pengobatan yang terkait TB
- Jika perawatan tidak terkait TB,
misalnya usus buntu, DBD, atau
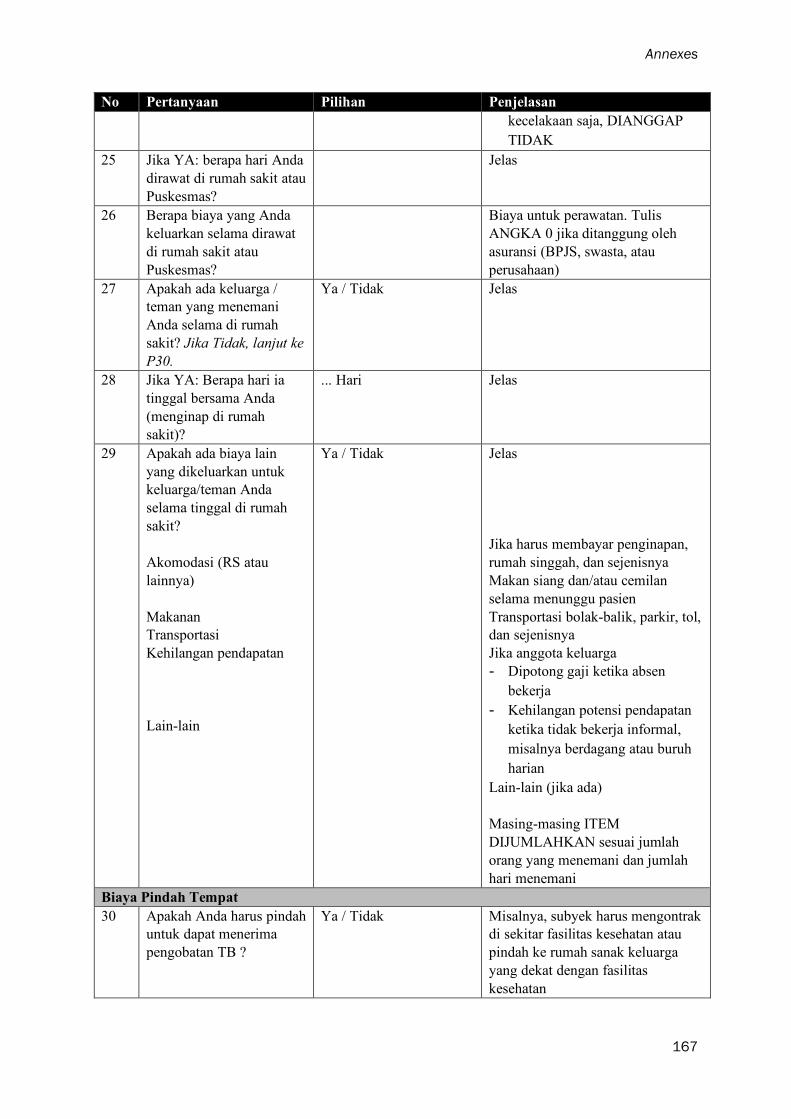
Annexes
167
No Pertanyaan Pilihan Penjelasan
kecelakaan saja, DIANGGAP
TIDAK
25 Jika YA: berapa hari Anda
dirawat di rumah sakit atau
Puskesmas?
Jelas
26 Berapa biaya yang Anda
keluarkan selama dirawat
di rumah sakit atau
Puskesmas?
Biaya untuk perawatan. Tulis
ANGKA 0 jika ditanggung oleh
asuransi (BPJS, swasta, atau
perusahaan)
27 Apakah ada keluarga /
teman yang menemani
Anda selama di rumah
sakit? Jika Tidak, lanjut ke
P30.
Ya / Tidak Jelas
28 Jika YA: Berapa hari ia
tinggal bersama Anda
(menginap di rumah
sakit)?
... Hari Jelas
29 Apakah ada biaya lain
yang dikeluarkan untuk
keluarga/teman Anda
selama tinggal di rumah
sakit?
Akomodasi (RS atau
lainnya)
Makanan
Transportasi
Kehilangan pendapatan
Lain-lain
Ya / Tidak Jelas
Jika harus membayar penginapan,
rumah singgah, dan sejenisnya
Makan siang dan/atau cemilan
selama menunggu pasien
Transportasi bolak-balik, parkir, tol,
dan sejenisnya
Jika anggota keluarga
- Dipotong gaji ketika absen
bekerja
- Kehilangan potensi pendapatan
ketika tidak bekerja informal,
misalnya berdagang atau buruh
harian
Lain-lain (jika ada)
Masing-masing ITEM
DIJUMLAHKAN sesuai jumlah
orang yang menemani dan jumlah
hari menemani
Biaya Pindah Tempat
30 Apakah Anda harus pindah
untuk dapat menerima
pengobatan TB ?
Ya / Tidak Misalnya, subyek harus mengontrak
di sekitar fasilitas kesehatan atau
pindah ke rumah sanak keluarga
yang dekat dengan fasilitas
kesehatan
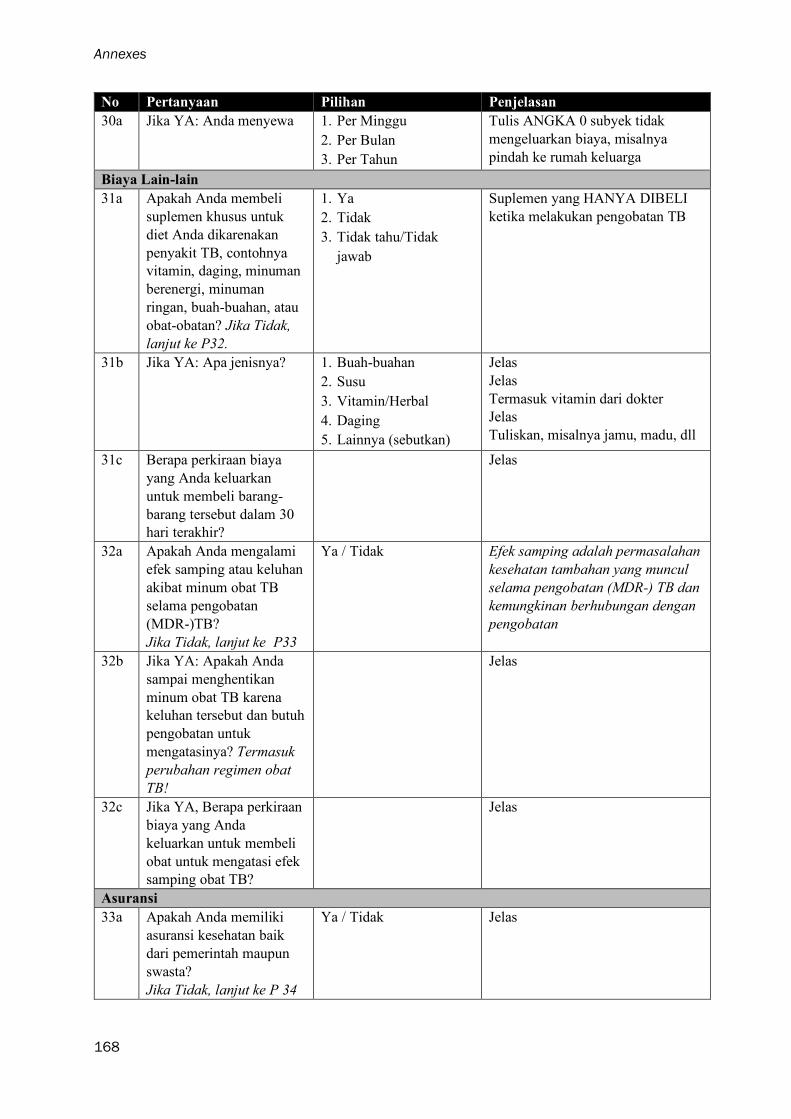
Annexes
168
No Pertanyaan Pilihan Penjelasan
30a Jika YA: Anda menyewa 1. Per Minggu
2. Per Bulan
3. Per Tahun
Tulis ANGKA 0 subyek tidak
mengeluarkan biaya, misalnya
pindah ke rumah keluarga
Biaya Lain-lain
31a Apakah Anda membeli
suplemen khusus untuk
diet Anda dikarenakan
penyakit TB, contohnya
vitamin, daging, minuman
berenergi, minuman
ringan, buah-buahan, atau
obat-obatan? Jika Tidak,
lanjut ke P32.
1. Ya
2. Tidak
3. Tidak tahu/Tidak
jawab
Suplemen yang HANYA DIBELI
ketika melakukan pengobatan TB
31b Jika YA: Apa jenisnya? 1. Buah-buahan
2. Susu
3. Vitamin/Herbal
4. Daging
5. Lainnya (sebutkan)
Jelas
Jelas
Termasuk vitamin dari dokter
Jelas
Tuliskan, misalnya jamu, madu, dll
31c Berapa perkiraan biaya
yang Anda keluarkan
untuk membeli barang-
barang tersebut dalam 30
hari terakhir?
Jelas
32a Apakah Anda mengalami
efek samping atau keluhan
akibat minum obat TB
selama pengobatan
(MDR-)TB?
Jika Tidak, lanjut ke P33
Ya / Tidak Efek samping adalah permasalahan
kesehatan tambahan yang muncul
selama pengobatan (MDR-) TB dan
kemungkinan berhubungan dengan
pengobatan
32b Jika YA: Apakah Anda
sampai menghentikan
minum obat TB karena
keluhan tersebut dan butuh
pengobatan untuk
mengatasinya? Termasuk
perubahan regimen obat
TB!
Jelas
32c Jika YA, Berapa perkiraan
biaya yang Anda
keluarkan untuk membeli
obat untuk mengatasi efek
samping obat TB?
Jelas
Asuransi
33a Apakah Anda memiliki
asuransi kesehatan baik
dari pemerintah maupun
swasta?
Jika Tidak, lanjut ke P 34
Ya / Tidak Jelas
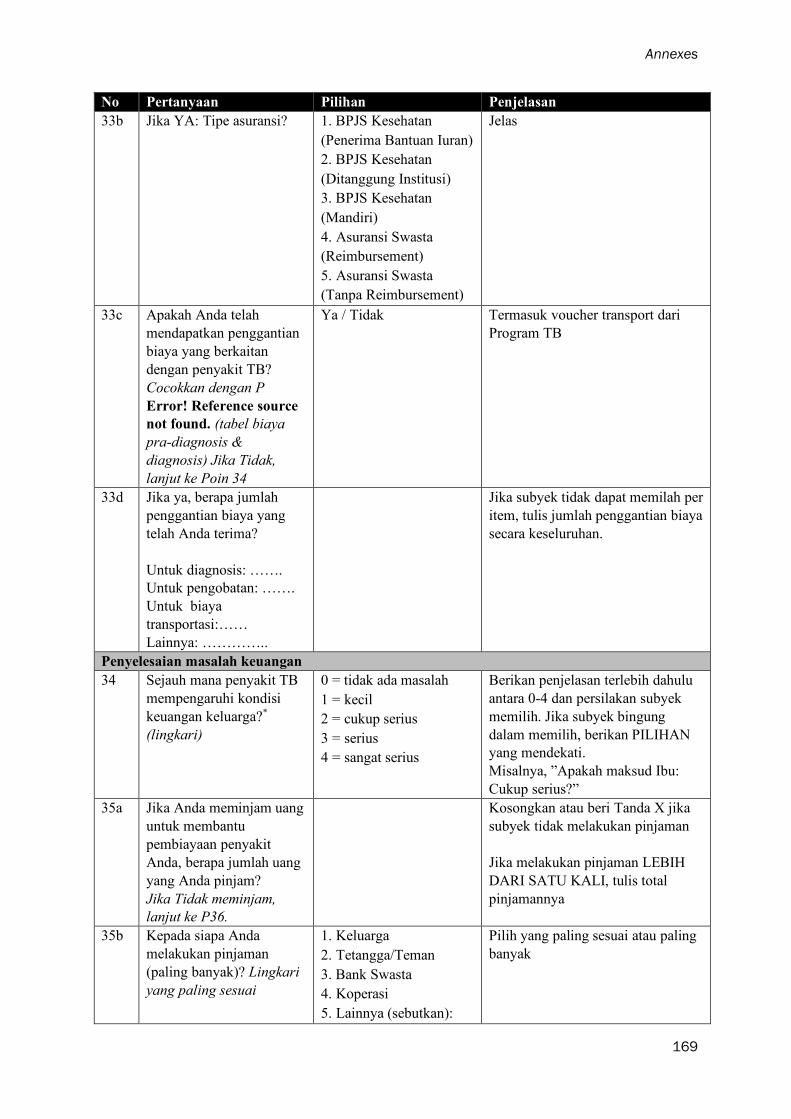
Annexes
169
No Pertanyaan Pilihan Penjelasan
33b Jika YA: Tipe asuransi? 1. BPJS Kesehatan
(Penerima Bantuan Iuran)
2. BPJS Kesehatan
(Ditanggung Institusi)
3. BPJS Kesehatan
(Mandiri)
4. Asuransi Swasta
(Reimbursement)
5. Asuransi Swasta
(Tanpa Reimbursement)
Jelas
33c Apakah Anda telah
mendapatkan penggantian
biaya yang berkaitan
dengan penyakit TB?
Cocokkan dengan P
Error! Reference source
not found. (tabel biaya
pra-diagnosis &
diagnosis) Jika Tidak,
lanjut ke Poin 34
Ya / Tidak Termasuk voucher transport dari
Program TB
33d Jika ya, berapa jumlah
penggantian biaya yang
telah Anda terima?
Untuk diagnosis: …….
Untuk pengobatan: …….
Untuk biaya
transportasi:……
Lainnya: …………..
Jika subyek tidak dapat memilah per
item, tulis jumlah penggantian biaya
secara keseluruhan.
Penyelesaian masalah keuangan
34 Sejauh mana penyakit TB
mempengaruhi kondisi
keuangan keluarga?*
(lingkari)
0 = tidak ada masalah
1 = kecil
2 = cukup serius
3 = serius
4 = sangat serius
Berikan penjelasan terlebih dahulu
antara 0-4 dan persilakan subyek
memilih. Jika subyek bingung
dalam memilih, berikan PILIHAN
yang mendekati.
Misalnya, ”Apakah maksud Ibu:
Cukup serius?”
35a Jika Anda meminjam uang
untuk membantu
pembiayaan penyakit
Anda, berapa jumlah uang
yang Anda pinjam?
Jika Tidak meminjam,
lanjut ke P36.
Kosongkan atau beri Tanda X jika
subyek tidak melakukan pinjaman
Jika melakukan pinjaman LEBIH
DARI SATU KALI, tulis total
pinjamannya
35b Kepada siapa Anda
melakukan pinjaman
(paling banyak)? Lingkari
yang paling sesuai
1. Keluarga
2. Tetangga/Teman
3. Bank Swasta
4. Koperasi
5. Lainnya (sebutkan):
Pilih yang paling sesuai atau paling
banyak
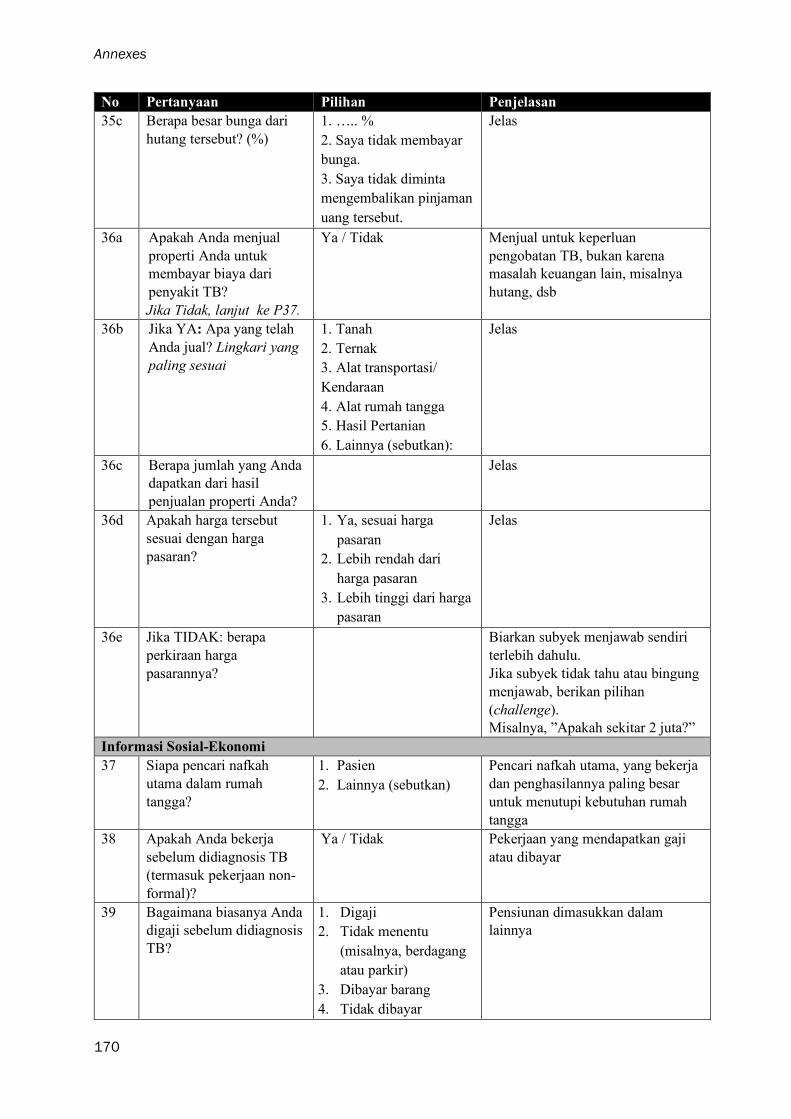
Annexes
170
No Pertanyaan Pilihan Penjelasan
35c Berapa besar bunga dari
hutang tersebut? (%)
1. ….. %
2. Saya tidak membayar
bunga.
3. Saya tidak diminta
mengembalikan pinjaman
uang tersebut.
Jelas
36a Apakah Anda menjual
properti Anda untuk
membayar biaya dari
penyakit TB?
Jika Tidak, lanjut ke P37.
Ya / Tidak Menjual untuk keperluan
pengobatan TB, bukan karena
masalah keuangan lain, misalnya
hutang, dsb
36b Jika YA: Apa yang telah
Anda jual? Lingkari yang
paling sesuai
1. Tanah
2. Ternak
3. Alat transportasi/
Kendaraan
4. Alat rumah tangga
5. Hasil Pertanian
6. Lainnya (sebutkan):
Jelas
36c Berapa jumlah yang Anda
dapatkan dari hasil
penjualan properti Anda?
Jelas
36d Apakah harga tersebut
sesuai dengan harga
pasaran?
1. Ya, sesuai harga
pasaran
2. Lebih rendah dari
harga pasaran
3. Lebih tinggi dari harga
pasaran
Jelas
36e Jika TIDAK: berapa
perkiraan harga
pasarannya?
Biarkan subyek menjawab sendiri
terlebih dahulu.
Jika subyek tidak tahu atau bingung
menjawab, berikan pilihan
(challenge).
Misalnya, ”Apakah sekitar 2 juta?”
Informasi Sosial-Ekonomi
37 Siapa pencari nafkah
utama dalam rumah
tangga?
1. Pasien
2. Lainnya (sebutkan)
Pencari nafkah utama, yang bekerja
dan penghasilannya paling besar
untuk menutupi kebutuhan rumah
tangga
38 Apakah Anda bekerja
sebelum didiagnosis TB
(termasuk pekerjaan non-
formal)?
Ya / Tidak Pekerjaan yang mendapatkan gaji
atau dibayar
39 Bagaimana biasanya Anda
digaji sebelum didiagnosis
TB?
1. Digaji
2. Tidak menentu
(misalnya, berdagang
atau parkir)
3. Dibayar barang
4. Tidak dibayar
Pensiunan dimasukkan dalam
lainnya

Annexes
171
No Pertanyaan Pilihan Penjelasan
5. Lainnya ..............
40 Apakah Anda harus
mengganti atau berhenti
dari pekerjaan pada saat
Anda mengidap TB?
Ya / Tidak Jelas
41 Bila Anda masih bekerja,
berapa hari rata-rata Anda
absen dari pekerjaan Anda
dalam sebulan, pada 3
bulan terakhir, sejak Anda
sakit TB?
… Hari Jelas
42 Jika jawaban untuk P 41
adalah “1 hari” atau
lebih:
Apakah seseorang
melakukan pekerjaan yang
seharusnya Anda
kerjakan?
1. Ya, anggota keluarga
2. Ya, orang lain
3. Tidak ada
Jelas
43 Apakah ada orang lain
yang melakukan pekerjaan
rumah tangga Anda dan
Anda membayarnya
karena Anda mengidap
TB?
1. Tidak
2. Ya, jumlah total
(sampai sekarang)
Jelas
44a Berapa anggota keluarga
yang tinggal bersama
Anda dalam satu rumah?
Jelas
44b Apakah ada seorang yang
khusus tinggal di rumah
Anda untuk mengurus
Anda?
Jika TIDAK, lanjut ke P47
Ya / Tidak Orang yang ditunjuk khusus untuk
merawat pasien
44c Jika YA: untuk berapa
lama?
... Minggu Jelas
44d Apakah mereka berhenti
mencari nafkah untuk
tinggal di rumah dan
mengurus Anda?
Ya / Tidak Jelas
44e Apakah Anda membayar
seseorang untuk mengurus
Anda?
Jika ya, berapa nilai tunai
atau dalam nilai ?
Ya / Tidak
….. (Rp)
KHUSUS jika ada orang yang
DIBAYAR
45 Apakah ada anggota
keluarga (termasuk anak-
anak atau anak di bawah
usia sekolah) yang harus
Ya / Tidak Karena subyek sakit, maka apakah
ada orang lain yang HARUS
BEKERJA?
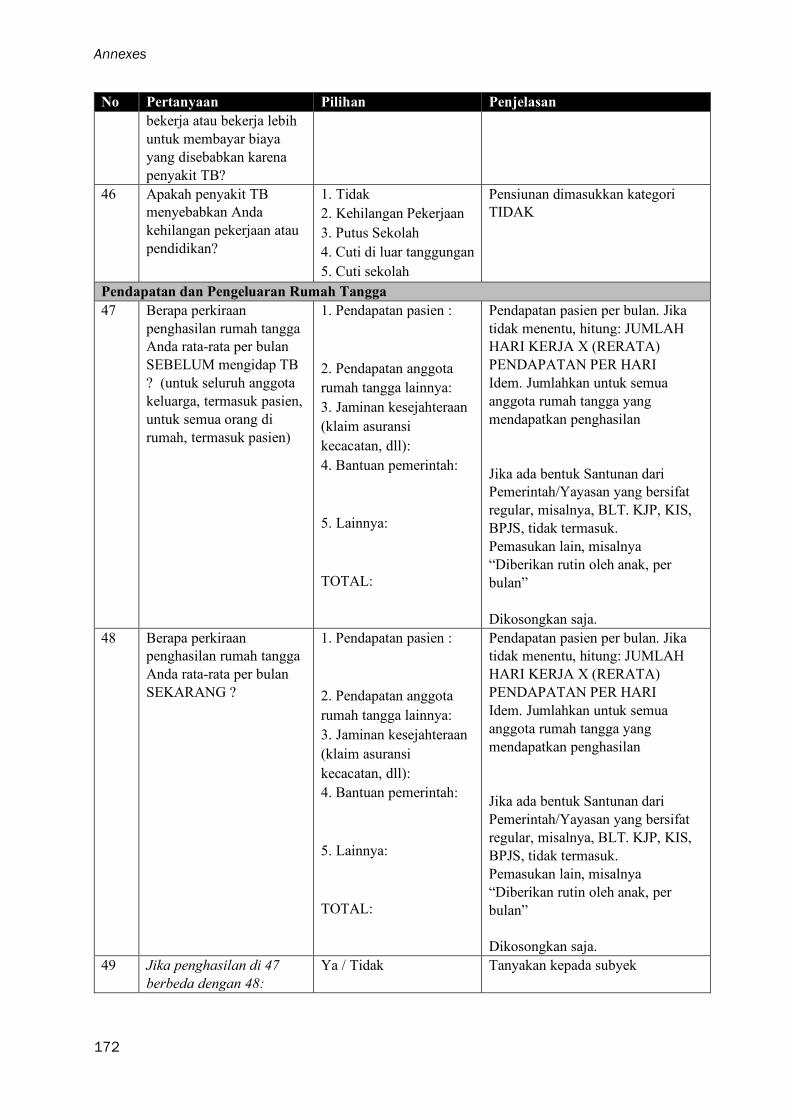
Annexes
172
No Pertanyaan Pilihan Penjelasan
bekerja atau bekerja lebih
untuk membayar biaya
yang disebabkan karena
penyakit TB?
46 Apakah penyakit TB
menyebabkan Anda
kehilangan pekerjaan atau
pendidikan?
1. Tidak
2. Kehilangan Pekerjaan
3. Putus Sekolah
4. Cuti di luar tanggungan
5. Cuti sekolah
Pensiunan dimasukkan kategori
TIDAK
Pendapatan dan Pengeluaran Rumah Tangga
47 Berapa perkiraan
penghasilan rumah tangga
Anda rata-rata per bulan
SEBELUM mengidap TB
? (untuk seluruh anggota
keluarga, termasuk pasien,
untuk semua orang di
rumah, termasuk pasien)
1. Pendapatan pasien :
2. Pendapatan anggota
rumah tangga lainnya:
3. Jaminan kesejahteraan
(klaim asuransi
kecacatan, dll):
4. Bantuan pemerintah:
5. Lainnya:
TOTAL:
Pendapatan pasien per bulan. Jika
tidak menentu, hitung: JUMLAH
HARI KERJA X (RERATA)
PENDAPATAN PER HARI
Idem. Jumlahkan untuk semua
anggota rumah tangga yang
mendapatkan penghasilan
Jika ada bentuk Santunan dari
Pemerintah/Yayasan yang bersifat
regular, misalnya, BLT. KJP, KIS,
BPJS, tidak termasuk.
Pemasukan lain, misalnya
“Diberikan rutin oleh anak, per
bulan”
Dikosongkan saja.
48 Berapa perkiraan
penghasilan rumah tangga
Anda rata-rata per bulan
SEKARANG ?
1. Pendapatan pasien :
2. Pendapatan anggota
rumah tangga lainnya:
3. Jaminan kesejahteraan
(klaim asuransi
kecacatan, dll):
4. Bantuan pemerintah:
5. Lainnya:
TOTAL:
Pendapatan pasien per bulan. Jika
tidak menentu, hitung: JUMLAH
HARI KERJA X (RERATA)
PENDAPATAN PER HARI
Idem. Jumlahkan untuk semua
anggota rumah tangga yang
mendapatkan penghasilan
Jika ada bentuk Santunan dari
Pemerintah/Yayasan yang bersifat
regular, misalnya, BLT. KJP, KIS,
BPJS, tidak termasuk.
Pemasukan lain, misalnya
“Diberikan rutin oleh anak, per
bulan”
Dikosongkan saja.
49 Jika penghasilan di 47
berbeda dengan 48:
Ya / Tidak Tanyakan kepada subyek
Annexes
173
No Pertanyaan Pilihan Penjelasan
Apakah perubahan ini
sebagai akibat dari
penyakit TB?
Indikator Sosial Ekonomi
50 Apakah ada anggota
keluarga yang saat ini
memiliki aset berikut yang
dapat digunakan ?
Ya / Tidak Sebutkan perkiraan nilai dari
kekayaan tersebut saat ini
(diusahakan)
Jika tidak dapat menyebutkan
nilainya, sebutkan jenis, jumlah
atau ukurannya
15. Mobil
16. Sepeda motor
17. Kulkas/ freezer
18. AC
19. Perhiasan emas
20. Rumah
21. Tanah
22. Tanah pertanian
23. Telepon / HP
24. Saham
perusahaan/Investasi
25. Ternak
26. Alat pertanian
27. Bisnis non pertanian
28. Daya listrik di rumah
(Watt)
450 900
1300 2200
> 2200
Jika tidak tahu daya watt-nya,
LIHAT barang elektronik yang ada
di rumah. Jika ada AC, diasumsikan
>1300. Jika mendapat subsidi (tidak
bayar), diasumsikan 450.
Pertanyaan tambahan
1 Pernahkah Anda
mendengar tentang
proteksi sosial?
Ya / Tidak Jelas
a. Jika Ya, apa yang
Anda pahami dengan
proteksi sosial?
Apakah Anda dapat
jelaskan?
b. Jika TIDAK. Lanjut
pertanyaan berikutnya
Jelas
2 Dengan biaya yang
dikeluarkan untuk
mendapatkan pengobatan
TB, bagian biaya yang
mana yang membuat Anda
merasa mengalami
kesulitan finansial dan
berapa Rupiah yang Anda
1. Biaya konsultasi
(bayar sendiri)
2. Obat-obatan (bayar
sendiri)
3. Transportasi
4. Akomodasi
Biarkan subyek menjawab sendiri
terlebih dahulu.
Jika subyek merasa tidak ada yang
perlu ditanggung, KOSONGKAN.
Jika subyek bingung, berikan
pertanyaan satu per satu dan
Annexes
174
No Pertanyaan Pilihan Penjelasan
inginkan untuk dapat
ditanggung oleh
Pemerintah?
5. Makanan, snack,
minuman (saat
kunjungan)
6. Makanan dan
suplementasi
7. Kehilangan
pendapatran atau biaya
produktivitas
8. Biaya orang yang
menemani
9. Pengobatan penyakit
lainnya (jika ada)
dijawab (Ya/Tidak), kemudian
sebutkan jumlah yang menurut
subyek perlu ditanggung.
Upayakan bertanya ITEM yang
TERLIHAT MEMBERATKAN
pada pertanyaan-pertanyaan
sebelumnya terlebih dahulu.
Misalnya, subyek mengeluarkan
biaya transport besar, sedangkan
tidak mengeluarkan biaya makan.
Maka, tanyakan ”Apakah biaya
transportasi perlu ditanggung?”,
bukan biaya makan
Penutup
Terima kasih atas
kerjasama Anda! Apakah
ada yang ingin Anda
tanyakan atau katakan?
Jelas
Komentar oleh
pewawancara
Antusiasme subyek 0 Sama sekali tidak
antusias
1
2
3
4
5 Sangat antusias
Jelas. Pilih salah satu
………………………….. Diisi jika ada komentar khusus
lainnya.
Jelas
Fuady et al. Acta Medica Indonesiana. 2018; 50 (1), 3-10

Annexes
175
Annex D
Reasons for not choosing public facilities at the first contact
Reason Urban
n (%)
Sub-urban
n (%)
Rural
n (%)
Total
n (%)
Distance to facility 7 (21) 10 (25) 15 (30) 32 (26)
Accustomed to private facility 4 (12) 7 (18) 14 (28) 25 (20)
Mistrust towards public facility 4 (12) 5 (13) 4 (8) 13 (11)
No public facility available 2 (6) 4 (10) 5 (10) 11 (9)
Long waiting time 4 (12) 2 (5) 1 (2) 7 (6)
Did not know PHC offered free TB service 1 (3) 1 (3) 5 (10) 7 (6)
Assumed patient had common cough, not TB 3 (9) 0 (0) 2 (4) 5 (4)
No answer 3 (9) 2 (5) 0 (0) 5 (4)
PHC had limited working hours 1 (3) 1 (3) 1 (2) 3 (2)
Others 4 (12) 8 (20) 3 (6) 15 (12)
Fuady et al. Infectious Diseases of Poverty (2018) 7:3

Annexes
176
Fuady, et al. In Review
Dir
ect
Med
ical
Cost
sP
Tra
vel
cost
sP
Food
cost
sP
Tota
l co
sts
P
PH
C5.
4 (3
.3-7
.4)
1.8
(1.2
-2.4
)0.
6 (0
.4-0
.8)
14 (
10-1
7)
Pri
vate
clin
ics
21.4
(14
.6-2
8.1)
<0.
001
2.7
(1.8
-3.5
)0.
087
0.7
(0.4
-1.0
)0.
424
32 (
23-4
1)<
0.00
1
Pub
lic h
ospi
tals
8.9
(3.4
-14.
4)0.
408
2.5
(1.5
-3.4
)0.
274
1.1
(0.5
-1.7
)0.
094
18 (
9-27
)0.
376
Pri
vate
hos
pita
ls32
.4 (
17.3
-47.
5)<
0.00
12.
6 (0
.7-4
.5)
0.18
00.
7 (-
0.2-
1.6)
0.58
037
(22
-52)
0.00
1
Oth
ers
12.1
(2.
1-22
.2)
0.36
62.
1 (0
.6-3
.6)
0.72
50.
3 (-
0.1-
0.6)
0.63
018
(7-
29)
0.58
6

Annexes
177
Fuady et al. Infectious Diseases of Poverty (2019) 8:10
Sim
ula
ted
hy
po
thetic
al sc
en
ario
100%
90%
80%
70%
60%
TB
Base
line (n
o c
ash
tran
sfer)
36 (3
1‒42)
--
--
Tra
nsp
orta
tion
co
sts28 (2
3‒33)
29 (2
5‒35)
30 (2
5‒35)
30 (2
5‒36)
32 (2
7‒37)
Fo
od‒
sup
ple
men
t co
sts26 (2
1‒30)
26 (2
2‒31)
26 (2
1‒31)
27 (2
2‒32)
27 (2
3‒32)
Inco
me lo
ssa
26 (2
1‒30)
27 (2
2‒31)
28 (2
3‒33)
30 (2
5‒35)
31 (2
6‒36)
Inco
me lo
ssb
17 (1
3‒21)
18 (1
4‒23)
20 (1
6‒25)
23 (1
8‒27)
25 (2
0‒30)
Tra
nsp
orta
tion
co
sts an
d in
co
me lo
ss17 (1
3‒22)
19 (1
4‒23)
21 (1
7‒26)
22 (1
8‒27)
26 (2
2‒30)
Fo
od-su
pple
men
t co
sts an
d in
co
me lo
ss16 (1
2‒20)
18 (1
4‒22)
18 (1
4‒23)
20 (1
6‒25)
22 (1
7‒27)
Tra
nsp
orta
tion
, foo
d su
pple
men
t, an
d in
co
me lo
ss11 (8
‒15)
12 (9
‒15)
14 (1
0‒18)
16 (1
2‒20)
19 (1
5‒23)
MD
R-T
B
Base
line (n
o c
ash
tran
sfer)
83 (7
3‒92)
--
--
Tra
nsp
orta
tion
co
sts59 (4
7‒71)
63 (5
0‒74)
67 (5
6‒78)
69 (5
7‒81)
73 (6
4‒84)
Fo
od-su
pple
men
t co
sts77 (6
5‒87)
78 (6
8‒88)
78 (6
8‒88)
78 (6
8‒88)
78 (6
8‒88)
Inco
me lo
ssa
58 (4
6‒70)
63 (5
1‒74)
67 (5
5‒79)
73 (6
2‒85)
73 (6
3‒84)
Inco
me lo
ssb
52 (3
9‒65)
56 (4
4‒68)
61 (4
9‒73)
69 (5
7‒81)
69 (5
8‒80)
Tra
nsp
orta
tion
co
sts an
d in
co
me lo
ss28 (1
8‒40)
33 (2
2‒44)
38 (2
7‒50)
47 (3
5‒59)
53 (4
2‒66)
Fo
od-su
pple
men
t co
sts an
d in
co
me lo
ss53 (4
1‒66)
55 (4
2‒67)
63 (5
1‒75)
64 (5
2‒76)
70 (6
0‒81)
Tra
nsp
orta
tion
, foo
d su
pple
men
t, an
d in
co
me lo
ss23 (1
3‒35)
31 (2
0‒42)
34 (2
3‒47)
38 (2
6‒49)
47 (3
6‒60)
Incid
en
ce o
f ca
tastr
op
hic
co
sts if pa
tien
ts receiv
ed
X p
ercen
t of
po
ten
tial c
ash
tra
nsfe
r, %
(95
% C
I)
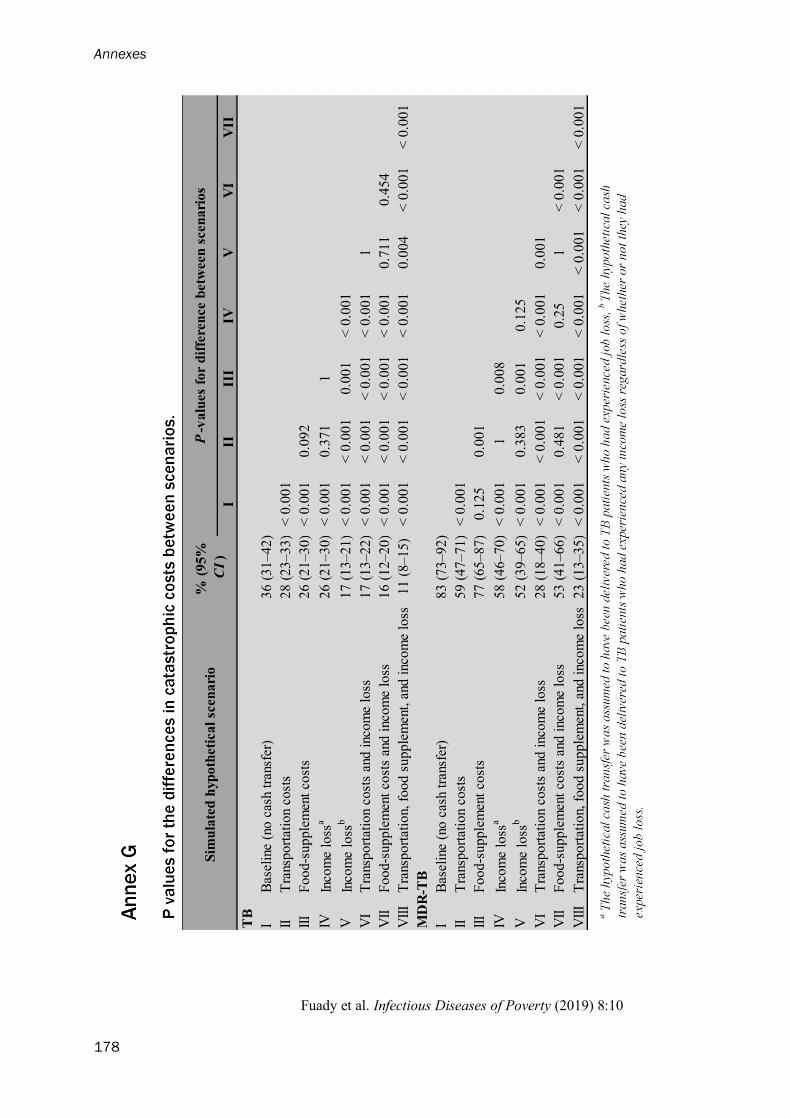
Annexes
178
Fuady et al. Infectious Diseases of Poverty (2019) 8:10
III
III
IVV
VI
VII
IB
asel
ine
(no
cas
h tr
ansf
er)
36
(3
1‒4
2)
IIT
rans
po
rtat
ion
cost
s2
8 (
23
‒3
3)
< 0
.00
1
III
Fo
od-s
up
ple
men
t co
sts
26
(2
1‒3
0)
< 0
.00
10
.09
2
IVIn
com
e lo
ssa
26
(2
1‒3
0)
< 0
.00
10
.37
11
VIn
com
e lo
ssb
17
(1
3‒2
1)
< 0
.00
1<
0.0
01
0.0
01
< 0
.00
1
VI
Tra
nsp
ort
atio
n co
sts
and
inc
om
e lo
ss1
7 (
13
‒2
2)
< 0
.00
1<
0.0
01
< 0
.00
1<
0.0
01
1
VII
Fo
od-s
up
ple
men
t co
sts
and
inc
om
e lo
ss1
6 (
12
‒2
0)
< 0
.00
1<
0.0
01
< 0
.00
1<
0.0
01
0.7
11
0.4
54
VII
IT
rans
po
rtat
ion,
fo
od s
up
ple
men
t, a
nd i
nco
me
loss
11
(8
‒15
)<
0.0
01
< 0
.00
1<
0.0
01
< 0
.00
10
.00
4<
0.0
01
< 0
.00
1
IB
asel
ine
(no
cas
h tr
ansf
er)
83
(7
3‒9
2)
IIT
rans
po
rtat
ion
cost
s5
9 (
47
‒7
1)
< 0
.00
1
III
Fo
od-s
up
ple
men
t co
sts
77
(6
5‒8
7)
0.1
25
0.0
01
IVIn
com
e lo
ssa
58
(4
6‒7
0)
< 0
.00
11
0.0
08
VIn
com
e lo
ssb
52
(3
9‒6
5)
< 0
.00
10
.38
30
.00
10
.12
5
VI
Tra
nsp
ort
atio
n co
sts
and
inc
om
e lo
ss2
8 (
18
‒4
0)
< 0
.00
1<
0.0
01
< 0
.00
1<
0.0
01
0.0
01
VII
Fo
od-s
up
ple
men
t co
sts
and
inc
om
e lo
ss5
3 (
41
‒6
6)
< 0
.00
10
.48
1<
0.0
01
0.2
51
< 0
.00
1
VII
IT
rans
po
rtat
ion,
fo
od s
up
ple
men
t, a
nd i
nco
me
loss
23
(1
3‒3
5)
< 0
.00
1<
0.0
01
< 0
.00
1<
0.0
01
< 0
.00
1<
0.0
01
< 0
.00
1
Sim
ula
ted
hyp
oth
eti
ca
l sc
en
ari
o%
(9
5%
CI
)
P-v
alu
es
for
dif
fere
nce b
etw
een
scen
ari
os
TB
MD
R-T
B

Annexes
179
Annex H
The incidence of catastrophic costs between poor and non-poor if TB patients
received 90%, 80%, 70% and 60% of the potential cash transfers
Fuady et al. Infectious Diseases of Poverty (2019) 8:10
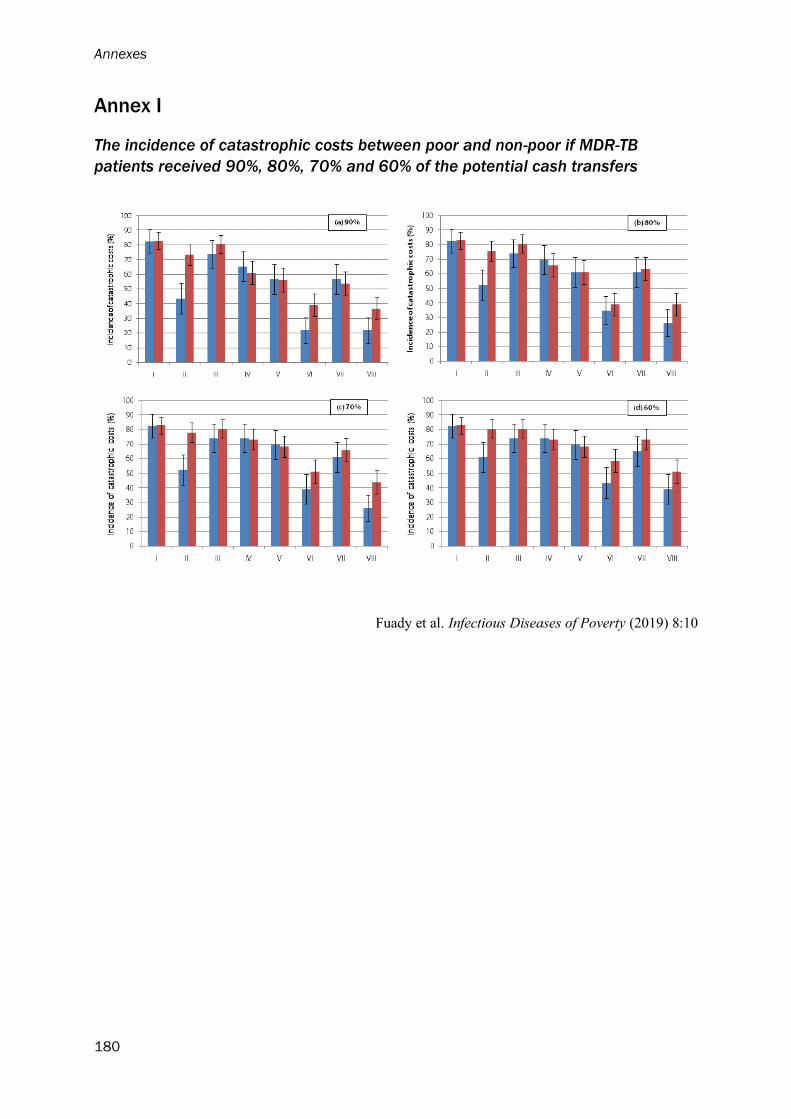
Annexes
180
Annex I
The incidence of catastrophic costs between poor and non-poor if MDR-TB
patients received 90%, 80%, 70% and 60% of the potential cash transfers
Fuady et al. Infectious Diseases of Poverty (2019) 8:10

List of publications
181
List of Publications
Articles in this PhD project
1. Ahmad Fuady, Tanja A.J. Houweling, Muchtaruddin Mansyur, Jan Hendrik Richardus. Adaptation
of the Tool to Estimate Patient Costs Questionnaire into Indonesian Context for Tuberculosis-
affected Households. Actamedica Indonesiana 2018;50(1): 3-10.
2. Ahmad Fuady, Tanja A.J. Houweling, Muchtaruddin Mansyur, Jan Hendrik Richardus.
Catastrophic total costs in tuberculosis-affected households and their determinants since
Indonesia’s implementation of universal health coverage. Infectious Diseases of Poverty.
2018;7(1): 3.
3. Ahmad Fuady, Tanja A.J. Houweling, Muchtaruddin Mansyur, Erlina Burhan, Jan Hendrik
Richardus. Cost of seeking care for tuberculosis since the implementation of universal health
coverage in Indonesia. (In review)
4. Ahmad Fuady, Tanja A.J. Houweling, Muchtaruddin Mansyur, Erlina Burhan, Jan Hendrik
Richardus. Catastrophic costs due to tuberculosis worsen treatment outcomes: a prospective cohort
study in Indonesia. (In review)
5. Ahmad Fuady, Tanja A.J. Houweling, Muchtaruddin Mansyur, Erlina Burhan, Jan Hendrik
Richardus. Effect of financial support on reducing the incidence of catastrophic costs among
tuberculosis-affected households in Indonesia: eight simulated scenarios. Infectious Diseases of
Poverty. 2019 8:10
Articles in other projects
1. Soumyava Basu, Rina La Distia Nora, Narsing A Rao, Xuejuan Jiang, Ahmad Fuady. Prognostic
factors for TB-associated uveitis in the Asia-Pacific Region: results of a modified Delphi survey.
Eye. 2020. doi:10.1038/s41433-019-0743-1.
2. Boy Subirosa Sabarguna, Ahmad Fuady. Prospective e-library at the faculty of medicine.
Advanced Science Letters. 2017; 23(4): 3733-7.
3. Prima Almazini, Bambang Budi Siswanto, Markus Meyer, Mardiati Nadjib, Isman Firdaus, Ahmad
Fuady, Paola Antonini, Salvatore Di Somma. An health economic evaluation of using N-terminal
pro brain natriureticpeptide for the management of acute heartfailure: a pilot study in Indonesian
tertiary referral hospital. Emergency Care Journal 2019; 15:7919.
4. Ibrahim Agung, Nyoman Murdana, Ruliando Hasea Purba, Ahmad Fuady. Low-level laser therapy
and dry needling for myofascial pain syndrome of the upper trapezius muscle: an interventional
study. IOP Conf. Series: Journal of Physics: Conf. Series 1073 (2018) 062045.
Books and Book Chapters
1. Ahmad Fuady. Arsitektur jaminan kesehatan Indonesia: capaian, kritik dan tantangan masa depan.
Jakarta: Sagung Seto. 2019.
2. Endang Basuki, Ahmad Fuady, Sylvia D. Elvira. Komunikasi dalam penanganan masalah
tuberculosis. In: Mora Claramita, Astrid P Susilo, Marcy Rosenbaum, Jan van Dalen. Komunikasi
petugas kesehatan dan pasien dalam konteks budaya Asia Tenggara. Jakarta: EGC. 2017.
About the author
182
About the author
Ahmad Fuady was born on April 7, 1986, in Jakarta, Indonesia. Graduated from Al-
Bayan Islamic Boarding School (Pesantren), Sukabumi, West Java, in 2003, he
continued his study in the Faculty of Medicine, Universitas Indonesia, Jakarta. In 2009,
he obtained his medical doctor degree. Instead of following his degree to become a
medical specialist, he decided to pursue his interest in the health system to improve
Indonesian population health through academic work. He joined as a junior faculty
member in the Department of Community Medicine, Faculty of Medicine, Universitas
Indonesia in 2010.
In 2012, he continued his study in health economics, policy, and law in Erasmus
University Rotterdam, The Netherlands. After graduated from this master's program in
2013, he came back to Indonesia when his country was preparing its national health
insurance through Jaminan Kesehatan Nasional to attain universal health coverage. He
was involved in some economic evaluation studies and program evaluation and had
started to write health policy articles in Indonesian national newspapers. His Master’s
thesis, ‘Moving towards universal health coverage in Indonesia: where is the position?’
was published as a reference book in Bahasa Indonesia, ‘Jaminan Kesehatan Universal
dan Pemenuhan Hak Kesehatan’. During this period, he was awarded the Young
Scientist Award by the Faculty of Medicine, Universitas Indonesia in 2015.
In April 2016, he started the Ph.D. program at the Department of Public Health,
Erasmus MC, University Medical Center Rotterdam, The Netherlands, focusing on the
socioeconomic impact of tuberculosis in Indonesia. He is still active in producing
opinion articles in national newspapers and writing books. During his Ph.D. program,
he wrote a book chapter on patient-doctor communication focusing on tuberculosis and
a reference book about Indonesian national health coverage – both in Bahasa Indonesia.

Acknowledgement
183
Acknowledgement
When I almost graduated from my postgraduate degree in health economics, policy, and
law in 2013, I sent an email to a professor who then invited me to his room to present
my idea. He listened to me carefully and granted me an acceptance to supervise, teach,
and guide me on this journey. He is Prof. Jan Hendrik Richardus, who patiently issued
my requests several times to defer the starting date of my Ph.D. program because of the
lengthy, uncertain scholarship procedure. Thank you for your guidance, valuable
advice, and inspiration during this journey.
Next to Jan Hendrik, there is always Tanja A.J. Houweling, who has guided me in detail.
Her comments have always been constructive, valuable, and encouraging. Tanja is not
only a good, strong co-supervisor. She is also my family friend, who has offered bits of
help to my wife and my children. It is fantastic to know that Tanja also has Indonesian
background – had researched in Jakarta, had learned Bahasa in Salatiga, speaks Bahasa
well, and has a good relationship with my teachers (Firman Lubis, Joedo Prihartono,
and Setyawati Budiningsih). Thank you for all your very kind support through this
Ph.D. program.
To Sake de Vlas, Wilma Stolk, Luc Coffeng, Jan Hontelez, David Blok, Anuj Tiwari,
Caroline Bulstra, Unnati Saha, and all colleagues in the Infectious Diseases section,
thanks to valuable inputs, criticism, and support to my study and life. To statisticians
who always help me to solve the number: Caspar Looman and Daan Nieboer.
To my local supervisors in Indonesia: Muchtaruddin Mansyur – who always supports
my decisions – and Erlina Burhan – who has introduced me to tuberculosis research. I
owe you a lot and have no idea how to repay all your kindness. Also, Trevino A. Pakasi,
who opened a network to The Netherlands and had thrown me into many projects that
have encouraged me to learn more. To Herqutanto and Boy Subirosa Sabarguna, my
senior colleagues in the Department of Community Medicine who supported me to join
the department. To Prof. Endang Basuki, (alm) Prof. Azrul Azwar, (alm) Prof. Firman
Lubis, Prof. Bastaman Basuki, Joedo Prihartono, Setyawati Budiningsih, Astrid
Sulistomo, Dewi Soemarko, Dhanasari Vidyawati, Judilherry Justam, Zarni Amri, Nani
Cahyani, Ambar Roestam, Erlaini, and Anindiarti; my teachers and senior colleagues
who have been patiently guided and supported me working in the department. Also,
Indah Suci, Asti Werdhani, Dian Kusumadewi, Agus Sugiharto, Aria Kekalih, Nuri

Acknowledgement
184
Purwito, Dewi Friska, Listya Tresnanti, Grace Wangge, Nora Sutarina, Ade Tobing,
Levina Chandra, Nuril Haya, Rodri Tanoto, and all my colleagues in the department
including administration staffs (Ade, Supriyanto, Deni, Nuzulia, Yanti, Fahyuni). To
my Deans: Prof. Ratna Sitompul and Prof. Ari Fahrial. To my supporters: Prof.
Hasbullah Thabrany, Diah Handayani, Emie Suhermi, and all my surveyor teams and
my students who had involved a lot in my studies.
Starting a new life in Rotterdam was very hard, but it has become more comfortable
with help from my Indonesian colleagues in Indonesische Stichting Rotterdam.
Arriving at the mosque in 2010, they opened their hands warmly and as quick has
recognized me as a part of their family. Great thanks to my teacher (alm) Sofjan Siregar,
Tante Tuty, Mas Yono, Mbak Aty and their families. My super landlord bapak-ibu kos:
Roland-Mirdayanti family. Parents of my Iqra students: Ka Elsye, Arti, Rismi, Laila,
and Sinta. Ce Ani, Bude Susni, Bu Junus, Uni Lenggo-Om Teddy, Bu Taty-Om Luki,
Tante Wieke-Om Iwan, Mbak Maeyta-Bli Wayan, Habib-Linda, Om Doddy, tante Fitri,
and all of the family members of Indonesische Stichting Rotterdam who have
continuously provided kind supports to my family and me. Friends in Rotterdam:
Asjone Martin, Kang Opik and Teh Dowty, Fatih Anfasa-Salma Oktaria, Haji Widagdo,
Haji Rayya, Adi Nugroho, Meditya, Teh Azzania, Hakim Saifudin, Teh Bony, Bu Yulia,
Mbak Rina LaDis, Adhit, Bri, Andie-Vicky, Titis, Novika, Akmal, Arief, Jaka, Fikru,
and all my friends in Rotterdam. To my paranymphs: Pugo Sambodo ‘my compatriot’
and Saroucha Youy ‘my friend since Latvia’, thank your kindness to guide me in the
middle of stressful Ph.D. jungle.
My steps to Rotterdam would not start without a very long, continuous, uninterrupted
prayers from my beloved parents. I am nothing without them who pour out their
perpetual affection since my birth to this second. My dear Ayah: (alm) Hasuki Nasir –
my patron, my teacher, with his endless patience to me. My beloved Mami: Ikrimah
Rahmatullah Shiddiq – my sunshine, my light, my door opener, my home with all her
prayers to Allah. Nothing can repay your love. May Allah reward you with the best
thing in your life and hereafter. Also, to my family: all my big brothers and big sisters.
Bung Itqon, Ka Tsauroh, Ka Yatmi, Ka Rif’ah, Ka Syafaah, Ka Irfan, Ka Nurfadhilah,
Ka Ahmad Fadhil, and Ka Akmal. They have taken care of me – the youngest member
in big 10 – from my little, naughty boy to this adulthood. To my brothers and sisters-
in-law and my nieces.
Acknowledgement
185
And, the essential part of my life: my little family. My lovely wife – Diah Martina who
has accompanied me through rain and storm, up and down, sad and happy, friendship
and quarreling, patience and ager, as well as success and failure. I owe a life to you
since you accepted my proposal to become a partner in my life. My beloved sons: Birru
Syaikhul Ulum and Bumi Arkan Fuady. The jewels of my heart, the great cheerleaders
in the living room, the reasons to always coming back soon from works. I am sorry if I
have been too selfish and have snatched a lot of your happy childhood time; you deserve
more.
All of these things, this achievement, is nothing but to Allah – the purpose of my life,
the side I will return. To Muhammad, peace be upon him and messenger – my very first
human idol, the best model to imitate.
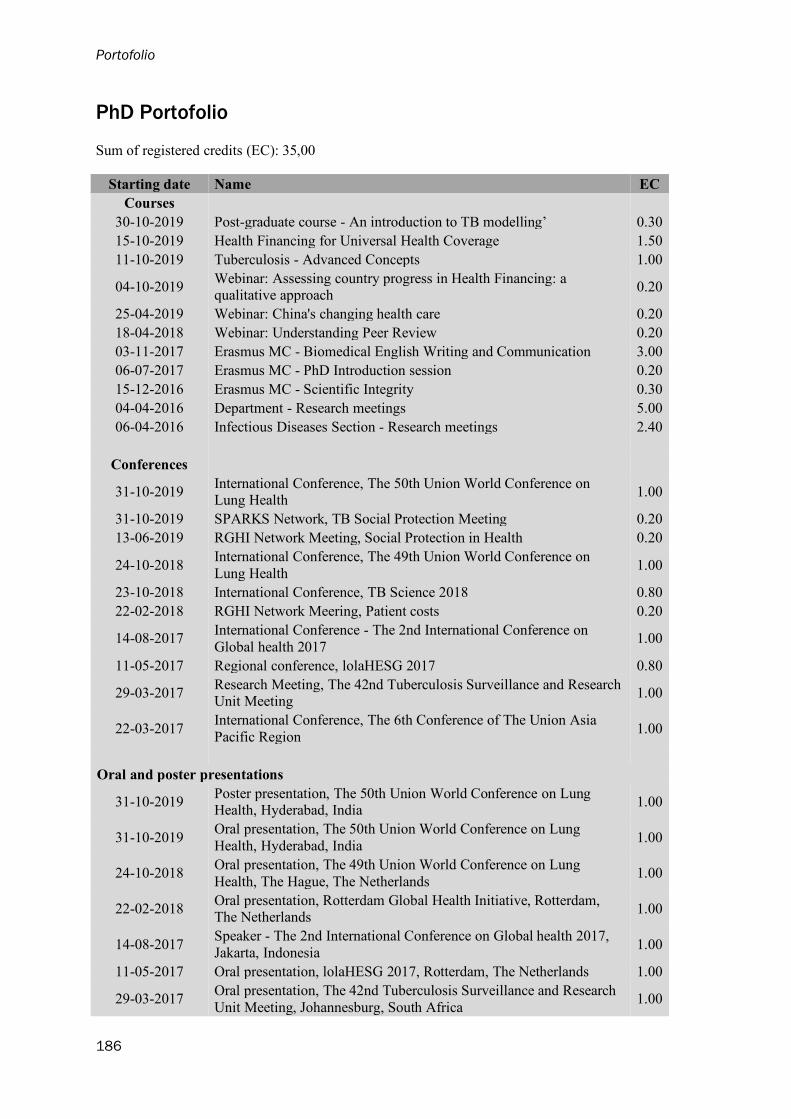
Portofolio
186
PhD Portofolio
Sum of registered credits (EC): 35,00
Starting date Name EC
Courses
30-10-2019 Post-graduate course - An introduction to TB modelling’ 0.30
15-10-2019 Health Financing for Universal Health Coverage 1.50
11-10-2019 Tuberculosis - Advanced Concepts 1.00
04-10-2019 Webinar: Assessing country progress in Health Financing: a qualitative approach
0.20
25-04-2019 Webinar: China's changing health care 0.20
18-04-2018 Webinar: Understanding Peer Review 0.20
03-11-2017 Erasmus MC - Biomedical English Writing and Communication 3.00
06-07-2017 Erasmus MC - PhD Introduction session 0.20
15-12-2016 Erasmus MC - Scientific Integrity 0.30
04-04-2016 Department - Research meetings 5.00
06-04-2016 Infectious Diseases Section - Research meetings 2.40
Conferences
31-10-2019 International Conference, The 50th Union World Conference on Lung Health
1.00
31-10-2019 SPARKS Network, TB Social Protection Meeting 0.20
13-06-2019 RGHI Network Meeting, Social Protection in Health 0.20
24-10-2018 International Conference, The 49th Union World Conference on
Lung Health 1.00
23-10-2018 International Conference, TB Science 2018 0.80
22-02-2018 RGHI Network Meering, Patient costs 0.20
14-08-2017 International Conference - The 2nd International Conference on
Global health 2017 1.00
11-05-2017 Regional conference, lolaHESG 2017 0.80
29-03-2017 Research Meeting, The 42nd Tuberculosis Surveillance and Research Unit Meeting
1.00
22-03-2017 International Conference, The 6th Conference of The Union Asia
Pacific Region 1.00
Oral and poster presentations
31-10-2019 Poster presentation, The 50th Union World Conference on Lung Health, Hyderabad, India
1.00
31-10-2019 Oral presentation, The 50th Union World Conference on Lung
Health, Hyderabad, India 1.00
24-10-2018 Oral presentation, The 49th Union World Conference on Lung
Health, The Hague, The Netherlands 1.00
22-02-2018 Oral presentation, Rotterdam Global Health Initiative, Rotterdam, The Netherlands
1.00
14-08-2017 Speaker - The 2nd International Conference on Global health 2017,
Jakarta, Indonesia 1.00
11-05-2017 Oral presentation, lolaHESG 2017, Rotterdam, The Netherlands 1.00
29-03-2017 Oral presentation, The 42nd Tuberculosis Surveillance and Research
Unit Meeting, Johannesburg, South Africa 1.00

Portofolio
187
Starting date Name EC
22-03-2017 Oral presentation, The 6th Conference of The Union Asia Pacific Region, Tokyo, Japan
1.00
Peer reviews
06-11-2019 Peer review, IJTLD 0.30
30-09-2019 Peer Review, The Royal Society of Tropical Medicine and Hygiene 0.30
03-06-2019 Peer review, BMJ Open 0.30
13-05-2019 Peer review, The Royal Society of Tropical Medicine and Hygiene 0.30
02-03-2019 Peer review, Medical Journal of Indonesia 0.30
22-02-2019 Peer review, The Royal Society of Tropical Medicine and Hygiene 0.30
28-01-2019 Peer review, BMC Public Health 0.30
25-01-2019 Peer review, BMJ Open 0.30
18-09-2018 Peer review, Plos ONE 0.30
04-09-2018 Peer review, Medical Journal of Indonesia 0.30
06-08-2018 Peer review, Medical Journal of Indonesia 0.30
Teaching
08-08-2017 Indonesian Health Financing System, teaching for undergraduate
medical students of Faculty of Medicine, Universitas Indonesia 1.00
07-08-2019 Indonesian Health Financing System, teaching for undergraduate
medical students of Faculty of Medicine, Universitas Indonesia 1.00
25-06-2019 Preparation class for medical student in the Global Health course,
posted in Indonesia
0.20