ttu group meetingmarch 20, 20131 hf radiation damage evaluation (what, how, what to do about it, and...
TRANSCRIPT

TTU Group MeetingMarch 20, 2013 1
HF Radiation Damage Evaluation (What, how, what to do about it, and what is next?)
*Phil Dudero (TTU)Nural Akchurin
March 20, 2013TTU Group Meeting

TTU Group MeetingMarch 20, 2013 2
Outline
• The HF Detector• Radiation Damage• The Laser Monitoring System• The Method• Latest Results• Plans
TTU Group MeetingMarch 20, 2013 3
The HF Detector
TTU Group MeetingMarch 20, 2013 4
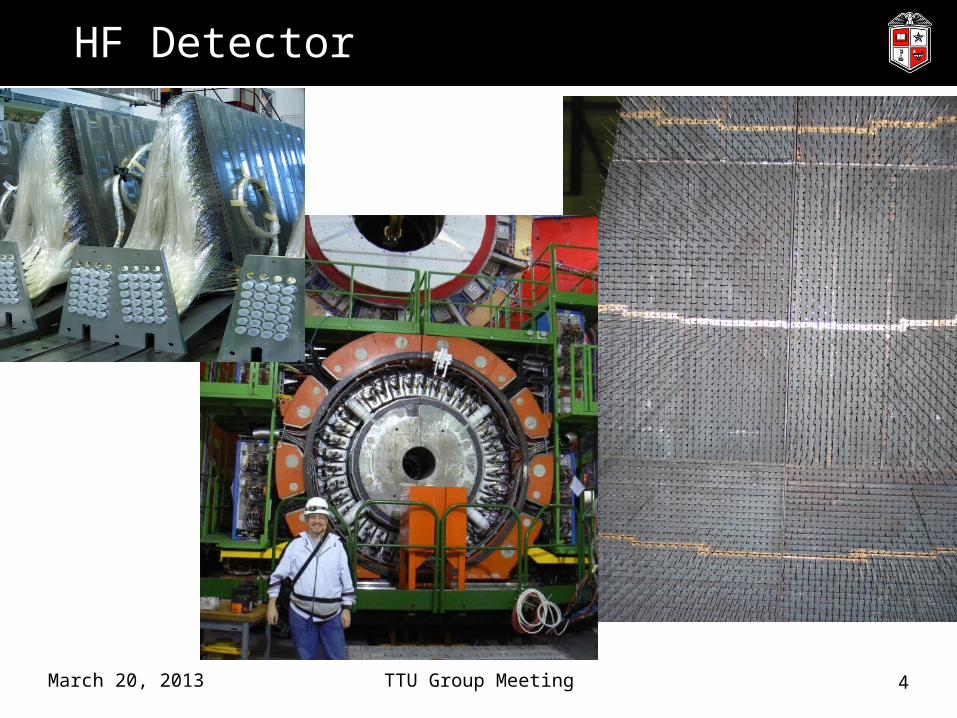
HF Detector
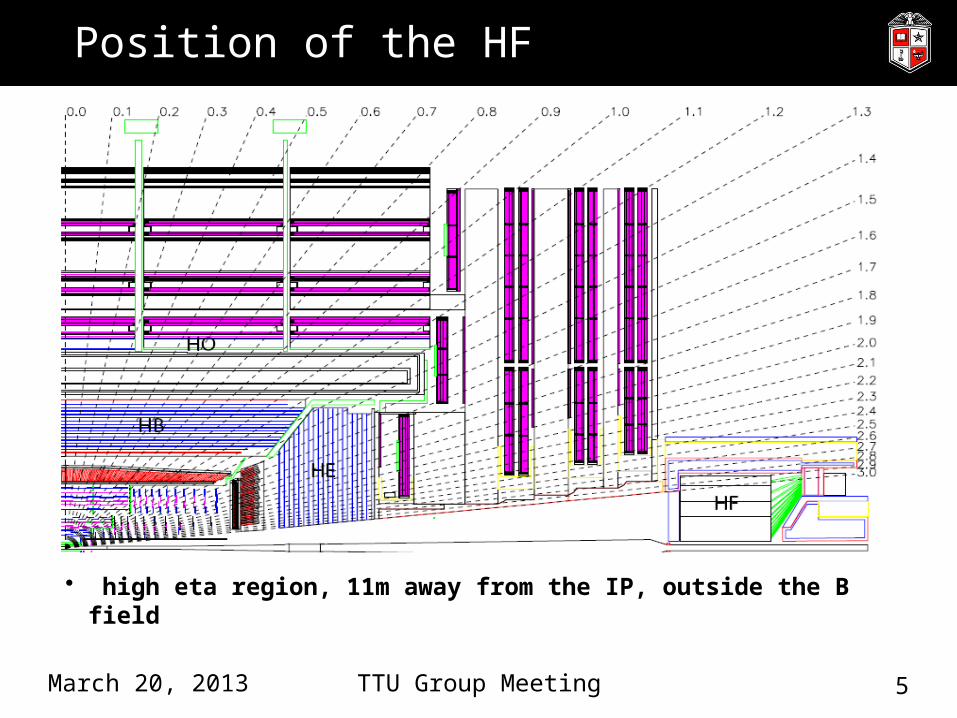
Position of the HF
TTU Group MeetingMarch 20, 2013 5
• high eta region, 11m away from the IP, outside the B field
TTU Group MeetingMarch 20, 2013 6
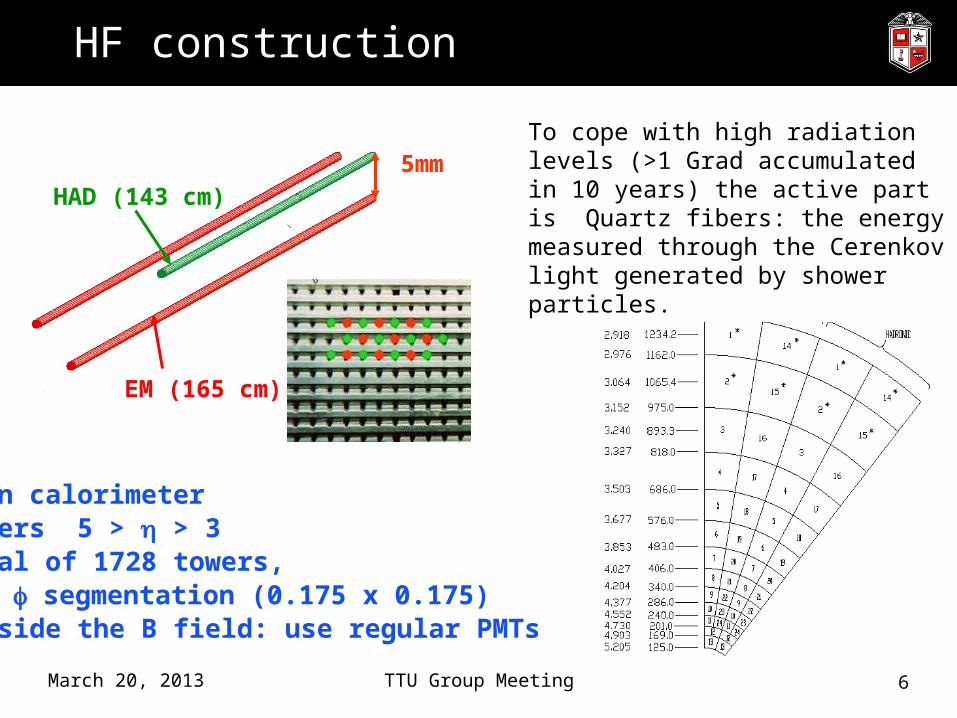
HF construction
HAD (143 cm)
EM (165 cm)
5mm
Iron calorimeter Covers 5 > h > 3 Total of 1728 towers, h x f segmentation (0.175 x 0.175)Outside the B field: use regular PMTs
To cope with high radiation levels (>1 Grad accumulated in 10 years) the active part is Quartz fibers: the energy measured through the Cerenkov light generated by shower particles.

TTU Group MeetingMarch 20, 2013 7
HF detector
HCAL readout is integrating charge over each 25ns interval, and then digitizing, continuously
HBHE HF
TTU Group MeetingMarch 20, 2013 8
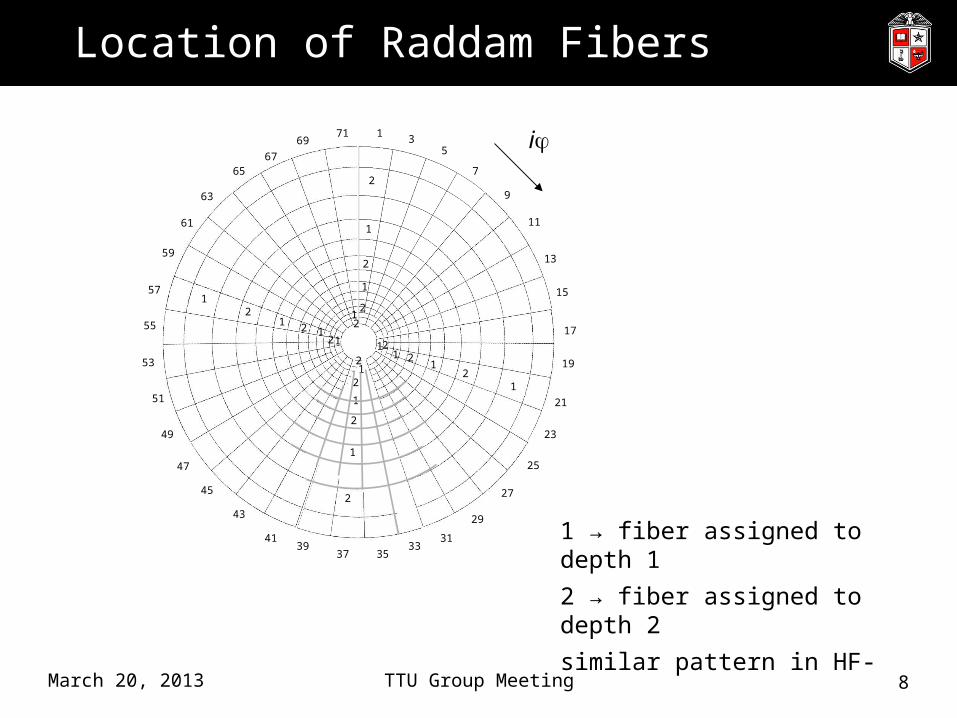
Location of Raddam Fibers
13
5
7
9
11
13
15
17
19
21
23
25
27
29
3133
353739
41
43
45
47
49
51
53
55
57
59
61
63
6567
6971
2
1
2
1
2
211
1
12
212
2
2
2
1
1
21
1
22
12 1
1
ij
1 → fiber assigned to depth 1
2 → fiber assigned to depth 2
similar pattern in HF-

TTU Group MeetingMarch 20, 2013 9
Radiation Damage – The Concept
With assistance fromJean-Pierre Merlo: CMS Week talk 9/28/2008
Nural Akchurin: HCAL DPG talk 3/8/2013

Intro (JP Merlo)
HF quartz fibres (Polymicro FSHA600630800 OH- 500ppm) when irradiated exhibit:
• Radiation damage increasing with dose, the light
absorption is high below 380nm, quite low near 450 nm,
rather high at 600 nm and negligible above 750 nm.
• Damage recovery when the irradiation stops. Maximum
effect near 450 nm. No recovery below 380 nm or above
600 nm. 450 nm = mid zone of PMT’s sensitivity.
• With the recovery the calibration of a detector using
quartz fibres done after few days or weeks will appear
better than it was at the time of data taking.TTU Group MeetingMarch 20, 2013 10
TTU Group MeetingMarch 20, 2013 11
Why do we care?
• Reduced transmissivity → weaker detector response• Changing detector response requires changing
calibrations, or else• Jets and missing energy get mismeasured• HF becomes less useful to physics analyses• …such as VBF Higgs, VBF diboson, etc. etc. where
jets are expected in the forward region.

• Quartz Attenuation Profile
TTU Group MeetingMarch 20, 2013 12
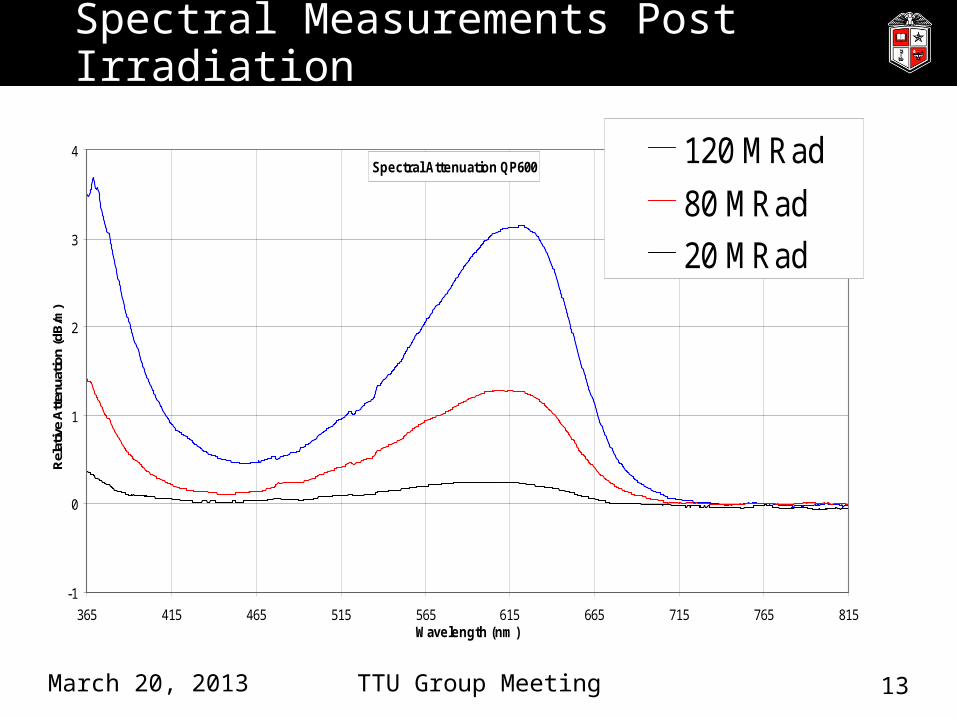
Spectral Measurements Post Irradiation
Spectral Attenuation QP600
-1
0
1
2
3
4
365 415 465 515 565 615 665 715 765 815Wavelength (nm)
Rel
ativ
e A
tten
uatio
n (d
B/m
)
120 MRad
80 MRad
20 MRad
TTU Group MeetingMarch 20, 2013 13
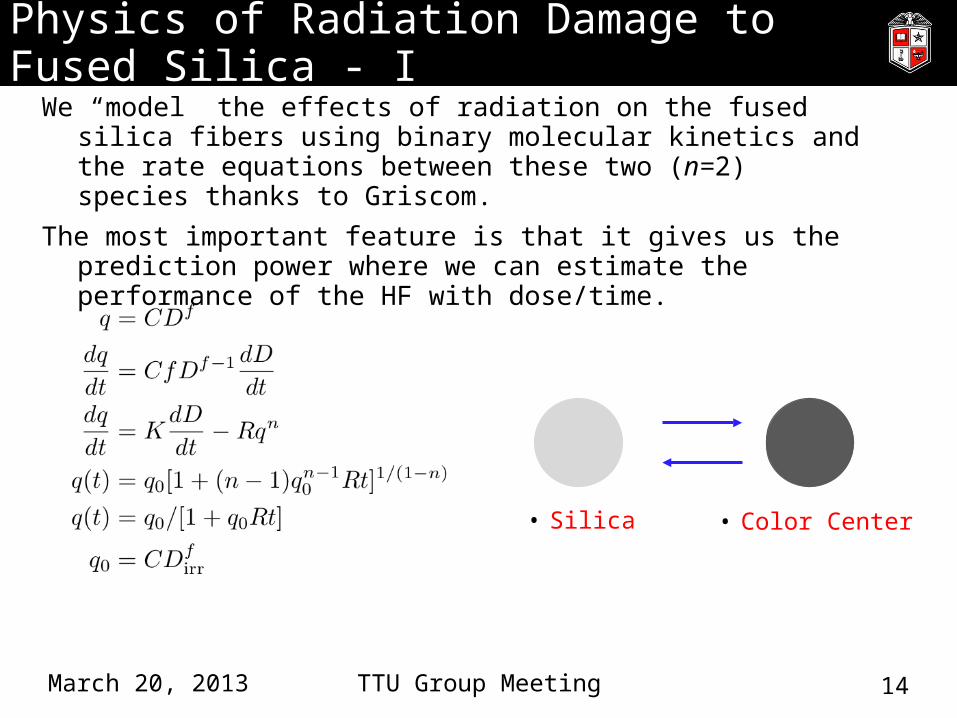
Physics of Radiation Damage to Fused Silica - I
We “model” the effects of radiation on the fused silica fibers using binary molecular kinetics and the rate equations between these two (n=2) species thanks to Griscom.
The most important feature is that it gives us the prediction power where we can estimate the performance of the HF with dose/time.
• Silica • Color Center
TTU Group MeetingMarch 20, 2013 14
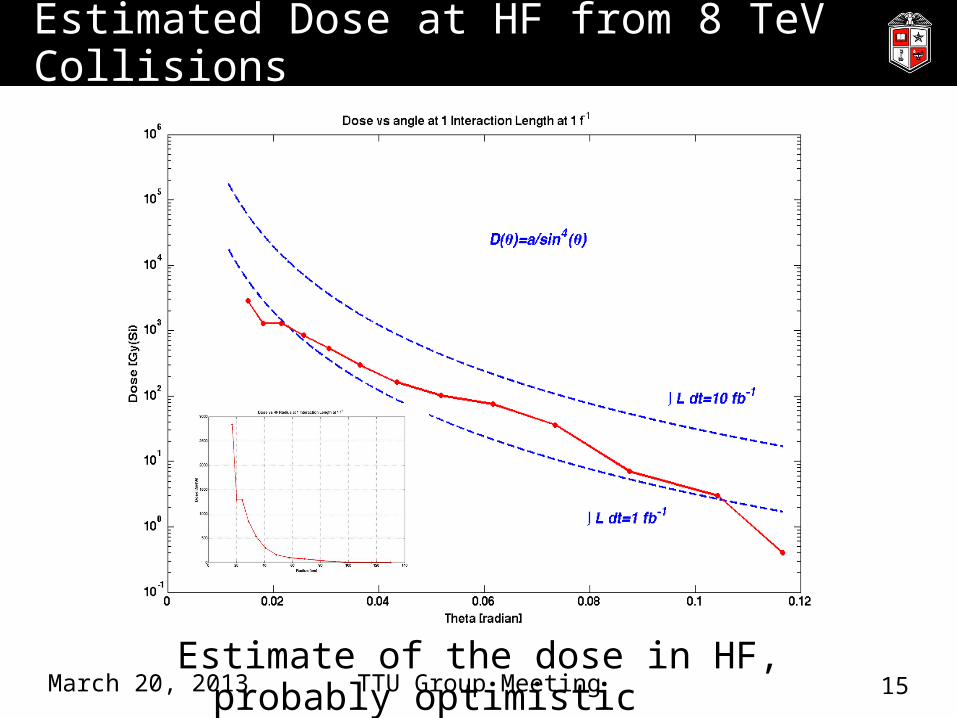
Estimated Dose at HF from 8 TeV Collisions
Estimate of the dose in HF, probably optimistic TTU Group MeetingMarch 20, 2013 15
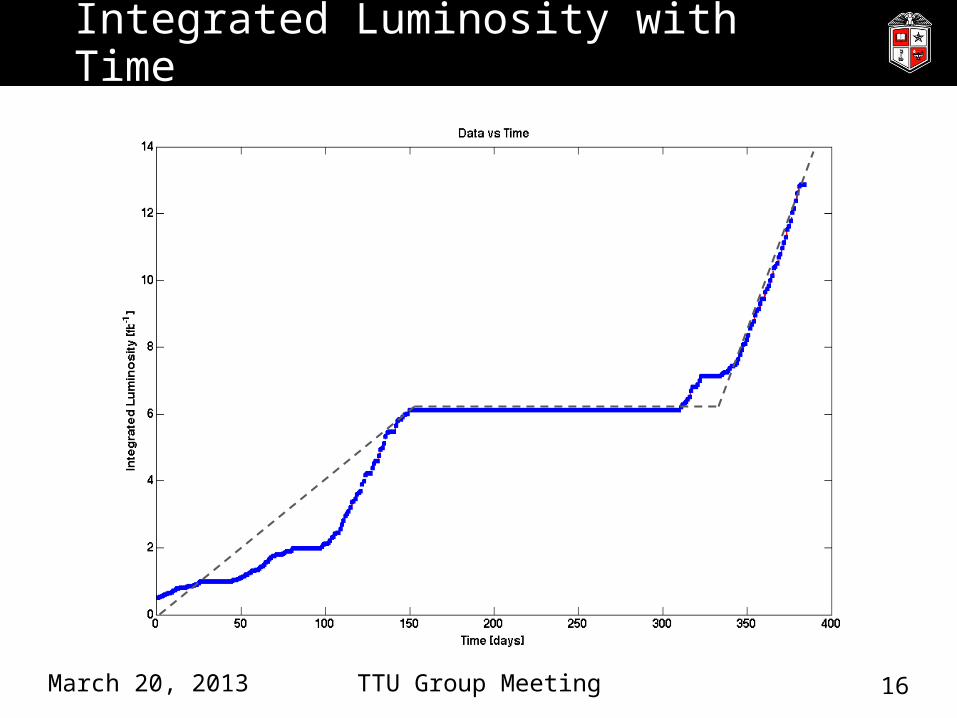
Integrated Luminosity with Time
TTU Group MeetingMarch 20, 2013 16

Transmission Loss in Four Regions of HF
• 30
• 33
• 37
• 40
TTU Group MeetingMarch 20, 2013 17
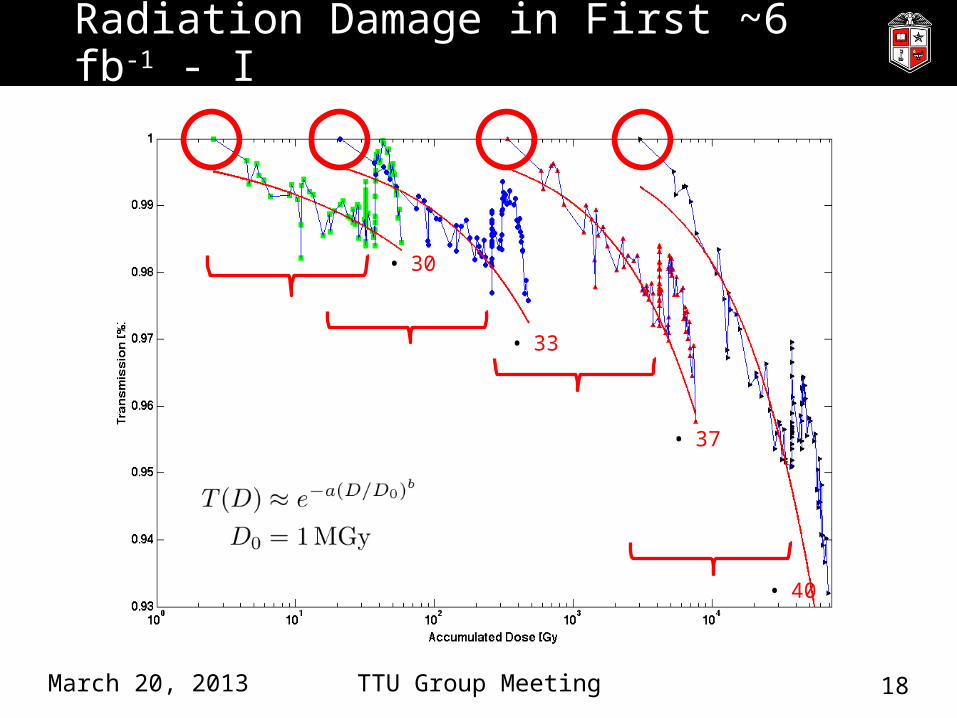
Radiation Damage in First ~6 fb-1 - I
• 30
• 33
• 37
• 40
TTU Group MeetingMarch 20, 2013 18
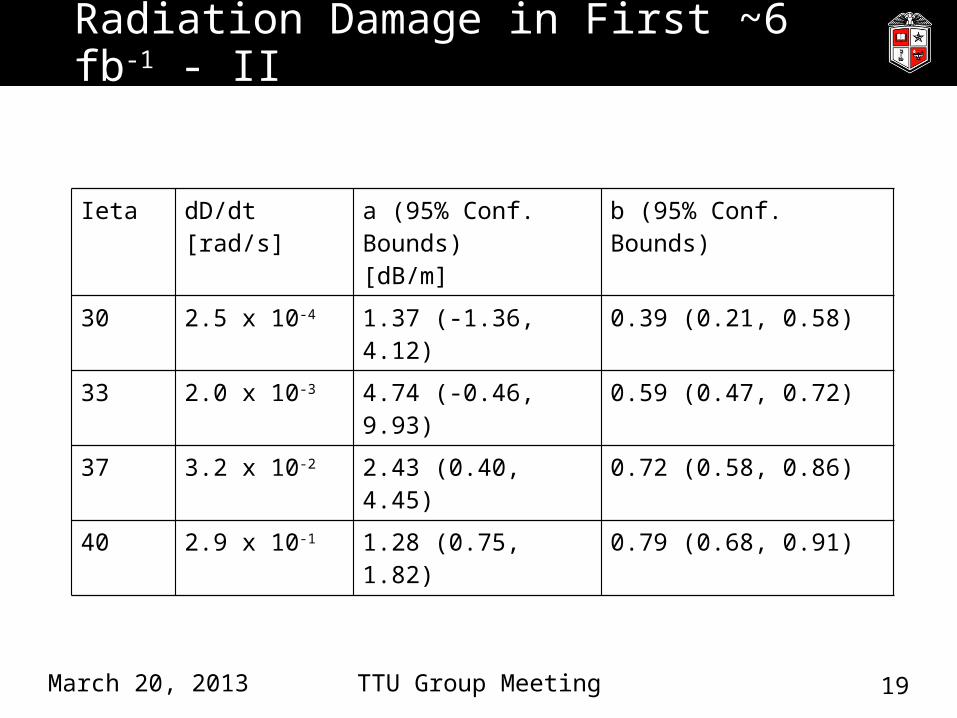
Radiation Damage in First ~6 fb-1 - II
Ieta dD/dt[rad/s]
a (95% Conf. Bounds)[dB/m]
b (95% Conf. Bounds)
30 2.5 x 10⁻⁴ 1.37 (-1.36, 4.12) 0.39 (0.21, 0.58)
33 2.0 x 10⁻³ 4.74 (-0.46, 9.93) 0.59 (0.47, 0.72)
37 3.2 x 10⁻² 2.43 (0.40, 4.45) 0.72 (0.58, 0.86)
40 2.9 x 10⁻¹ 1.28 (0.75, 1.82) 0.79 (0.68, 0.91)
TTU Group MeetingMarch 20, 2013 19
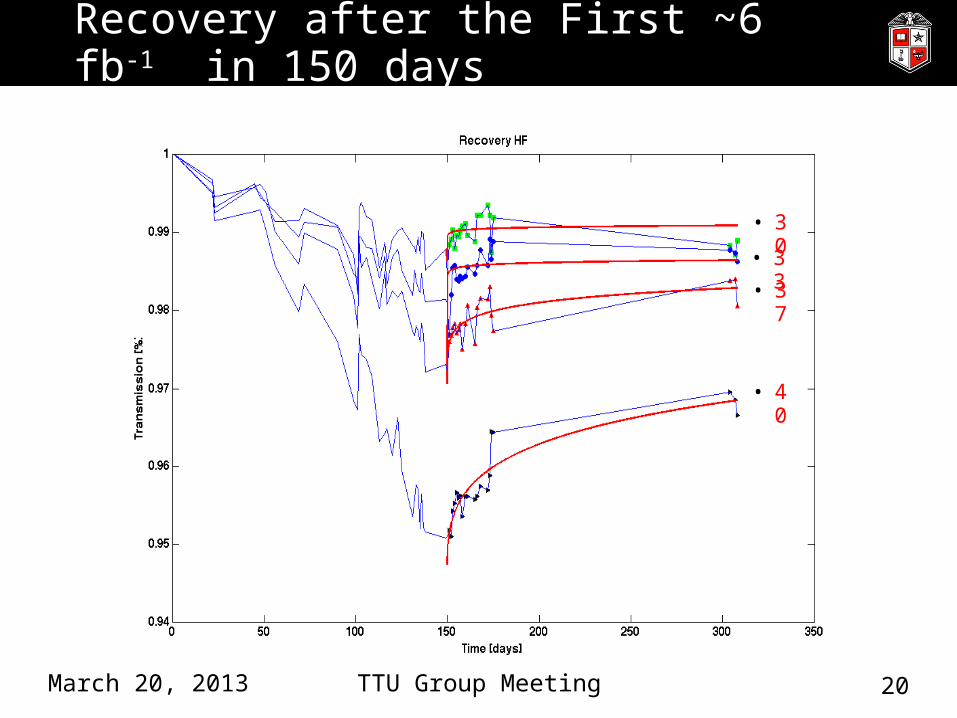
Recovery after the First ~6 fb-1 in 150 days
• 30• 33• 37
• 40
TTU Group MeetingMarch 20, 2013 20
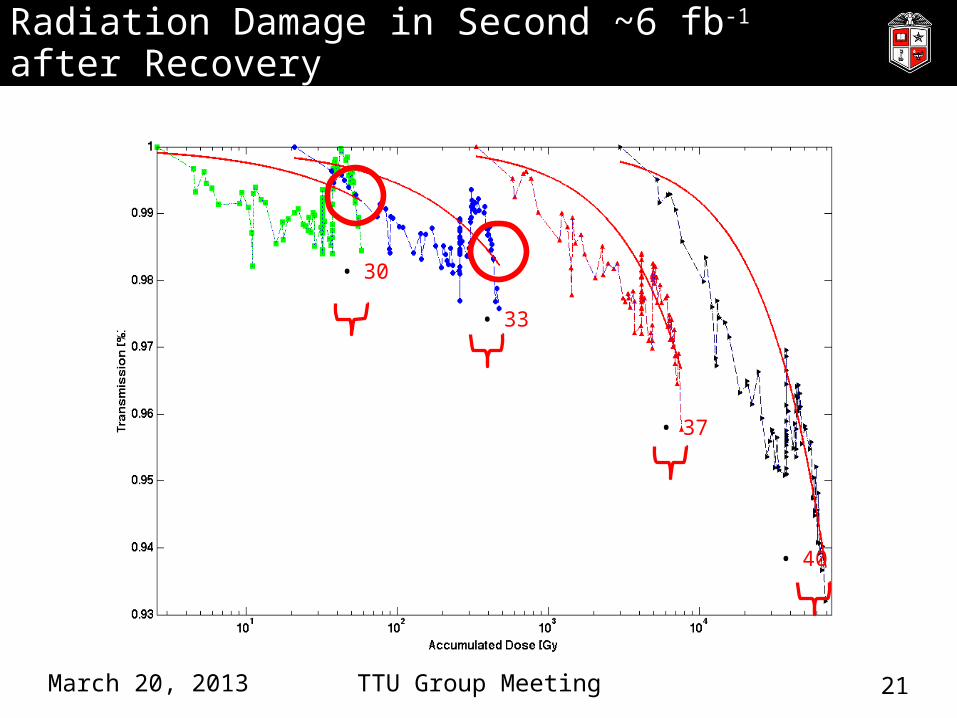
Radiation Damage in Second ~6 fb-1 after Recovery
• 30
• 33
• 37
• 40
TTU Group MeetingMarch 20, 2013 21
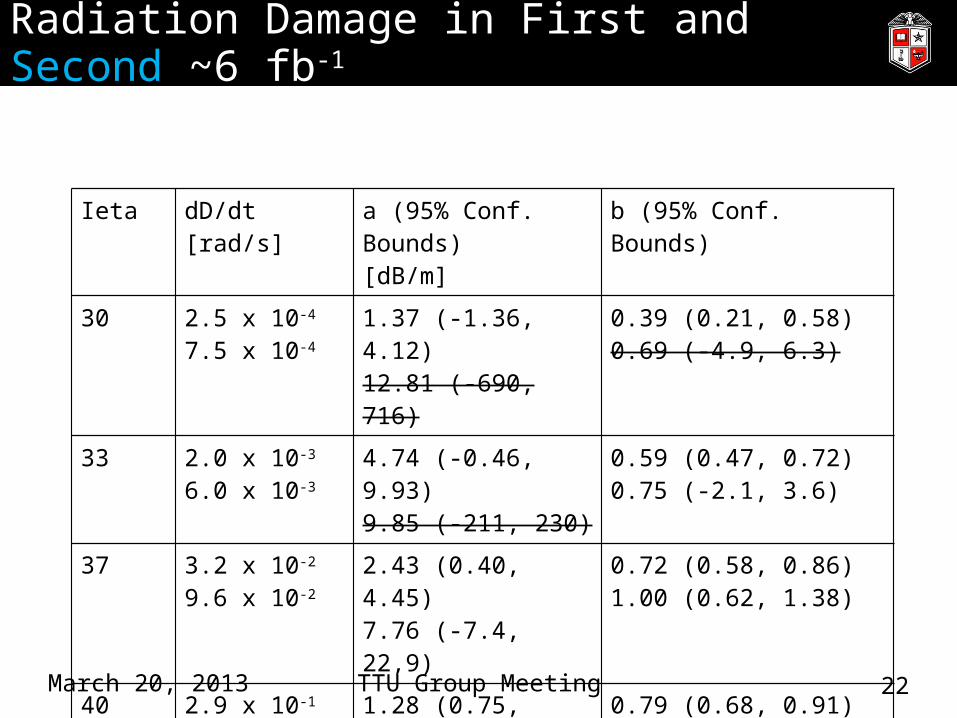
Radiation Damage in First and Second ~6 fb-1
Ieta dD/dt[rad/s]
a (95% Conf. Bounds)[dB/m]
b (95% Conf. Bounds)
30 2.5 x 10⁻⁴
7.5 x 10⁻⁴
1.37 (-1.36, 4.12)12.81 (-690, 716)
0.39 (0.21, 0.58)0.69 (-4.9, 6.3)
33 2.0 x 10⁻³
6.0 x 10⁻³
4.74 (-0.46, 9.93)9.85 (-211, 230)
0.59 (0.47, 0.72)0.75 (-2.1, 3.6)
37 3.2 x 10⁻²
9.6 x 10⁻²
2.43 (0.40, 4.45)7.76 (-7.4, 22,9)
0.72 (0.58, 0.86)1.00 (0.62, 1.38)
40 2.9 x 10⁻¹
9 x 10⁻¹
1.28 (0.75, 1.82)1.99 (0.94, 3.06)
0.79 (0.68, 0.91)1.07 (0.89, 1.25)
TTU Group MeetingMarch 20, 2013 22
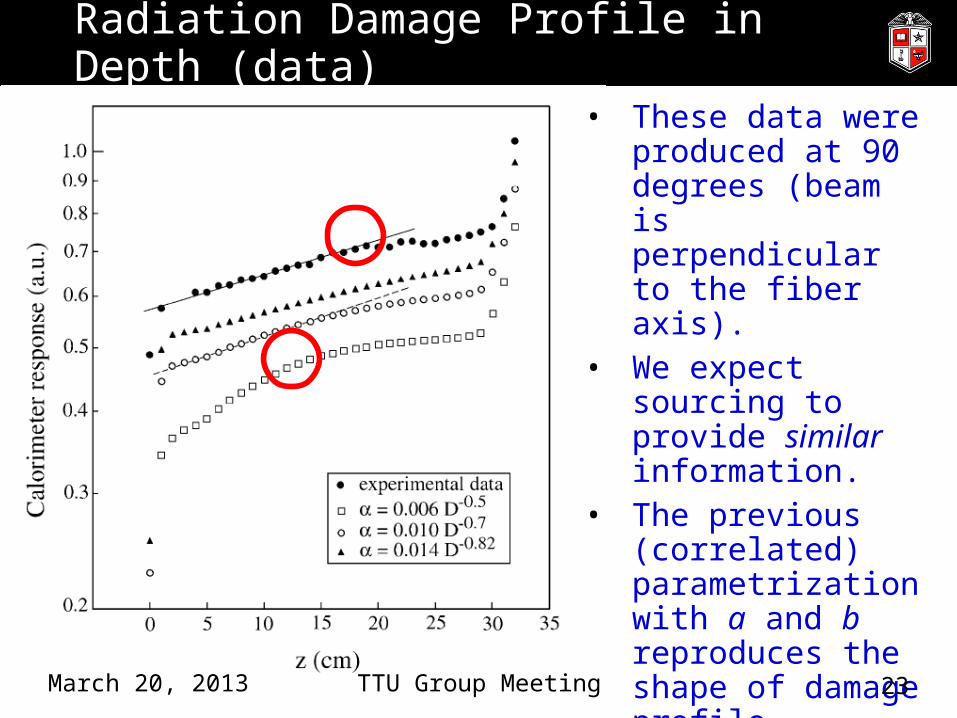
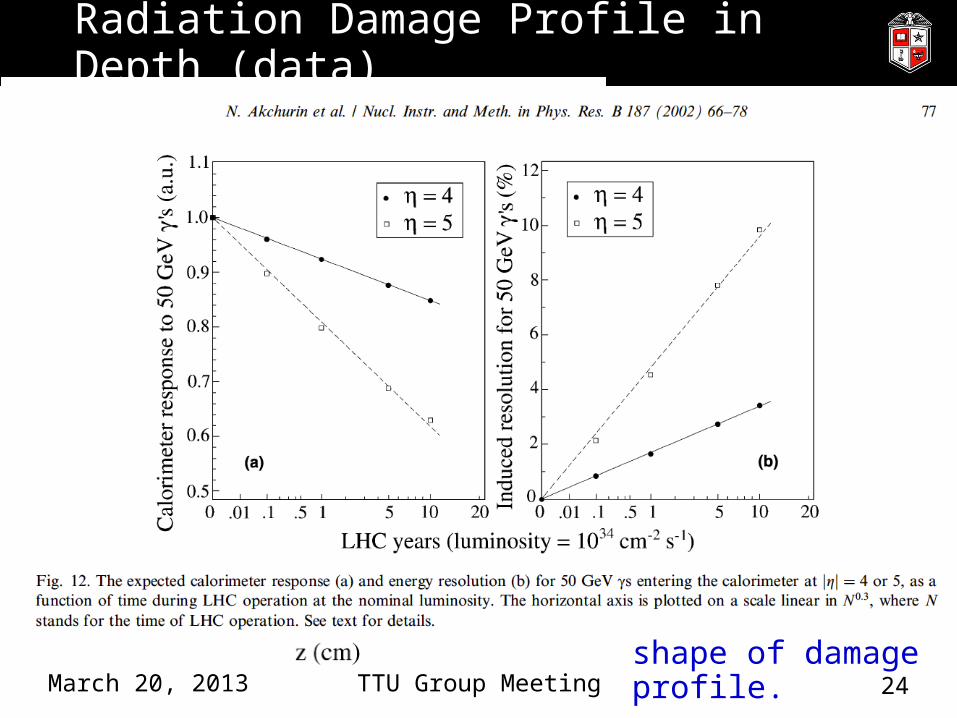
Radiation Damage Profile in Depth (data)
• These data were produced at 90 degrees (beam is perpendicular to the fiber axis).
• We expect sourcing to provide similar information.
• The previous (correlated) parametrization with a and b reproduces the shape of damage profile.
TTU Group MeetingMarch 20, 2013 23
Radiation Damage Profile in Depth (data)
• These data were produced at 90 degrees (beam is perpendicular to the fiber axis).
• We expect sourcing to provide similar information.
• The previous parametrization with a and b reproduces the shape of damage profile.
TTU Group MeetingMarch 20, 2013 24
Comments
• Made some progress towards understanding the basics of radiation damage to fused silica optical fibers– Small doses induce large effects– Dose rate matters– The damage parameters will likely to depend on r in HF
• Relevance of the OTDR measurements on HF performance needs further investigation for the future.
TTU Group MeetingMarch 20, 2013 25
TTU Group MeetingMarch 20, 2013 26
The Laser Monitoring System
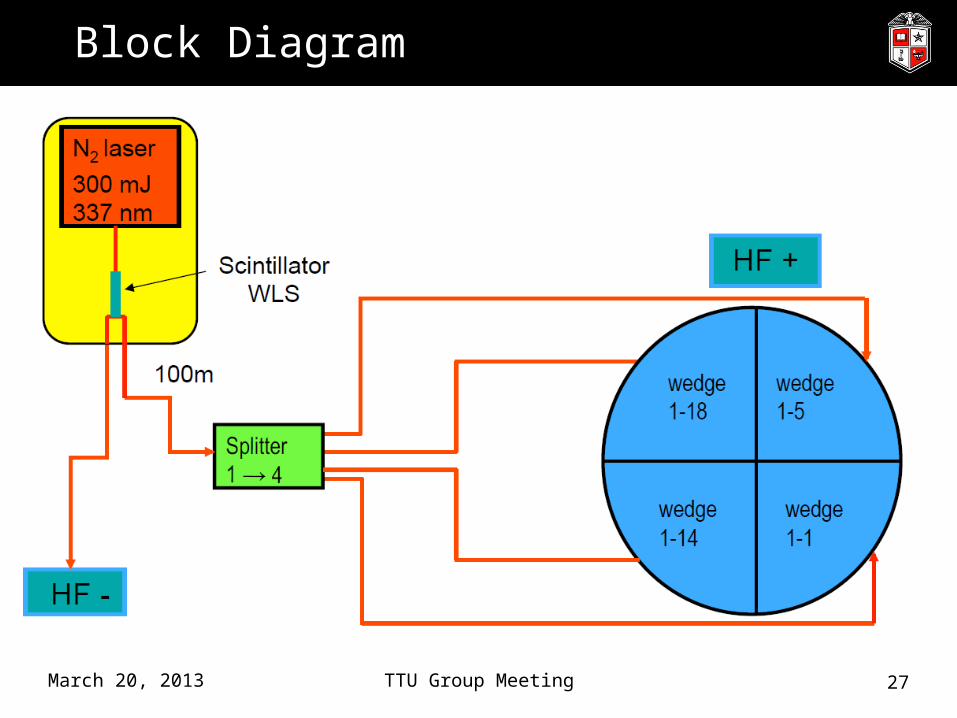
Block Diagram
TTU Group MeetingMarch 20, 2013 27
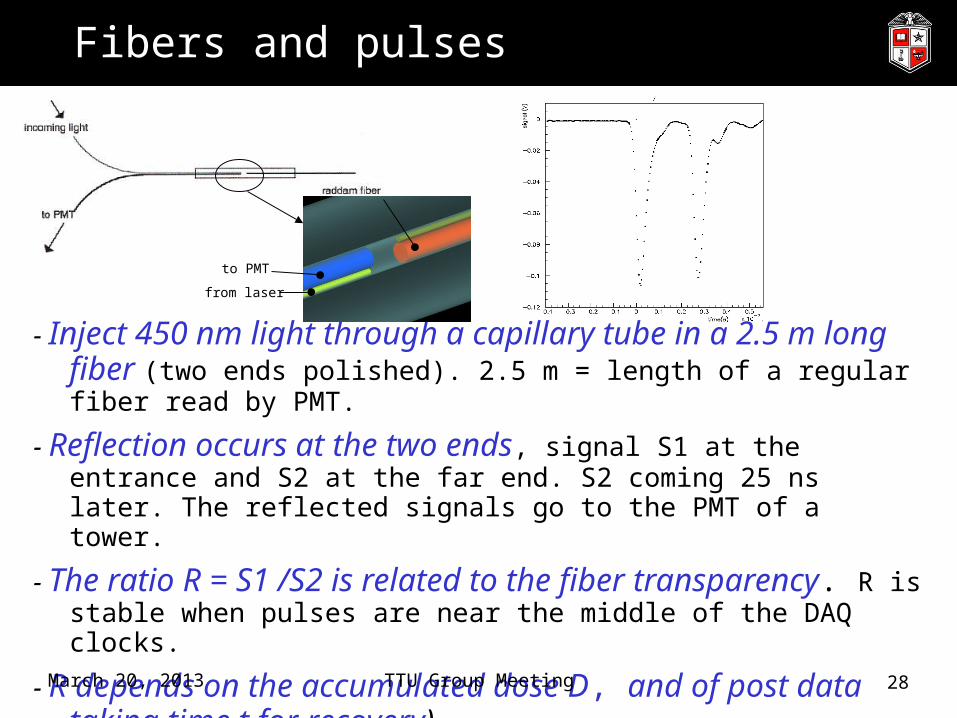
Fibers and pulses
- Inject 450 nm light through a capillary tube in a 2.5 m long fiber (two ends polished). 2.5 m = length of a regular fiber read by PMT.
- Reflection occurs at the two ends, signal S1 at the entrance and S2 at the far end. S2 coming 25 ns later. The reflected signals go to the PMT of a tower.
- The ratio R = S1 /S2 is related to the fiber transparency. R is stable when pulses are near the middle of the DAQ clocks.
- R depends on the accumulated dose D, and of post data taking time t for recovery).
- One Raddam fiber is installed at 7 pseudorapidity rings of 4 wedges for each HF.
TTU Group MeetingMarch 20, 2013 28
to PMT
from laser
TTU Group MeetingMarch 20, 2013 29
The Method
Find S2/S1 stable region versus phase
1. Assemble digis for 56 RADDAM channels from raw data, convert from raw ADC to pedestal-subtracted femto-Coulombs (fC)
2. Find the two adjacent samples with max SfC amplitude, call the first S1 and the second S2.
– allows for S2/S1 > 1– Produces 25ns periodic function
3. Construct a metric that, when optimized, places the window size and position in the stable S2/S1 region versus laser phase with maximum statistics.
– window optimization done per run, per channel– window size largely stable, but position drifts with the laser.
TTU Group MeetingMarch 20, 2013 30
Study S2/S1 versus time/luminosity
4. Collect ratio S2/S1 per run, per channel– S2/S1 = proxy for transmissivity of the fibers
5. Add in date and integrated luminosity for each run
6. Assess degradation/recovery as functions of eta, total dose received.
TTU Group MeetingMarch 20, 2013 31

List of 2012 Raddam Runs
TTU Group MeetingMarch 20, 2013 32
Day/Month Mar Apr May Jun Jul Aug Sep Oct Nov Dec1 193004 200059 202063 206450 2083582 1931563 193243 195406 202124 204174 2084324 190337 193382 195468 198254 202189 2084925 193512 200287 206633 2085576 190559 193590 200331 2086927 193644 195675 200391 202337 2045828 187036 193733 195781 200482 2069109 190749 198561 200537 202488 20697410 198632 20064311 195979 20070412 187598 194055 196158 198861 202631 204921 20713013 200805 205055 20896114 191231 196280 198958 200869 202914 20512115 187937 194163 196416 199015 200965 205226 20733416 194236 199031 20526917 194328 196482 199111 203064,20307718 191659 199194 201181 205354 20929619 191734 201214 20755320 194500 19687221 191965 194549 196974 199388 201297 205703,205704 20770122 188590, 188655 199414 20579823 194738 199444 201569 205843 20784624 189043 192186 194801,194848 197138 20592625 194941 199664 201682 203573,203593 206079 20791026 1924** 195020 19970727 195061 201736 20799428 192848 195120 199816 201833 20384029 195169 199840 201894 20823130 195225 199894 20637031 189846 195315, 195323 202019
List culled from ELOG, some runs eliminated for data quality

TTU Group MeetingMarch 20, 2013 33
The Latest Results
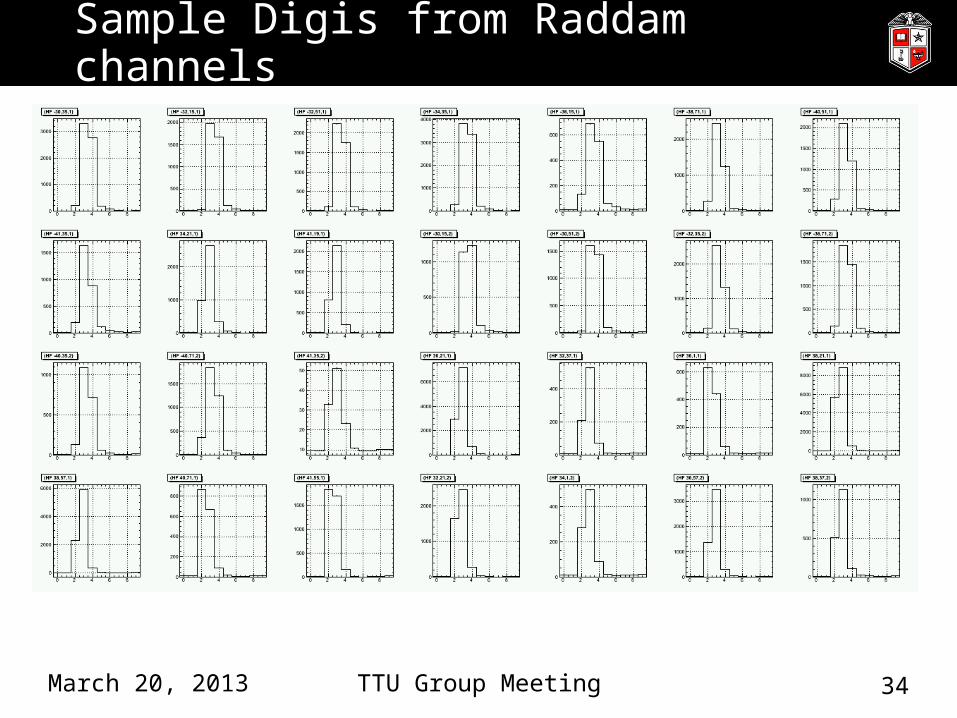
Sample Digis from Raddam channels
TTU Group MeetingMarch 20, 2013 34

Phase scan, Depth 1 channels
TTU Group MeetingMarch 20, 2013 35
Blue = Laser TDC phase distribution Red = selected TDC phase window cut

Phase scan, Depth 2 channels
TTU Group MeetingMarch 20, 2013 36
Blue = Laser TDC phase distribution Red = selected TDC phase window cut
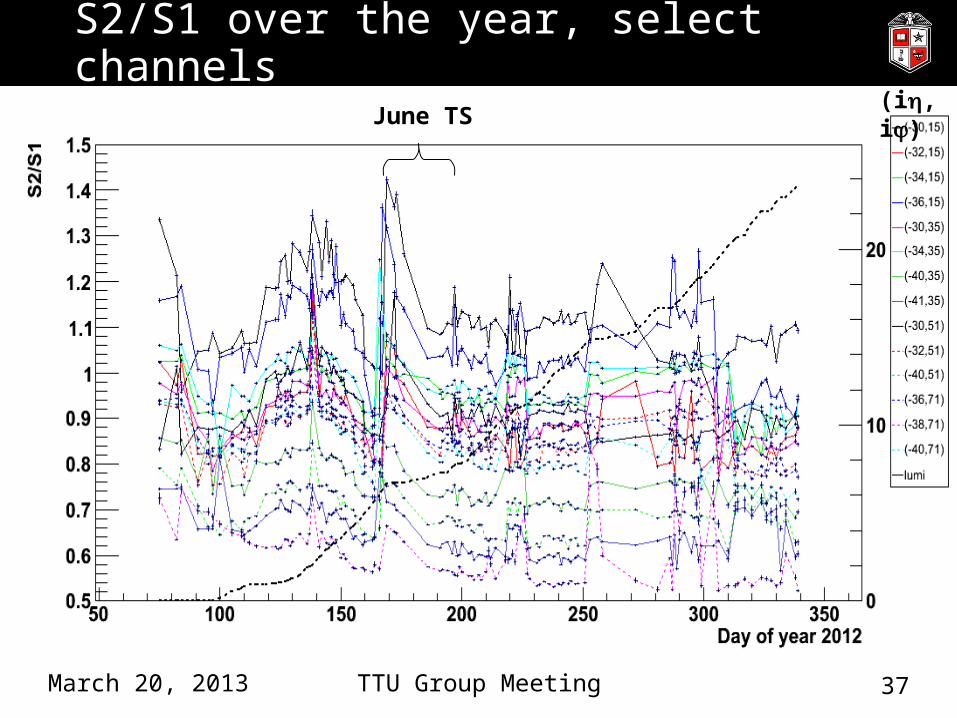
S2/S1 over the year, select channels
TTU Group MeetingMarch 20, 2013 37
(ih, ij)June TS
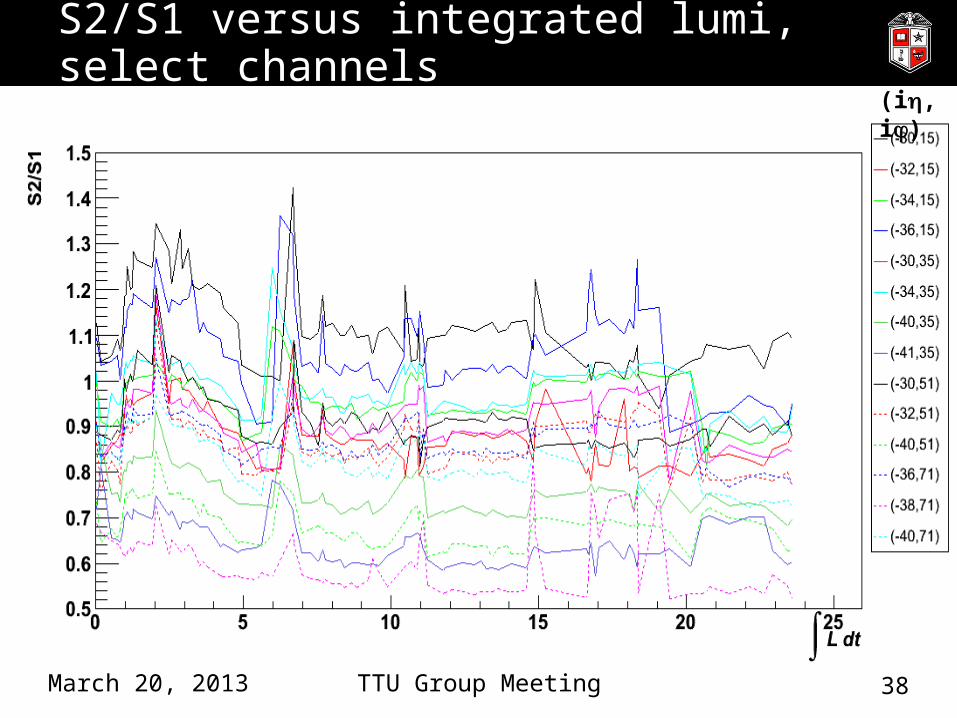
S2/S1 versus integrated lumi, select channels
TTU Group MeetingMarch 20, 2013 38
(ih, ij)

Why so jittery? Tightening phase cut didn’t help…
S2/S1 with RMS spread per run shown
TTU Group MeetingMarch 20, 2013 39

Cut on low amplitude pulses (S10 fC > 5000)
TTU Group MeetingMarch 20, 2013 40
…eliminated some runs entirely!
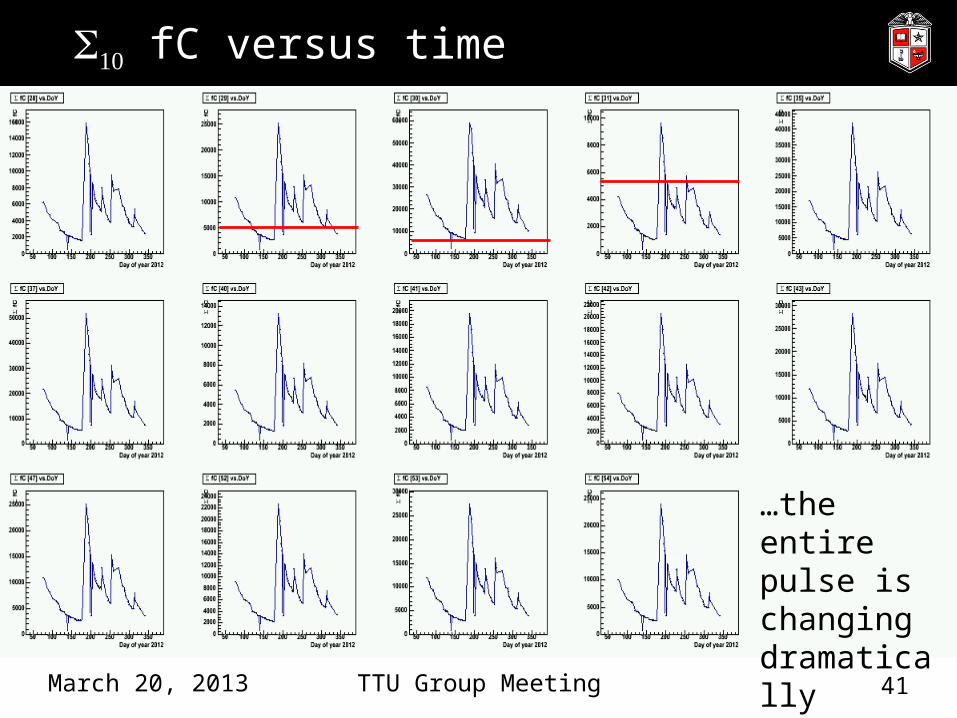
S10 fC versus time
TTU Group MeetingMarch 20, 2013 41
…the entire pulse is changing dramatically

…normalized to the first channel
TTU Group MeetingMarch 20, 2013 42
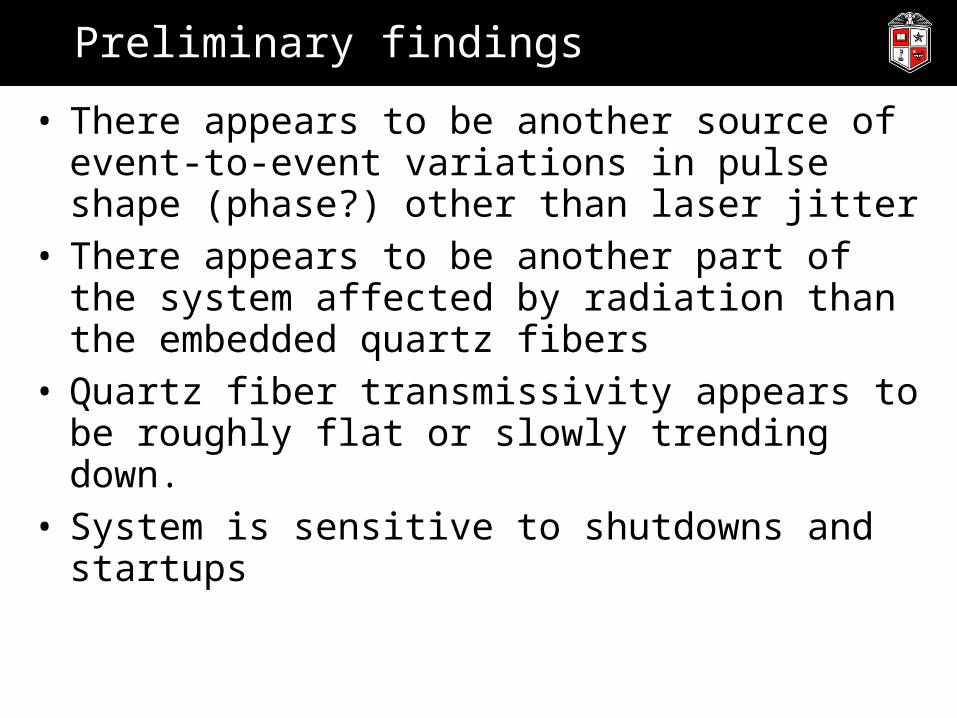
Preliminary findings
• There appears to be another source of event-to-event variations in pulse shape (phase?) other than laser jitter
• There appears to be another part of the system affected by radiation than the embedded quartz fibers
• Quartz fiber transmissivity appears to be roughly flat or slowly trending down.
• System is sensitive to shutdowns and startups

TTU Group MeetingMarch 20, 2013 44
Plans

Plans for continued analysis
1. Analyze the 2011 runs in the same way
2. Establish a connection between the two years, a common normalization, since it is anticipated that a lot of the system dynamic response occurred in that year.
3. Write up an analysis note
4. Present at the next CMS week
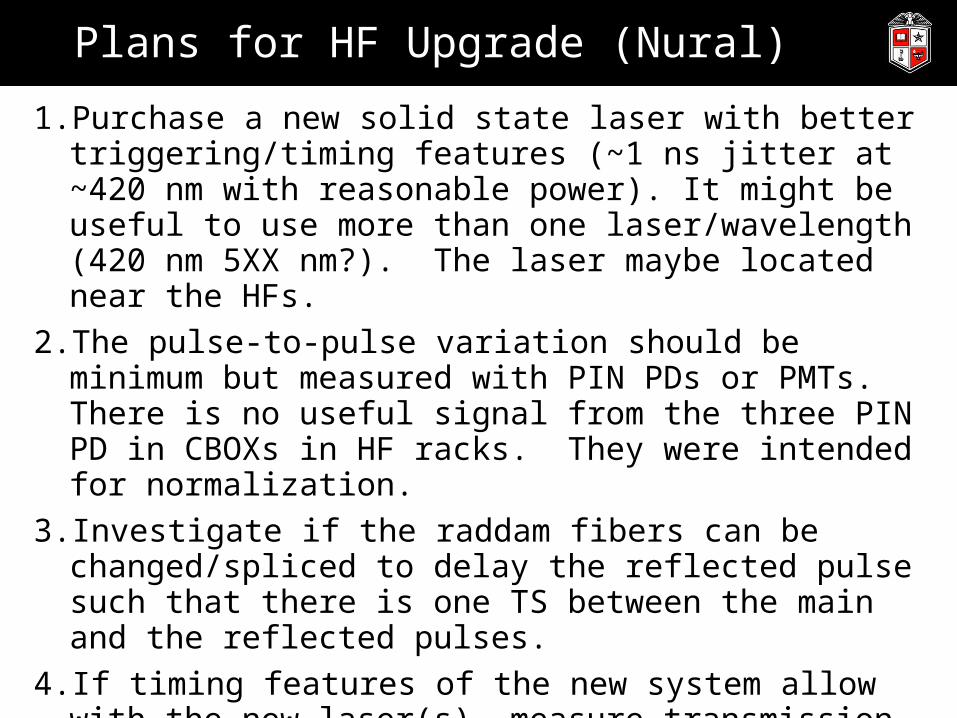
Plans for HF Upgrade (Nural)
1. Purchase a new solid state laser with better triggering/timing features (~1 ns jitter at ~420 nm with reasonable power). It might be useful to use more than one laser/wavelength (420 nm 5XX nm?). The laser maybe located near the HFs.
2. The pulse-to-pulse variation should be minimum but measured with PIN PDs or PMTs. There is no useful signal from the three PIN PD in CBOXs in HF racks. They were intended for normalization.
3. Investigate if the raddam fibers can be changed/spliced to delay the reflected pulse such that there is one TS between the main and the reflected pulses.
4. If timing features of the new system allow with the new laser(s), measure transmission in the abort gap.
5. Automate the laser runs.