ttr 040315e imageteil · dominated by heidelberger druck, man roland and koenig & bauer,...
TRANSCRIPT

technology and services
A N N U A L R E P O R T
2003

This division, representing 10.1 percent of revenue, operates in two distinct markets: since 1995,
technotrans has been a successful supplier of systems used in the production of optical storage
media – CDs and DVDs. More recently we have been using this expertise to make inroads into a
new area of application, microstructure technology.
M I C R O T E C H N O L O G I E S
Services designed to complement the technical divisions round off technotrans' portfolio of
activities. These services include providing customer support for the installation, maintenance
and operation of systems, and compiling technical documentation, including for manufacturers
from other sectors. Services generated 23.7 percent of revenue in 2003.
S E R V I C E S
technotrans systems and equipment control and monitor a wide range of liquid technology
processes in the offset printing environment. We have steadily been expanding the product range
over many years. The Print Division contributed 66.2 percent of revenue in the 2003 financial year.
P R I N T
REVENUEby segment
Micro Technologies…10.1%
Services…23.7%Print…66.2%

73,373
58,212
4,503
10,580
25,588
10,297
8,403
8,247
8,169
4,246
5.8
0.71
0.38
6,000
29,059
72.5
15.5
40,073
13,899
32,383
25.2
6.4
411
17,147
23.4
179
2,796
1,449
2,000,000
22.86
11.12
€'000
€'000
€'000
€'000
€'000
€'000
€'000
€'000
€'000
€'000
%
€
€
€'000
€'000
%
%
€'000
€'000
€'000
%
%
€'000
%
€'000
€'000
€'000
€
€
104,927
76,650
11,808
16,469
34,389
12,934
10,755
9,676
9,700
5,405
5.2
0.88
0.42
6,180
36,778
49.6
16.4
74,195
20,152
59,697
16.2
53.8
543
24,632
23.5
193
4,574
- 15,572
2,060,000
53.17
12.82
130,990
98,733
11,526
20,731
41,623
14,150
10,726
9,130
7,525
3,421
2.6
0.53
0.23
6,600
54,756
55.3
7.5
99,042
24,244
80,450
9.4
37.7
687
33,634
25.7
191
4,272
- 6,827
2,200,000
48.02
9.83
117,012
80,623
10,861
25,528
37,695
10,897
7,587
5,887
5,626
2,620
2.2
0.40
0.20
6,600
51,720
55.9
4.9
92,541
21,981
74,291
7.2
29.5
639
31,920
27.3
183
10,077
7,470
6,600,000
17.85
4.81
02 01 00 9903
TECHNOTRANS GROUP KEY DATA (IFRS)
* Earnings per share, dividend and historical share prices adjusted to reflect share-split1 EBIT = operating profit + foreign currency gains/losses2 EBITA = EBIT + amortisation of goodwill3 EBITDA = EBIT + amortisation of goodwill + depreciation of property, plant and equipment
and intangible assets4 capital employed = interest-bearing liabilities + equity5 ROCE = EBIT / Capital employed6 Gearing = (interest-bearing liabilities – liquidity) / equity7 Cash flow = Net cash from operating activities acc. to Cash flow Statement8 Free cash flow = Net cash from operating activities + net cash used for investments acc. to Cash flow Statement
106,737
70,631
10,774
25,332
35,929
12,685
9,084
7,522
7,377
-10,960
-10.3
-1.66
0.30
6,600
36,288
50.1
-30.2
72,391
24,318
55,305
13.3
27.5
593
29,275
27.4
180
6,491
5,394
6,600,000
12.64
3.81
Profit
Revenue
Micro Technologies
Services
Gross profit
EBITDA 3
EBITA 2
Operating Profit
Earnings before interest and tax (EBIT) 1
Net profit for the year
as % of revenue
Earnings per share (IAS) *
Dividend per share*
Balance sheet
Issued capital
Equity
Equity ratio
Return on equity
Balance sheet total
working capital
capital employed 4
ROCE 5
Gearing 6
Employees
Number of employees (yearly average)
Employee costs
as % of revenue
Revenue per employee
Cash flow
Cash flow 7
Free cash flow 8
Shares
Number of shares (at 31.12)
share price (max) *
share price (min) *

Systems supplier for liquid technology
technotrans has been concentrating
on applications for offset printing since
the early 1980s. The product range
has gradually been extended and now
comprises a wide range of systems
and equipment for controlling and moni-
toring liquid technology processes in
printing. Major printing press manufac-
turers worldwide are our key custom-
ers. They frequently equip their printing
presses ex works with technotrans
equipment. Various products in addi-
tion aimed directly at end users have
been developed in recent years; these
further automate procedures in the
printing shop or help to use resources
more efficiently.
…page 4
1 9 8 0 >
Along with the increasing mass pro-
duction of CDs, technotrans likewise
gained a foothold in this growing mar-
ket. Customers use our systems to
produce a kind of »negative« of optical
storage media, so that copies of these
can then be made. technotrans has
been the unchallenged market leader
for these electroforming systems since
2001. Once again, they are based on
a liquid technology process.
…page 10
1 9 9 5 >
The same technology as in the CD/DVD
Division is used in the manufacturing
of minute components measuring no
more than a few hundredths of a mil-
limetre. This still young area of appli-
cation is finding its way into markets
as diverse as telecommunications,
biotechnology and display technology,
and is yet to realise its potential.
…page 10
2 0 0 1 >
CD/DVD
MICROSTRUCTURETECHNOLOGY
■ Core skill of liquid technology■ Concentration on niche markets■ Systematic broadening of product range

Letter to the Shareholders…2 | Divisions…4 | R&D…18 Employees…20 | Share/Corporate Governance…22 |
Group Management Report…26 | Consolidated Financial Statements…44 | History…99
technotrans is a leading systems supplier of plant for the production of
print media and microstructures. Within these niche markets, we have been
concentrating successfully on applications based on our core skill of liquid
technology for many years now. With our 13 locations and over 600 employ-
ees, we enjoy a presence in all major markets worldwide. In close coopera-
tion with our customers, we are tapping new potential by steadily broadening
our range of products and venturing into new markets and segments. Our
strategy focuses on sustained, earnings-driven development.
technotrans is a systems supplierof high-tech plant and servicesfor the production of print mediaand microstructures.

Dear shareholders, dear business associates,
2003 was the third year in succession in which our company was confronted with
enormous challenges due to the unsatisfactory progress of those markets in which we
operate. The printing industry has been experiencing the worst crisis in its history
since 2001, and the propensity to invest in Micro Technologies likewise suffered from
the paralysis of the global economy. We can at least report that our Services Division
has fared well in this adverse climate. technotrans now generates 21 percent of its
revenue in the important North American markets; the exceptionally low value of the
dollar consequently further undermined our revenue. Our competitive position, on the
other hand, if anything improved last year as a result of a number of smaller players
going under.
Despite the difficult circumstances, we succeeded in posting an operating result of
€ 7.5 million from revenue of € 106.7 million in 2003. In view of the situation in the
CD/DVD segment, which has still failed to live up to the expectations that prompted
us to acquire the Toolex Division in 2001, we have reduced the remaining goodwill.
As a reflection of the fact that we purchased the American company Ryco, of Chicago,
when the Print sector was booming in 2000, we have likewise adjusted the acquired
goodwill to a more conservative level. In view of these measures, for the first time in
the company's history we report a loss of € 11 million, but at the same time we have
adjusted the risks in the balance sheet and have consequently already absorbed po-
tential burdens in forthcoming years in the 2003 annual accounts. We have therefore
cleared the way for an even more profitable future.
This future will continue to bear the hallmark of our long-standing successful strategy
of growth: the broadening of our product range with a view to boosting our content per
printing press. We had already disclosed details of one such measure in the form of
2

the scheduled takeover of Baldwin. Following the collapse of this transaction by
Baldwin, we once again find ourselves in the position of competitors in the market-
place, and will for our part concentrate on further strengthening the sound position
that technotrans enjoys among its customers. We will also undoubtedly examine
other options more closely and opt for the most promising among them.
The experience of recent years has confirmed something we have always believed:
that our company is capable of taking on exceptional challenges and overcoming
them successfully. Our employees have played a major part in this; thanks to their
remarkable dedication, creativity and inimitable feel for the right decision, they were
instrumental in enabling us to pave the way for future success last year. We are proud
and appreciative of them, and look forward to tackling the exciting tasks of the future
together with them. We know they will remain instrumental to the success of our
group.
Thank you for your interest in our Annual Report; we hope that you will continue to
follow the fortunes of technotrans. We are convinced that 2004 will be an interesting
year for all of us, not least because of the forthcoming DRUPA exhibition.
L E T T E R T O T H E S H A R E H O L D E R S 3
Wolfgang Breme, John A. Stacey, Ralph Teunissen, Heinz Harling

4
PRINTD I V I S I O N

D I V I S I O N S 5
technotrans has been honing its profile as a supplier to the printing
industry since the early 1980s, and is now a leading system partner
with an international presence. The product range with liquid technology
at its core has been systematically extended. We have deliberately
concentrated on niche markets in which we have been able to become
a leading player.

The clear strategy, our high degree of specialisation and the close, constructive coop-
eration between ourselves and the leading printing press manufacturers that often
cuts in as early as the development phase for new machinery has helped technotrans
to evolve into a leading international system supplier in the print sector.
Old economy meets high tech
The present-day printing industry stretches back to Johannes Gutenberg's invention
in around 1450 AD, and can therefore with some justification be classed as an "old
economy" activity. The market volume in 2002 totalled some 12 billion euros world-
wide, with printing presses and accessories accounting for the lion's share of this
figure. Two-thirds of all presses worldwide are German-built, with the market being
dominated by Heidelberger Druck, MAN Roland and Koenig & Bauer, followed by
Japanese manufacturers such as Komori, Ryobi and Mitsubishi, and the American
company Goss.
Some two-thirds of all printed products worldwide are produced by offset printing: busi-
ness cards, posters, newspapers, and also this Annual Report. There are many argu-
ments in favour of offset printing: among other things, its high quality and the fact that
the production process is straightforward and economical. Depending on the number of
pages and the quantity to be printed, cut sheets of paper are printed by the sheet-fed
"More technotransper printing press"
■ High-tech products for offset printing
■ Around 80 percent of revenue generated
as partner of the printing press manufacturers
■ In the wake of the economic crisis, the industry
is looking forward to the DRUPA in 2004.
6

method, or in the case of very high print runs rotary offset printing is used, with the
paper supplied from a reel.
The technology of offset printing is based on the fact that oil and water repel each
other. Zones which attract the oil-based printing ink are created on the printing plate
by photo-technical means. The other zones repel the ink, instead of which they are
wetted with a water-based dampening solution. The interplay between these two liquids
produces the printed image on the printing plate, which is then reproduced on the paper,
up to 18,000 times an hour in the case of a sheet-fed offset printing press. This is
moreover not the only area in which the old economy and high technology have formed
a rewarding symbiotic relationship.
Liquid technology everywhere on the printing press
The first devices with which technotrans became world market leader in the early 1990s
were systems for preparing this dampening solution. They mix together the solution from
water, alcohol and a variety of chemical additives, and are capable of supplying the
printing press continuously with several hundred litres of this solution per hour. Today,
all leading printing press manufacturers fit most of their presses with technotrans
equipment ex works.
In the years which followed, we systematically extended the range of products based
on liquid technology, adding for example ink roller temperature control units. The oil-
based ink reacts highly sensitively to changes in temperature. In order to stabilise the
printed results, the temperature of the ink rollers is adjusted to compensate for fluc-
tuations in the production conditions. Ink supply is another example: technotrans now
offers an extensive range of equipment and systems for the ink supply to printing
presses. These range from manual aids for smaller or older presses, through fully
automatic supply systems for cutting-edge sheet-fed offset printing presses, to supply-
ing large newspaper presses from central tanks, complete with the pumps, the compo-
nents for monitoring the levels in the tanks and for gauging ink consumption levels.
Varnish is finding increasing use in high-end printed productions. Glossy or protective
coatings refine the appearance of printed articles. technotrans' contribution: a device
that preheats the varnish so that it reaches the printing press at the correct consistency.
D I V I S I O N S 7
World market leader: dampening solution preparation from technotrans

The first technotrans products that penetrated the inner workings of printing presses
were spray dampening systems intended primarily for large newspaper presses. The
spray dampening systems technology of our American subsidiary has been installed
several thousand times over, and "microspray" permits an ultra-even coating of the
dampening solution thanks to special lamellar valves.
An ecological approach to printing that pays its way
Many technotrans devices are essential to the proper functioning of the printing press.
Others have been developed to make the printing process more efficient, for instance
by boosting the degree of automation or helping to make better use of the resources
in question. Certain technotrans products in addition combine persuasive economic
benefits with hard-and-fast ecological aspects. Such as ecoclean, a product range for
the recovery of washing agent. In order to clean the printing cylinders of the press from
ink residue among other things, solvent-based cleaning agents are used for the regular
washing processes. ecoclean enables the printer to recondition these cleaning agents
and use them again. This drastically reduces not only the consumption of cleaning
agent, but also the amount to be disposed of, as well as the cost this involves.
2004: a DRUPA year
The printing industry is dominated by German companies, so it comes as no surprise
that the biggest exhibition in the world for this industry, the DRUPA, takes place in
Düsseldorf every four years. This year's exhibits are likely to focus on new develop-
ments that boost the efficiency of printing presses, make them simpler to operate
and secure greater flexibility for the customer.
ecoclean.line saves money and preserves resources.
8

Alongside a wide range of improved and extended functions on existing systems, techno-
trans will once again be presenting an entirely new product: spinclean. This device is our
first product to target customers from the pre-press stage. spinclean has been devel-
oped for cleaning the developer fluid used in CtP plate exposure. In field tests the spin-
clean has demonstrated the ability to cut consumption of developer fluid by over 70
percent. The response from its first customers was correspondingly positive, and we
await the official market launch at this year's DRUPA with very high hopes.
Potential for the future
The printing industry has experienced its worst ever crisis in recent years, but there
have been increasing signs of a turn in the tide since the second half of 2003. We have
been doing our homework: after years of growth, occasionally of a sensational magni-
tude, we have latterly taken the opportunity to optimise our processes, cut our costs and
steadily strengthen our market position thanks in no small measure to our healthy
financial state.
Experience has shown that the printing industry worldwide expands at a similar rate
to gross domestic product. The market for system suppliers, which has an estimated
volume of almost 600 million euros in the area of our core skills, is developing with
appreciably greater dynamism. In the context of our long-term strategy, we will contin-
ue to seize the opportunities that present themselves. The present circumstances in
particular, dominated as they are by consolidation, provide a particularly favourable
opportunity to target and exploit fresh potential.
In view of the overall volume of our market and position, we are confident of returning
rapidly to our former trend of growth if the underlying economic figures move closer to
the positive zone. There is ample potential for our high tech in the old economy.
D I V I S I O N S 9
MARKET SHARE PRINTING PRESS MANUFACTURERS
MAN Roland (G)…19.7%
Koenig & Bauer (G)…16.5%
Komori (J)…10.6%
Other…12.5%
Mitsubishi (J)…5,8%
Heidelberger (G)…34.9%

technotrans has been exploring additional applications for its liquid
technologies in the field of Micro Technolgies since 1995. technotrans
systems are used for the manufacture of tools that are required in the
production of optical storage media, in other words CDs and DVDs.
These systems have recently also been used in the volume production
of minute components measuring just a few hundredths of a millimetre.
D I V I S I O N S10

D I V I S I O N
11
MICRO TECHNOLOGIES

Taking its core skill of liquid technology as its starting point, technotrans has been
developing the systems required in the manufacture of optical storage media, meaning
initially CDs (compact discs) and then DVDs (digital versatile discs), since 1995. We
have been the world leader in this market since 2001.
The "masters" for more than half of all these silver discs worldwide are made on technotrans systems
In order to make CDs and DVDs out of plastic, the digital data first needs to be pre-
pared in the form of a tool for the injection moulding process. To this end, the data is
burned into a varnish coating with the aid of a laser beam. The burned areas are then
rinsed and the structure that is left behind is coated with a wafer-thin layer of metal.
A solid nickel disc is then produced on this surface in a technotrans system by means
of an electrodepositing process – a liquid technology process.
"Our smallest worker is the nickelmolecule"
■ World market leader for systems for the production of CDs and DVDs
■ Strategic line: venturing into new markets with familiar technology
■ Microstructure technology with potential for the future
12

This master disc constitutes the basis of the subsequent replication process, where
polycarbonate is pressed onto the nickel disc up to 150,000 times, at a pressure run-
ning into tonnes. The result is a very familiar object: CDs containing everything from
music to computer programs, and DVDs with films or music concerts.
Market with big aspirations: microstructure technology
There is already a wide range of additional applications for this technology. Minute
components are used for example in sensors, in glass fibre technology and in biotech-
nology. These components, which are often just a few hundredths of a millimetre in
size, are produced using the same technology as optical storage media. We are suc-
cessfully venturing into these new markets of microstructure technology.
In 2003, for example, a system that is to be used for the production of displays was
shipped to Taiwan. A special plastic disc to which tiny lenses are applied using the
technotrans plant ensures that the displays are illuminated more evenly and efficiently.
technotrans systems on which work is already being performed on potential series pro-
ducts of the future are in use at several research and development centres worldwide.
The Micro Technologies Division still accounts for 10 percent of technotrans revenue,
but there is immense potential for these innovative applications. This is why we have
invested extensively in this expertise over the past two years, and gathered experience
in this innovative area. We have identified numerous products as a result, and are
collaborating on their realisation. It is entirely possible that one or more of these will
achieve a breakthrough and create a new market. It is equally possible that we will
need a little more time and patience before this breakthrough materialises.
D I V I S I O N S 13
The moulds used in the manufacturing of microstructure components are produced on technotrans systems.

technotrans' two technical divisions are complemented by services
through which we support the customer for instance with the install-
ation or operation of systems, or provide assistance in the event of
hitches. Our technicians also serve as our "finger on the pulse" of
the market, enabling us to steadily improve in our efforts to meet
the customer's needs.
D I V I S I O N S14

15
D I V I S I O NSERVICES

technotrans equipment is used for governing applications that are frequently of critical
importance to the customer, as a result of which maintaining its availability is general-
ly a top priority. technotrans has consequently developed a comprehensive range of
services to provide our customers with the best possible support, in line with their
individual preferences.
This support often starts as early on as the installation and training processes, be-
cause expert users not only achieve better results in their everyday use of our equip-
ment; they are also more satisfied customers.
Rapid response for emergencies
If an operating fault should nevertheless occur, a carefully coordinated chain of mea-
sures cuts in, like interlocking gearwheels, to come swiftly to the customer's aid. The
international hotline makes an initial attempt to narrow down the source of the prob-
lem and produce interim solutions. Sophisticated logistics ensure that the necessary
spare parts are shipped as swiftly as possible to the customer, who, thanks to the
modular design of our equipment, will then often be able to exchange the relevant part
themselves. If it is nevertheless necessary to call out a member of our service team,
aid can be summoned straight away.
"Services when andwhere the customerneeds them"
■ Comprehensive support for customer-critical applications
■ Services to enhance customer satisfaction
■ Technical documentation offering own software solution
16
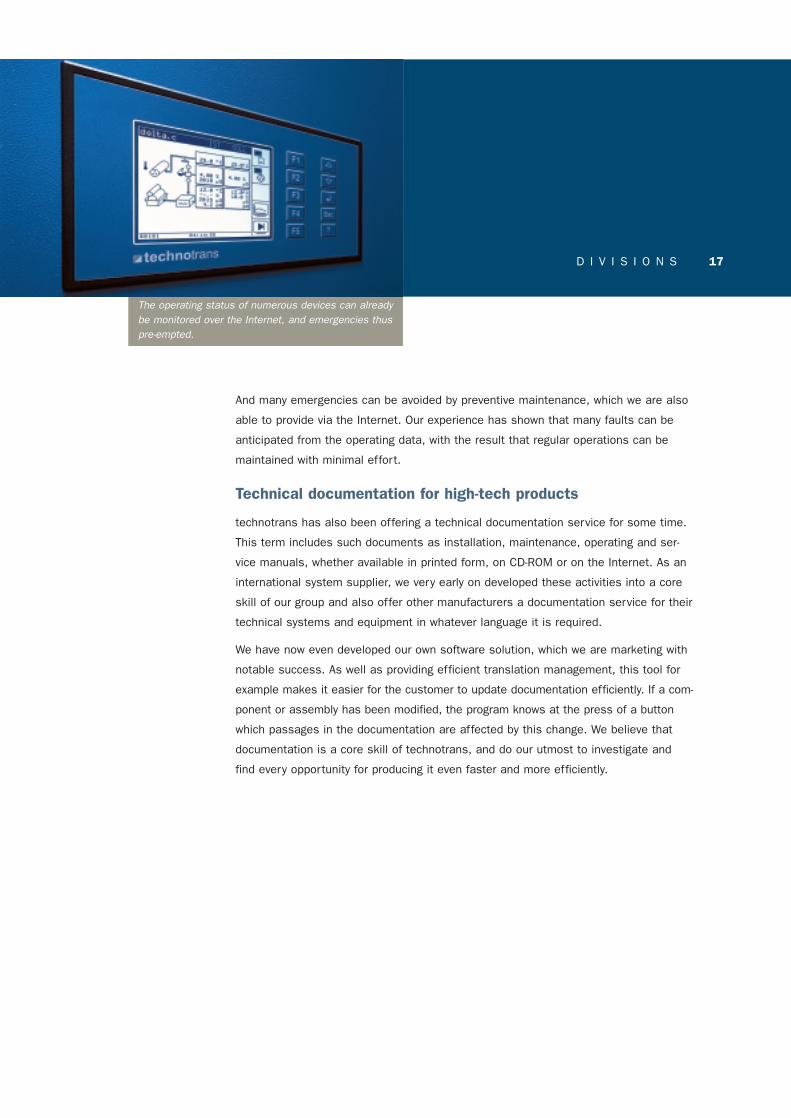
And many emergencies can be avoided by preventive maintenance, which we are also
able to provide via the Internet. Our experience has shown that many faults can be
anticipated from the operating data, with the result that regular operations can be
maintained with minimal effort.
Technical documentation for high-tech products
technotrans has also been offering a technical documentation service for some time.
This term includes such documents as installation, maintenance, operating and ser-
vice manuals, whether available in printed form, on CD-ROM or on the Internet. As an
international system supplier, we very early on developed these activities into a core
skill of our group and also offer other manufacturers a documentation service for their
technical systems and equipment in whatever language it is required.
We have now even developed our own software solution, which we are marketing with
notable success. As well as providing efficient translation management, this tool for
example makes it easier for the customer to update documentation efficiently. If a com-
ponent or assembly has been modified, the program knows at the press of a button
which passages in the documentation are affected by this change. We believe that
documentation is a core skill of technotrans, and do our utmost to investigate and
find every opportunity for producing it even faster and more efficiently.
The operating status of numerous devices can alreadybe monitored over the Internet, and emergencies thuspre-empted.
D I V I S I O N S 17

"R&D constitutes the basis for our strategy"
■ R&D target is to set new standards
■ In 2003 we invested € 3.6 million on R&D
18
As a technology company, technotrans naturally attaches considerable importance to
research and development. This field of activity in effect serves as the basis of our
strategy: we aim to expand or grow in new markets with our established technology, by
implementing new technology in established markets.
Automatic ink supply ink.line replaces the spatula
Our development activities – free from the pressure of day-to-day business yet never
very far from the customer – focus on very specific projects, the results of which play
a part in continuing to boost the technotrans content per printing press. A typical ex-
ample: ever since the invention of offset printing, printers have had to stand next to
their sheet-fed machines and dispense printing ink into the ink duct manually. A tedious
chore that is now superfluous, because we have replaced the need for a spatula with
the automatic ink supply system. The sensor-controlled ink.line system dispenses the
ink from cartridges to precisely the ink duct where it is needed. The printer can now
concentrate instead on the core task, which is the real key to creating "value added".
Over 6,000 systems have been installed worldwide since DRUPA 2000, when ink.line
marked its debut.
R&D with environmental benefit: spinclean
Greater automation, the desire to boost efficiency or simply the ambition to use
resources more effectively: the motives of our engineers are as diverse as the pro-
ducts that they develop. At this year's DRUPA, we will be unveiling the spinclean, for
example: a device that continually cleans the developer fluid that is used in the pro-
duction of printing plates. Initial field tests have revealed that at least 70 percent of

R E S E A R C H & D E V E L O P M E N T 19
R&D EXPENSES in million €
3.7 3.3 3.4 2.3 3.0
9999 0000 0011 0022 0033
% of sales
the developer fluid can be recovered in this way. This is a technology that rapidly pays
its way and protects the environment, because it also reduces the amount of chemi-
cals that need to be disposed of.
Development of new standards through listening to the market
In addition to developing new technologies and products, the aim of development is to
throw established ideas open to question. Part of this involves listening to the market
and identifying potential trends in customers' everyday practices. By adopting this
approach, we have succeeded in developing an array of new filtration systems, includ-
ing the adoption of separator technology in dampening solution supply devices. And as
so often in the past, we are convinced that this pioneering technology again will estab-
lish a new benchmark in the market.
We have also embarked on a quest to establish the standard in the domain of
microstructure technology. Over the past two years we have invested considerably in
the development of series-production devices that can be used to manufacture minute
components. Here too, we believe that standard technology will be used when industrial-
scale production gets off the ground. It is our aim to cement this market lead now.
We invested around € 3.6 million on development activities last year, thus making a
significant contribution towards consolidating and building on our position as a tech-
nology group in every market segment. To complement our activities, we are conduct-
ing cross-company research projects and collaborating with other research institutes.
A sound investment in the future of technotrans.
5.0 3.1 2.6 2.0 2.8

technotrans is a young company which offers its employees a distinctly international
working context, for all the provincial location of its headquarters in Sassenberg, in
the Münster region. The corporate philosophy of "Think-Learn-Act", in which aspects
such as customer orientation and open communication play as central a role as re-
sponsiveness and the challenge to question established concepts, is acted out direct-
ly in the day-to-day working environment. This means flat hierarchies, short decision-
making routes and ample space for creativity.
technotrans' employees are likewise young, with an average age of 36. More than
one-fifth of them have an academic education, including a large number of graduates
in various engineering disciplines. They particularly appreciate the freedom that techno-
trans gives them to attain their objectives. A system of remuneration that closely re-
flects personal performance and a group-wide stock options scheme ensure that all
employees are able to share directly in the company's success.
This climate that is characterised by trust and a genuine team spirit has also made
it possible to overcome successfully the economic challenges of the past few years.
From a shorter working week to wage concessions and short-time, no measure was
left unexplored as a means of steering the company through the industry-wide crisis.
The cooperative attitude of the Works Council deserves particular mention in this
specific connection. Thanks to these measures, job losses since 2001 have been
"Ample latitude for our employees"
■ Promoting frank exchanges and entrepreneurial thinking through
the corporate philosophy of "Think – Learn – Act"
■ Prominence of training and advancement at the company
■ Sense of solidarity even in difficult times
20

kept just a little above 100. This trend was moreover reversed in the latter months of
2003, and for the first time in a long while production capacity was increased. There
were 596 employees at technotrans at the end of the year.
Learning is an elementary pillar of technotrans' corporate culture, and training and ad-
vancement consequently enjoy a prominent status at the company. Each year, school-
leavers embark on apprenticeships in various vocations at our company. In view of
the chronic shortage of apprenticeships in Germany, we have in addition decided to
increase significantly the number of apprentices taken on by technotrans in the cur-
rent year. The company moreover offers its employees a wide range of opportunities
for acquiring additional specialist and personal qualifications. These include English
courses, special management development schemes and product training courses,
and even back training and give-up-smoking courses.
As a listed company, technotrans very early on started to help its employees to save
for the longer term. In recent years, a portion of the voluntary Christmas bonus has
regularly been paid to employees in the form of shares. Over the years, outside ex-
perts have helped us to develop an extensive range of individual savings products now
comprising three alternative forms of pension fund, a direct insurance policy, two ver-
sions of a second top-up pension and capital formation contributions. In-depth infor-
mation events and individual advisory sessions were arranged to enable every em-
ployee to choose which savings scheme best suited their needs.
E M P L O Y E E S 21
EMPLOYEES ACCORDING TO QUALIFICATION
Graduates…21%
Trainees…4%
Technical…22%
Other…9%Specialist trades…44%
NUMBER OF TECHNOTRANS EMPLOYEES
439 580 698 621 596
9999 0000 0011 0022 0033
Germany
outside Germany

technotrans AG has been a listed company since March 1998. Both we and our
shareholders have been subjected to a roller-coaster experience on the Neuer Markt
in recent years, with technotrans shares experiencing almost every conceivable turn of
fortune: from an inconspicuous security to a high flyer that for a long time flourished
independently of market trends, it was included in the Nemax 50 index in mid-2002
before finally plummeting irrationally and over the odds.
The shares started 2003 on 4.89 euros. The switch to Deutsche Börse's Prime
Standard and the abolition of the Nemax 50 blue-chip index finally put an end to the
fundamentally incomprehensible nosedive in the share price. The tide turned in mid-
March 2003, after our shares had hit an all-time low of 3.81 euros. By way of compar-
ison, the issue price in 1998 was 11.23 euros. This exaggeratedly depressed price
was corrected as the year went on, with the shares closing on 11.65 euros at the
end of December. This represents an increase of over 200 percent compared to the
record low. Alongside the fact that the shares were fundamentally undervalued, this
price appreciation was attributable to the brighter prospects for the economy in gen-
eral and the markets in which technotrans is active.
"technotrans sharesback on track"
■ Switch to the Prime Standard
■ Considerable investor confidence in our business model
■ Open dialogue with the capital market
22

STOCK EXCHANGES: FRANKFURT, XETRA ISIN DE0007449001
SHAREHOLDER STRUCTURE as of 31.12.2003
Free Float…87.5%
WestKB…5.45%
Management…7.05%
S H A R E / C O R P O R A T E G O V E R N A N C E 23
Year-high
Year-low
Year-end
Earnings per share
Cash flow per share
Dividend per share
* Dividend proposal
0203
KEY DATA
12.64
3.81
11.65
-1.66
1.02
0.30*
17.85
4.81
4.89
0.40
1.53
0.20
€
€
€
€
€
€
TECHNOTRANS SHARE MOVEMENT
175%
02.01.2003 = 5.08 €
250% 18.02.2004 = 13.90 €
TecDax
technotrans

We have naturally maintained a dialogue with the capital market throughout these
times, regularly staged roadshows in Germany and internationally, and were again able
to welcome over 30 analysts to our annual conference. Following this difficult year, we
can even take some pride in the fact that our investor base remains virtually unchanged.
The basis for this stability – an understanding of the company and its business model
as well as confidence in the management – is something we detected in many of the
discussions we held. This is the best motivation for us to continue along our chosen
path of partnership-driven success on the capital market.
Our objective is maximum transparency, as for example explicitly stated in the Investor
Relations section of our website. With a view to informing all capital market players
simultaneously, we offer an opportunity to register for the email subscription feature.
This enables us to supply interested parties automatically with all current news items
that are of relevance for the ongoing development of the company. We naturally regis-
tered a record number of visits following the disclosure of our plans to acquire Baldwin
in December 2003. We set up a special area providing information on all questions
concerning this topic.
Corporate governance
Most of the principles of corporate governance laid out in the recommendations have
been standard practice at technotrans for many years. The May 2003 version of the
German Corporate Governance Code incorporated further extensive additions, and
while many aspects of the Code reflect the current legal position, a great many of the
specifications are also aimed at companies and circumstances that are not wholly
applicable in the case of technotrans. For this reason, the 2003 Declaration of Com-
pliance by the Board of Management and Supervisory Board contained more qualifica-
tions than in the previous year.
The departures from the Corporate Governance Code relate on the one hand to aspects
that are not yet common practice at technotrans but which are to be taken into account
in the future. These include this corporate governance report in the Annual Report, and
the explanation of departures from the requirements, as well as the announcement of
the basic principles of the remuneration system for the Board of Management on the
Internet and the corresponding notes in the Annual Report, and notification of the Share-
holders' Meeting of the basic principles and changes. We in addition report shareholders'
equity in investments for the first time on page 52 of this Annual Report.
24

Interested parties will find the full current wording of the Declaration of Compliance
in the Investor Relations area of our website. www.technotrans.de
S H A R E / C O R P O R A T E G O V E R N A N C E 25
On the other hand, as mentioned above, various aspects of the Code relate to prac-
tices that are not relevant to technotrans, as a result of which we have decided not to
adopt the Code's specifications on certain matters. These include the requirement of
an excess for D&O insurance cover. The current policies do not envisage an excess,
nor do we perceive any need to take out new policies at the current time. A cap on
gains from our stock options scheme is likewise not envisaged. We provide detailed
information on the scheme on pages 69-70. In view of its special form and demanding
objectives, it serves as an appropriate means of motivating virtually all employees
within the company, and a cap specifically for members of the Board of Management
is neither envisaged nor particularly advisable in this instance.
After carefully weighing up the public interest against the interests of the members of
the Board of Management and Supervisory Board, we have moreover decided to pub-
lish details of their remuneration, broken down according to fixed and variable compo-
nents, but not individually for each member of these corporate bodies. We believe that
the knowledge gained by the public by the latter measure would encroach unreason-
ably on the private sphere of these members.

Group Management Report
26
General economic situation2003 was another year in which worldwide growth predictions failed to materialise.
The weak start to the year could not be made good in the second half, with the result
that the growth originally expected did not in the end take shape.
The underlying economic figures improved in the course of the year: the war in Iraq
was over relatively quickly, and a marked recovery on stock markets foreshadowed the
impending economic recovery. This trend was underpinned by the stabilisation of the
price of oil and comparatively very low interest rates.
Extreme fluctuations on foreign exchange markets, in particular the dramatic apprecia-
tion of the euro against the US dollar, were unable to stop the positive development in
the second half of 2003. In some quarters, the strengthening of the euro was regard-
ed as a sign of new confidence in the single currency.
The US economy made unexpectedly good progress, with domestic product growing by
3.0 percent, and the business confidence index for the eurozone has likewise been
pointing to growth since July. Germany put in a below-par performance with a year of
economic stagnation. The situation on the labour market remained difficult.
Situation in our branchThe printing industry, as the core market of technotrans' Print segment – it accounts
for two-thirds of the company's revenue – experienced a third year of crisis. The
German printing press manufacturers Heidelberger Druckmaschinen AG, MAN Roland
AG and Koenig & Bauer AG – which between them supply two out of three of all print-
ing presses worldwide – reported a sharp drop in orders, which in some categories
were down by more than 30 percent. As a consequence they were obliged to focus on
restructuring measures last year.
This Management Report
as well as the following
sections of the Annual
Report up to page 98
are a translation of the
German original. In the
case of doubt, the
German original takes
precedence.

G R O U P M A N A G E M E N T R E P O R T 27
Advertising spending is to some extent the driving force behind the printing industry.
Spending from this source was decidedly weak at the start of the year, though the
positive signs increased significantly in number in the second half. According to recent
research findings, advertising spending in Germany in 2003 rose by 3.3 percent to its
highest level since 2000. The volume for daily newspapers showed positive progress,
growing by more than 10 percent to € 4.1 billion (by comparison: Internet € 265 mil-
lion, +3.7 percent).
The second technology segment of technotrans, the Micro Technologies Division,
depends on the one hand on the market for systems for the production of optical stor-
age media, and on the other hand on microstructure production facilities. The number
of CDs and DVDs being produced continues to grow worldwide (at varying rates,
depending on format), but the installed capacity of electroforming systems is largely
sufficient to cover this demand. Investment spending in new equipment in the first
instance represents replacement investment. The field of microstructure technology is
rated by experts as a vigorously growing, innovative market that spans a wide range of
branches of industry. The potential for the manufacturing technology of these new
applications is thought to be vast, but cannot yet be clearly demarcated.
Revenue and earnings
Revenue growth delayed until second half
As a result of the protracted crisis in the printing industry, revenues in the first half of
the year were ultimately much lower than had been expected at the start of the year.
Compared with the rest of the world, the markets in the US, Europe and particularly
Germany were manifestly weak. The recovery in the second half of the year brought
the desired turn of fortunes. Revenue rose for the first time in two years in the third
and fourth quarters, in the latter case by more than 9 percent. This was nevertheless
insufficient to achieve the original revenue target for 2003 of € 115-120 million.
Revenue fell short of expectations by around € 10 million, at € 106.7 million (previ-
ous year: € 117.0 million, -8.8 percent).

28
In view of the question marks over an economic recovery in our main markets, we
resolved very early on to take appropriate measures to tackle the continuing fall in
demand. By winding up our production plant in Colchester, England, and transferring
operations to Sassenberg, Germany, in the first half of 2003 we were able to make
better use of existing capacity and optimise our cost structures.
Gross profit target achieved
Despite an almost 9 percent fall in revenue, technotrans succeeded in achieving its
earnings targets for its operations. This demonstrates that we have adapted flexibly to
fluctuating demand at a time of economic slackness, and have successfully shored up
our profitability through focused cost management. Although gross profit of € 35.9
million did not match the previous year's figure (-4.7 percent), the gross margin rose
from 32.2 percent to 33.7 percent.
Operating profit up 28 percent
The operating profit was up 27.8 percent on the previous year (€ 5.9 million) to slight-
ly more than € 7.5 million. With an operating margin of 7 percent as against 5 per-
cent in the previous year, we are able to report a significant improvement in this area,
too. Administrative costs were inflated in particular by consultancy costs of more than
€ 1.6 million for the planned takeover of the American company Baldwin Technology, Inc.
A letter of intent had been made public by both companies on December 12, 2003,
but Baldwin terminated negotiations at the end of January 2004. On the other hand,
SALES by region
other Europe…27%
USA…21%
Asia…10%
other…2%Germany…40%
SALES by segment in € million
73.4 104.9 131.0 117.0 106.7
9999 0000 0011 0022 0033
ServicesMicro Technologies

G R O U P M A N A G E M E N T R E P O R T 29
this expense was partly offset by the excess of proceeds over book value from the
sale of the production building in Colchester. Research and development costs rose
as expected from € 2.3 million to € 3 million in the run-up to this year's DRUPA. The
prior-year result was diminished by the creation of a provision of € 3.3 million for the
patent dispute with Baldwin.
Currency effects have minimal influence
Interest expense was reduced by 23.5 to just over € 1 million in 2003 thanks to the
reduction in long-term borrowings (by € 3.1 million). The influence of currency effects
was again minimal in 2003; technotrans benefits on the one hand from the fact that
the bulk of its revenue is billed in euros, and on the other hand from the fact that its
own production companies in America supply the same currency zone and that foreign
exchange losses from the financing of foreign entities (subsidiaries) are "parked" with-
in equity, with no effect on income, according to IAS.
Impairment of goodwill
In addition to regular goodwill amortisation (€ 1.7 million in 2003), a need for impair-
ment of goodwill and intangible assets in the Print and Micro Technologies segments
was ascertained in the year under review. technotrans had purchased the American
company Ryco Graphic Manufacturing, Inc., Chicago, in 2000, when the industry was
at its peak, at a price of € 18.6 million; a goodwill amount of € 15.4 million had to
be capitalised at the time. This goodwill constitutes part of the "Print" unit. The value
in use of the "Print" unit undercut its carrying amount by € 8.6 million, with the result
that the goodwills for this unit were reduced by the same amount.
The situation at the end of 2003 for the goodwill and intangible assets from the acqui-
sition of a Toolex division in 2001, which became part of the Micro Technologies seg-
ment, was similar. In this case, the remaining goodwill was reduced by € 2.8 million
and patents and expertise with a value of € 0.8 million written down.
30 This amortisation is tax-deductible in part, resulting in a one-off effect from impair-
ment of € 11.05 million. Both measures contribute towards reducing potential risks to
the future financial performance of technotrans.
In connection with the adjustments to goodwills, a valuation allowance was applied in
full to the deferred taxes of the two American companies and to the subsidiary in
Sweden. If the profitability of these companies should turn out to be more positive
than expected in the future, with the result that it might be possible to use the tax
loss carryforwards, this would result in a noticeably lower tax burden for the group.
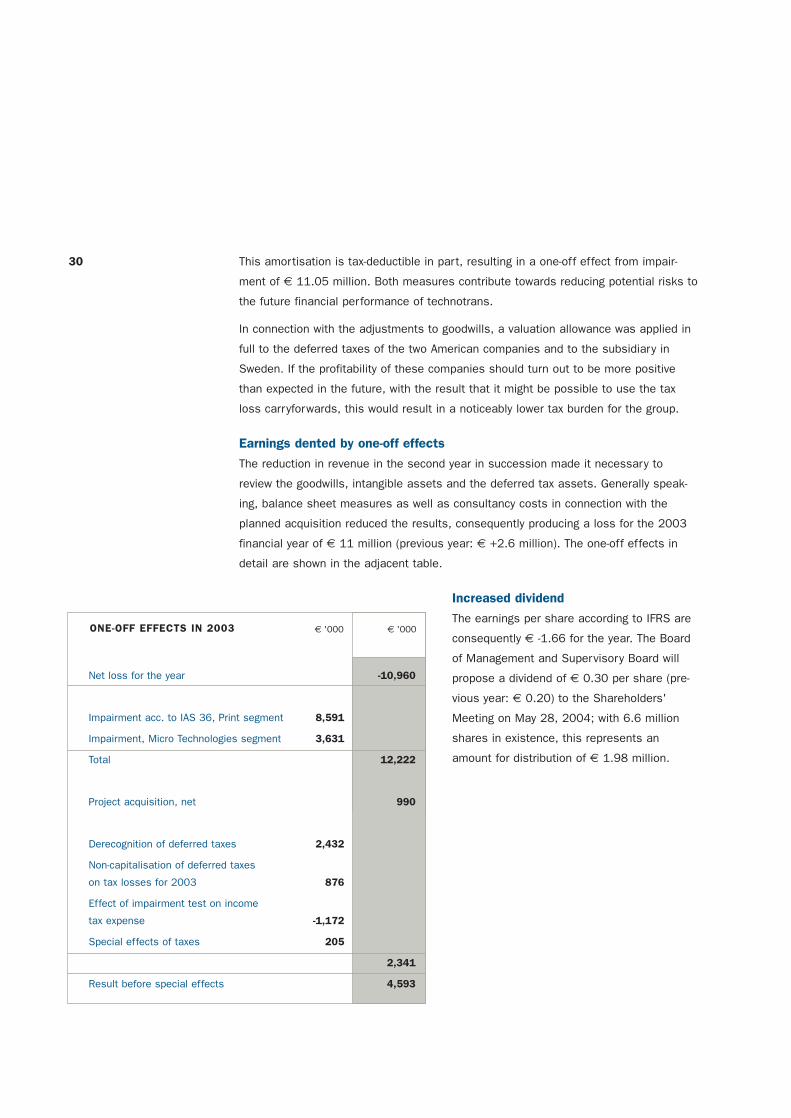
Earnings dented by one-off effects
The reduction in revenue in the second year in succession made it necessary to
review the goodwills, intangible assets and the deferred tax assets. Generally speak-
ing, balance sheet measures as well as consultancy costs in connection with the
planned acquisition reduced the results, consequently producing a loss for the 2003
financial year of € 11 million (previous year: € +2.6 million). The one-off effects in
detail are shown in the adjacent table.
Increased dividend
The earnings per share according to IFRS are
consequently € -1.66 for the year. The Board
of Management and Supervisory Board will
propose a dividend of € 0.30 per share (pre-
vious year: € 0.20) to the Shareholders'
Meeting on May 28, 2004; with 6.6 million
shares in existence, this represents an
amount for distribution of € 1.98 million.
ONE-OFF EFFECTS IN 2003 € '000€ '000
Net loss for the year
Impairment acc. to IAS 36, Print segment
Impairment, Micro Technologies segment
Total
Project acquisition, net
Derecognition of deferred taxes
Non-capitalisation of deferred taxes
on tax losses for 2003
Effect of impairment test on income
tax expense
Special effects of taxes
Result before special effects
-10,960
12,222
990
2,341
4,593
8,591
3,631
2,432
876
-1,172
205

G R O U P M A N A G E M E N T R E P O R T 31
Print segmentThe level of demand continued to fall in 2003 due to the crisis in the printing industry,
reaching the nadir mid-way through the year. The second half of the year, by contrast,
showed a marked improvement. Revenue for the Print segment amounted to € 70.6
million for the year as a whole. Although this figure was € 10 million or 12.4 percent
down on 2002, the decrease in 2002 had been in the order of € 18 million. The rev-
enue shortfall – particularly in the first half of the year – was nevertheless higher than
initially planned, not least because of exchange-rate effects. Print still accounted for
two-thirds of revenue in 2003.
As a result, structures were once again adjusted, including the closing-down of produc-
tion operations in Colchester and their transfer to Sassenberg. Even at this revenue
level, we thus succeeded in posting a positive operating result. The segment reported
earnings of € 1.8 million (previous year: € 0.6 million) at the end of the year. A sum
of slightly more than € 1.6 million in consultancy costs for the intended acquisition
constituted a charge for which it was not possible to budget. Without these costs, the
rate of return for the segment would have been 4.9 percent, not 2.6 percent, and
therefore on a par with the prior-year operating result in spite of the lower revenue.
SALES by segment
Micro Technologies…10.1%
Services…23.7%Print…66.2%
OPERATING PROFIT in € million
8.25 9.68 9.13 5.89 7.52
9999 0000 0011 0022 0033

32 Micro Technologies segmentRevenue for the Micro Technologies segment, which brackets together the areas
CD/DVD and microstructure technology, totalled € 10.8 million in 2003, thus once
again matching the prior-year level. This is all the more gratifying considering that
demand from the CD/DVD sector remained flat for the third year in succession, as
well as the fact that the market witnessed considerable competition, with the strength
of the euro against the US dollar presenting us with an added hurdle. The revenue
contribution of microstructure technology activities was welcome, though the growth
rates, starting from a very low base level, are not yet sufficient to outweigh the eas-
ing-off of demand from the CD/DVD sector, let alone emulate the past growth rates
of this segment.
The result for the segment continues to be diminished by the cost of developing the
future growth area of microstructure technology, totalling € 641,000 compared with
€ 819,000 in the previous year. In addition to a substantial improvement in profitability
at the end of the year, one-off effects amounting to € 600,000 at group level and
associated among other things with the valuation allowances on goodwill in the annual
financial statements were the reason why we were able to post a positive result at
year-end. Depreciation for the segment will be € 300,000 lower from 2004. This,
together with various internal measures, should help to provide sustained revenue.
Services segmentFollowing a surge in growth in 2002 (+23.1 percent), revenue for the Services seg-
ment of € 25.3 million was maintained at the previous year's level (€ 25.5 million).
Its proportion of total revenue rose from 21.8 percent to 23.7 percent. Due to the pre-
vailing economic situation, the emphasis for installations shifted more towards mainte-
nance and spare parts, as expected. The Technical Documentation business area like-
wise posted positive progress. In this area, more than half of external revenue for 2003
was generated through our self-developed software doculab.
The Services segment remains a dependable source of earnings for the group in these
difficult times. The result for the segment of € 4.8 million represents 63.5 percent of
consolidated operating earnings. Services which yield above-average profitability, such
as the sale of software licences, helped to boost the margin to a satisfying 18.9 per-
cent for the year under review (previous year: 15.9 percent). Since the fourth quarter,
however, it has become evident that the temporary need to provide more intensive sup-
port for new products appearing on the market, as is the case before the DRUPA indus-
try exhibition, is having an adverse effect on the result.

G R O U P M A N A G E M E N T R E P O R T 33
BALANCE SHEET STRUCTURE GROUP in € million
Cash…8.8 21.8…Short-term debt
14.3…Long-term debt
36.3…Equity
Receivables and prepaid expenses…19.2
Inventories…18.2
Non-current assets…26.2
72.4 72.4
Assets Liabilities
Balance sheet structureThe balance sheet total at December 31, 2003 was € 72.4 million (previous year:
€ 92.5 million). Allowances for goodwill made at the end of the year were the main
reason for this fall. They had become necessary in order to bring the balance sheet
values in line with the discounted cash flows over the remainder of the amortisation
period. Goodwill was consequently reduced by amortisation and impairment as well as
by exchange-rate losses of € 2.3 million booked with no effect on income, from € 19.8
million in the previous year to € 4.5 million (-77.5 percent). In this connection, the level
of deferred tax assets was likewise reduced from € 4.4 million at the end of 2002 to
€ 1.1 million at December 31, 2003. This measure will reduce potential future balance-
sheet risks.
Improved liquidity
The increase in current assets is attributable almost exclusively to a renewed improve-
ment in liquidity. Compared with € 7.3 million at the end of 2002, cash now totalled
€ 8.8 million (+20.1 percent). Inventories remained almost unchanged (€ 18.2 mil-
lion as against € 17.9 million).
In line with the changes on the assets side, the principal changes to equity and
liabilities relate to the item equity. This fell by € 15.4 million, from € 51.7 million to
€ 36.3 million, in particular as a result of the accumulated loss (€ 11.0 million), the
distribution of dividend for 2002 (€ 1.3 million) and exchange-rate losses not affect-
ing income (€ 2.9 million).

34 Long-term borrowings were again reduced in 2003 (-3.3 million, -21.5 percent). The
main changes within short-term borrowings related to the typical decrease in advances
received as a reflection of the order mix (€ -0.7 million) and a slight increase in pro-
visions (€ 9.0 million compared with € 8.4 million).
Sound balance sheet indicators
The main balance sheet indicators remain virtually unaffected by these changes, or
have improved significantly as a result (prior-year figures in brackets): the equity ratio
remains satisfactory at 50.1 percent (55.9 percent), the capital employed (as the sum
of interest-bearing liabilities and equity) fell to € 55.3 million (€ 74.4 million), the
return on capital employed (ROCE; operating profit + currency result as a ratio of capi-
tal employed) rose to 13.3 percent (7.6 percent).
Investment and finance€ 3.1 million (previous year: € 2.8 million) were invested in intangible assets and
property, plant and equipment in the past year. Investment was consequently lower
than depreciation (€ 5.3 million). This investment in the first instance took the form of
spending on extensions to the IT infrastructures and replacement investment, for
example for service vehicles. As a company with low manufacturing penetration, no
maintenance investment in plant and machinery was necessary, nor was any expan-
sion to capacity required in the light of the prevailing economic situation in 2003.
Investment was financed from cash flow; cash flow from operating activities amounted
to € 6.5 million (previous year: € 10.1 million). Although the free cash flow of € 5.4
million was unable to match the previous year's high level (€ 7.5 million), this figure
was positive for the second year in succession. On the other hand, we easily achieved
our aim of posting a positive free cash flow of at least the same magnitude as the tar-
geted earnings.
Procurement and productiontechnotrans develops, manufactures and sells equipment and systems for the printing
industry (Print segment) and electroforming systems for the manufacturing of
microstructures (Micro Technologies segment). The development of these systems and
the assembly of their components are among technotrans' core skills, whereas the
manufacturing of the components is outsourced to specialist suppliers. Our manufac-
turing penetration is thus exceptionally low.

INVESTMENT in € million CASH FLOW from operating activitiesin € million
2.8 4.6 4.3 10.1 6.5
9999 0000 0011 0022 0033
9999 0000 0011 0022 0033
G R O U P M A N A G E M E N T R E P O R T 35
Specialised locations worldwide
technotrans had five production locations worldwide at the end of 2003; the largest of
these locations act as centres of expertise for a particular technology. The production
companies use the group's entire network of 13 locations worldwide for their distribu-
tion and service activities. In Germany, various ancillary units for the printing industry
and systems for the Micro Technologies sector are manufactured at Sassenberg,
whereas the Stadtbergen plant, near Augsburg, has specialised in ink supply equip-
ment. Chicago is the production centre for spray dampening systems. Specific ancil-
lary units for the American offset printing market are made in Corona, near Los
Angeles. Beijing is our smallest production operation; it predominantly supplies pre-
assembled components for other production sites.
Ample capacity for handling an economic recovery
The question of production capacity utilisation has become more pertinent in the cur-
rent economic climate. With its very low manufacturing penetration technotrans is
demonstrably able to respond very flexibly to fluctuating demand. Capacity utilisation
in the traditional sense therefore refers exclusively to the floor space at the production
plants and the employees who work there. The company has no machinery or plant
that would cause a bottleneck when demand is running at a high level nor the corre-
sponding depreciation which diminishes profitability when demand is low. The existing
production area provides ample reserves for improved capacity utilisation when
demand recovers.
Investments – Other assetsInvestments – Property, plant and equipmentDepreciation
20
10

36 Suppliers tightly integrated
In view of the company's spread over five production sites and the low manufacturing
penetration, procurement management has become increasingly important. The aim is
to pool demand rationally for all manufacturing group companies worldwide, to inte-
grate suppliers closely into the production procedures and to develop joint strategies
for coping with fluctuating demand. We of course have sufficiently close ties with most
of our long-standing suppliers that any difficulties at those suppliers would become
evident well in advance, allowing us to arrange suitable alternatives.
Personnel and welfareThe number of employees within the technotrans Group again eased off in 2003. At
December 31, 2003 there were 596 (previous year 621) employees, a decrease of
4 percent. Whereas the workforce was trimmed in the first half of the year due to the
fall in demand, capacity was once again built up in the second half. The revenue per
employee (based on the average employee total for the year) has not changed sub-
stantially from the previous year, and was € 180 thousand (€ 183 thousand) for the
year under review.
In order to adapt to fluctuations in demand, priority measures implemented in 2003
involved the introduction of more flexible working hours and the postponement of the
collectively negotiated pay increase (at Sassenberg).
Personnel costs fell to € 29.3 million (previous year: € 31.9 million); this item as a
proportion of revenue remained almost unchanged at 27.4 percent (2002: 27.3 per-
cent).
Last year the employees once again received shares as a form of voluntary Christmas
bonus, with a two-year holding period. Six years on from the initial public offering, over
90 percent of all employees own shares in the company. The third tranche of stock
options was moreover issued after the Shareholders' Meeting in May 2003. These
stock options provide every employee with an opportunity to purchase shares at a
predetermined price after a waiting period of no less than two years, provided the per-
formance targets have been met. Further details of the stock options scheme are pro-
vided in the Notes, under Equity.

G R O U P M A N A G E M E N T R E P O R T 37
EMPLOYEES by segment
MicroTechnologies…8%
Services…26%Print…6%
Risk reportAs a worldwide technology and services group, technotrans is naturally exposed to a
large number of risks. We analyse and approach these on the basis of our principle of
dealing with potential risks responsibly.
Our risk management system is fundamentally aimed at assuring a uniform aware-
ness of risks among all employees, and forms an integral part of our business opera-
tions. To this end, potential risks in the various functional areas are systematically
identified and assessed. Where risks exceed defined thresholds of significance, they
are observed continually and corresponding measures initiated. The management is
informed promptly of potential risks and of the measures that have been taken.
Recent years have demonstrated that periods of economic slackness constitute a sig-
nificant risk for many companies, including in the printing industry. The current invest-
ment reticence among end customers, in other words printers, is being further exag-
gerated by the fact that DRUPA 2004 is looming large. On top of this, the structure of
the printing press industry resembles an oligopoly, dominated as it is by a small num-
ber of manufacturers. It is therefore only logical that technotrans generates over 60
percent of consolidated revenue in the Print segment from the world's five largest
printing press manufacturers. It would not be possible to compensate in the short
term for the unexpected loss of one such customer, and indeed would be difficult to

38 do so in the medium term. We are tackling economic and industry risks by constantly
analysing the market situation, exploiting scope for rationalisation, steadily expanding
our range of customer-focused services and extending both the depth and breadth of
our product range.
Every company has to use certain assumptions about how markets will develop as the
basis for its plans. The failure of anticipated figures to materialise can have an unsched-
uled impact on the company's development, which must then be assessed as part of
the risk management process and countermeasures then taken as appropriate.
The Micro Technologies segment is likewise exhibiting a protracted reluctance to invest.
Surplus capacity in the market is hindering demand. The market for microstructure appli-
cations is still young and expanding, and we believe it still harbours immense potential
for our equipment lines. The risks stem from the uncertainty as to how a young market
will develop.
As a company with international activities, technotrans has to contend with a large
number of legal constraints. There exists a particular risk in connection with the patent
dispute with a competitor that has been dragging on for several years. technotrans was
defeated in this lawsuit at the second instance. The ruling at the second instance of
November 14, 2002 paves the way for a claim for compensation, the level of which
may have to be determined in further legal proceedings. To minimise the risk, a provi-
sion totalling € 3 million was created, reflecting the value of the matter in dispute of
€ 2.5 million at the second instance as well as further legal expenses. technotrans
has filed a complaint against the non-admission of an appeal with the Federal Supreme
Court and lodged a revocation action against the enforced patent of its competitor with
the Federal Patents Court. There are no other legal proceedings of any significance. In
order to counteract potential risks from the wide range of tax, environmental, competi-
tion and other regulations and laws, we strictly adhere to laws and regulations and
obtain comprehensive advice both from our own employees and, in certain cases, from
established experts. As well as taking out an appropriate and economically justifiable
level of insurance cover, the company takes its own precautionary measures to guard
against the risk of elementary losses such as fire and loss of production.
In the light of volatile financial markets, the increasingly international scale of busi-
ness operations harbours risks in particular as a result of exchange rate movements.
Risks to business operations can largely be eliminated by natural hedging, which
means that the currencies in which purchases and sales are conducted are system-
atically harmonised. Group-wide finance management reduces further risks by hedging
substantial transactions. We aim to compensate for competitive disadvantages as a
result of exchange rate factors by implementing technological measures.
G R O U P M A N A G E M E N T R E P O R T 39
The adverse overall economic situation has prompted a rise in bankruptcies among
end customers and a deterioration in payment habits. We counteract this through a
stringent approach to the management of receivables and creditworthiness. Appropriate
specifications are applied as a means of reducing the credit risk by basing the provi-
sion of sales and services on the prevailing risk.
As a system supplier, the development of pioneering technologies is a key success
factor for us. Close cooperation with our customers right from the initial product idea,
through the development of the specific systems, to the drafting of concepts for
improvements, enables us to minimise potential risks at an early stage. We have also
established partnerships with research bodies, assuring the transfer of knowledge on
new potential applications. Both highly qualified and experienced employees safeguard
the necessary expertise for technotrans in this area.
This presentation of the applicable risks by no means constitutes an exhaustive sum-
mary – aspects of IT security, the valuations of inventories and technological substitu-
tion risks are also constantly monitored, for example. However, it is clear on the whole
that the level of exposure is limited by our adopting a responsible approach to identi-
fied and analysed risks, and that the only serious threat to technotrans is in the sum
of a large number of individual risks We have currently identified no risks which could
endanger the company's survival.
Research and developmentOur research and development activities make a significant contribution towards consol-
idating and building on our position in every market segment as an efficient, internation-
ally active technology group. Innovative capability is a decisive competitive advantage.
To complement this, pioneering technology trends are investigated and shaped at an
early stage through cross-company research projects and in collaboration with other
research institutes.

40 Pre-DRUPA year sees rise in spending
A total of € 3.6 million (previous year: € 3.3 million) was spent on research and devel-
opment in 2003. Of this amount, € 0.6 million was to be capitalised in accordance with
IFRS criteria (previous year: € 1.1 million). This total amount is spread between the Print
and Micro Technologies segments.
Activities for the Print segment focused on innovations that will be on show for the first
time at this year's DRUPA, the largest industry exhibition. Developments include an auto-
mated cartridge changer for the ink.line ink supply system. This reduces manual inter-
vention by the printer and responds to calls for a greater degree of automation.
We are also presenting our first product for the pre-press area: the spinclean is a de-
vice for cleaning the developer fluid used in printing plate exposure. Use of the spinclean
reduces the high costs arising from replacing and disposing of the developer fluid by
more than 70 percent. This is an outstanding example of how ecology and economics
can enter into a successful alliance.
In the Micro Technologies segment, the projects of the past year – above all the large-
area electroplating system "microform.400" – were largely completed. As well as this
large-format system, a system for smaller formats has been developed and well received
by the market.
Environmental protectionEnvironmental protection is regarded as a high priority at technotrans, even though
no immediate hazards to either the employees or the environment are created by the
company's activities of assembling plant and equipment. There is nevertheless a spe-
cial team by the name of technosafe, which has the purpose of identifying and elimi-
nating hazards.
The company's everyday operations also include a whole range of activities focusing
for example on reducing the amount of packaging, minimising the consumption of
water, electricity and gas, and making increased use of returnable packaging and
interchangeable containers as part of an ongoing process of optimisation.
A detailed survey of the situation at the largest production plant at Sassenberg car-
ried out in 2001, in line with the requirements of DIN EN ISO 14001 standard, con-
firmed our belief that technotrans has an efficient environmental protection system,
and there was consequently no immediate need for a further-reaching environmental
audit.

G R O U P M A N A G E M E N T R E P O R T 41
A whole array of our products also help to preserve natural resources. There is for
example ecoclean, the washing agent recovery system for the printing process. As
well as cutting the amount of solvent that the printer has to buy by around 90 percent,
it reduces the amount of toxic waste to be disposed of. We are conscious of our re-
sponsibility for our products and for the markets in which we operate. Our sales and
service employees actively endorse these principles in their dealings with customers,
and espouse the cause of protecting the environment.
Supplementary reportAfter the end of the financial year, Baldwin Technology Company, Inc., of Shelton,
Connecticut, USA, informed us on January 30, 2004 that it no longer wished to pur-
sue the negotiations on a potential merger of the two companies.
OutlookThe average growth rate forecasts for various national economies in the current finan-
cial year are 6 percent (Asia), 3 percent (USA), 1.8 percent (eurozone) and 1.5 to 2
percent (Germany). Global stimuli are being provided by Japan, Argentina and Brazil,
which appear to have pulled through the crisis. The semiconductor industry, which
kicked off the calamitous global downturn as a sector at the vanguard of the econom-
ic cycle, started 2004 just 14 percentage points down on the record highs of 2000.
Thanks to improved worldwide and internal basic data, a change for the better appears
to be more probable. Adjustment measures within the industry are likewise bearing
fruit: companies' profits have latterly risen by 15 percent and it is expected that
investment will pick up as a result.
Foreign exchange markets are one potential risk to global growth. The appreciation of
the euro has meant that percentage price increases for goods run into double digits,
with the result that although exports within the euro zone have gone up, sales to the
USA have fallen.

42 Germany anticipates growth
The experts expect that Germany will benefit in full from the economic recovery.
The IFO business confidence index has latterly returned to the level of late 2000 and
many early indicators lend substance to this confidence. Uncertainty as to forthcoming
reforms continues to cloud the horizon, with the result that the consumer sector is
still failing to deliver any impetus. Growth rates of 2.5 percent are expected for the
mechanical engineering sector in 2004; the priority remains to invest in rationalisation
measures rather than in additional capacity. This will consequently not ease the situa-
tion on the labour market in the short term.
As the printing industry lags behind in the economic cycle, it generally reflects trends
somewhat later. Experience has shown that an economic recovery generally goes hand
in hand with a rise in advertising spending, which provides printers with a reason to
invest in replacement and additional equipment. Whereas advertising spending in the
expanding markets of the USA (+4.7 percent) and Asia (+6 percent) is forecast to rise
sharply, the experts predict growth of 1 percent for Germany.
DRUPA 2004: how good will it be?
As matters stand, we therefore expect that the crisis in the printing industry will be
overcome in 2004; the intensity and sustainability of this recovery, on the other hand,
remain unclear. At this early stage of the recovery, we do not anticipate this year's
industry exhibition DRUPA 2004 to provide anything like the impetus of the previous
event in 2000. From a technical viewpoint, the spotlight will be less on trailblazing
innovations than on updated versions of established products in every area, the
focus being on enhanced efficiency and greater flexibility.
Our expectations are reflected by our targets of revenue growth ranging between eight
and ten percent for the Print segment. Our strategy remains to boost the technotrans
content per printing press. In a relevant market worth around € 600 million, we have
formulated various objectives for ourselves in order to tap further potential for the
future. This is another reason why we are convinced that we will very rapidly be able
to return to a course of growth, and one that is not solely dependent on an economic
recovery. We are also paying particular attention to the market of Japanese printing
press manufacturers, to which we attach considerable importance above all as a
gateway to the growth region of Asia.

G R O U P M A N A G E M E N T R E P O R T 43
Micro Technologies: still finding its feet
In 2004 the Micro Technologies segment is likely to remain on a par with the previous
year. We expect that our market for electroforming systems for the manufacture of
optical storage media will exhibit rather restrained progress as a result of the high
installed base and the disparity between the euro and the US dollar, whereas the area
of microstructure technology (MST) could make good progress but still remains of only
marginal significance to the revenue total for this segment. We are likely to concen-
trate on a number of applications that we consider to be particularly promising, such
as display technology and metallic MST parts.
The experience of recent years has demonstrated that our international expansion in
the Services segment has proved particularly beneficial. We will consequently be work-
ing intensively on further expanding our worldwide service structure.
Improved earnings in 2004
technotrans has used the crisis to optimise its cost structures and processes. Our
attention will be focused on keeping these aspects tightly under control even once the
recovery is under way, and thus on ensuring that any growth above all has a dispropor-
tionately high impact on earnings. The only factor to detract from earnings will be the
costs of participating in the DRUPA exhibition – staged only once every four years –
which will be of the customary magnitude. Risks from the recent exchange-rate devel-
opments have no immediate influence on our earnings plans, as our structure with
production plants in the USA and Europe is readily able to absorb such fluctuations.
As matters stand, we therefore expect the group to post revenue of € 115 million in
2004. Our aim will once again be to improve profitability this year. Our objective for
EBITA (earnings before interest, taxes and amortisation) is to draw closer to double
figures (2003: 8.4 percent). We expect the net profit for the year to be in the order of
€ 5.5 to 6 million. The free cash flow should likewise rise to between € 7 and 8 mil-
lion.
technotrans has ridden out the crisis well and we are convinced that the company is
suitably equipped to profit from an upcoming recovery in 2004. We will seize the
opportunities that this offers, as a company focusing on the two pillars of technology
and growth.

44
Consolidated FinancialStatements
Consolidated Balance Sheet …45 |
Consolidated Income Statement …46 |
Cash Flow Statement …49 |
Statement of Movements in Equity …50 |
Notes …51 |
Independent Auditors' Report …90 |
Proposal for the Distribution of Accumulated Profit …92 |
Corporate Bodies …94 |
Report of the Supervisory Board …96 |

€ '000€ '000€ '000
Note
Consolidated Balance Sheet
Assets
Current assets
Cash (1) 8,769 7,300 5,031
Trade receivables (2) 16,973 16,638 17,312
Inventories (3) 18,200 17,930 22,538
Income tax rebates 841 1,452 280
Prepaid expenses and other short-term receivables (4) 1,374 1,403 1,474
46,157 44,723 46,635
Non-current assets
Property, plant and equipment (5) 16,963 19,116 20,710
Intangible assets (6) 3,034 4,099 3,388
Goodwill (7) 4,470 19,824 24,531
Deferred tax (8) 1,112 4,374 3,091
Other long-term assets (9) 655 405 687
26,234 47,818 52,407
Total assets 72,391 92,541 99,042
Equity and liabilities
Short-term debt
Short-term borrowings and short-term component of long-term borrowings (10) 6,100 6,166 5,696
Trade payables (11) 2,904 3,075 3,758
Advances received (12) 1,696 2,398 3,749
Provisions (13) 9,029 8,446 5,258
Income taxes payable (14) 290 780 1,368
Other short-term debt (15) 1,820 1,877 2,562
21,839 22,742 22,391
Long-term debt
Long-term borrowings (10) 12,076 15,390 19,354
Deferred tax (16) 1,604 1,538 1,773
Provisions for pensions (13) 151 136 124
Other long-term debt (17) 433 1,015 644
14,264 18,079 21,895
Equity (18)
Issued capital 6,600 6,600 6,600
Capital reserve 36,412 36,406 36,396
Revenue reserve -493 9,569 8,447
Hedging reserve -425 -591 -387
Exchange differences -5,808 -2,360 1,664
Accumulated loss/profit 2 2,096 2,036
36,288 51,720 54,756
Total equity and liabilities 72,391 92,541 99,042
C O N S O L I D A T E D F I N A N C I A L S T A T E M E N T S 45
31.12.200131.12.200231.12.2003

Consolidated Income Statement
€ '000€ '000€ '000
200120022003
Revenue (19) 106,737 117,012 130,990
of which
Print 70,631 80,623 98,733
Micro Technologies 10,774 10,861 11,526
Services 25,332 25,528 20,731
Cost of conversion (20) -70,808 -79,317 -89,367
Gross profit 35,929 37,695 41,623
Distribution costs (21) -12,388 -12,503 -15,238
Administrative costs (22) -12,464 -12,083 -11,970
Research and development costs (23) -2,970 -2,321 -3,388
Other operating income and expenses (24) 1,122 -2,940 183
Amortisation of goodwill (25) -1,707 -1,961 -2,080
Operating profit 7,522 5,887 9,130
Interest revenue/expense (26) -1,027 -1,387 -1,648
Foreign currency gains/losses (27) -145 -261 -484
Impairment loss acc. to IAS 36 (6,7) -12,222 0 -1,121
Accounting profit -5,872 4,239 5,877
Income tax expense (28) -1,752 -3,066 -3,407
Deferred tax (28) -3,336 1,447 951
Net loss/profit for the year -10,960 2,620 3,421
Earnings per share (€) (29)
(basic) -1.66 0.40 0.53
(diluted) -1.66 0.40 0.53
46
Note

Segment Report according to division
External revenue 2003 70,631 10,774 25,332 0 0 106,737
2002 80,623 10,861 25,528 0 0 117,012
2001 98,733 11,526 20,731 0 0 130,990
Internal revenue 2003 12,322 1,830 6,077 0 -20,229 0
2002 12,679 1,608 7,619 0 -21,906 0
2001 13,259 3,398 6,513 0 -23,170 0
Inter-segment revenues 2003 0 0 1,324 0 -1,324 0
2002 0 0 1,378 0 -1,378 0
2001 0 0 1,825 0 -1,825 0
Segment result before 2003 3,067 1,115 4,776 271 0 9,229
amortisation of goodwill 2002 2,078 1,301 4,049 420 0 7,848
2001 5,661 1,109 4,021 419 0 11,210
Segment result 2003 1,834 641 4,776 271 0 7,522
2002 599 819 4,049 420 0 5,887
2001 4,065 625 4,021 419 0 9,130
Segment assets 2003 41,468 7,274 12,926 0 10,723 72,391
2002 52,121 10,802 16,338 155 13,125 92,541
2001 61,665 13,844 15,132 0 8,401 99,042
Segment liabilities 2003 10,926 1,316 3,100 0 20,760 36,103
2002 11,783 1,902 2,310 0 24,826 40,821
2001 11,874 1,323 2,898 0 28,191 44,286
Investment 2003 2,028 430 646 0 0 3,104
2002 1,628 646 344 155 0 2,773
2001 9,933 10,672 1,308 0 0 21,913
Depreciation 2003 3,378 1,048 882 0 0 5,308
2002 3,287 1,037 947 0 0 5,271
2001 3,836 1,058 610 0 0 5,504
Other non-cash expenses 2003 3,625 368 653 0 0 4,646
2002 5,775 393 1,197 0 0 7,365
2001 4,302 912 500 0 0 5,714
€ '000 € '000 € '000 € '000 € '000 € '000
Print Micro Services Other Consolidated/ GroupTechnologies not allocated
C O N S O L I D A T E D F I N A N C I A L S T A T E M E N T S 47

Segment Report according to geographical region
External revenue 2003 42,520 29,470 22,512 10,720 1,515 0 106,737
2002 55,621 30,808 22,074 8,457 52 0 117,012
2001 58,140 32,796 30,172 7,942 1,940 0 130,990
Segment assets 2003 47,562 1,344 10,086 2,676 0 10,723 72,391
2002 43,325 9,091 24,134 2,866 0 13,125 92,541
2001 47,088 9,685 31,836 2,032 0 8,401 99,042
Investment 2003 2,307 584 103 110 0 0 3,104
2002 2,219 261 140 153 0 0 2,773
2001 10,394 6,034 5,334 151 0 0 21,913
€ '000 € '000 € '000 € '000 € '000 € '000 € '000
Germany Rest of Europe USA Asia Other Not allocated Group
48

Cash Flow Statement
€ '000€ '000€ '000
Cash flow from operating activities (30)
Net loss/profit for the year -10,960 2,620 3,421
Adjustments for:
Depreciation 5,308 5,271 5,504
Impairment loss acc. to IAS 36 12,222 0 1,121
Deferred tax expense (+)/income (-) 3,336 -1,447 -951
Profit (-)/loss (+) on the disposal of property, plant and equipment -594 19 -29
Foreign exchange losses (+)/gains (-) 145 -784 -451
Cash flow from operating activities before working capital changes 9,457 5,679 8,615
Change in receivables -617 -427 -2,991
Change in inventories -1,078 4,608 -2,946
Change in other long-term assets -294 282 -687
Change in liabilities -1,296 -3,307 1,868
Change in provisions 319 3,242 413
Net cash from operating activities 6,491 10,077 4,272
Cash flow from investing activities (31)
Acquisition of subsidiaries less acquired liquid assets 0 0 -5,195
Retrospective adjustment of purchase price for subsidiary 0 0 422
Acquisition of intangible assets and of property, plant and equipment -3,104 -2,773 -7,380
Proceeds from the sale of property, plant and equipment 2,007 166 1,054
Net cash used for investments -1,097 -2,607 -11,099
Cash flow from financing activities (32)
Proceeds from injection of equity 0 0 9,498
Cash receipts from the raising of short-term and long-term loans 794 470 4,469
Cash payments from the repayment of loans -3,087 -4,040 -2,576
Cash payments for finance leases 0 0 -50
Distributions to investors -1,320 -1,540 -2,575
Net cash used in financing activities -3,613 -5,110 8,766
Change in cash from exchange rate movements -312 -91 -43
Increase in cash 1,469 2,269 1,896
Cash at start of period 7,300 5,031 3,135
Cash at end of period (33) 8,769 7,300 5,031
C O N S O L I D A T E D F I N A N C I A L S T A T E M E N T S 49
200120022003Note

Statement of Movements in Equity
€ '000 € '000 € '000 € '000 € '000 € '000 € '000
Issued Capital Revenue Hedging Exchange Accumulated Equitycapital reserve reserve reserve differences profit
50
01.01.2001 6,180 20,066 6,643 -251 886 3,003 36,527
Exchange rate movements 0 0 0 0 778 -9 769
Change from approved capital 420 16,350 0 0 0 0 16,770
Payment into the revenue reserve 0 0 1,804 0 0 -1,804 0
Change in market value of financial instruments 0 0 0 -136 0 0 -136
Net profit for the year 0 0 0 0 0 3,421 3,421
Distribution of profit 0 0 0 0 0 -2,575 -2,575
Other 0 -20 0 0 0 0 -20
31.12.2001 6,600 36,396 8,447 -387 1,664 2,036 54,756
01.01.2002 6,600 36,396 8,447 -387 1,664 2,036 54,756
Exchange rate movements 0 0 0 0 -4,024 485 -3,539
Payment into the revenue reserve 0 0 1,505 0 0 -1,505 0
Change in market value of financial instruments 0 0 0 -204 0 0 -204
Net profit for the year 0 0 0 0 0 2,620 2,620
Distribution of profit 0 0 0 0 0 -1,540 -1,540
Other 0 10 -383 0 0 0 -373
31.12.2002 6,600 36,406 9,569 -591 -2,360 2,096 51,720
01.01.2003 6,600 36,406 9,569 -591 -2,360 2,096 51,720
Exchange rate movements 0 0 0 0 -3,448 504 -2,944
Withdrawals from the revenue reserve 0 0 -9,689 0 0 9,689 0
Payments into the revenue reserve 0 0 7 0 0 -7 0
Change in market value of financial instruments 0 0 0 166 0 0 166
Net loss for the year 0 0 0 0 0 -10,960 -10,960
Distribution of profit 0 0 0 0 0 -1,320 -1,320
Other 0 6 -380 0 0 0 -374
31.12.2003 6,600 36,412 -493 -425 -5,808 2 36,288

C O N S O L I D A T E D F I N A N C I A L S T A T E M E N T S 51
Notes to the Consolidated Financial Statements
I. Application of the IFRS – basic notes
The consolidated financial statements of technotrans AG at December 31, 2003
are prepared in accordance with the International Financial Reporting Standards (IFRS)
applicable on that date. In accordance with Section 292a of German Commercial
Code, no consolidated financial statements in accordance with German accounting
standards were prepared, as the relevant requirements had been satisfied.
The consolidated financial statements are based on standard recognition and meas-
urement principles. They are expressed in € thousand.
The shares of technotrans AG are traded on the regulated market of the Frankfurt
Stock Exchange, in the Prime Standard segment. To assure consistency of presenta-
tion, these accounts have been formatted in accordance with the rules and regula-
tions of the Frankfurt Stock Exchange, Annex to Section 63, Para. 6 (Transparency
requirements for the Prime Standard). In a departure from the stock exchange rules
and regulations but in accordance with IAS 12.70, deferred tax is allocated exclusively
to long-term items. The designations of the items have moreover been brought in line
with IFRS. Items with a total of zero are not shown.
II. Group
a) Reporting entity
In addition to the parent company technotrans AG, Sassenberg, the consolidated
financial statements include eleven fully consolidated subsidiaries in which techno-
trans AG directly or indirectly has a 100 percent interest. The financial year throughout
the reporting entity is the calendar year.

technotrans AG, Sassenberg Parent(and Stadtbergen, production plant) P/S company 46,022 80,097 -9,988 404
technotrans graphics limited, Colchester, Essex/Great Britain S 100% 3,911 9,034 513 40
technotrans scandinavia AB, Stockholm/Sweden S 100% 5,513 1,372 -1,269 3
technotrans france s.a.r.l., Saint-Maximin/France S 100% 1,080 3,796 164 14
technotrans italia s.r.l., Legnano/Italy S 100% 599 1,710 37 9
technotrans america, inc., Chicago, Illinois/USA P/S 100% 2,762 9,547 -11,309 53
technotrans america west, inc., Corona, California/USA P/S 100% -43 11,390 -1,513 42
technotrans japan k.k., Kobe/Japan S 100% 592 3,900 98 5
technotrans china ltd., Hong Kong S 100% 216 1,215 123 4
technotrans printing equipment (beijing) co. Ltd., Beijing/People's Republic of China P/S 100% 431 708 52 6
technotrans technologies pte ltd., Singapur S 100% 1,138 4,482 209 13
globalprint AG, Sassenberg 100% 672 0 1 0
Company Production/ Interest Equity* Revenue* Profit after Employees,
Sales+Service tax* average for
year
€ '000 € '000 € '000
*Equity, revenue and profit after tax have been calculated in accordance with the regulations applicable locally for each subsidiary.
52
The reporting entity was unchanged from the previous year.
b) Consolidation methods
The consolidated financial statements are based on the group companies' annual
financial statements (Commercial Balance Sheet II based on the IFRS) prepared in
accordance with standard principles as at December 31, 2003. These annual financial
statements have each been audited. Only technotrans japan k.k. and globalprint AG
were subjected to a review according to ISA 910.
Capital consolidation for the subsidiaries is performed according to the purchase
method (book-value method). In accordance with IAS 22, the valuations at the time of
acquisition are initially adopted. Interim financial statements were available for this
purpose. The resulting difference is then added to assets and debts up to their fair
value. Any remaining amount is reported under fixed assets as goodwill and amortised
by the straight-line method.
The following table shows the reporting entity:

C O N S O L I D A T E D F I N A N C I A L S T A T E M E N T S 53
Intra-group trade, expenditure and earnings, together with all receivables and liabili-
ties between the consolidated companies, have been eliminated. Netting differences
resulting from exchange rate changes have been booked to the result for the period
where they occurred within the reporting period. Assets from intra-group trade which
appear under fixed assets and inventories have been adjusted to eliminate any inter-
mediate results.
c) Recognition and measurement principles
The application of specific IFRS is indicated in the notes to the individual items of the
financial statements. The following methods of recognition and measurement were
fundamentally applied:
Cash is reported at face value and converted into € at the closing rates.
Receivables are fundamentally reported at amortised cost. Receivables in foreign cur-
rency are translated at the balance sheet date, at the closing rate, in accordance with
IAS 21.9 and 11. Provision is made for credit risks in the form of valuation allowances.
Long-term non-interest-bearing receivables are discounted.
The inventories reported are always shown at cost of acquisition or cost of conversion,
using the weighted average cost method, or net realisable value (Nettoveräußerungs-
wert) if lower. In accordance with IAS 2, cost of conversion includes the prime costs,
as well as all systematically allocable fixed and variable production overheads.
Finance charges are not capitalised.
Individual downward valuation adjustments have been made on all inventories where
their net realisable value is lower than the cost of acquisition or conversion. The net
realisable value is taken to be the prospective sales revenue less the costs incurred
up until their sale. If the reasons which have led to downward valuation cease to
apply, a reversal is made.
Property, plant and equipment are reported at cost of acquisition or cost of conver-
sion, less depreciation and impairment losses. Retrospective acquisition costs are
capitalised. In the case of self-constructed assets, the cost of conversion is calculated
on the basis of prime costs as well as the systematically allocable fixed and variable
production overheads, including depreciation. Borrowing costs are not recognised.
Maintenance costs are recorded as a direct expense.

Property, plant and equipment are depreciated according to the straight-line method,
on the basis of their useful life. The useful lives and depreciation methods applied
are periodically reviewed.
Insofar as necessary, the value of property, plant and equipment is adjusted to
the recoverable amount. If the circumstances which led to this measure subsequently
cease to apply, the valuation allowance is reversed at most by an amount which would
not cause the net carrying amount to be exceeded if no valuation allowance had been
applied.
Intangible assets, namely concessions and industrial and similar rights and values
acquired for consideration are carried at cost. They are amortised by the straight-line
method, according to their useful life.
Self-constructed intangible assets, which in the case of technotrans comprises capi-
talised development expenditure, are recognised at cost. Pursuant to IAS 38.53 ff.,
these comprise the prime costs as well as all directly allocable fixed and variable pro-
duction overheads that arise from the start of the development phase to its conclu-
sion. The conditions for capitalisation laid down in IAS 38.19, 38.20 and 38.45 are
met. Amortisation of capitalised development costs commences as soon as the asset
is available for use. This usually coincides with the start of its commercial use. This
amortisation is calculated by the straight-line method over five years, in accordance
with the anticipated product life-cycle.
The notes on property, plant and equipment apply analogously to any necessary
adjustment in the value of intangible assets to the "recoverable amount".
Goodwill from the consolidation of capital is amortised by the straight-line method
over periods of 5 to 15 years, but predominantly 10 to 15 years, pursuant to IAS 22
in accordance with its useful life. Insofar as necessary, the value is adjusted to the
recoverable amount. Pursuant to IAS 36.109, such an adjustment in value where the
circumstances which led to it subsequently cease to apply is fundamentally not re-
versed. In accordance with IAS 21.33 (a), goodwill recognised for subsidiaries is
translated at the closing rate.
Deferred taxes are created for temporary differences between the amounts in the
consolidated balance sheet and the tax base. In accordance with IAS 12, deferred
taxes are moreover capitalised on tax loss carryforwards where their use is probable.
Liabilities are fundamentally carried at amortised cost. Liabilities in foreign currency
are translated in accordance with IAS 21.9 and 11.
54

Provisions are created to cover obligations to third parties if these obligations are
likely to result in a future outflow of resources and their amount can be estimated.
They are measured at the likely amount at which settlement will take place.
Provisions for pensions are recognised as a liability pursuant to IAS 19.64 using the
benefit/years of service method. Actuarial gains and losses are recognised in the year
in which they occur.
Derivative financial instruments are recognised at market value. At technotrans, deriv-
ative financial instruments are used almost exclusively for hedging interest rate risks
which qualify as cash flow hedges. Changes in the market value are therefore booked
to equity with no effect on income.
Revenues from the sale of goods are recognised in accordance with IAS 18.14 if the
significant risks and rewards have been transferred to the buyer. Revenues from ser-
vices are received according to IAS 18.20 on the basis of the stage of completion.
If a contract from a customer involves both the delivery of goods and the provision
of a service, such as assembly and commissioning, revenue is always realised upon
acceptance by the customer.
Currency translation: the concept of the functional currency has been applied in trans-
lating the financial statements of consolidated companies which have been prepared
in foreign currency. Insofar as the group companies handle their operations largely
independently in financial, commercial and organisational terms, they are treated as
"foreign entities" pursuant to IAS 21. The functional currency then corresponds to the
currency of the country in which the company is based. In the case of the Singapore
subsidiary the euro is considered to be the functional currency, as its revenues and
expenses are recorded predominantly in euros. Assets and liabilities are translated at
the mean rate on the balance sheet date (closing rate), and expenses and income at
the mean rate for the year. The resulting exchange difference is included under equity,
with no effect on net income.
In a departure from this principle, the impairment in accordance with IAS 36 which
became effective at the end of the year has been translated at the mean rate on the
balance sheet date, to reflect IAS 21.30 (b).
The individual financial statements of the consolidated companies prepared in local
currency report monetary items (cash, receivables and liabilities) in foreign currency at
the rate on the date of the transaction. All exchange differences from the translation
of monetary items at the closing rate were charged or credited to income. Non-mone-
tary items were translated at the historical rate.
C O N S O L I D A T E D F I N A N C I A L S T A T E M E N T S 55

USD 1.1311 0.9455 0.8958 1.2610 1.0477 0.8820
JPY 130.9530 118.0754 108.6900 134.8500 124.3600 115.7200
GBP 0.6919 0.6288 0.6220 0.7070 0.6505 0.6088
SEK 9.1227 9.1615 9.2526 9.0710 9.1820 9.3300
CNY 9.2134 7.6602 7.2485 10.2676 8.5460 7.1349
HKD 8.8093 7.3771 - 9.7886 8.1753 -
Mean rates for the year Mean rates at balance sheet date
Financial year Financial year Financial year
2003 2002 2001 31.12.2003 31.12.2002 31.12.2001
The principal differences between these financial statements and those prepared
in accordance with the rules of recognition and measurement under the German
Commercial Code are as follows:
– The individual financial statements of the consolidated companies prepared in local
currency report monetary items in foreign currency at the closing rate pursuant to
IAS 21, whereas the principle of imparity is to be observed under the German Com-
mercial Code.
– Raw materials and consumables used, as well as goods, are depreciated to the
lower replacement cost under the German Commercial Code, whereas depreciation
under IAS is merely based on the sales market. For this reason, according to IAS a
valuation allowance is only reported if the net realisable value is below the carrying
amount.
– According to IAS 12, the concept of timing differences that apply to deferred tax is
broader than in the German Commercial Code. In contrast to the German Commercial
Code, deferred tax from losses which can be carried forward for tax purposes are
always to be capitalised under IAS 12.
– Development costs are to be regarded as an asset and capitalised where certain
criteria are satisfied cumulatively, in accordance with IAS 38. The German Commer-
cial Code does not permit capitalisation.
– IAS 39 specifies that derivative financial instruments be reported as an asset or
liability at their market value.
– Exchange differences from a monetary item that is essentially to be regarded as
part of a net investment in a foreign entity are to be booked to equity with no effect
on income, pursuant to IAS 21, until it is sold. Under the German Commercial Code,
these exchange differences are booked to the result for the period.
56
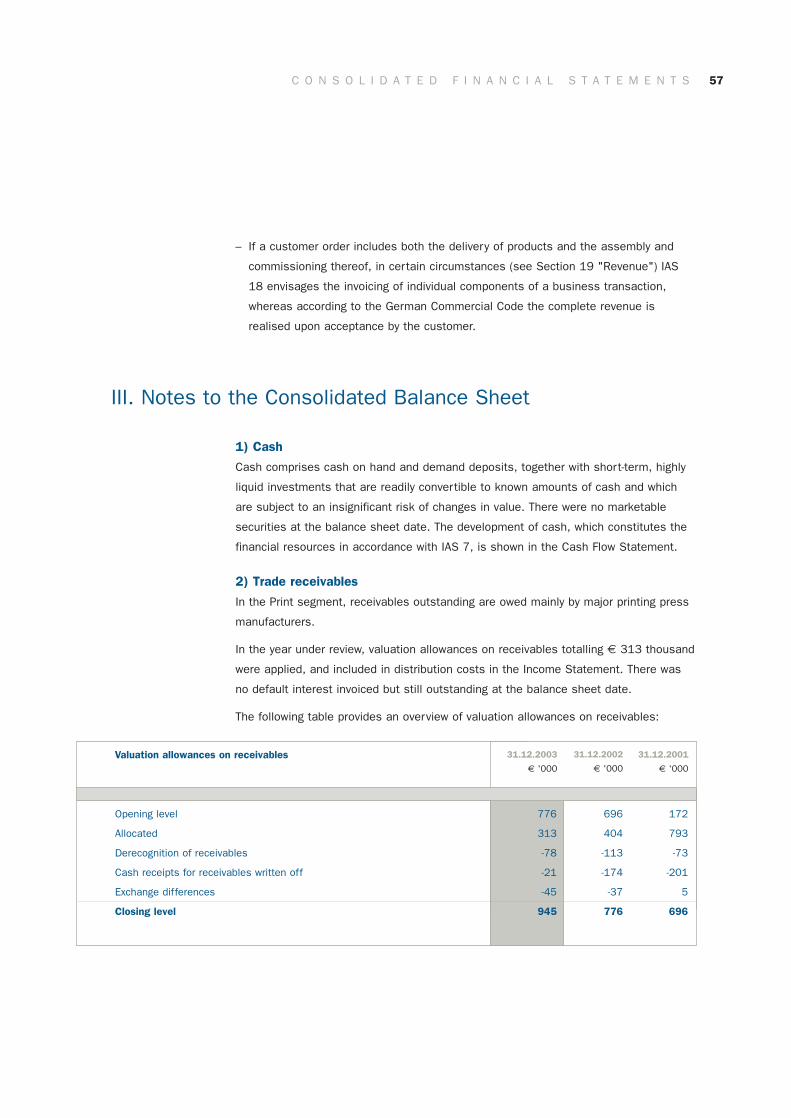
III. Notes to the Consolidated Balance Sheet
1) Cash
Cash comprises cash on hand and demand deposits, together with short-term, highly
liquid investments that are readily convertible to known amounts of cash and which
are subject to an insignificant risk of changes in value. There were no marketable
securities at the balance sheet date. The development of cash, which constitutes the
financial resources in accordance with IAS 7, is shown in the Cash Flow Statement.
2) Trade receivables
In the Print segment, receivables outstanding are owed mainly by major printing press
manufacturers.
In the year under review, valuation allowances on receivables totalling € 313 thousand
were applied, and included in distribution costs in the Income Statement. There was
no default interest invoiced but still outstanding at the balance sheet date.
The following table provides an overview of valuation allowances on receivables:
– If a customer order includes both the delivery of products and the assembly and
commissioning thereof, in certain circumstances (see Section 19 "Revenue") IAS
18 envisages the invoicing of individual components of a business transaction,
whereas according to the German Commercial Code the complete revenue is
realised upon acceptance by the customer.
31.12.2001
€ '000
31.12.2002
€ '000
31.12.2003
€ '000Valuation allowances on receivables
Opening level 776 696 172
Allocated 313 404 793
Derecognition of receivables -78 -113 -73
Cash receipts for receivables written off -21 -174 -201
Exchange differences -45 -37 5
Closing level 945 776 696
C O N S O L I D A T E D F I N A N C I A L S T A T E M E N T S 57

3) Inventories
Of total inventories, € 5,143 thousand (previous year: € 3,616 thousand) are
valued at the lower net realisable value. The valuation allowances on receivables
totalled € 2,071 thousand at the balance sheet date (previous year: € 1,958
thousand).
4) Prepaid expenses and other short-term receivables
Income tax rebates were reported in the consolidated financial statements at
December 31, 2002 and December 31, 2001, under prepaid expenses and other
short-term receivables. They are now reported separately in the balance sheet.
The prior-year financial statements quoted have been adjusted accordingly.
31.12.2001
€ '000
31.12.2002
€ '000
31.12.2003
€ '000
Raw material and consumables 9,971 9,700 11,499
Work in progress, finished goods and merchandise 8,160 8,208 11,035
Prepayments 69 22 4
18,200 17,930 22,538
31.12.2001
€ '000
31.12.2002
€ '000
31.12.2003
€ '000
Credits outstanding 2 350 415
Creditable input tax from intra-EC deliveries 117 226 324
Prepaid expenses 597 606 432
Other 658 221 303
1,374 1,403 1,474
58

5) Property, plant and equipment
Property, plant
and equipment
€ '000
Prepayments
made and
construction
in progress
€ '000
Other assets,
plant and
other
equipment
€ '000
Land, land
rights and build-
ings, including
buildings on
land owned by
others
€ '000
Costat January 1, 2003 17,368 11,002 155 28,525
Foreign currency translation differences -330 -319 0 -649
Additions 86 1,703 143 1,932
Disposals -1,187 -1,676 0 -2,863
Transfers 0 222 -222 0
Costat December 31, 2003 15,937 10,932 76 26,945
Cumulative depreciation at January 1, 2003 2,767 6,642 0 9,409
Foreign currency translation differences -39 -167 0 -206
Depreciation for the year 588 1,671 0 2,259
Disposals -215 -1,265 0 -1,480
Cumulative depreciation at December 31, 2003 3,101 6,881 0 9,982
Residual carrying amounts at December 31, 2003 12,836 4,051 76 16,963
Self-constructed assets totalling € 12 thousand (previous year: € 21 thousand) were
capitalised in the 2003 financial year.
Depreciation is carried out over the following periods:
Depreciation period, years
Buildings 25 -50
Office furniture 10 -15
Tools and fixtures 3 -10
Hardware 3 -5
Cars 3 -5
C O N S O L I D A T E D F I N A N C I A L S T A T E M E N T S 59

No valuation allowances or reversals were applied in the year under review.
Land charges totalling € 10,750 thousand (previous year: € 10,750 thousand) have
been registered as collateral for long-term borrowings (cf. Section 10 "Borrowings").
6) Intangible assets
In agreement with the recognition criteria of IAS 38.45, development costs totalling
€ 642 thousand (previous year: € 1,129 thousand) were capitalised in the year under
review.
The development costs of € 642 thousand capitalised in the year under review relate
predominantly to the Micro Technologies segment, which continued and completed the
development work commenced in the previous year on large-area electroplating sys-
tems ("microform 100" and "microform 400"). A technology for temperature control
of injection moulding tools ("theta.disc") was also developed.
Intangible
assets
€ '000
Capitalised
development
costs
€ '000
Concessions,
industrial and
similar rights
€ '000
Costat January 1, 2003 4,884 2,616 7,500
Foreign currency translation differences -46 -16 -62
Additions 530 642 1,172
Disposals -2,045 0 -2,045
Costat December 31, 2003 3,323 3,242 6,565
Cumulative amortisationat January 1, 2003 2,780 621 3,401
Foreign currency translation differences -42 -5 -47
Amortisation for the year 919 423 1,342
Impairment loss acc. to IAS 36 850 0 850
Disposals -2,015 0 -2,015
Cumulative amortisation at December 31, 2003 2,492 1,039 3,531
Residual carrying amounts at December 31, 2003 831 2,203 3,034
60

Development costs of € 2,970 thousand (previous year: € 2,321 thousand) have been
recognised as an expense in view of their failure to satisfy the criteria of IAS 38.45.
In the Income Statement, the amortisation has been distributed between the various
functional areas using the function of expense method, according to the principle of
causation.
The useful life taken as the basis for the depreciation of software is three to five
years; the patents and expertise acquired from the Toolex Group in the 2001 finan-
cial year are amortised over 6 years.
A valuation allowance was applied to the residual carrying amounts (€ 850 thousand)
of the patents and expertise for the Electroforming Division acquired from the Toolex
Group in the 2001 financial year, as it was no longer possible to calculate their "real-
isable value" pursuant to IAS 36.5. Discounting of the anticipated cash flow was based
on an interest rate of 15 percent. In the Income Statement, the valuation allowance is
reported as "Impairment loss acc. to IAS 36". It is allocable to the Micro Technologies
segment. The allowance charge of € 850 thousand had not yet been included in the
interim financial statements at September 30, 2003.
7) Goodwill
Goodwill
€ '000
Cost at January 1, 2003 25,876
Foreign currency translation differences -2,922
Disposals 12,326
Cost at December 31, 2003 10,628
Cumulative amortisation at January 1, 2003 6,052
Foreign currency translation differences -647
Amortisation for the year 1,707
Impairment loss acc. to IAS 36 11,372
Disposals 12,326
Cumulative depreciation at December 31, 2003 6,158
Residual carrying amounts at December 31, 2003 4,470
C O N S O L I D A T E D F I N A N C I A L S T A T E M E N T S 61

The subsidiary technotrans america west, inc. was acquired for a provisionally speci-
fied purchase price of USD 4,000 in the 2001 financial year. The final purchase price
depends on the company's profitability over the period 2001 to 2004 and will not ex-
ceed USD 10 million. Current goodwill has been calculated on the basis of the original
purchase price. Its recalculation pursuant to IAS 22.65 is not necessary, as the cur-
rent development in the company's profitability renders it unlikely that the purchase
price will be adjusted.
The disposals related to goodwill which is not expected to yield any future economic
benefit and which was therefore to be derecognised pursuant to IAS 38.103.
Amortisation for the current year is reported in the income statement under
"Amortisation of goodwill" (cf. Section 25).
Falling revenues for the second year in succession prompted technotrans to subject
the assets of the individual cash-generating units to an impairment test pursuant to
IAS 36.
As a result, the goodwill of the Print segment was adjusted in value by € 8,591 thou-
sand. This goodwill constitutes part of the assets that are allocated to the cash-gener-
ating unit "Print segment" created pursuant to IAS 36.64 ff. The value in use of this
segment undercut the carrying amount of the assets directly allocable to the segment
pursuant to IAS 36.74 f. by € 8,591 thousand. Pursuant to IAS 36.88, this impairment
loss was assigned to the goodwill directly allocable to the segment. Discounting of the
anticipated cash flow is based on an interest rate of 15 percent. The valuation
allowance is reported in the income statement under "Impairment loss acc. to IAS
36". The allowance charge of € 8,591 thousand had not yet been included in the
interim financial statements at September 30, 2003.
The goodwill in the Micro Technologies segment results from the acquisition of the
Electroforming Division of Toolex. Its value was adjusted by € 2,781 thousand in
the year under review. This goodwill is allocable to the cash-generating unit "Toolex
Electroforming" which was created pursuant to IAS 36.64 ff. The value in use of this
cash-generating unit undercut the carrying amount of the assets directly allocable to it
pursuant to IAS 36.74 f. by € 2,781 thousand. Pursuant to IAS 36.88, the impairment
loss was assigned primarily to the goodwill directly allocable to the segment. The antici-
pated cash flows were discounted at 15 percent. The valuation allowance is reported
in the income statement under "Impairment loss acc. to IAS 36". The allowance
charge of € 2,781 thousand had not yet been included in the interim financial state-
ments at September 30, 2003.
62

8) Deferred tax assets
Deferrals of income taxes are made according to the "temporary concept" of IAS 12
for temporally limited recognition and measurement differences for the companies
included in the consolidated accounts and for consolidation measures affecting
income.
The value of the deferred taxes capitalised on tax loss carryforwards in previous years
had been adjusted in full at December 31, 2003, as their use is estimated as improb-
able. The associated allowance charge of € 2,314 thousand had not yet been includ-
ed in the interim financial statements at September 30, 2003.
For further notes on deferred tax assets, see Section 28 "Income tax expense".
The following table shows the residual carrying values of technotrans goodwill:
C O N S O L I D A T E D F I N A N C I A L S T A T E M E N T S 63
31.12.2001
€ '000
31.12.2002
€ '000
31.12.2003
€ '000
Print segment
Goodwill from the acquisition of
– BVS Beratung Verkauf Service Grafische Technik GmbH, Stadtbergen (1998), now the Stadtbergen plant of technotrans AG
– Ryco Graphic Manufacturing, Inc., Chicago, USA (2000), now merged with technotrans america, inc.
– Steve Barberi Company, Inc. and Farwest Graphic Technologies LLC, Corona, USA (2001), now combined and renamed technotrans america west, inc. 3,020 15,149 19,415
Micro Technologies segment
Electroforming Division of Toolex (2001) 1,450 4,675 5,116
4,470 19,824 24,531

An interest-free loan in USD to an employee with an original term of three years and
a countervalue of € 259 thousand (previous year: € 300 thousand) was recognised
at fair value pursuant to IAS 39.67. Discounting was based on an interest rate of 5.5
percent. The loan was granted to an employee who was sent on a foreign assignment
for a limited period, and it is collateralised by a land charge.
Liabilities
There were no hedged liabilities at the balance sheet date. Collateral has been pro-
vided only in the case of borrowings (cf. Section 10 "Borrowings").
10) Borrowings
31.12.2001
€ '000
31.12.2002
€ '000
31.12.2003
€ '000
Bank overdrafts 3,026 3,055 2,665
Short-term component of borrowings 3,074 3,111 3,031
Short-term borrowings 6,100 6,166 5,696
Long-term borrowings 12,076 15,390 19,354
Total borrowings 18,176 21,556 25,050
31.12.2001
€ '000
31.12.2002
€ '000
31.12.2003
€ '000
Loans to employees 259 300 323
Trade receivables 301 0 0
Rent deposits 32 45 107
Other 63 60 257
655 405 687
64
9) Other long-term assets
Other long-term assets comprise:

Terms to maturity of bank borrowings
CollateralInterest p.a.Total
€ '000
1-5 years
€ '000
up to 1 year
€ '000
over 5 years
€ '000
CHF fixed rate credit 500 2,001 625 3,126 4.95% Land charge
Variable € credit 2,000 6,000 0 8,000 6-month Land chargeEURIBORcover via
interest rateswap (fixed
rate: 5.73%)
Variable € credit 575 2,300 1,150 4,025 6-month NoneEURIBORcover via
interest rateswap (fixed
rate: 5,43%)
USD bank overdrafts 3,013 0 0 3,013 Variable None
SEK bank overdrafts 11 0 0 11 Variable None
EUR bank overdrafts 1 0 0 1 Variable None
6,100 10,301 1,775 18,176
A substantial portion of borrowings is collateralised by land charges totalling € 10,750
thousand (previous year: € 10,750 thousand) on the company premises in Sassenberg.
One loan with an original countervalue of € 4,000 thousand has been financed in
Swiss francs. This resulted in an exchange-rate gain of € 233 thousand (previous
year: exchange rate loss of € 77 thousand) in the financial year under review. The
interest and repayment dates of the CHF loan are 15.03., 15.06, 15.09. and 15.12 of
each year. The term is 10 years, starting on May 29, 2000. Only bank overdrafts are
exposed to an interest rate risk.
11) Trade payables
All trade payables have a term of up to one year. They relate predominantly to techno-
trans AG, technotrans america, inc. and technotrans america west, inc.
12) Advances received
Advances received originate in the main from project business for technotrans AG,
technotrans america, inc. and technotrans china ltd.
C O N S O L I D A T E D F I N A N C I A L S T A T E M E N T S 65

Provisions for
pensions
€ '000
Total
€ '000
Other provisions
€ '000
Obligations
to personnel
€ '000
Short-term
Provision for
patent
proceedings
€ '000
Opening level at 01.01.2003 1,821 3,322 3,303 8,446 136
Exchange rate movements -64 -216 0 -280 0
Used -1,416 -1,749 -302 -3,467 0
Liquidated -106 -210 0 -316 0
Allocated 1,284 3,362 0 4,646 15
Closing level at 31.12.2003 1,519 4,509 3,001 9,029 151
13) Provisions
The obligations towards personnel include provisions for vacation leave, vacation pay
and time credits, as well as for performance-related pay for management employees.
It is fundamentally uncertain when these obligations will have to be met. The other
provisions are predominantly for payments to be made under warranty, costs for the
preparation of the annual accounts, and commission payments. The factor of uncer-
tainty in this case is principally the amount in question.
A competitor filed patent proceedings in 2000, but these were rejected at the
first instance in March 2001. The oral proceedings in the appeal took place at the
Düsseldorf Higher Regional Court on October 10, 2002. In the latter instance, the
court found in favour of the plaintiff. The ruling of November 14, 2002 paves the way
for a claim for compensation, the level of which may have to be determined in further
legal proceedings. A provision to the value of the matter in dispute of € 2.5 million
was created to cover the potential claim for compensation. Legal expenses are cur-
rently still measured at € 501 thousand. The particulars pursuant to IAS 37.85 are
not disclosed, in accordance with IAS 37.92, in order not to undermine the company's
situation substantially in the ongoing legal dispute.
A direct pension pledge has been made to four employees of the former BVS Beratung
Verkauf Service Grafische Technik GmbH, Stadtbergen. The "defined benefit obliga-
tion" (DBO) for purposes of calculating the provisions for pensions was determined on
the basis of an actuarial report. The calculation was based on an interest rate of 6.00
percent (previous year: 5.75 percent) and a pension trend of 2.0 percent (previous
year: 2.0 percent). The development in pay levels and employee fluctuation were not
taken into account, as those eligible for pensions have since left the company. The
interest costs for the DBO in 2003 amount to € 9 thousand (previous year: € 8
thousand).
Long-term
66

Three of the pension obligations are backed by capital-forming life assurance policies,
which constitute non-qualified insurance policies pursuant to IAS 19.7. Their fair value is
€ 54 thousand and is reported under other long-term assets (Section 9). The anticipated
return on these policies is 4 percent p.a.
14) Income taxes payable
The fall in income taxes payable from € 780 thousand in the 2002 financial year to
€ 290 thousand in the 2003 financial year is primarily attributable to technotrans AG.
The impairment according to IAS 36 on the goodwill from the acquisition of the Toolex
Electroforming Division, which was partly tax-deductible, resulted in an income tax ex-
pense that remained below the advance payments made. technotrans AG was there-
fore entitled to a tax refund at December 31, 2002 in contrast to the previous year.
15) Other short-term debt
See Section 34 "Financial instruments" in respect of short-term liabilities from deriva-
tive financial instruments.
31.12.2001
€ '000
31.12.2002
€ '000
31.12.2003
€ '000
Operating taxes 321 346 346
Liabilities in respect of social insurance 525 525 610
Sales tax 292 529 849
Accounts receivable on the credit side 134 224 328
Deferred income 76 32 22
Short-term liabilities from derivative financial instruments 310 0 0
Other 162 221 407
1,820 1,877 2,562
C O N S O L I D A T E D F I N A N C I A L S T A T E M E N T S 67

16) Deferred tax liabilities
Deferrals of income taxes are made according to the "temporary concept" of IAS 12
for temporally limited recognition and measurement differences for the companies
included in the consolidated accounts and for consolidation measures affecting
income. For further notes on deferred tax assets, see Section 28 "Income tax
expense".
17) Other long-term debt
Other long-term debt principally primarily consists of liabilities from derivative financial
instruments (cf. Section 34 "Financial instruments") totalling € 380 thousand (previ-
ous year: € 953 thousand).
18) Equity
The development in equity is shown in the Statement of Movements in Equity. The
equity of the group totalled € 36,288 thousand at December 31, 2003 (previous year:
€ 51,720 thousand).
Issued capital
A share split at a ratio of 1:3 was approved by the Shareholders' Meeting on May 3,
2002. Since its implementation on May 31, 2002 following the close of trading on the
stock markets, the issued capital (share capital) of technotrans AG has been divided
into 6,600,000 individual share certificates with no par value. Each individual share
certificate represents an arithmetic amount of € 1 (previously: € 3) of the share capi-
tal. All shares carry identical rights. No special rights or preferences are granted to
individual shareholders. The same applies to dividend entitlements.
Approved capital
In April 2001, 420,000 shares (adjusted to reflect the split) were issued from the
approved capital at that time by way of a capital increase for contribution in kind and
for cash. The issued capital consequently rose by € 420 thousand and the premium
of € 16,350 thousand was allocated to the capital reserve. The remaining approved
capital was cancelled by the Shareholders' Meeting dated May 4, 2001. The Share-
holders' Meeting simultaneously authorised the Board of Management to raise the
share capital by the issue of new shares on one or more occasions by April 30, 2006,
against contributions, by up to a total of € 3,300,000, with the approval of the
Supervisory Board.
68

Authorised but unissued capital
The Shareholders' Meeting of May 4, 2001 in addition approved the creation of autho-
rised but unissued capital for the issuing of stock options to members of the Board of
Management, employees of technotrans AG and the management and employees of
subsidiary companies, with a term of 4 years. The resolution envisages an increase in
the share capital of up to € 660,000 through the issue of new shares bearing profit
entitlements from the start of the financial year in which they are issued. The stock
options issued must have been held for at least two years. The exercise period in
each year shall be the sixth banking day and the nineteen subsequent banking days
following an Ordinary Shareholders' Meeting. The options may be exercised for the
last time after a further two years. A stock option may only be exercised if at least one
of the two following performance targets has been reached at the time of exercise:
– The value of technotrans shares has risen in percentage terms by an amount
equivalent to or higher than the NEMAX Allshare Performance Index in the period
between the issuing and exercising of the stock option (external performance
target).
– The consolidated revenue has risen by an average of at least 20 percent per year
between the financial year preceding the year in which the stock options were
issued (the "base year") and the financial year preceding the year in which the
stock options are exercised, and the consolidated net profit in the financial years
following the base year and prior to the year in which the stock options are exer-
cised totals at least 6 percent of the cumulative consolidated revenue (internal
performance target).
As a result of the changes to the Deutsche Börse indices and in accordance with
the stock options agreements, a similar reference index to the NEMAX Allshare
Performance Index will need to be specified at the end of 2004.
C O N S O L I D A T E D F I N A N C I A L S T A T E M E N T S 69
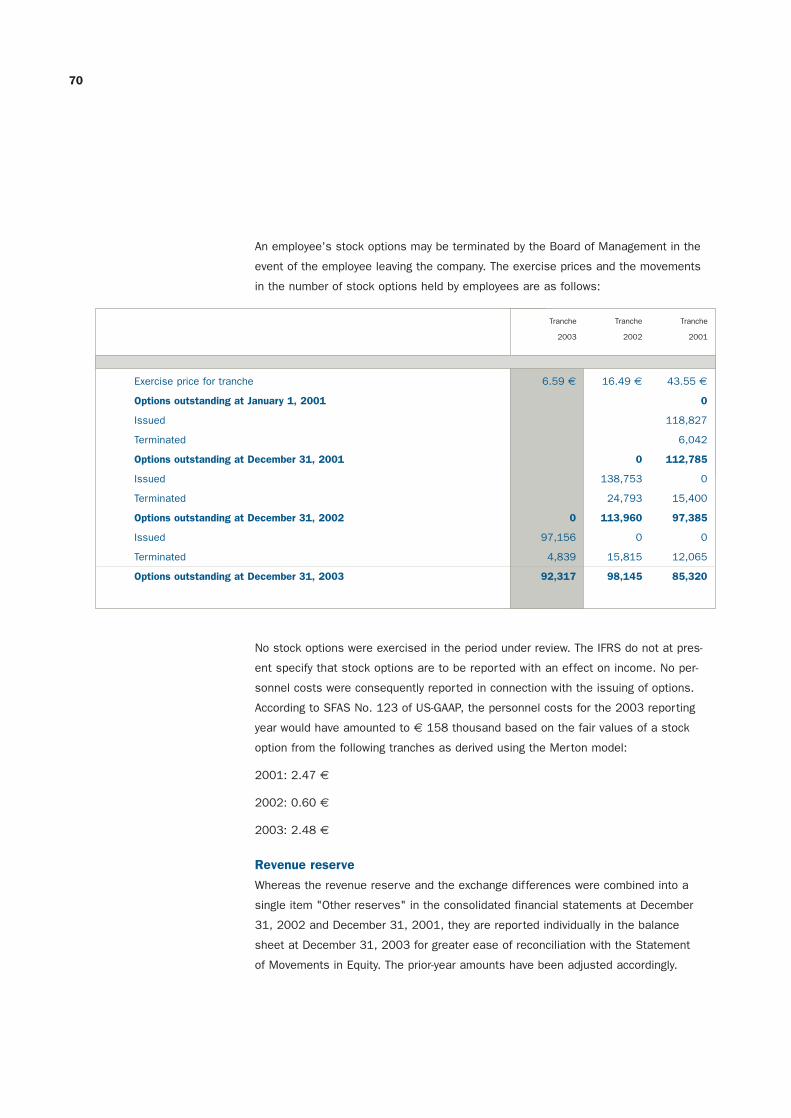
Tranche
2001
Tranche
2002
Tranche
2003
Exercise price for tranche 6.59 € 16.49 € 43.55 €
Options outstanding at January 1, 2001 0
Issued 118,827
Terminated 6,042
Options outstanding at December 31, 2001 0 112,785
Issued 138,753 0
Terminated 24,793 15,400
Options outstanding at December 31, 2002 0 113,960 97,385
Issued 97,156 0 0
Terminated 4,839 15,815 12,065
Options outstanding at December 31, 2003 92,317 98,145 85,320
No stock options were exercised in the period under review. The IFRS do not at pres-
ent specify that stock options are to be reported with an effect on income. No per-
sonnel costs were consequently reported in connection with the issuing of options.
According to SFAS No. 123 of US-GAAP, the personnel costs for the 2003 reporting
year would have amounted to € 158 thousand based on the fair values of a stock
option from the following tranches as derived using the Merton model:
2001: 2.47 €
2002: 0.60 €
2003: 2.48 €
Revenue reserve
Whereas the revenue reserve and the exchange differences were combined into a
single item "Other reserves" in the consolidated financial statements at December
31, 2002 and December 31, 2001, they are reported individually in the balance
sheet at December 31, 2003 for greater ease of reconciliation with the Statement
of Movements in Equity. The prior-year amounts have been adjusted accordingly.
70
An employee's stock options may be terminated by the Board of Management in the
event of the employee leaving the company. The exercise prices and the movements
in the number of stock options held by employees are as follows:

€ '000
Legal reserve following allocation of € 7 thousandto one subsidiary 233
Uncommitted reserves following withdrawal of € 9,689 thousand to cover the net loss for the year of technotrans AG 37
Exchange rate losses (net after income tax benefit) from the financing of technotrans america west, inc. totalling € 380 thousand (from 2003) and € 383 thousand (from 2002) in accordance with IAS 21.17 -763
-493
Hedging reserve
Pursuant to IAS 39, the negative market value of the interest rate swaps implemented
was recognised in the hedging reserve, following deduction of deferred tax assets (cf.
Section 34 "Financial instruments").
Exchange differences
The opening inventory of exchange differences at January 1, 2003 is exclusively the
result of the translation of the issued capital of the group companies at the current
closing rates compared with the historical cost of acquisition. The increase in exchange
differences reflects the effects of exchange rate movements on equity, which result
from the difference between the closing rate at December 31, 2003 and the closing
rate at December 31, 2002, and also from the difference compared with the average
rate for 2003.
Distribution of profit
A dividend of € 0.20 per share was distributed for the 2002 financial year. The
amount distributed totalled € 1,320 thousand (previous year: € 1,540 thousand) for
6,600,000 shares. A dividend of € 0.30 per share from the accumulated profit of
technotrans AG will be proposed to the Shareholders' Meeting for the 2003 financial
year. This corresponds to a distributed amount of € 1,980 thousand for 6,600,000
shares.
The reported revenue reserve comprises:
C O N S O L I D A T E D F I N A N C I A L S T A T E M E N T S 71

IV. Notes to the Consolidated Income Statement
19) Revenue
If a contract from a customer involves both the delivery of goods and the provision
of a service, such as assembly and commissioning, revenue is always realised upon
acceptance by the customer.
In certain circumstances, in a departure from this principle according to IAS 18.13,
individual components of a business transaction may be invoiced separately if this
reflects the economic content of the business transaction more accurately. As the
IAS do not make stipulations on the subdivision of a business transaction into its
component parts, US EITF 00-21 "Accounting for Revenue Arrangements with Multiple
Deliverables" is used for this purpose in conjunction with IAS 1.22. It divides up a
business transaction consisting of several components into goods and services ele-
ments in proportion to their respective fair value, if the latter can be determined
objectively and reliably and if the service could also be procured from third parties
without diminishing the practical utility of the delivered goods or their value for the
customer. If these conditions are met and the significant risks of ownership for the
goods have moreover passed to the buyer (IAS 18.16), the revenue from the goods
is realised according to IAS 18.14 and the revenue from the services according to
IAS 18.20. According to this accounting method, at December 31, 2003 revenue
totalling € 2,203 thousand (previous year: € 1,578 thousand) had been realised
from the supply of materials where their assembly or commissioning was outstand-
ing at the balance sheet date.
Revenue is shown broken down by division and region in the segment information.
72

2001
€ '000
2002
€ '000
2003
€ '000
Cost of materials 47,407 53,524 62,749
Cost of labour 15,702 17,386 17,847
Travel expenses 1,877 2,224 2,310
Subcontractors, personnel leasing 2,060 2,771 3,066
Depreciation 1,468 1,046 1,298
Other 2,294 2,366 2,097
70,808 79,317 89,367
2001
€ '000
2002
€ '000
2003
€ '000
Cost of labour 6,717 7,022 8,382
Logistics costs 2,301 2,144 2,430
Travel expenses 867 1,002 1,228
Promotional and exhibition costs 959 791 1,105
Valuation allowances on receivables 313 404 793
Depreciation 203 241 310
Other 1,028 899 990
12,388 12,503 15,238
21) Distribution costs
The distribution costs include costs for the Sales Department and for office-based
service personnel, and also the costs of advertising and logistics. This item also
includes sales-related expenditure for commissions and valuation allowances on
receivables.
20) Cost of conversion
The cost of conversion comprises the cost of traded products and the cost price of
merchandise sold. In accordance with IAS 2, it includes both costs which can be
directly allocated, such as cost of materials and cost of labour, and also overheads,
including pro rata depreciation and amortisation on property, plant and equipment
used for production and on intangible assets. The costs of the field service are like-
wise reported under cost of conversion.
C O N S O L I D A T E D F I N A N C I A L S T A T E M E N T S 73

22) Administrative costs
The administrative costs comprise personnel and material costs for management and
administration, insofar as not charged to other cost centres as internal services.
The rise in consultancy expenses is attributable to the planned takeover of the
Baldwin Technology Company, Inc. (cf. also Section 40 "Events occurring after the
balance sheet date").
23) Research and development costs
All research costs are charged to the result for the period. Development costs are
charged as ongoing expenses until the criteria of IAS 38.45 are satisfied cumulatively.
From that point on, development costs are capitalised (cf. Section 6 "Intangible
assets").
24) Other operating income and expenses
2001
€ '000
2002
€ '000
2003
€ '000
Cost of labour 5,383 6,053 5,780
Depreciation 1,801 1,652 1,402
Consultancy, audits 2,969 1,256 1,571
Other 2,311 3,122 3,217
12,464 12,083 11,970
2001
€ '000
2002
€ '000
2003
€ '000Other operating income
Insurance payments 41 39 67
Liquidation of provisions 352 188 332
Book profits from the disposal of assets 603 34 35
Income from tenancy agreements 29 18 33
Personnel-related revenue 68 65 135
Income unrelated to the accounting period 10 136 2
Other 451 609 74
1,554 1,089 678
The item "Other" included consolidation differences totalling € 160 thousand (previ-
ous year: € 369 thousand) in the 2003 financial year.
74

2001
€ '000
2002
€ '000
2003
€ '000Other operating expenses
Allocation to provision for Baldwin patent dispute 0 3,303 16
Book losses from the disposal of assets 9 53 6
Other operating taxes 164 389 254
Expenses unrelated to the accounting period 151 86 92
Other 108 198 127
432 4,029 495
2001
€ '000
2002
€ '000
2003
€ '000
Print segment 1,233 1,479 1,596
Micro Technologies segment 474 482 484
1,707 1,961 2,080
Allocations to and reversals of provisions were only reported under other operating
income and expenses where they were not directly allocable to the functional areas
under the cost of sales classification method.
25) Amortisation of goodwill
The amortisation of goodwill is shown in the following table:
C O N S O L I D A T E D F I N A N C I A L S T A T E M E N T S 75

26) Interest revenue/expense
Borrowing costs are recognised as an expense in the reporting period in which they
are incurred. No borrowing costs were capitalised in the reporting period.
27) Foreign currency gains/losses
Income tax expense includes corporation income tax and trade earnings tax for
technotrans AG, and also comparable taxes on income for the foreign companies.
Taxes unrelated to the 2003 accounting period result from the tax office investigation
at technotrans AG in 2002. Other operating taxes are included in other operating
expenses.
2001
€ '000
2002
€ '000
2003
€ '000
Interest revenue 140 138 153
Interest expense -1,167 -1,525 -1,801
-1,027 -1,387 -1,648
2001
€ '000
2002
€ '000
2003
€ '000
Foreign currency gains 844 311 604
Foreign currency losses -989 -572 -1,088
-145 -261 -484
28) Income tax expense
2001
€ '000
2002
€ '000
2003
€ '000
Tax expense for the period -1,547 -3,205 -3,418
Tax expenses/refunds unrelated to the accounting period -205 139 11
-1,752 -3,066 -3,407
Actual income tax expense
76

2001
€ '000
2002
€ '000
2003
€ '000
Deferred tax expense -3,853 -1,482 -1,194
Deferred tax income 439 2,929 2,145
Changes to deferred tax resulting from tax rate changes 78 0 0
-3,336 1,447 951
Deferred tax expense
The deferred tax is attributable to temporally divergent valuations in the companies' tax
balance sheets and the Consolidated Balance Sheet in accordance with the "liability
method".
The deferred tax assets reported in previous years also included tax relief claims based
on the anticipated use of existing tax loss carryforwards in subsequent years. As the
likelihood of these tax loss carryforwards being used in the future fell in the year under
review, the previously recognised deferred tax assets for tax loss carryforwards were
fully value-adjusted in the year under review. The resulting expense of € 2,314 thou-
sand is included in the reported tax expense of € 3,853 thousand.
The deferred tax is calculated on the basis of the tax rates applicable or expected at
the time of realisation in the individual countries concerned. The calculation of deferred
tax on eliminated intercompany profits is an exception; this has been calculated at a
composite tax rate for the entire group of 34.6 percent (previous year: 38 percent),
determined on the basis of the various different national tax rates. Deferred tax assets
and liabilities were not offset against each other.
C O N S O L I D A T E D F I N A N C I A L S T A T E M E N T S 77

Liabilities
€ '000
Assets
€ '000
Liabilities
€ '000
Assets
€ '000
Liabilities
€ '000
Assets
€ '000
2003 2002 2001
Receivables 14 111 110 354 340 368
Inventories 522 130 1,263 92 831 83
Fixed assets 55 875 49 847 107 775
Provisions 215 12 338 11 60 547
Liabilities 41 0 0 0 0 0
Loss carryforwards 0 0 2,252 0 1,516 0
Exchange rate losses 0 476 0 234 0 0
Cash flow hedging 265 0 362 0 237 0
1,112 1,604 4,374 1,538 3,091 1,773
The following table shows a reconciliation of the deferred tax assets and liabilities in
the Balance Sheet and the deferred taxes in the Income Statement:
The following capitalised deferred tax assets and liabilities relate to recognition and
measurement differences for the individual items on the Balance Sheet and to loss
carryforwards which can be used in future:
2001
€ '000
2002
€ '000
2003
€ '000
Change in deferred tax assets from loss carryforwards -2,252 736 1,233
Change in other deferred tax assets -1,010 547 369
Change in deferred tax liabilities -66 236 -365
Change in deferred tax netted within equity 97 -125 -359
Change in reporting entity 0 0 73
Exchange rate movements -105 53 0
Deferred tax acc. to Income Statement -3,336 1,447 951
78

There exist tax loss carryforwards at technotrans america west, inc. (USD 2,547 thou-
sand), technotrans america, inc. (USD 2,295 thousand), technotrans scandinavia AB
(SEK 40,207 thousand) and globalprint AG (€ 327 thousand). Based on the individual
national rates of tax (40 percent or 38 percent USA, 28 percent Sweden, 38.7 per-
cent Germany), the deferred tax assets amount to € 3,376 thousand. These deferred
tax assets have not been recognised, as is consistent with IAS 12.34. The loss carry-
forwards may be carried forward for 20 years in the USA and for an unlimited period in
other cases.
The following table shows a reconciliation of the theoretical tax expense and the actu-
al income tax expense. The applicable tax rate of 39.76 percent (previous year: 37.95
percent) calculated for the year under review is based on a corporation tax rate of
26.5 percent (previous year: 25.0 percent), a solidarity surcharge of 5.5 percent and
an effective trade earnings tax rate of 16.38 percent (previous year: 15.72 percent).
The change compared with the applicable tax rate in 2002 results from a change in
the assessment rate for trade earnings tax and a temporary increase in the corpora-
tion tax rate for 2003 of 1.5 percentage points in the context of the Flood Relief Act.
2001
€ '000
2002
€ '000
2003
€ '000
Applicable tax rate 39.76% 37.95% 38.13%
Consolidated earnings before taxes on income -5,872 4,239 5,877
Theoretical tax income/expense 2,335 -1,609 -2,241
Valuation allowance on deferred tax assets on tax loss carryforwards (at average rates) -2,314 0 0
Expense from the nonrecognition of deferred tax assets on tax losses occurring in 2003 -876 0 0
Tax effect of non-deductibility of amortisation of goodwill -67 -78 -212
Tax effect of non-deductibility of impairment pursuant to IAS 36 -3,809 0 0
Tax effect of non-deductibility of business expenses and tax-exempt income -27 -130 -91
Differences from foreign and deferred tax -125 59 -180
Taxes not related to the period -205 139 11
Reduction in corporation tax on distributed amounts 0 0 257
Actual income tax expense -5,088 -1,619 -2,456
Actual income tax rate in % -86.6% 38.2% 41.8%
C O N S O L I D A T E D F I N A N C I A L S T A T E M E N T S 79

The entitlement to a reduction in corporation tax included in the tax-paid reserves of
technotrans AG and to be claimed in the year of distribution amounts to € 685 thou-
sand (previous year: € 685 thousand) in total at December 31, 2003 according to
current corporation tax legislation. According to the specifications of the German Tax
Amendments Act passed by the German parliament on November 21, 2003, the enti-
tlement to a reduction in corporation tax cannot be claimed for dividends which are
paid after April 12, 2003 and before December 31, 2005.
29) Earnings per share
Earnings per share are calculated in accordance with IAS 33. The number of shares at
the balance sheet date of December 31, 2003 corresponds to the average weighted
number of ordinary shares, as no further shares were issued in the 2002 and 2003
financial years. In accordance with IAS 33.43, the average number of shares in previ-
ous years has been adjusted due to the share split.
The basic earnings per share figure is therefore calculated by dividing the annual
result by the average number of ordinary shares outstanding for the year:
The subscription rights issued on the basis of the existing stock options plan (cf.
Section 18 "Equity") have only a partially dilutive effect pursuant to IAS 33.35. As the
exercise price for the options issued in 2001 and 2002 of € 43.55 and € 16.49 is
above the average share price for the year under review of € 7.47, hypothetically no
ordinary shares have been issued for no consideration. On the other hand, the exercise
price of € 6,59 for the options issued in 2003 is below the average share price for the
year under review; on this basis there are 10,875 potentially dilutive ordinary shares as
a result of the following calculation:
Potentially dilutive ordinary shares (units)
stock options issued (units)
= xExercise price
ave. share price
200120022003
Annual result (€ thousand) -10,960 2,620 3,421
Ordinary shares outstanding, average for year 6,600,000 6,600,000 6,507,750
Basic earnings per share (€) -1.66 0.40 0.53
80
( 1 – )10,875 92,317= x
6.59 €
7.47 €( 1 – )

200120022003
Annual result (€ thousand) -10,960 2,620 3,421
Average number of outstanding and potentially dilutive ordinary shares in the year 6,607,250 6,600,000 6,507,750
Diluted earnings per share (€) -1.66 0.40 0.53
As the options from the 2003 tranche were issued in May 2003, 8/12 of the poten-
tially dilutive ordinary shares (= 7,250) were included in the calculation pro rata tem-
poris.
On this basis, the diluted earnings are the annual result divided by the average num-
ber of ordinary shares outstanding in the year plus the average number of potentially
dilutive ordinary shares in the year:
V. Notes to the Segment Report
Segment information is presented according to both division and geographical region.
Segmentation according to the Print, Micro Technologies and Services Divisions is the
primary reporting format and is performed in agreement with the internal reporting
structure of the technotrans Group.
The Segment Report itself is presented in the tables after the Income Statement.
The delivery prices for transactions between the segments are generally agreed on
the same basis as transactions between a group company and a third party.
The Segment Report provides an analysis of operational figures, assets and debts
and of other key values. The segment information comprises both directly allocable
amounts and amounts that can reasonably be split. The assets and liabilities are dis-
tributed among those segments, the corresponding expenses and income for which
likewise influence the segment result. The assets of € 10,723 thousand not allocated
to the individual areas therefore refer to cash, income tax rebate claims and deferred
tax assets. The unallocated liabilities totalling € 20,760 thousand refer to amounts
owed to credit institutions, liabilities from derivative financial instruments, income
taxes payable and deferred tax liabilities.
The impairment loss acc. to IAS 36 is not included in the result for the segments.
C O N S O L I D A T E D F I N A N C I A L S T A T E M E N T S 81

In the Segment Report by regions, the external revenue per segment is based on the
location of the customer, and the distribution of operating assets and investment is
based on the location of the asset.
No reconciliation between the segment and consolidated data is required, as the fig-
ures in the segment information coincide with those in the Income Statement, Balance
Sheet and Cash Flow Statement. The result for the segments corresponds to the oper-
ating profit in the Income Statement.
VI. Notes to the Cash Flow Statement
The Cash Flow Statement is structured according to streams of payments from operat-
ing activities, investing activities and financing activities. The effects of changes in the
reporting entity are eliminated here; the influence of such changes on funds is indicat-
ed separately.
30) Cash flow from operating activities
The cash flow from operating activities amounted to € 6,491 thousand (previous year:
€ 10,077 thousand) in the past financial year. The significantly higher cash flow from
operating activities of € 9,457 (previous year: € 5,679) before working capital
changes contrasts with offsetting effects for current assets: the inventories and the
level of trade receivables were up at year-end after adjustment for exchange rate
movements. This reflects the expansion of business at the end of the financial year.
The reduction in liabilities diminished cash flow by € 1,296 thousand (previous year:
€ 3,307 thousand). This affects in particular the decrease in advances received, the
reduced liabilities from income taxes payable and the decrease in liabilities from deriv-
ative financial instruments (cf. Sections 15 "Other short-term debt", 17 "Other long-
term debt" and 34 "Financial instruments").
82

The cash flow from operating activities includes payments for income tax totalling
€ 1,631 thousand (previous year: € 3,155 thousand), together with interest payments
of € 1,117 thousand (previous year: € 1,407 thousand) and interest receipts of € 122
thousand (previous year: € 110 thousand).
31) Cash flow from investing activities
The cash flow from investing activities results from the acquisition of intangible assets
(€ 1,172 thousand, including capitalised development costs of € 642 thousand) and
property, plant and equipment (€ 1,932 thousand). The income from the sale of proper-
ty, plant and equipment relates almost entirely to the sale of the building of techno-
trans graphics Ltd. in Colchester, Great Britain.
32) Cash flow from financing activities
Scheduled repayments totalling € 3,087 thousand on long-term loans were made
during the year. The cash receipts from the raising of loans relate exclusively to the
increase in short-term loans denominated in US dollars in the context of overdraft
facilities within consolidated companies.
33) Cash at end of period
Cash comprises cash on hand and demand deposits with a term of less than three
months.
VII. Other particulars
34) Financial instruments
Primary financial instruments comprise cash and receivables on the assets side. On
the equity and liabilities side, they correspond largely to liabilities. The portfolio of pri-
mary financial instruments is shown in the Balance Sheet; the total financial assets
therefore indicate the maximum credit risk. Insofar as specific credit risks to the finan-
cial assets are discernible, these risks are accounted for by valuation allowances.
Exchange rate fluctuations may affect the value of a primary financial instrument. This
risk is limited within technotrans AG by the fact that the currency of production usually
corresponds to the currency in which the customer is invoiced. Where discrepancies
occur, this exchange risk is usually hedged against by means of derivative financial
instruments. At the balance sheet date, derivatives for hedging foreign currency risks
were only being used to a minimal extent (nominal volume JPY 17.4 million, approx.
€ 129 thousand).
C O N S O L I D A T E D F I N A N C I A L S T A T E M E N T S 83
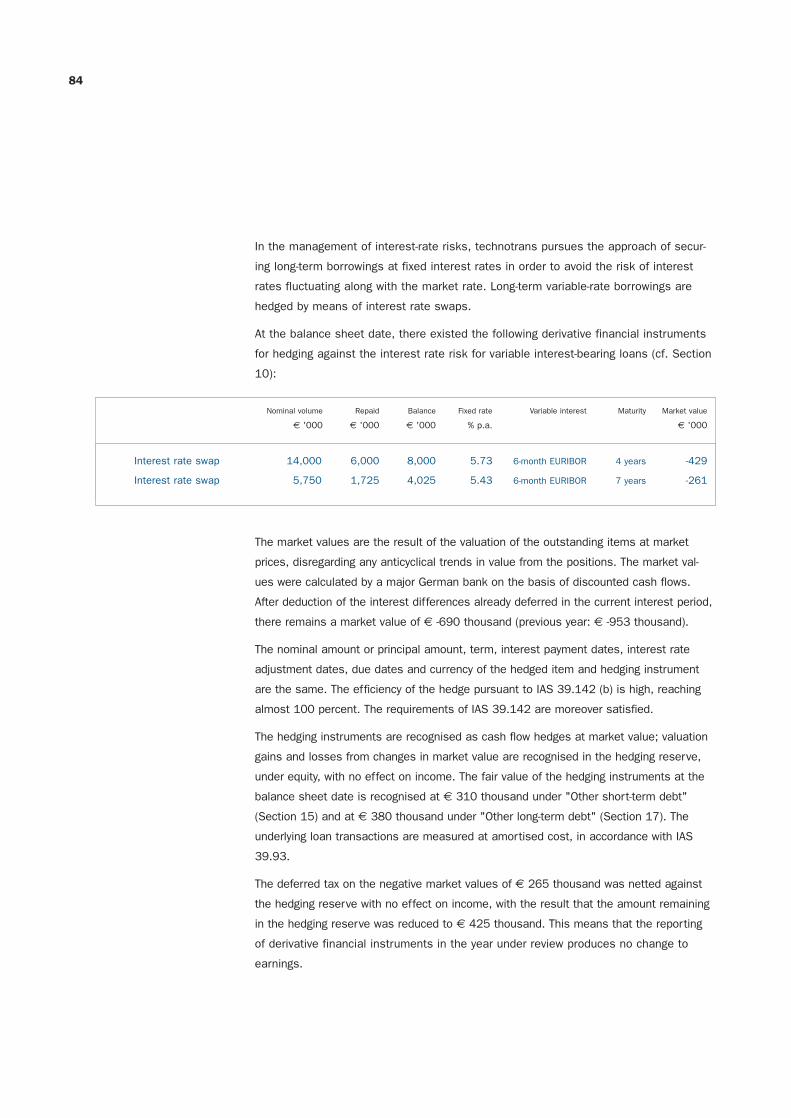
In the management of interest-rate risks, technotrans pursues the approach of secur-
ing long-term borrowings at fixed interest rates in order to avoid the risk of interest
rates fluctuating along with the market rate. Long-term variable-rate borrowings are
hedged by means of interest rate swaps.
At the balance sheet date, there existed the following derivative financial instruments
for hedging against the interest rate risk for variable interest-bearing loans (cf. Section
10):
The market values are the result of the valuation of the outstanding items at market
prices, disregarding any anticyclical trends in value from the positions. The market val-
ues were calculated by a major German bank on the basis of discounted cash flows.
After deduction of the interest differences already deferred in the current interest period,
there remains a market value of € -690 thousand (previous year: € -953 thousand).
The nominal amount or principal amount, term, interest payment dates, interest rate
adjustment dates, due dates and currency of the hedged item and hedging instrument
are the same. The efficiency of the hedge pursuant to IAS 39.142 (b) is high, reaching
almost 100 percent. The requirements of IAS 39.142 are moreover satisfied.
The hedging instruments are recognised as cash flow hedges at market value; valuation
gains and losses from changes in market value are recognised in the hedging reserve,
under equity, with no effect on income. The fair value of the hedging instruments at the
balance sheet date is recognised at € 310 thousand under "Other short-term debt"
(Section 15) and at € 380 thousand under "Other long-term debt" (Section 17). The
underlying loan transactions are measured at amortised cost, in accordance with IAS
39.93.
The deferred tax on the negative market values of € 265 thousand was netted against
the hedging reserve with no effect on income, with the result that the amount remaining
in the hedging reserve was reduced to € 425 thousand. This means that the reporting
of derivative financial instruments in the year under review produces no change to
earnings.
Interest rate swap 14,000 6,000 8,000 5.73 6-month EURIBOR 4 years -429
Interest rate swap 5,750 1,725 4,025 5.43 6-month EURIBOR 7 years -261
€ '000 € '000 € '000 % p.a. € '000
Nominal volume Repaid Balance Fixed rate Variable interest Maturity Market value
84

Interest rate swaps 2,575 8,300 1,150 12,025
€ '000 € '000 € '000 € '000
Maturity Maturity Maturity
up to 1 year 1 to 5 years over 5 years Total amount
The interest rate swaps are concluded only with banks with the highest credit rating.
There exist binding rules on the use of such derivative financial instruments, in the
form of scopes of action, spheres of responsibility and internal guidelines. There is a
theoretical credit risk only in the event of the market value being positive. As interest
rate swaps are concluded exclusively with banks with a top-class credit rating, no actu-
al credit risk exists for these financial instruments.
Interest expense of € 410 thousand (previous year: € 343 thousand) from current
swap transactions was booked to results in the past financial year.
35) Contingencies and other financial commitments
The times to maturity at the balance sheet date are as follows:
31.12.200131.12.200231.12.2003
up to 1 year
€ '000Type
1-5 years
€ '000
Total
€ '000
Total
€ '000
Total
€ '000
Purchase price agreement technotrans america west, inc. 0 4,758 4,758 5,727 6,803
Other purchase obligations 0 0 0 259 444
Tenancy and operating lease agreements 362 332 694 52 453
Maintenance agreements 253 0 253 409 42
Other 0 0 0 0 45
615 5,090 5,705 6,447 7,787
C O N S O L I D A T E D F I N A N C I A L S T A T E M E N T S 85
The other financial commitments are measured at their nominal amount; amounts in
foreign currency were measured at the closing rate.
The purchase price agreement concluded as part of the acquisition of technotrans
america west, inc. envisages that the final purchase price shall be determined over
the period from 2001 to 2004 on the basis of the company's profitability, but shall
not exceed USD 10,000 thousand. After deduction of USD 4,000 thousand already

paid towards the purchase price, the maximum financial obligation of technotrans
at December 31, 2003 is therefore USD 6,000 thousand (€ 4,758 thousand). No
subsequent reimbursement of the amount already paid has been agreed; this con-
sequently represents the lower price limit.
The maintenance agreements relate in the main to the ERP system and the document
management system.
The future obligations from tenancy and lease agreements relate primarily to tenancy
obligations for the business premises of subsidiaries. Payments made on the basis
of tenancy and lease agreements amount to € 800 thousand (previous year: € 674
thousand). technotrans has not concluded any lease agreements that constitute
finance leases pursuant to IAS 17.
36) Personnel costs
14,368 ordinary shares in technotrans AG were distributed to employees during the
reporting period, by way of a Christmas bonus; these shares had previously been
acquired on the market. At the time of their issue, the fair value of these shares was
€ 168 thousand.
37) Total employees, yearly average
2001€ '000
2002€ '000
2003€ '000
Wages and salaries 24,345 27,027 28,976
Social insurance 3,882 3,996 4,142
Expenses for retirement benefits and maintenance payments 1,048 897 516
Personnel costs, total 29,275 31,920 33,634
200120022003
Average number of employees 593 639 687
86

38) Related parties
"Related parties" include the members of the Board of Management and Supervisory
Board of technotrans AG, as well as their close family members.
In accordance with the articles of incorporation of technotrans AG, the Supervisory
Board members receive remuneration comprising a fixed and a variable component,
in addition to reimbursement of their expenses. The level of the variable remuneration
depends on the dividend distributed. Both the fixed and the variable remuneration
component are higher for the Chairman and Vice Chairman of the Supervisory Board
than for the remaining members. The total remuneration of the Supervisory Board,
including reimbursed expenses, came to € 79 thousand (previous year: € 75 thou-
sand). The members of the Supervisory Board do not receive any stock options for
their activities as non-executive directors. Where members of the Supervisory Board
of technotrans AG have received stock options, these result from their position as
employees of technotrans AG and are independent of their duties as non-executive
directors.
In addition to the total remuneration stated for the Supervisory Board, two members
of the Supervisory Board received remuneration in their capacity as employees, on
the basis of contracts of employment.
The members of the Board of Management receive cash remuneration, stock options
under the technotrans AG stock options plan and certain non-cash benefits for their
activities. The overall structure and the level of the cash remuneration are laid down
by the Supervisory Board's Personnel Committee. The cash remuneration comprises
a fixed basic salary and a variable remuneration component. The level of the variable
remuneration is dependent on the attainment of the overall company target of "consol-
idated net profit according to IFRS". For the year under review, the total remuneration
of the Board of Management (sum of cash remuneration, non-cash benefits and insur-
ance premiums) amounted to € 613 thousand (previous year € 1,117 thousand). This
sum consists of fixed remuneration totalling € 613 thousand (previous year: € 676
thousand) and variable remuneration of € 0 thousand (previous year: € 441 thou-
sand). Differences between the remuneration totals for 2003 and 2002 result from
the omission of the variable remuneration and the resignation of one member of the
Board of Management with effect from November 30, 2002.
The members of the Board of Management and Supervisory Board are listed separate-
ly in the section "Corporate Bodies".
C O N S O L I D A T E D F I N A N C I A L S T A T E M E N T S 87

Directors' holdings (Board of Management and Supervisory Board members):
31.12.200231.12.200331.12.2002 31.12.2001 31.12.200131.12.2003Shares Options
Board of Management
Heinz Harling 61,704 61,704 61,704 3,150 2,100 1,050
Wolfgang Breme 300 300 – 2,100 1,050 –
John A. Stacey 30,300 30,300 30,300 3,150 2,100 1,050
Ralph Teunissen 15,000 15,000 15,000 2,700 1,650 600
Supervisory Board
Joachim Simmroß 10,000 5,000 1,200 0 0 0
Joachim Voss 0 0 0 0 0 0
Konrad Ellegast 0 0 0 0 0 0
Dr. Bertold Gaede 1,791 1,791 1,791 0 0 0
Andreas Harig 61,704 61,704 61,704 1,800 1,200 600
Hubert Oberscheidt 61,704 61,704 61,704 1,800 1,200 600
Close family members held a total of 8,000 shares at December 31, 2003 (previous
year: 9,360).
39) Corporate governance
The Declaration of Compliance by the Board of Management and Supervisory Board is
published on the company's website (www.technotrans.de).
40) Events occurring after the balance sheet date
The date for release of the annual financial statements by the Board of Management
pursuant to IAS 10.16 is February 24, 2004.
As mentioned in the Management Report, there were plans to take over the American
Company Baldwin Technology Company, Inc. Both companies had signed a declaration
to this effect on December 12, 2003, the letter of intent in question was not binding.
Baldwin Technology Company, Inc., however, terminated negotiations in January 2004.
This occurrence has no financial impact on these annual financial statements.
88

C O N S O L I D A T E D F I N A N C I A L S T A T E M E N T S 89

Independent Auditors' Report
We have audited the consolidated financial statements, comprising the balance sheet,
the income statement and the statements of changes in shareholders' equity and
cash flows as well as the notes to the financial statements prepared by technotrans
AG for the business year from 1 January to 31 December 2003. The preparation and
the content of the consolidated financial statements in accordance with International
Financial Reporting Standards (IFRS) are the responsibility of the Company's manage-
ment. Our responsibility is to express an opinion on these consolidated financial
statements based on our audit.
We conducted our audit of the consolidated financial statements in accordance with
German auditing regulations and German generally accepted standards for the audit
of financial statements promulgated by the Institut der Wirtschaftsprüfer (IDW) and in
supplementary compliance with International Standards on Auditing (ISA). Those stan-
dards require that we plan and perform the audit such that it can be assessed with
reasonable assurance whether the consolidated financial statements are free of mate-
rial misstatements. Knowledge of the business activities and the economic and legal
environment of the Group and evaluations of possible misstatements are taken into
account in the determination of audit procedures. The evidence supporting the amounts
and disclosures in the consolidated financial statements are examined on a test basis
within the framework of the audit. The audit includes assessing the accounting princi-
ples used and significant estimates made by management, as well as evaluating the
overall presentation of the consolidated financial statements. We believe that our
audit provides a reasonable basis for our opinion.
90

In our opinion, the consolidated financial statements give a true and fair view of the
net assets, financial position, results of operations and cash flows of the Group for
the business year in accordance with International Financial Reporting Standards.
Our audit, which also extends to the group management report prepared by the
Company's management for the business year from 1 January to 31 December 2003
has not led to any reservations. In our opinion on the whole the group management
report provides a suitable understanding of the Group's position and suitably presents
the risks of future development. In addition, we confirm that the consolidated financial
statements and the group management report for the business year from 1 January to
31 December 2003 satisfy the conditions required for the Company's exemption from
its duty to prepare consolidated financial statements and the group management
report in accordance with German law.
Bielefeld, 5 March 2004
KPMG Deutsche Treuhand-Gesellschaft
Aktiengesellschaft
Wirtschaftsprüfungsgesellschaft
Rehnen Rottmann
German Public Auditor German Public Auditor
I N D E P E N D E N T A U D I T O R S ' R E P O R T 91

Proposal for the Distributionof Accumulated Profit
The Board of Management proposes that the accumulated profit of € 2,641,617.86
as stated in the financial statements of technotrans AG be distributed as follows:
A dividend payment of € 0.30 for each individual
share on share capital of € 6,600,000.00 bearing
dividend entitlements € 1,980,000.00
Transfer to new account € 661,617.86
Accumulated profit € 2,641,617.86
The dividend is payable on June 1, 2004.
Sassenberg, February 24, 2004
Heinz Harling Wolfgang Breme John A.Stacey Ralph Teunissen
92

P R O P O S A L F O R T H E D I S T R I B U T I O NO F A C C U M U L A T E D P R O F I T
93

Corporate Bodies
Board of Management
Dipl.-Ing. Heinz Harling
Chairman of the Board
Joined the company in 1980 as Sales Manager, becoming Managing Director of
technotrans gmbh in 1988; Chairman of the Board since December 1997, with
responsibility for the functional areas Development, Design and Quality Management,
as well as for the product areas. Mr. Harling holds a mandate in "Gerhard und Renate
Metz Stiftung", Nuremberg.
Dipl.-Kfm. Wolfgang Breme
Member of the Board
Joined the company in May 2002, with responsibility for the functional areas
Accounts/Controlling, IT Management, Personnel, Materials Management and
Production
John Andrew Stacey
Member of the Board
Managing Director of technotrans graphics ltd., Colchester, Great Britain,since 1990;
in addition Member of the Board since January 2000 with responsibility for the inter-
national sales and service companies
Ralph Teunissen
Member of the Board
Joined the company as Sales Director in 2000, Member of the Board since October
2001, responsible for Sales and Service throughout the group, and also for Investor
Relations
94

Supervisory Board
Dipl.-Kfm. Joachim Simmroß
Chairman of the Supervisory Board
Chairman of the Supervisory Board of Willy Vogel AG
Member of the Supervisory Board of AIXTRON AG
Member of the Supervisory Board of WeHaCo Unternehmensbeteiligungs-Aktiengesellschaft
Member of the Supervisory Board of Commerz Unternehmensbeteiligungs-Aktiengesellschaft
Member of the Supervisory Board of GBK Beteiligungen AG
Member of the Advisory Board of HANNOVER Finanz GmbH
Member of the Advisory Board of BAG-BiologischeAnalysensysteme GmbH
Member of the Advisory Board of KAPPA opto-electronics GmbH
Member of the Advisory Board of MTS Mikrowellen Technologie und Sensoren GmbH
Dipl.-Kfm. Joachim Voss
Deputy Chairman of the Supervisory Board
Divisional Head Equity Investments of WestLB AG
Chairman of the Supervisory Board of Comma Soft AG
Member of the Supervisory Board of West STEAG Partners GmbH
Member of the Supervisory Board of WestUBG – Westdeutsche Unternehmens-Beteiligungs AG
Dipl.-Kfm. Konrad Ellegast
Chairman of the Board of Phoenix AG, Hamburg (until Dec. 2003)
Member of the Supervisory Boards of Hamburger Feuerkasse Vers.-AG and
of Northern Institute of Technology Hamburg-Harburg GmbH
Member of the Advisory Boards of Richard Bergner Holding GmbH & Co. KG,
of Brose Fahrzeugteile GmbH & Co. KG and of C. Mackprang JR. GmbH & Co. KG
Advisory Board Hamburg of Dresdner Bank AG
Regional Board of Deutsche Bank AG
Member of the Stock Exchange Council of the Trade Chamber, Hamburg
Dr. jur. Bertold Gaede
Partner in Nörr Stiefenhofer Lutz, Munich,
Chairman of the Supervisory Board of HANNOVER Finanz Immobilien AG
Deputy Chairman of the Supervisory Board of Maschinenfabrik Esterer AG
Member of the Supervisory Board of Kaufland Stiftung & Co. KG
Member of the Supervisory Board of Lidl Stiftung & Co. KG
Dipl.-Ing. Andreas Harig
Head of the Product Division of technotrans AG
Hubert Oberscheidt
Service Manager of technotrans AG
C O R P O R A T E B O D I E S 95

Report of the Supervisory Board
The Supervisory Board once again regularly advised the Board of Management on
the running of the company and monitored its activities in the 2003 financial year, in
accordance with legal requirements and the articles of incorporation. It was involved
in key decisions of particular significance for the company.
At its four meetings on March 10, May 8, September 23 and December 16, 2003 the
Supervisory Board was presented with detailed written and oral reports by the Board
of Management on strategies and their implementation status, business progress, the
situation of the company and significant business occurrences. The economic develop-
ment of the company and of its subsidiaries was discussed in depth. Three members
of the Supervisory Board each missed one meeting, for which apologies had been
received. The entire Board of Management was in each case present.
The Chairman of the Supervisory Board moreover maintained regular contact with the
Board of Management and in particular the Chairman of the latter, to discuss the com-
pany's strategy, business developments and risk management. He was moreover
informed promptly by the Chairman of the Board of Management of important occur-
rences that are of key significance in evaluating the situation, progress and manage-
ment of the company.
The Supervisory Board approved those transactions which require its approval in
accordance with legal requirements and the articles of incorporation. These include
decisions and measures which are of fundamental significance to the financial posi-
tion and performance of the company.
Important topics in 2003 were:
– The financial statements for 2002 and the special effect of the patent
dispute on them
– The plans to acquire the competitor Baldwin
– Preparations for the financial statements for 2003 together
with questions of valuation
– The budgets and the degree to which targets had been attained in view of
cyclical factors and corresponding measures to safeguard profitability
– The closing of the production plant at Colchester, UK
– Corporate governance on the basis of the revised Commission's proposal
96

The members of the Supervisory Board possess the necessary knowledge, skills and
personal experience for performing their tasks in an orderly manner, are sufficiently
independent and have sufficient time to act as non-executive directors. No conflicts of
interest arose during the period under review.
Two committees were formed: the Audit Committee and the Committee for Board of
Management Affairs. The Audit Committee met three times and dealt with the presen-
tation of the accounts and risk management, and also with assuring the independence
of the auditors, commissioning the auditors with the audit, identifying the priority
areas for the audit – in particular the valuations of goodwill – and agreeing the fee.
The Committee for Board of Management Affairs met twice and dealt in particular with
drawing up the contracts and agreeing the remuneration of the members of the Board
of Management.
The annual financial statements of technotrans AG and the consolidated financial
statements at December 31, 2003, together with the combined management report
for the company and the group, were presented to the Supervisory Board for examina-
tion before the meeting on March 2, 2004, together with the Board of Management's
proposal on the distribution of the accumulated profit for the 2003 financial year.
The Supervisory Board meeting on March 2, 2004 was also attended by the auditors
elected by the Shareholders' Meeting and appointed by the Supervisory Board, KPMG
Deutsche Treuhand Gesellschaft Aktiengesellschaft Wirtschaftsprüfungsgesellschaft,
Bielefeld branch, represented by the two designated independent auditors.
The financial statements of the company and group for the 2003 financial year have
been granted an unqualified audit certificate on March 5, 2004.
R E P O R T O F T H E S U P E R V I S O R Y B O A R D 97
v.l.n.r. Joachim Voss, Andreas Harig, Konrad Ellegast, Joachim Simmroß, Dr. Bertold Gaede, Hubert Oberscheidt

The Supervisory Board has
– following its own examination, raised no objections to the annual financial
statements of technotrans AG, the consolidated financial statements and the
management reports for the 2003 financial year, and has endorsed the findings
of the auditors
– ratified the financial statements and management reports; the financial statement
of technotrans AG is hereby established
– approved the proposal by the Board of Management on the distribution of
accumulated profit.
The Supervisory Board takes this opportunity to thank the Board of Management and
all employees of the group for the dedication which ultimately enabled the company to
make positive progress in the 2003 financial year, despite the difficult economic con-
text. Our thanks are also due to the employees' representatives for their constructive
and open-handed cooperation with the company's executive bodies.
On behalf of the Supervisory Board
Joachim Simmroß
Chairman of the Supervisory Board
98

1970 ■ ■ Founding of the company
1973 ■ ■ Initial contacts with the audio media and printing industry
1977 ■ ■ Production of the first dampening solution equipment
1981 ■ ■ Development of a separate product line
for dampening solution preparation systems
1987 ■ ■ Launch of the first ink temperature control systems
1990 ■ ■ Management-Buy-Out
technotrans graphics ltd. is founded in Colchester, Great Britain
Launch of the new system components concept
for ancillary equipment on printing presses
technotrans is one of the world's three largest suppliers
of dampening solution preparation systems
1992 ■ ■ technotrans becomes original equipment supplier for
the Heidelberg Speedmaster and MAN-Roland 700 presses
1993 ■ ■ technotrans france is founded
1995 ■ ■ technotrans america, inc. is established in Atlanta, Georgia
1997 ■ ■ Transformation into a stock corporation
Founding of technotrans china
1998 ■ ■ Takeover of BVS Grafische Technik GmbH,
which is renamed technotrans systems
Initial public offering on the Frankfurt Neuer Markt
H I S T O R Y 99
The success story

100
1999 ■ ■ Opening of technotrans technologies in Singapore
Founding of the subsidiary technotrans italia in Milan
Merger with the subsidiary technotrans systems
to form technotrans AG
2000 ■ ■ Takeover of the American company Ryco Graphic Manufacturing, Inc.
(Chicago) and merger with technotrans america, inc.
2001 ■ ■ Takeover of the American Steve Barberi Company Inc. and
its subsidiary, Farwest Graphic Technologies LLC, of Corona,
near Los Angeles,
California, USA; renamed technotrans america west, inc.
Takeover of the Electroforming Division of Toolex International N.V.,
which now operates as technotrans scandinavia AB, Täby, Sweden
Establishment of technotrans japan k.k., Kobe, Japan,
as a sales and service company
Establishment of technotrans Hong Kong
as a sales and service company
2002 ■ ■ Transfer of activities from Atlanta to the principal
American location in Chicago
2003 ■ ■ Consolidation of international production capacities and relocation
of assembly from Colchester/Great Britain to Sassenberg
TECHNOTRANS FINANCIAL CALENDAR
Publications and dates
2004
Annual Press Conference 09.03.2004
Analyst Meeting 09.03.2004
3-Month Report 2004 04.05.2004
Annual Shareholders Meeting 2004 28.05.2004
6-Month Report 2004 10.08.2004
9-Month Report 2004 09.11.2004
2005
Annual Press Conference 08.03.2005
Analyst Meeting 08.03.2005
3-Month Report 2005 03.05.2005
Annual Shareholders Meeting 2005 13.05.2005
Imprint
Concept & Design
Impacct Communication GmbH, Hamburg
Photography
Dirk Uhlenbrock, Hamburg
Andreas Werntges, Gladbeck
Rasch Druckerei und Verlag GmbH & Co. KG, Bramsche
on Heidelberg Speedmaster SM 102-10P
with dampening solution circulation and temperature
control systems FKT-C 40.000 by technotrans

technotrans AG
Robert-Linnemann-Strasse 17
48336 Sassenberg
Germany
Phone +49 25 83/301–0
Fax +49 25 83/301–30
email [email protected]
internet www.technotrans.de