tsunami evacuation behavior analysis - iatss · tsunami evacuation behavior analysis ... some...
TRANSCRIPT

IATSS RESEARCH Vol.30 No.2, 2006 83
TSUNAMI EVACUATION BEHAVIOR ANALYSIS – One Step of Transportation Disaster Response – T. CHARNKOL, Y. TANABORIBOON
TSUNAMI EVACUATION BEHAVIOR ANALYSIS– One Step of Transportation Disaster Response –
Thai CHARNKOL Yordphol TANABORIBOON Doctoral student, Transportation Engineering Program Professor, Transportation Engineering Program School of Engineering and Technology School of Engineering and Technology Asian Institute of Technology Asian Institute of Technology Pathumthani, Thailand Pathumthani, Thailand
(Received June 30, 2006)
Evacuation behavior analysis is known to be one step in a transportation disaster response. The purpose of this study was therefore, to investigate permanent and transient resident's behaviors and their backgrounds during a hypothetical tsunami evacua-tion. Evacuation behavior data were collected from two affected areas, Phuket and Phang-nga, Thailand. A behavioral analysis was carried out to gain some insights into human responses to a future tsunami warning, especially in determining evacuees’ response patterns (fast, medium, and slow) under various conditions (four preparation and response time intervals, i.e., 60 minutes, 45 minutes, 30 minutes, and 15 minutes). Preparation and response curves, which represent the time at which the evacuees were expected to begin their evacuation and move to a safer area, were estimated and compared between the permanent and transient residents. Furthermore, evacuation models were employed using binary logistic regression techniques to estimate the likelihood of evacuees being involved in each response group (quick or slow group). Results of the models revealed natural reactions to tsunami evacuation warning, including the response times and evacuation behaviors based on their different backgrounds. This research could help ad-dress and improve future evacuation management to become more efficient and more effective, which can increase public safety for the community.
Key Words: Disaster, Tsunamis, Evacuation, Behavior, Transportation disaster response
1. INTRODUCTION
Natural disasters can have destructive impacts in terms of human casualties, injuries, and property dam-age1. In many of these situations, evacuation may offer the best alternative to ensure safety of the population. The key to a successful evacuation is being able to move people at risk to safer areas2. Evacuation travel demand estimations have been derived from various models and these estimations are used in planning, understanding evacuation decision timing, and determining the effec-tiveness of evacuation as a protective action strategy3-7. For these reasons, several types of evacuation travel de-mand estimations have been conducted in the past, at-tempting to improve the prediction of this unexpected natural or man-made catastrophe.
Studies of evacuation modeling in the world have flourished in various disciplines since 1970. One of par-ticular interest is the field that focuses on human behav-ior8. An area which requires much additional effort, is the translation of the considerable amount of knowledge on evacuees’ behavior during the time of crisis into reliable quantitative measures of the timing of evacuee mobiliza-tion, specifically by distance from the source of the haz-
ard9. Many of the earliest works focused on hurricane evacuation, while nowadays, various types of evacuation modeling have been conducted for other types of unex-pected disasters10-15. However, travel demand for evacua-tion is different from everyday travel needs and the foundation of travel needs in emergency situations re-quires knowledge of evacuation behavior. Therefore, un-derstanding evacuation behavior and the factors that may affect evacuees’ decisions are crucial in determining the forces behind evacuation travel demand16.
Traditional travel demand estimation was deter-mined by using evacuation participation rates to estimate the number of households expected to evacuate. Gener-ally, participation rates vary by type of disaster. These rates depend on hazard characteristics, perceived threats, situational characteristics, and disaster information15. Afterward, the time at which evacuees are expected to begin their evacuation, was estimated, typically by using a so-called response or mobilization curve9. Another form of travel demand for evacuation estimation that has been conducted by several researchers is the logistic regres-sion technique6. Some subjective perceptions were in-cluded as independent variables because these variables were found to be statistically significant.

TRANSPORTATION
84 IATSS RESEARCH Vol.30 No.2, 2006
However, relatively little attention has been given to estimate travel demand for tsunami evacuation. Even though tsunamis have occurred in many places, including the Caribbean and Mediterranean Seas, and Indian and Atlantic Oceans17, they are still considered rare, in com-parison to floods and hurricanes4.
On December 26, 2004, an earthquake produced the largest trans-oceanic tsunami in the last 40 years, and killed more people than any tsunami in recorded histo-ry18,19. The impact of the tsunami was both widespread and destructive to the natural environment (rocks, beach-es, etc.), vegetation, man-made structures, and dwell-ings20. Thailand was also affected by the tsunami as a result of its geophysical location. The unprecedented tsu-nami has been cited as one of the worst natural disasters in Thailand. As a result of the destructive impact on the Andaman Sea Coast, six provinces in Thailand experi-enced the most severe tsunami event, leaving behind more than 5,000 casualties and severely damaged public utilities as well as commercial establishments and hous-es. The estimated total economic losses exceeded US $ 1.6 billion21, partly due to the fact that the existing situa-tion of the emergency evacuation in Thailand was found to be inefficient and ineffective. There has not been a me-thodical investigation of the emergency impacts nor emergency evacuation plans that sufficiently integrated
the transportation component with other needs. It is im-portant, therefore, to pay special consideration in apply-ing transportation planning procedures in evacuation planning, which is the main motivation of this research. To begin transportation response to a disaster, it is re-quired to have an overall understanding of what happens in a disaster and how various forces respond, especially peoples behaviors2.
The main objectives of this paper are to investigate evacuees’ behaviors and to develop a tsunami evacuation model using binary logistic regression technique in esti-mating the evacuation response and factors affecting tsu-nami evacuation. The models are estimated and evaluated using data collected from the two most recent tsunami affected areas, Phuket and Phang-nga in Thailand.
2. DATA COLLECTION
The tsunamis harshly struck the west coast of Thai-land. Figure 1 presents the locations of the six provinces affected by this Indian Ocean tsunami, which were Phang-nga, Ranong, Satun, Trang, Krabi and Phuket. Since tsunamis are rare events and most of the evidence has perished, it is crucial and critical that reconnaissance or behavioral expectation surveys be organized and car-
Fig. 1 Affected area by the Indian Ocean tsunami

IATSS RESEARCH Vol.30 No.2, 2006 85
TSUNAMI EVACUATION BEHAVIOR ANALYSIS – One Step of Transportation Disaster Response – T. CHARNKOL, Y. TANABORIBOON
ried out quickly and thoroughly after each and every tsu-nami event, to collect detailed data valuable for hazard assessment, human behavior, model validation, and other aspects of tsunami mitigation22.
Therefore, this research intended to collect data in Phuket and Phang-nga, the two most damaged provinces, both in terms of the economy and number of casualties. Phuket Island is Thailand's largest island, connected to the mainland at Phang-nga and is one of the top tourist locations in the country. The famous attractions include Kata Beach, Karon Beach, Patong Beach (the most popu-lar among tourists), Kamala Beach, Surin Beach, and Nai Yang Beach. Although after the tsunami disaster, the damage related to both private and public properties in Phuket was primarily limited to the shoreline, several beaches are still severely affected, including Bang Tao Beach, Kamala Beach, Patong Beach, Kata Beach, Karon Beach, and Nai Harn Beach. A total of 260 people were killed (149 Thais and 111 foreigners), while another 1,111 people were injured (591 Thais and 520 foreign-ers), and 646 people are missing (261 Thais and 385 for-eigners). In total, 13,065 persons from 2,615 families suffered as a result of this destructive event. The damage on Phuket Island alone is estimated to be over US $32.5 million21.
Since Phang-nga province is located along the coast line and was struck by as high as 10-meter waves, it suf-fered the most severe devastation, both in terms of num-ber of casualties and property damage. Moreover, apart from various hotels destroyed in this area, many other businesses suffered as well, including ruined fishing boats and deaths of farm animals. Some schools and gov-ernment buildings also were reported to be damaged or destroyed. While 5,000 people of Phang-nga’s popula-tion came from various parts of Thailand23,24, over 1,000 people lost their lives; many are still missing, and most
homes were destroyed.Questionnaire surveys were conducted during
March and April 2005 to obtain behavioral information from those people who were living in the affected areas (coast line). In total, 1,148 questionnaire forms were dis-tributed. However, only 907 questionnaires, which con-tained completed information, were used for analysis. Most of the questionnaires were distributed in Kamala Beach, Patong Beach, Kata Beach, and Karon Beach. In addition, some questionnaire forms were also distributed in Baan Namkhem in Phang-nga for validation purposes since both locations suffered from similar devastation. The survey was comprised of respondents who recently experienced the tsunami and those who had not yet to encountered this disaster. Those with relatives involved in the tsunami were also considered as an experienced group. The observation groups are illustrated as shown in Figure 2.
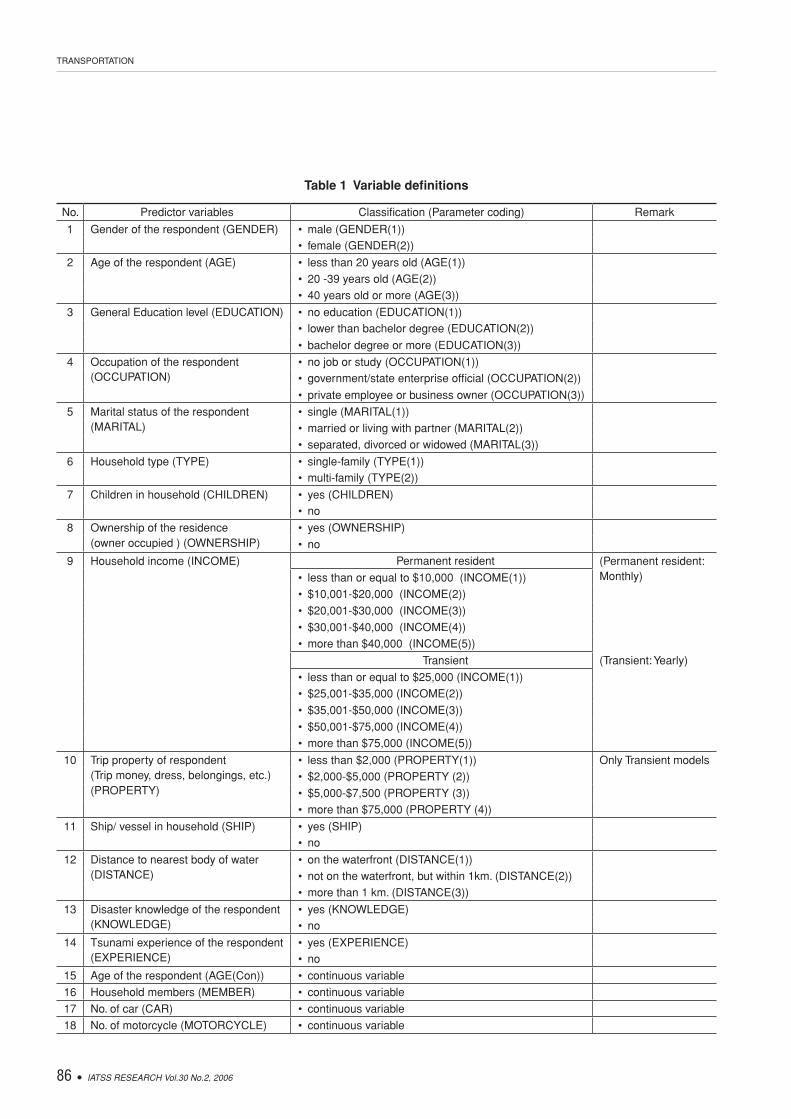
Thirty point eight-seven percent of respondents had experienced the tsunami, the remainder had not. The ob-served experience of the respondents or their relatives encountered during the Indian Ocean tsunami attack who died or were lost was 5.62%; injured was 6.62%; house/properties damaged was 17.64%; and nothing happened was 10.47%. It must be noted that in this study, any non-permanent resident (either foreigner or Thai) are consid-ered as transients. These generally were tourists and/or temporary workers. All data descriptions and definitions of variables used in this study are presented as shown in Table 1.
3. METHODOLOGY
3.1 Background and assumptionThere are two types of tsunami, both of which re-
quire proper evacuation planning. “Distant tsunamis”
Fig. 2 Respondents related to the Indian Ocean tsunami exexperience
No experience69.13%
Experience30.87%
10.47
17.64
6.62
no damagesreported
house/propertiesdamaged
injured
died/lost 5.62
0 5 10 15 20
TRANSPORTATION
86 IATSS RESEARCH Vol.30 No.2, 2006
Table 1 Variable definitions
No. Predictor variables Classification (Parameter coding) Remark
1 Gender of the respondent (GENDER) • male (GENDER(1))• female (GENDER(2))
2 Age of the respondent (AGE) • less than 20 years old (AGE(1))• 20 -39 years old (AGE(2))• 40 years old or more (AGE(3))
3 General Education level (EDUCATION) • no education (EDUCATION(1))• lower than bachelor degree (EDUCATION(2))
• bachelor degree or more (EDUCATION(3))
4 Occupation of the respondent • no job or study (OCCUPATION(1))(OCCUPATION) • government/state enterprise official (OCCUPATION(2))
• private employee or business owner (OCCUPATION(3))
5 Marital status of the respondent • single (MARITAL(1))(MARITAL) • married or living with partner (MARITAL(2))
• separated, divorced or widowed (MARITAL(3))
6 Household type (TYPE) • single-family (TYPE(1))• multi-family (TYPE(2))
7 Children in household (CHILDREN) • yes (CHILDREN)• no
8 Ownership of the residence • yes (OWNERSHIP)(owner occupied ) (OWNERSHIP) • no
9 Household income (INCOME) Permanent resident (Permanent resident:
• less than or equal to $10,000 (INCOME(1)) Monthly)
• $10,001-$20,000 (INCOME(2))
• $20,001-$30,000 (INCOME(3))
• $30,001-$40,000 (INCOME(4))• more than $40,000 (INCOME(5))
Transient (Transient: Yearly)
• less than or equal to $25,000 (INCOME(1))• $25,001-$35,000 (INCOME(2))
• $35,001-$50,000 (INCOME(3))
• $50,001-$75,000 (INCOME(4))• more than $75,000 (INCOME(5))
10 Trip property of respondent • less than $2,000 (PROPERTY(1)) Only Transient models(Trip money, dress, belongings, etc.) • $2,000-$5,000 (PROPERTY (2)) (PROPERTY) • $5,000-$7,500 (PROPERTY (3))
• more than $75,000 (PROPERTY (4))
11 Ship/ vessel in household (SHIP) • yes (SHIP)• no
12 Distance to nearest body of water • on the waterfront (DISTANCE(1))(DISTANCE) • not on the waterfront, but within 1km. (DISTANCE(2))
• more than 1 km. (DISTANCE(3))
13 Disaster knowledge of the respondent • yes (KNOWLEDGE)(KNOWLEDGE) • no
14 Tsunami experience of the respondent • yes (EXPERIENCE)(EXPERIENCE) • no
15 Age of the respondent (AGE(Con)) • continuous variable
16 Household members (MEMBER) • continuous variable
17 No. of car (CAR) • continuous variable
18 No. of motorcycle (MOTORCYCLE) • continuous variable
IATSS RESEARCH Vol.30 No.2, 2006 87
TSUNAMI EVACUATION BEHAVIOR ANALYSIS – One Step of Transportation Disaster Response – T. CHARNKOL, Y. TANABORIBOON
(trans-ocean tsunamis) originate from seismic activity across the ocean, and “local tsunamis” originate from seis-mic activity just offshore of an affected area. While an evacuation needs to occur rapidly, currently, the only means to warn of a local tsunami is still through the use of sirens4. Geographically, Thailand’s shoreline is less likely to be struck by a local tsunami21. Therefore, the estimations and parameters used in this study are based on the distant tsunami conditions, where the evacuation time needed is much longer than that of a local tsunami.
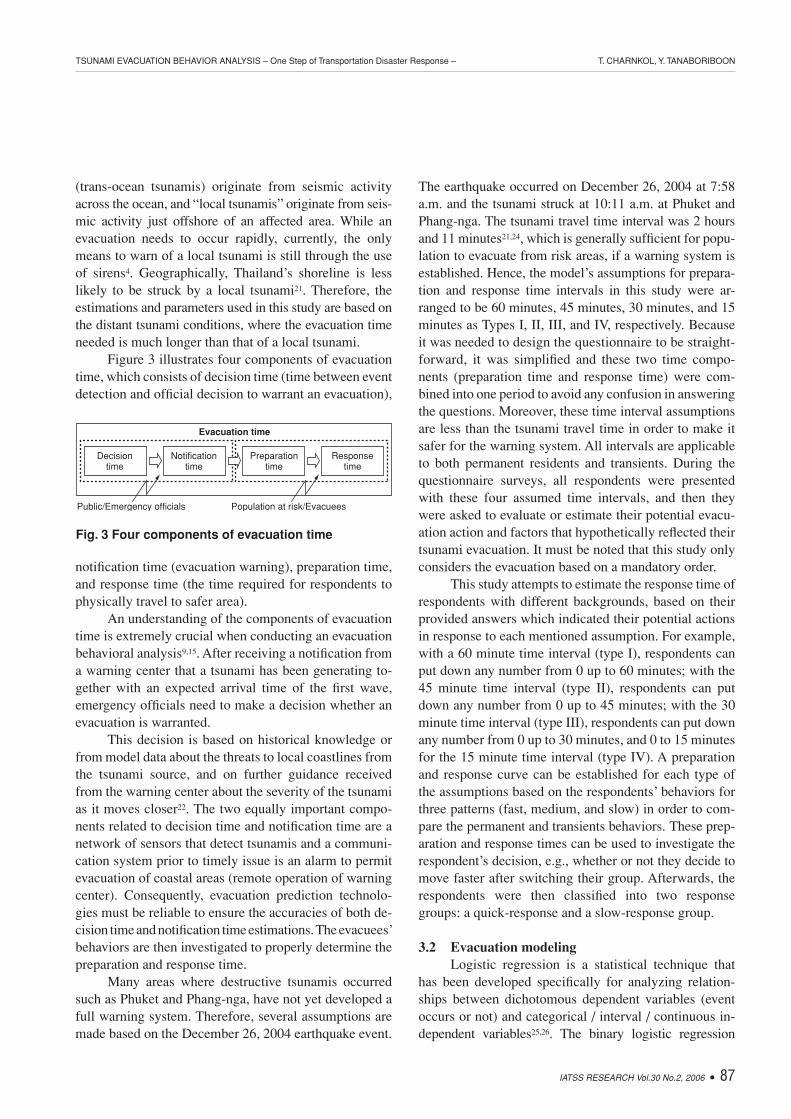
Figure 3 illustrates four components of evacuation time, which consists of decision time (time between event detection and official decision to warrant an evacuation),
notification time (evacuation warning), preparation time, and response time (the time required for respondents to physically travel to safer area).
An understanding of the components of evacuation time is extremely crucial when conducting an evacuation behavioral analysis9,15. After receiving a notification from a warning center that a tsunami has been generating to-gether with an expected arrival time of the first wave, emergency officials need to make a decision whether an evacuation is warranted.
This decision is based on historical knowledge or from model data about the threats to local coastlines from the tsunami source, and on further guidance received from the warning center about the severity of the tsunami as it moves closer22. The two equally important compo-nents related to decision time and notification time are a network of sensors that detect tsunamis and a communi-cation system prior to timely issue is an alarm to permit evacuation of coastal areas (remote operation of warning center). Consequently, evacuation prediction technolo-gies must be reliable to ensure the accuracies of both de-cision time and notification time estimations. The evacuees’ behaviors are then investigated to properly determine the preparation and response time.
Many areas where destructive tsunamis occurred such as Phuket and Phang-nga, have not yet developed a full warning system. Therefore, several assumptions are made based on the December 26, 2004 earthquake event.
The earthquake occurred on December 26, 2004 at 7:58 a.m. and the tsunami struck at 10:11 a.m. at Phuket and Phang-nga. The tsunami travel time interval was 2 hours and 11 minutes21,24, which is generally sufficient for popu-lation to evacuate from risk areas, if a warning system is established. Hence, the model’s assumptions for prepara-tion and response time intervals in this study were ar-ranged to be 60 minutes, 45 minutes, 30 minutes, and 15 minutes as Types I, II, III, and IV, respectively. Because it was needed to design the questionnaire to be straight-forward, it was simplified and these two time compo-nents (preparation time and response time) were com-bined into one period to avoid any confusion in answering the questions. Moreover, these time interval assumptions are less than the tsunami travel time in order to make it safer for the warning system. All intervals are applicable to both permanent residents and transients. During the questionnaire surveys, all respondents were presented with these four assumed time intervals, and then they were asked to evaluate or estimate their potential evacu-ation action and factors that hypothetically reflected their tsunami evacuation. It must be noted that this study only considers the evacuation based on a mandatory order.
This study attempts to estimate the response time of respondents with different backgrounds, based on their provided answers which indicated their potential actions in response to each mentioned assumption. For example, with a 60 minute time interval (type I), respondents can put down any number from 0 up to 60 minutes; with the 45 minute time interval (type II), respondents can put down any number from 0 up to 45 minutes; with the 30 minute time interval (type III), respondents can put down any number from 0 up to 30 minutes, and 0 to 15 minutes for the 15 minute time interval (type IV). A preparation and response curve can be established for each type of the assumptions based on the respondents’ behaviors for three patterns (fast, medium, and slow) in order to com-pare the permanent and transients behaviors. These prep-aration and response times can be used to investigate the respondent’s decision, e.g., whether or not they decide to move faster after switching their group. Afterwards, the respondents were then classified into two response groups: a quick-response and a slow-response group.
3.2 Evacuation modelingLogistic regression is a statistical technique that
has been developed specifically for analyzing relation-ships between dichotomous dependent variables (event occurs or not) and categorical / interval / continuous in-dependent variables25,26. The binary logistic regression
Fig. 3 Four components of evacuation time
Public/Emergency officials Population at risk/Evacuees
Decisiontime
Notificationtime
Preparationtime
Responsetime
Evacuation time

TRANSPORTATION
88 IATSS RESEARCH Vol.30 No.2, 2006
model for tsunami evacuation estimates the probability of a respondent being involved in each group as a func-tion of predictor variables, including the socioeconomic characteristics of the respondents. This model is used in this research since the dependent variable Y (group clas-sification) can only take on two values, i.e. a respondent with a quick response and a respondent with a slow re-sponse. The probability that a respondent would be in-volved in a quick response is given in Equation 1, and the logistic regression model (Zi) is given in Equation 2.
i
i
Z
Z
ie
e
+=
1 ................................................................ (1)
NNi
ii XBXBXBBZ ++++=
−
= ...1
ln 22110 ........ (2)
Where i is the likelihood that a respondent would be involved in a quick response; X’s are independent pre-dictor variables, while both main effects and interactions can generally be accommodated; B’s are model coeffi-cients and are estimated by using the maximum likeli-hood method. The advantage of the model derived from binary logistic regression, besides the ability to predict the probabilities of respondents being involved in each group for tsunami evacuation, is that with all other pre-dictor variables held constant, the probability of being involved in a quick response which may increase/de-crease for every unit increment in each predictor variable, can be estimated. This increase/decrease is equal to the model coefficients (Bi) and is recognized as log odds. On the other hand, odds of event that can be called “odds ratios”, are more useful than the log odds. The odds ratios can be estimated using Equation 3. The odds ratios (O.R.) = eBi ; i = 1, 2, …, N .......... (3)
The odds ratios are defined as the probability of the event occurring divided by the probability of the event not occurring. It is the exponential term raised to the power of the coefficient of the predictor variable.
The null hypothesis is that all coefficients in the equation take the value zero. The null hypothesis can be statistically rejected if any relevant model parameter is different from zero at a 0.05 significance level. Individual predictor variable is assessed for inclusion using the Wald statistic test and test of change in -2-log-likelihood (-2-LL). The Wald statistic is a test for significance of Bi and is obtained by dividing the coefficient by its standard er-ror and squaring the result as presented in Equation 4.
Wald statistic = 2
2B
BSE
.................................................. (4)
The goodness-of-fit of the binary logistic model is evaluated using the likelihood ratio index ( 2), the Hos-mer-Lemeshow statistical test, and the use of the AUC (Area under the Curve) statistic based on the Receiver Operating Characteristic (ROC) plot, which can be mea-sured to quantify the diagnostic accuracy of a model. Then, the cut-off point for the model can be estimated using the ROC concept. The performance of the model is also evaluated by using the Percent Correctly Predicted (PCP) and Pseudo R square measures.
Two datasets were used in creating permanent resi-dent models and transients models. Specifically, Phuket’s samples (633 respondents) were used as a calibration da-taset for model development. While Phang-nga’s samples (274 respondents) were used to validate the developed model. The data distributions are given as follows:
• Permanent residents: Phuket’s samples (507 respon-dents), Phang-nga’s samples (212 respondents)
• Transients: Phuket’s samples (126 respondents), Phang-nga’s samples (62 respondents)
4. ANALYSIS OF RESULTS
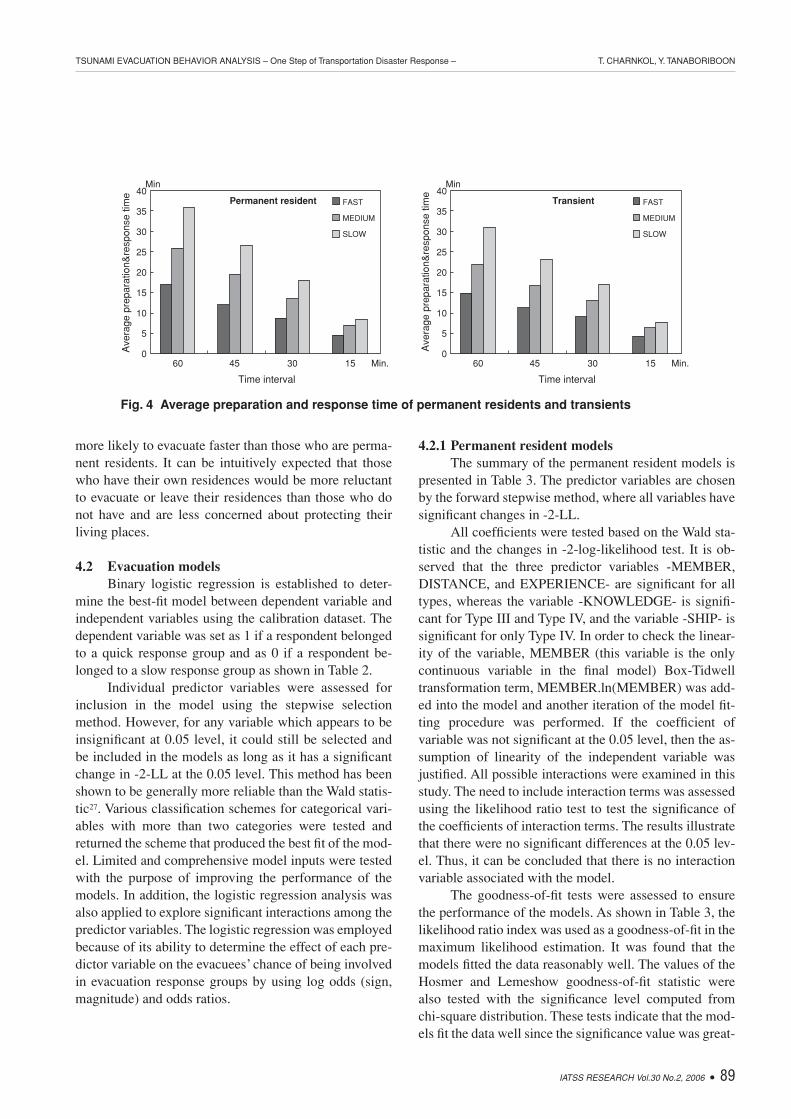
4.1 Permanent resident and transient behaviorsAverage preparation and response time are com-
pared among the different patterns of responses obtained from both permanent residents and transients, according to each assumption made (i.e., fast, medium, or slow), as shown in Figure 4. The results clearly show that the aver-age preparation and response time of permanent residents is greater than those of transients. For the 60 minute interval, average preparation and response time of fast pattern for permanent residents is 17 minutes, which is slightly higher than those of transients (15 minutes). Additionally, preparation and response curves for each assumption type are also presented in Figure 5.
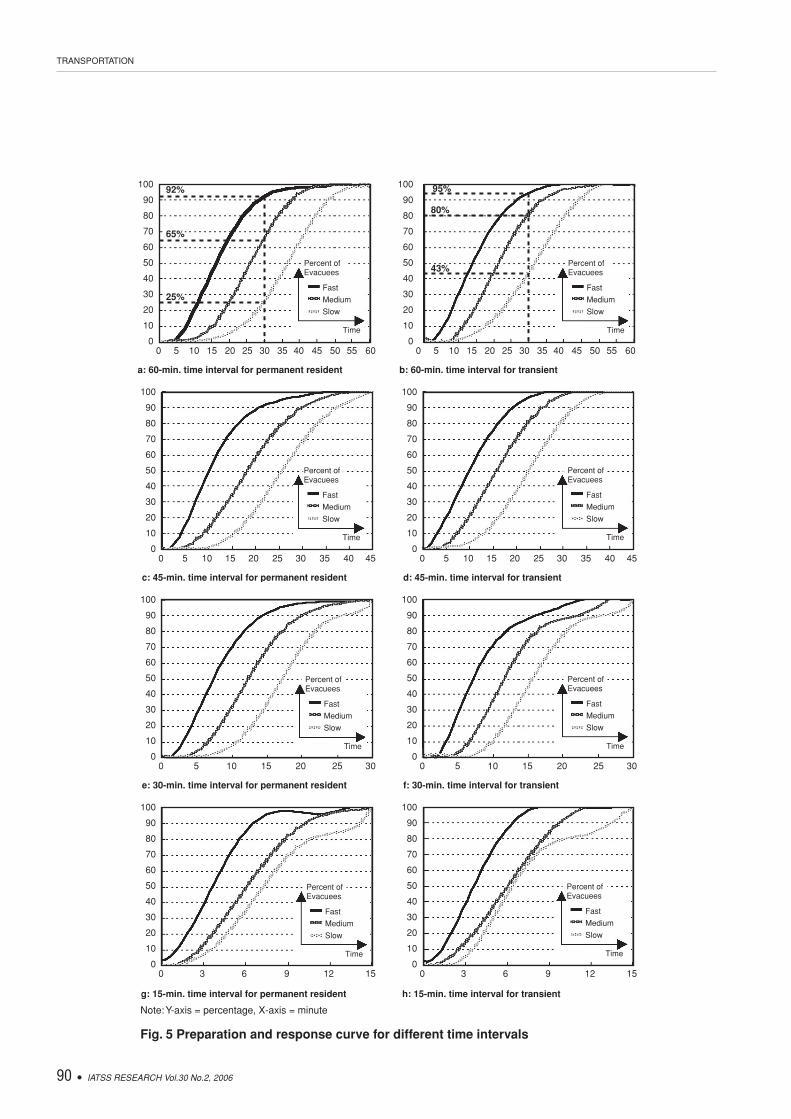
Each of the three patterns of permanent residents and transients are represented by three different lines. Each line represents the cumulative percentages of evacu-ees for different time interval assumptions. For example, Figures 5a and 5b illustrate the cumulative percentages of evacuees at the 30-minute time interval (half of the total time of 60 minutes given). The results reveal that the cumulative percentages of permanent residents are less than that of transients. The results are also similar among all other patterns, indicating that transients are
IATSS RESEARCH Vol.30 No.2, 2006 89
TSUNAMI EVACUATION BEHAVIOR ANALYSIS – One Step of Transportation Disaster Response – T. CHARNKOL, Y. TANABORIBOON
more likely to evacuate faster than those who are perma-nent residents. It can be intuitively expected that those who have their own residences would be more reluctant to evacuate or leave their residences than those who do not have and are less concerned about protecting their living places.
4.2 Evacuation modelsBinary logistic regression is established to deter-
mine the best-fit model between dependent variable and independent variables using the calibration dataset. The dependent variable was set as 1 if a respondent belonged to a quick response group and as 0 if a respondent be-longed to a slow response group as shown in Table 2.
Individual predictor variables were assessed for inclusion in the model using the stepwise selection method. However, for any variable which appears to be insignificant at 0.05 level, it could still be selected and be included in the models as long as it has a significant change in -2-LL at the 0.05 level. This method has been shown to be generally more reliable than the Wald statis-tic27. Various classification schemes for categorical vari-ables with more than two categories were tested and returned the scheme that produced the best fit of the mod-el. Limited and comprehensive model inputs were tested with the purpose of improving the performance of the models. In addition, the logistic regression analysis was also applied to explore significant interactions among the predictor variables. The logistic regression was employed because of its ability to determine the effect of each pre-dictor variable on the evacuees’ chance of being involved in evacuation response groups by using log odds (sign, magnitude) and odds ratios.
4.2.1 Permanent resident modelsThe summary of the permanent resident models is
presented in Table 3. The predictor variables are chosen by the forward stepwise method, where all variables have significant changes in -2-LL.
All coefficients were tested based on the Wald sta-tistic and the changes in -2-log-likelihood test. It is ob-served that the three predictor variables -MEMBER, DISTANCE, and EXPERIENCE- are significant for all types, whereas the variable -KNOWLEDGE- is signifi-cant for Type III and Type IV, and the variable -SHIP- is significant for only Type IV. In order to check the linear-ity of the variable, MEMBER (this variable is the only continuous variable in the final model) Box-Tidwell transformation term, MEMBER.ln(MEMBER) was add-ed into the model and another iteration of the model fit-ting procedure was performed. If the coefficient of variable was not significant at the 0.05 level, then the as-sumption of linearity of the independent variable was justified. All possible interactions were examined in this study. The need to include interaction terms was assessed using the likelihood ratio test to test the significance of the coefficients of interaction terms. The results illustrate that there were no significant differences at the 0.05 lev-el. Thus, it can be concluded that there is no interaction variable associated with the model.
The goodness-of-fit tests were assessed to ensure the performance of the models. As shown in Table 3, the likelihood ratio index was used as a goodness-of-fit in the maximum likelihood estimation. It was found that the models fitted the data reasonably well. The values of the Hosmer and Lemeshow goodness-of-fit statistic were also tested with the significance level computed from chi-square distribution. These tests indicate that the mod-els fit the data well since the significance value was great-
Fig. 4 Average preparation and response time of permanent residents and transients
60 45 30 15 Min.
Time interval
Ave
rage
pre
para
tion&
resp
onse
tim
e
Ave
rage
pre
para
tion&
resp
onse
tim
e
Permanent resident FAST
MEDIUM
SLOW
40
35
30
25
20
15
10
5
0
Min
60 45 30 15 Min.
Time interval
Transient FAST
MEDIUM
SLOW
40
35
30
25
20
15
10
5
0
Min
TRANSPORTATION
90 IATSS RESEARCH Vol.30 No.2, 2006
Note: Y-axis = percentage, X-axis = minute
Fig. 5 Preparation and response curve for different time intervals
0 5 10 15 20 25 30 35 40 45 50 55 60
100
90
80
70
60
50
40
30
20
10
0
a: 60-min. time interval for permanent resident
Fast
Medium
Slow
Percent of Evacuees
Time
92%
25%
65%
0 5 10 15 20 25 30 35 40 45 50 55 60
100
90
80
70
60
50
40
30
20
10
0
b: 60-min. time interval for transient
Fast
Medium
Slow
Percent of Evacuees
Time
95%
80%
43%
0 5 10 15 20 25 30 35 40 45
100
90
80
70
60
50
40
30
20
10
0
c: 45-min. time interval for permanent resident
Fast
Medium
Slow
Percent of Evacuees
Time
0 5 10 15 20 25 30 35 40 45
100
90
80
70
60
50
40
30
20
10
0
d: 45-min. time interval for transient
Fast
Medium
Slow
Percent of Evacuees
Time
0 5 10 15 20 25 30
100
90
80
70
60
50
40
30
20
10
0
e: 30-min. time interval for permanent resident
Fast
Medium
Slow
Percent of Evacuees
Time
0 5 10 15 20 25 30
100
90
80
70
60
50
40
30
20
10
0
f: 30-min. time interval for transient
Fast
Medium
Slow
Percent of Evacuees
Time
0 3 6 9 12 15
100
90
80
70
60
50
40
30
20
10
0
g: 15-min. time interval for permanent resident
Fast
Medium
Slow
Percent of Evacuees
Time
0 3 6 9 12 15
100
90
80
70
60
50
40
30
20
10
0
h: 15-min. time interval for transient
Fast
Medium
Slow
Percent of Evacuees
Time
IATSS RESEARCH Vol.30 No.2, 2006 91
TSUNAMI EVACUATION BEHAVIOR ANALYSIS – One Step of Transportation Disaster Response – T. CHARNKOL, Y. TANABORIBOON
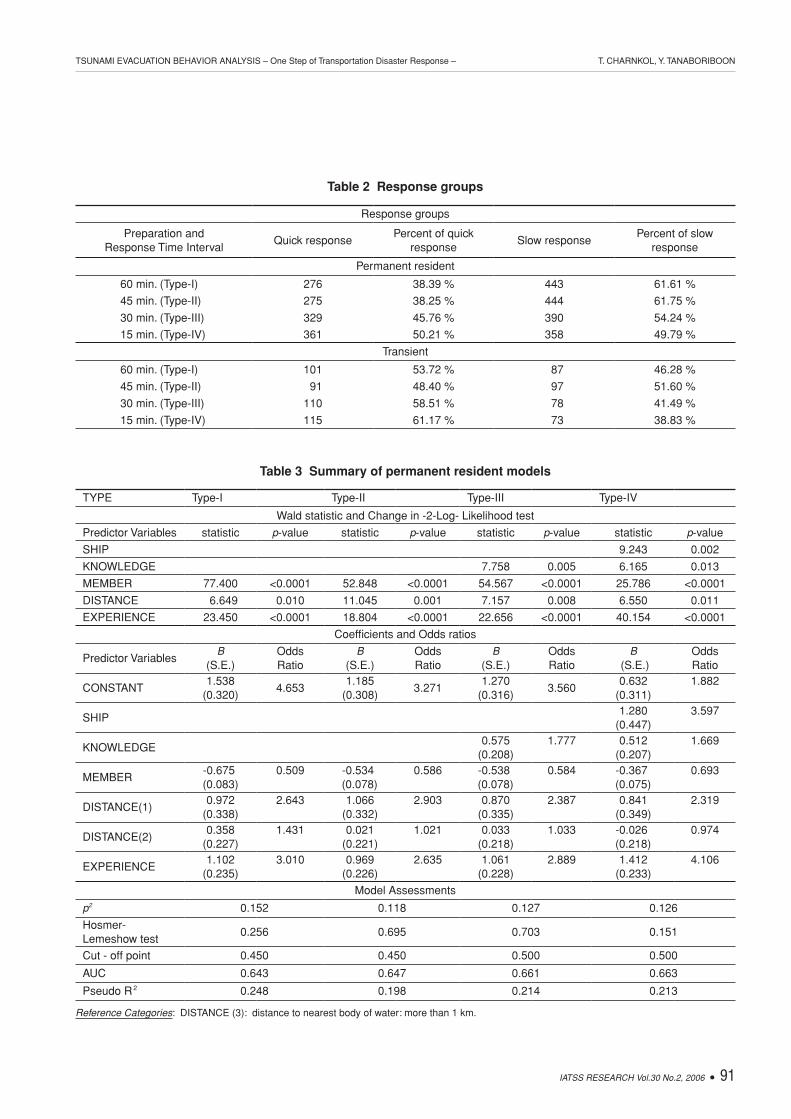
Table 2 Response groups
Response groups
Preparation and Response Time Interval
Quick response Percent of quick
responseSlow response
Percent of slow response
Permanent resident
60 min. (Type-I) 276 38.39 % 443 61.61 %
45 min. (Type-II) 275 38.25 % 444 61.75 %
30 min. (Type-III) 329 45.76 % 390 54.24 %
15 min. (Type-IV) 361 50.21 % 358 49.79 %
Transient
60 min. (Type-I) 101 53.72 % 87 46.28 %
45 min. (Type-II) 91 48.40 % 97 51.60 %
30 min. (Type-III) 110 58.51 % 78 41.49 %
15 min. (Type-IV) 115 61.17 % 73 38.83 %
Table 3 Summary of permanent resident models
TYPE Type-I Type-II Type-III Type-IV
Wald statistic and Change in -2-Log- Likelihood test
Predictor Variables statistic p-value statistic p-value statistic p-value statistic p-value
SHIP 9.243 0.002
KNOWLEDGE 7.758 0.005 6.165 0.013
MEMBER 77.400 <0.0001 52.848 <0.0001 54.567 <0.0001 25.786 <0.0001
DISTANCE 6.649 0.010 11.045 0.001 7.157 0.008 6.550 0.011
EXPERIENCE 23.450 <0.0001 18.804 <0.0001 22.656 <0.0001 40.154 <0.0001
Coefficients and Odds ratios
Predictor VariablesB
(S.E.)Odds Ratio
B(S.E.)
Odds Ratio
B(S.E.)
Odds Ratio
B (S.E.)
Odds Ratio
CONSTANT1.538
(0.320) 4.653
1.185(0.308)
3.2711.270
(0.316)3.560
0.632(0.311)
1.882
SHIP1.280
(0.447) 3.597
KNOWLEDGE0.575
(0.208) 1.777 0.512
(0.207) 1.669
MEMBER-0.675
(0.083) 0.509 -0.534
(0.078)0.586 -0.538
(0.078) 0.584 -0.367
(0.075) 0.693
DISTANCE(1)0.972
(0.338) 2.643 1.066
(0.332) 2.903 0.870
(0.335) 2.387 0.841
(0.349) 2.319
DISTANCE(2)0.358
(0.227) 1.431 0.021
(0.221)1.021 0.033
(0.218) 1.033 -0.026
(0.218) 0.974
EXPERIENCE1.102
(0.235)3.010 0.969
(0.226) 2.635 1.061
(0.228) 2.889 1.412
(0.233) 4.106
Model Assessments
p2 0.152 0.118 0.127 0.126
Hosmer-Lemeshow test
0.256 0.695 0.703 0.151
Cut - off point 0.450 0.450 0.500 0.500
AUC 0.643 0.647 0.661 0.663
Pseudo R2 0.248 0.198 0.214 0.213
Reference Categories: DISTANCE (3): distance to nearest body of water: more than 1 km.

TRANSPORTATION
92 IATSS RESEARCH Vol.30 No.2, 2006
er than the 0.05 level. The AUCs using the ROC concept indicate that the models have satisfactory discrimination ability for all assumption types. In addition, the perfor-mance of each model was also evaluated by using the Percent Correctly Predicted (PCP) measure as shown in Table 4.
With respect to results computed from the logistic model, a negative sign of a MEMBER coefficient of each model was evidently reasonable, indicating that a large family has a higher probability to belong in the slower response group for tsunami evacuation. The estimated odds ratios indicate that for each and every one person added to any household, the probability of an evacuee being in a quick response group decreases by approxi-mately 50% for all assumption types.
A positive sign of the DISTANCE coefficient re-veals that the respondents, who are living closer to the seashore, are more likely to evacuate earlier than those living further away from the shoreline. At the 0.05 sig-nificance level, those living on the waterfront -DIS-TANCE (1) - are approximately 2.5 times more likely to have a quicker evacuation than those who live farther than one kilometer away for all assumption types. It can be seen that the evacuees’ chance to be in the quick re-sponse group decreases (odds ratio of DISTANCE(2) decreases from DISTANCE(1)) as the distance to the nearest shore increases. This may due to the fact that among those households located closer to the shore are somewhat aware of their higher risk and higher degree of damages caused by the tsunami waves.
The positive sign of the EXPERIENCE coefficient indicates that respondents who themselves or whose rela-tives had experienced the Indian Ocean tsunami attack, are more likely to evacuate faster than those who have yet to encounter this disaster event. Those with experienced for all assumption types at the 0.05 significance level were approximately 3 times more likely to evacuate earlier.
Likewise, as anticipated, the positive sign of KNOWLEDGE coefficient indicates that respondents with disaster knowledge are more likely to evacuate fast-er than those without. Specifically, those with knowledge
are 1.78 and 1.67 times faster for Type-III and Type-IV respectively (at 0.05 significance level) emphasizing the importance of disaster knowledge and good communica-tion to a population’s evacuation. During this tragedy, several deaths, injuries, and property losses may have oc-curred because of the lack of basic knowledge on tsunami as it had never occurred in Thailand.
Interestingly, a positive sign of the SHIP coefficient implies that respondents, who own a boat or ship, are more likely to evacuate faster than those who do not. This may due to the fact that the “tsunami or harbor wave” is more familiar to those who own a vessel as they may have been working and staying along the seashore.
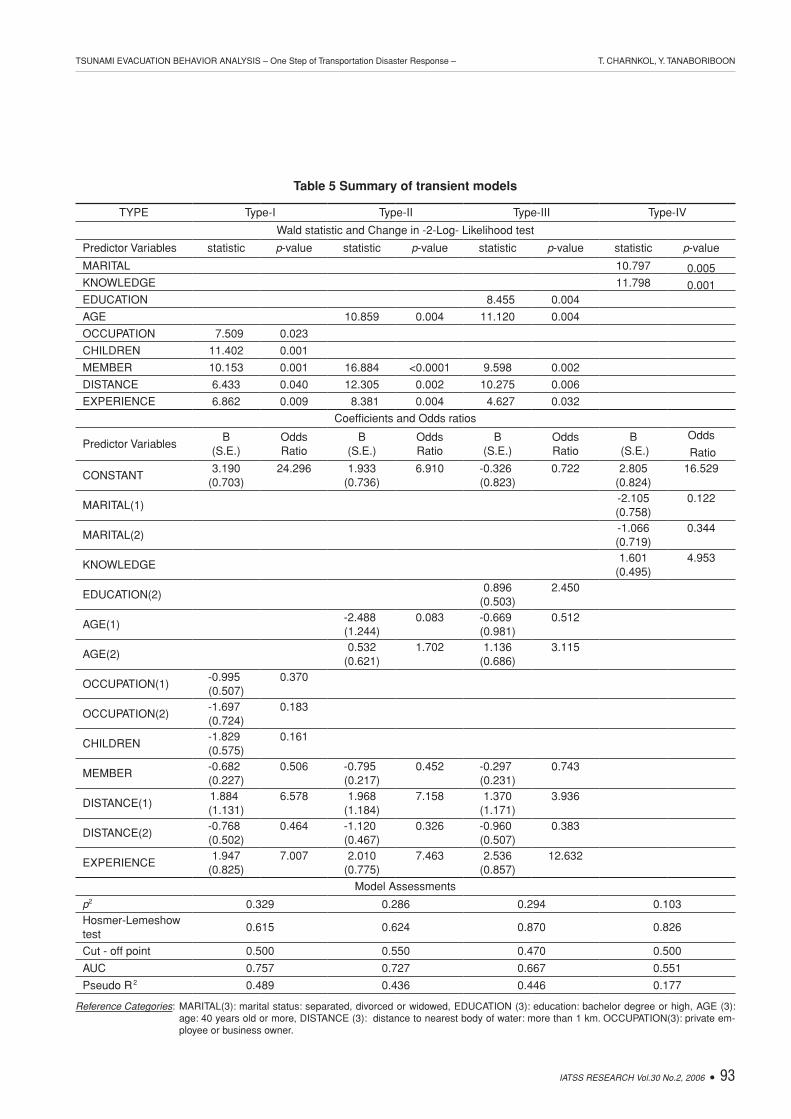
4.2.2 Transient modelsTable 5 presents the summary of the transient mod-
els. It was found that the three predictor variables -MEM-BER, DISTANCE, and EXPERIENCE- were significant to three assumption types (Types I, II, and III), whereas the variables -CHILDREN and OCCUPATION- were only significant for Type I, the variable -AGE- was sig-nificant for Types II and III, the variable -EDUCA-TION(2)- was only significant to Type III, then MARITAL(1) and KNOWLEDGE variables were sig-nificant at 0.05 level for only Type IV. The variable EDUCATION(1) is excluded from the models because all respondents did have some level of education. By evaluating the goodness-of-fit tests, it was found that three models (Type-I, Type-II, and Type-III) fit the data reasonably well, while the Type-IV model did not fit.
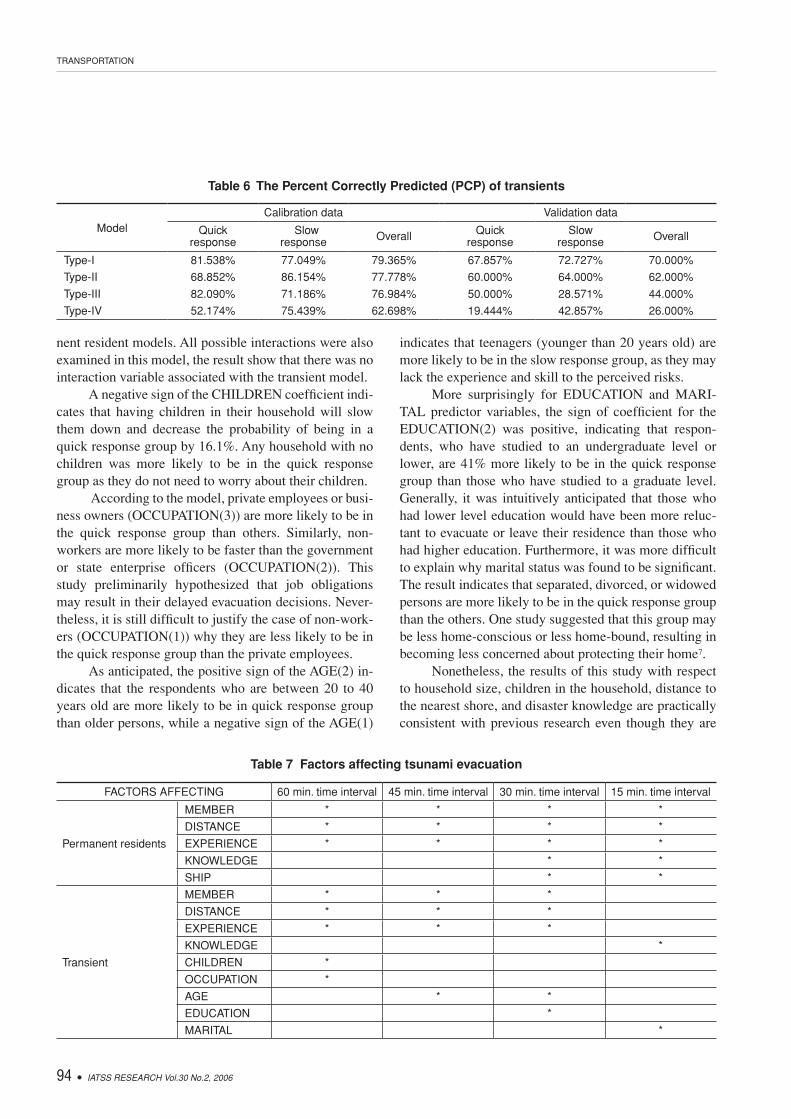
The PCPs for transient models are lower than those of permanent resident models as shown in Table 6. To further elaborate on this issue, it is known that most of Phuket’s transient respondents are tourists (both Thais and foreigners), whereas Phang-nga transient respon-dents are all Thai workers.
By applying the logistic regression technique, the results suggest that the effects of predictor variables -MEMBER, DISTANCE, EXPERIENCE, and KNOWL-EDGE— on the evacuees’ evacuation responses using log odds and odds ratios were similar to those in perma-
Table 4 The Percent Correctly Predicted (PCP) of permanent residents
ModelCalibration data Validation data
Quick response Slow response Overall Quick response Slow response Overall
Type-I 53.125% 80.635% 70.217% 65.854% 49.153% 56.000%
Type-II 53.571% 79.421% 69.428% 75.325% 44.715% 56.500%
Type-III 57.589% 77.385% 68.639% 66.000% 56.000% 61.000%
Type-IV 59.833% 73.881% 67.258% 85.345% 35.714% 64.500%
IATSS RESEARCH Vol.30 No.2, 2006 93
TSUNAMI EVACUATION BEHAVIOR ANALYSIS – One Step of Transportation Disaster Response – T. CHARNKOL, Y. TANABORIBOON
Table 5 Summary of transient models
TYPE Type-I Type-II Type-III Type-IV
Wald statistic and Change in -2-Log- Likelihood test
Predictor Variables statistic p-value statistic p-value statistic p-value statistic p-value
MARITAL 10.797 0.005KNOWLEDGE 11.798 0.001EDUCATION 8.455 0.004
AGE 10.859 0.004 11.120 0.004
OCCUPATION 7.509 0.023
CHILDREN 11.402 0.001
MEMBER 10.153 0.001 16.884 <0.0001 9.598 0.002
DISTANCE 6.433 0.040 12.305 0.002 10.275 0.006
EXPERIENCE 6.862 0.009 8.381 0.004 4.627 0.032
Coefficients and Odds ratios
Predictor VariablesB
(S.E.)Odds Ratio
B(S.E.)
Odds Ratio
B(S.E.)
Odds Ratio
B (S.E.)
Odds
Ratio
CONSTANT3.190
(0.703)24.296 1.933
(0.736)6.910 -0.326
(0.823)0.722 2.805
(0.824)16.529
MARITAL(1)-2.105 (0.758)
0.122
MARITAL(2)-1.066 (0.719)
0.344
KNOWLEDGE1.601
(0.495)4.953
EDUCATION(2)0.896
(0.503)2.450
AGE(1)-2.488 (1.244)
0.083 -0.669 (0.981)
0.512
AGE(2)0.532
(0.621)1.702 1.136
(0.686)3.115
OCCUPATION(1)-0.995 (0.507)
0.370
OCCUPATION(2)-1.697 (0.724)
0.183
CHILDREN-1.829 (0.575)
0.161
MEMBER-0.682 (0.227)
0.506 -0.795 (0.217)
0.452 -0.297 (0.231)
0.743
DISTANCE(1)1.884
(1.131)6.578 1.968
(1.184)7.158 1.370
(1.171)3.936
DISTANCE(2)-0.768 (0.502)
0.464 -1.120 (0.467)
0.326 -0.960 (0.507)
0.383
EXPERIENCE1.947
(0.825)7.007 2.010
(0.775)7.463 2.536
(0.857)12.632
Model Assessments
p2 0.329 0.286 0.294 0.103Hosmer-Lemeshow test
0.615 0.624 0.870 0.826
Cut - off point 0.500 0.550 0.470 0.500
AUC 0.757 0.727 0.667 0.551
Pseudo R2 0.489 0.436 0.446 0.177
Reference Categories: MARITAL(3): marital status: separated, divorced or widowed, EDUCATION (3): education: bachelor degree or high, AGE (3): age: 40 years old or more, DISTANCE (3): distance to nearest body of water: more than 1 km. OCCUPATION(3): private em-ployee or business owner.
TRANSPORTATION
94 IATSS RESEARCH Vol.30 No.2, 2006
nent resident models. All possible interactions were also examined in this model, the result show that there was no interaction variable associated with the transient model.
A negative sign of the CHILDREN coefficient indi-cates that having children in their household will slow them down and decrease the probability of being in a quick response group by 16.1%. Any household with no children was more likely to be in the quick response group as they do not need to worry about their children.
According to the model, private employees or busi-ness owners (OCCUPATION(3)) are more likely to be in the quick response group than others. Similarly, non-workers are more likely to be faster than the government or state enterprise officers (OCCUPATION(2)). This study preliminarily hypothesized that job obligations may result in their delayed evacuation decisions. Never-theless, it is still difficult to justify the case of non-work-ers (OCCUPATION(1)) why they are less likely to be in the quick response group than the private employees.
As anticipated, the positive sign of the AGE(2) in-dicates that the respondents who are between 20 to 40 years old are more likely to be in quick response group than older persons, while a negative sign of the AGE(1)
indicates that teenagers (younger than 20 years old) are more likely to be in the slow response group, as they may lack the experience and skill to the perceived risks.
More surprisingly for EDUCATION and MARI-TAL predictor variables, the sign of coefficient for the EDUCATION(2) was positive, indicating that respon-dents, who have studied to an undergraduate level or lower, are 41% more likely to be in the quick response group than those who have studied to a graduate level. Generally, it was intuitively anticipated that those who had lower level education would have been more reluc-tant to evacuate or leave their residence than those who had higher education. Furthermore, it was more difficult to explain why marital status was found to be significant. The result indicates that separated, divorced, or widowed persons are more likely to be in the quick response group than the others. One study suggested that this group may be less home-conscious or less home-bound, resulting in becoming less concerned about protecting their home7.
Nonetheless, the results of this study with respect to household size, children in the household, distance to the nearest shore, and disaster knowledge are practically consistent with previous research even though they are
Table 7 Factors affecting tsunami evacuation
FACTORS AFFECTING 60 min. time interval 45 min. time interval 30 min. time interval 15 min. time interval
Permanent residents
MEMBER * * * *
DISTANCE * * * *
EXPERIENCE * * * *
KNOWLEDGE * *
SHIP * *
Transient
MEMBER * * *
DISTANCE * * *
EXPERIENCE * * *
KNOWLEDGE *
CHILDREN *
OCCUPATION *
AGE * *
EDUCATION *
MARITAL *
Table 6 The Percent Correctly Predicted (PCP) of transients
ModelCalibration data Validation data
Quick response
Slow response Overall Quick
responseSlow
response Overall
Type-I 81.538% 77.049% 79.365% 67.857% 72.727% 70.000%
Type-II 68.852% 86.154% 77.778% 60.000% 64.000% 62.000%
Type-III 82.090% 71.186% 76.984% 50.000% 28.571% 44.000%
Type-IV 52.174% 75.439% 62.698% 19.444% 42.857% 26.000%
IATSS RESEARCH Vol.30 No.2, 2006 95
TSUNAMI EVACUATION BEHAVIOR ANALYSIS – One Step of Transportation Disaster Response – T. CHARNKOL, Y. TANABORIBOON
different types of disasters4,6,7,13,15. The result of factors affecting tsunami evacuation is summarized in Table 7.
5. DISCUSSION AND CONCLUSIONS
In this paper, a behavioral analysis was carried out to gain some insights into human response to future tsu-nami warnings, specifically in determining evacuees’ re-sponse patterns under various conditions (different preparation and response time intervals). Data were col-lected in the two tsunami affected areas, Phuket and Phang-nga provinces in Thailand.
Time at which the evacuees were expected to begin their evacuation, were estimated and compared between permanent residents and transients. It was found that tran-sients were more likely to evacuate faster than the perma-nent residents.
After investigating the overall factors for the evac-uation response groups and identifying the evacuees’ chances being in the response groups, the main predictor variables related to respondent characteristics were straightforwardly introduced into the binary logistic re-gression models which were based on the four time inter-vals. The goodness-of-fit was applied to evaluate the suitability of data among all models. The results indicate that the models fit the data reasonably well. The models can appropriately be described as the evacuation behav-ior prediction of individual respondents.
It was found in this study that the probability of be-ing in a quick response pattern diminishes with an increase in the number of family members. Respondents, who are living closer to the shore, are more likely to evacuate ear-lier than those living further away from the shore. Also, the respondents who themselves or whose relatives had experienced the Indian Ocean tsunami, were more likely to evacuate faster than those who had not.
Likewise, respondents, who have disaster knowl-edge, are more likely to evacuate faster than those who do not have any disaster knowledge. It indicates that disaster knowledge is crucial in the evacuation process in this country.
As expected, the number of children in the house-hold decreases the probability of being in the quick re-sponse group, and teenagers are more likely to be in a slow response group due to lack of experience as they tend to underestimate the risks of an approaching disaster and its destructive potential. Private employees were more likely to be in the quick response group than others. However, it was more difficult to understand in the cases of marital status and level of education, which were also
found to be statistically significant. These phenomena need further in-depth studies.
Nonetheless, further research is still needed to de-velop models that are capable of predicting tsunami evac-uation more accurately. The collection of data in the two communities that were both affected by the tsunami lim-ited the variance in experience, therefore further research is needed to study one affected and one unaffected com-munity. Additionally, more data which cover the full range of possible variables should be employed for the tsunami trip generation model to improve the explanatory power of the model (i.e. evacuation training, multimedia for warnings, and neighbor’s response). Furthermore, the actual behavior study of evacuees should be conducted during the next emergency evacuation in order to verify the existing evacuation model.
Regarding the results of the research, there were many factors that were included as independent variables because they were found to be statistically significant. But there were only education and disaster knowledge, which disaster and transportation experts can support for ongoing preparation efforts such as disaster knowledge, evacuation training, and evacuation guidelines. In emer-gency situations, it is important that people be familiar with the location of all evacuation exits, evacuation routes and knowledgeable about their operation. If not, additional injuries or fatalities could occur in an emer-gency. In order to avoid such situations in the future, it is important to provide emergency evacuation training to both people and emergency stakeholders in order to re-duce the impact of disasters upon communities. Resi-dents and members of the local communities are being educated and made aware of the potential dangers of nat-ural disasters so they are well-prepared and know how to respond to warnings through a series of disaster response drills. Because people can rapidly move from risk areas to safer areas, this is the concept of emergency transpor-tation.
Further research of transportation disaster response needs to be sufficiently integrated into the transportation engineering components in the evacuation planning. These include the full spectrum of activities including: evacuation transportation management and policy, evacu-ation planning and travel/behavioral analysis and fore-casting, the planning and design of transportation infrastructure for evacuation; the analysis and modeling of evacuation transportation operations; evacuation traf-fic control and enforcement; the development, implemen-tation and operation of intelligent transportation system (ITS) data acquisition and communication systems; and
TRANSPORTATION
96 IATSS RESEARCH Vol.30 No.2, 2006
the use of mass-transit and other means for the move-ment of low-mobility individuals.
REFERENCES1. Pal A., Graettinger A. J., Triche M. H. Emergency Evacuation
Modeling Based On Geographical Information System Data. Proceedings of 82nd Annual Meeting of TRB. (CD-ROM), Washington, D.C. (2003).
2. Levinson J., Granot H. Transportation Disaster Response Handbook. ACADEMIC PRESS, An Elsevier Science Imprint. (2002).
3. Lewis D.C. Transportation Planning for Hurricane Evacuations. “ITE Journal” August, 31 -35. (1985).
4. Sorensen J. H., Vogt B. M., Mileti D. S. Evacuation: An As-sessment of Planning and Research. Publication ORNL-6376 Oak Ridge National Laboratory (ORNL), Oak Ridge, U.S.A. (1987).
5. Drabek T.E. Disaster Evacuation and the Tourist Industry. Institute of Behavioral Science, University of Colorado. USA. (1994).
6. Fu H., Wilmot C.G. Sequential Logit Dynamic Travel Demand Model for Hurricane Evacuation. “Transportation Research Record” 1882: pp.19-26. (2004).
7. Wilmot C.G., Mei B. Comparison of Alternative Trip Generation Models for Hurricane Evacuation. “Natural Hazards Review” 5(4): pp.170-178. (2004).
8. Murray-Tuite P. M., Mahmassani H. S. Transportation Network Evacuation Planning with Household Activity Interactions. “Transportation Research Record” 1894: pp.150-159. (2004).
9. Southworth F. Regional Evacuation Modeling: A State of the Art Review. Publication ORNL/TM-11740 Oak Ridge Na-tional Laboratory (ORNL), Oak Ridge, U.S.A. (1991).
10. Baker E.J. Hurricane Evacuation Behavior. “International Journal of Mass Emergencies and Disasters” 9(2): pp.287-310. (1991).
11. Barrett B., Ran B., Pillai R. Developing a Dynamic Traffic Management Modeling Framework for Hurricane Evacuation. “Transportation Research Record” 1733: pp.115-121. (2000).
12. Sattayhatewa, P. and Ran, B. Developing a Dynamic Traffic Management Model for Nuclear Power Plane Evacuation. “Proceedings of 79th Annual Meeting of TRB. (CD-ROM)”, Washington, D.C. (2000).
13. Whitehead J. C., Edwards B., Willigen M. V., Maiolo J. R., Wilson K., Smith K. T. Heading for Higher Ground: Factors Affecting Real and Hypothetical Hurricane Evacuation Be-havior. Publication ECU-0006. Department of Economics, East Carolina University, Greenville. (2000).
14. Franzese O., Han, L.D. Traffic Modeling Framework for Hur-ricane Evacuation. “Proceedings of 80th Annual Meeting of TRB (CD-ROM)”, Washington, D.C. (2001).
15. Alsnih R., Stopher P.R. A Review of the Procedures Associ-ated with Devising Emergency Evacuation Plans. “Transpor-tation Research Record”1865: pp.89-97. (2004).
16. Lindell M.K., Lu J.C., Prater C.S. Household Decision Making and Evacuation in Response to Hurricane Lili. “Natural Haz-ards Review” 6(4): pp.171-179. (2005).
17. Lander J. F., Whiteside L. S., Lockridge P. A. Two Decades of
Global Tsunamis 1882-2002. “Science of Tsunami Hazards” 21(1): pp.3-38. (2003).
18. WCATWC National Oceanic and Atmospheric Administration: Indian Ocean Tsunami of 26 December, 2004. West Coast/Alaska Tsunami Warning Center Homepage. <http://wcatwc.arh.noaa.gov/IndianOSite/IndianO12-26-04.htm.> (2005).
19. Weber G.H.J. “THE ANDAMAN ASSOCIATION”, Liestal, Switzerland. <http://www.andaman.org/mapstsunami/tsuna-mi.htm.> (2005).
20. Keating B. H., Helsley C. 2004 Indian Ocean Tsunami on the Maldives Islands: Initial Observations. “Science of Tsunami Hazards” 23(2): pp.19-70. (2005).
21. NESAC Documentation of the Tsunami: Effect and prevention for Thailand report. Publication NESAC-05. National Eco-nomic and Social Advisory Council, Thailand. (2005).
22. ITWC. ITSU Master Plan. International Tsunami Warning Center Homepage. <http://www.prh.noaa.gov/itic/more_about/itsu/master_plan_html/> (2005).
23. Alovisi J., Hassam N., Logan D., Milligan A. Tsunami: Indian Ocean Event and Investigation into Potential Global Risks. Guy Carpenter & Company, Inc. (2005).
24. CODI. Documentation of the Tsunami and Baan Naam khem situation. Community Organizations Development Institute (Public Organization), Thailand. (2005).
25. Hosmer D.W. Jr., Lemeshow S. Applied Logistic Regression. John Wiley & Sons. (2000).
26. Johnson R.A., Bhattacharyya G. K. Statistics: Principles and Methods. John Wiley & Sons. (2001).
27. Vanichbuncha K. Multivariate analysis: SPSS for Windows. Chulalongkorn university press, Thailand. (2000).
ACKNOWLEDGEMENTSProfessor Yordphol Tanaboriboon passed away after we
finished this paper. Consequently, I wish to express my deepest gratitude and appreciation to my adviser, Prof. Yordphol, for his incessant and patient guidance in carrying out this research. He has given me the power of knowledge, for which I am forever grateful. May his soul rest in peace, he will always be in my heart.