tryg strengthening the core, while embracing the future cmd presentation, tryg.com_12... · tryg...
TRANSCRIPT

Tryg – Strengthening the Core, while Embracing the Future
Capital Markets Day
London, 20 November 2017

2
Agenda
09:30-11:30 Targets and initiatives
• Follow-up on CMD targets and initiatives 2015 – 2017 3
• Targets and initiatives 2018 – 2020 9
Tryg – Strengthening the Core, while Embracing the Future 11
• Claims Excellence 14
• Digital Empowerment of Customers 19
• Product & Service Innovation 24
• Distribution Efficiency 29
Balance sheet optimisation 36
Concluding remarks 41
Capital Markets Day 2017
Front page slide
Follow-up on CMD targets and initiatives 2015 - 2017

4
Tryg 2015 – 2017: Aiming for world classEarn
ing
s
Customers
Target picture 2015 - 2017: Simultaneously providing world class earnings and customer experiences
• Utilising the mutual benefits of a cost effective operation
and customer experiences that strengthen loyalty
Target drivers 2015 - 2017
Next Level
Pricing
Leading in
Efficiency
Customer
Care worth
Recommending
Low Risk,
High Return
1 2
3 4
Capital Markets Day 2017

Delivering on 2017 targets
5
Category Key Performance Indicators Targets 2017 Q1-Q3 2017 Comments
Combined ratio ≤ 87 83.8 Delivered as promised
Expense ratio ≤ 14 14.1 Delivered as promised
Return on equity ≥ 21% 30.9% Delivered as promised
Efficiency programme DKK 750m DKK 633m On schedule
Net Promoter Score +100% (22) 22 Delivered as promised
Retention rate +1pp (88.9) 87.8Delivered in DK,
not in NO
≥3 products +5pp (61.3) 58.9Delivered in DK,
not in NO
Targets presented on Capital Markets Day, 5 November 2014
Earnings
Customers
( )
( )
Capital Markets Day 2017

89.890.7
88.8 88.6
80.0
85.0
90.0
95.0
2014 2015 2016 Q1-Q3 2017
92.0
83.5
90.787.2
70.0
75.0
80.0
85.0
90.0
95.0
2014 2015 2016 Q1-Q3 2017
Solid performance across all core businesses
Combined ratio - Private (DK & NO) Combined ratio - Commercial (DK & NO)
Combined ratio - Corporate Combined ratio - Sweden (Private)
49% of premium
23% of premium
21% of premium
7% of premium
6
82.5
85.483.8
82.2
70.0
75.0
80.0
85.0
90.0
2014 2015 2016 Q1-Q3 2017
79.4
83.682.1 81.6
70.0
75.0
80.0
85.0
90.0
2014 2015 2016 Q1-Q3 2017
Capital Markets Day 2017

0%5%
10%15%20%25%30%
2013 Q1-Q3 2017
75%
80%
85%
90%
95%
100%
2013 Q1-Q3 2017
World class achieved on earnings
7
Combined ratio: Strong Nordic performance Expense ratio: Best in class
International peers Nordic peers International peers Nordic peers
Likewise a strong performance on ROE – benchmark top 3 Nordic players
Return on equity (Q1-Q3 2017)
22.4%30.9% 24.6%35% 20%
Capital Markets Day 2017

Number of products drives value
8
Customer targets put into perspective (case: Private Denmark)
Net Promoter Score (NPS) Avg. customer lifetime (years) Lifetime value following number of products
• A ≥3 product engagement renders a
value increase of 12.9X
4.8
8.3
13.8
1 product 2 products ≥3 products
• A ≥3 product engagement increases
avg. customer lifetime by ~3X
1421
45
1 product 2 products ≥3 products
• A ≥3 product engagement correlates to
a 3X satisfaction score
Capital Markets Day 2017
1.03.7
12.9
1 product 2 products ≥3 products

Targets and initiatives 2018-2020

Introducing a new guiding purpose for Tryg
10
Purpose
Clarity, unity, differentiation = Value creation
“Tryg(hed)”
Feeling protected and cared for
”As the world changes, we make it easier to be tryg”
Grasping opportunities to develop
rather than defend our business i.e.:
• Digitalisation
• New products
• Analytics
Adjusting to customer
preferences and needs i.e.:
• Self-service
• Straight through processes
• Packaging of products
Staying relevant to maximise
share of wallet i.e.:
• Product innovation
• Prevention
• Add-on services
Capital Markets Day 2017
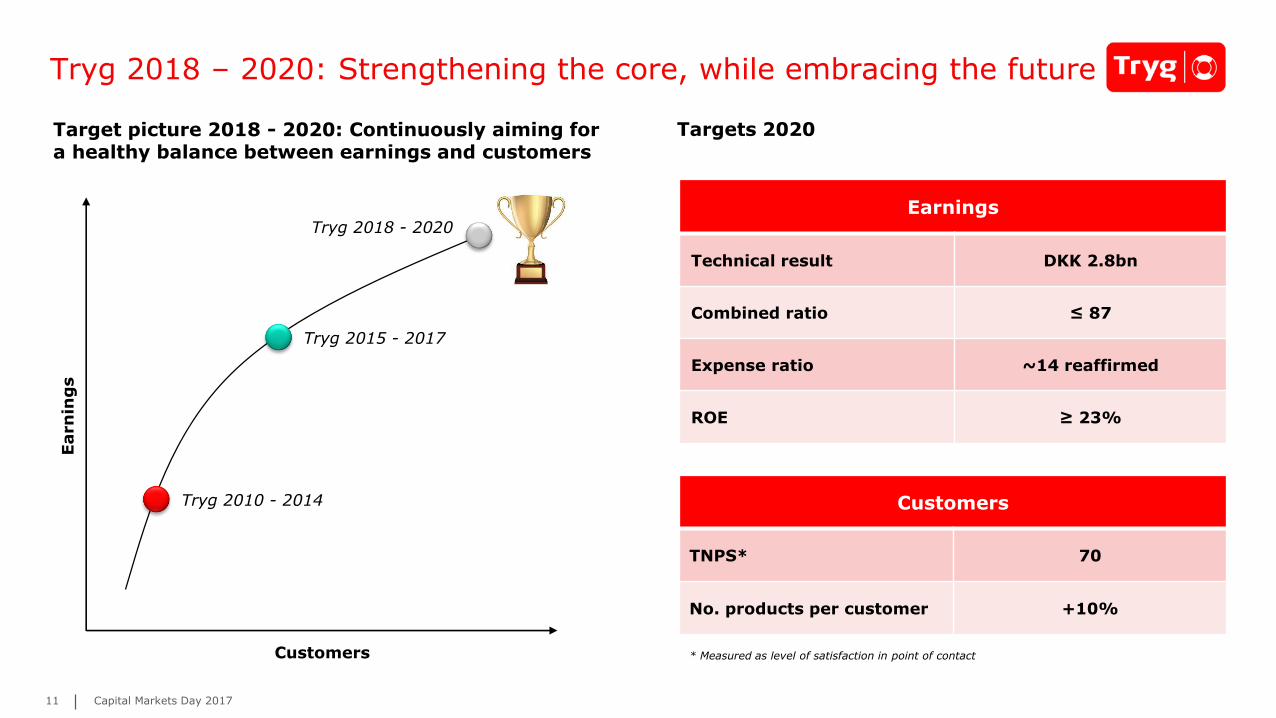
Tryg 2018 – 2020: Strengthening the core, while embracing the future
11
Targets 2020
Earnings
Technical result DKK 2.8bn
Combined ratio ≤ 87
Expense ratio ~14 reaffirmed
ROE ≥ 23%
Customers
TNPS* 70
No. products per customer +10%
Earn
ing
s
Customers
Target picture 2018 - 2020: Continuously aiming for a healthy balance between earnings and customers
Tryg 2010 - 2014
Tryg 2015 - 2017
Tryg 2018 - 2020
* Measured as level of satisfaction in point of contact
Capital Markets Day 2017

2.4
1.7
0.5
1.6
2.5 2.52.8*
2.4 2.42.8
-
0.5
1.0
1.5
2.0
2.5
3.0
2008 2009 2010 2011 2012 2013 2014 2015 2016 2020
Run-off Technical result before run-off
4.7%3.9%
4.4% 4.7% 5.0% 5.0%
6.1%6.7% 7.0%
5.6%
0%
2%
4%
6%
8%
2008 2009 2010 2011 2012 2013 2014 2015 2016 Q3 2017
Targeting the highest technical result before run-off ever
12
Technical result: Historical performance vs. 2020 target
• Highest technical result
before run-off ever!
Run-off levels will return to normal with a 3 - 5% run-off level in most years going forward
3-5% range 6-7% range
• Current strategy period
run-off level of 6-7%
• Next strategy period
elevated run-off level
gradually reducing
• Expected 2020 run-off
to be in range 3-5%
2008-2016 average technical result before run-off
*DKK 2.8bn adjusted for one-off relating to the Norwegian pension scheme andthe change of IT suppliers
Capital Markets Day 2017
DKKbn
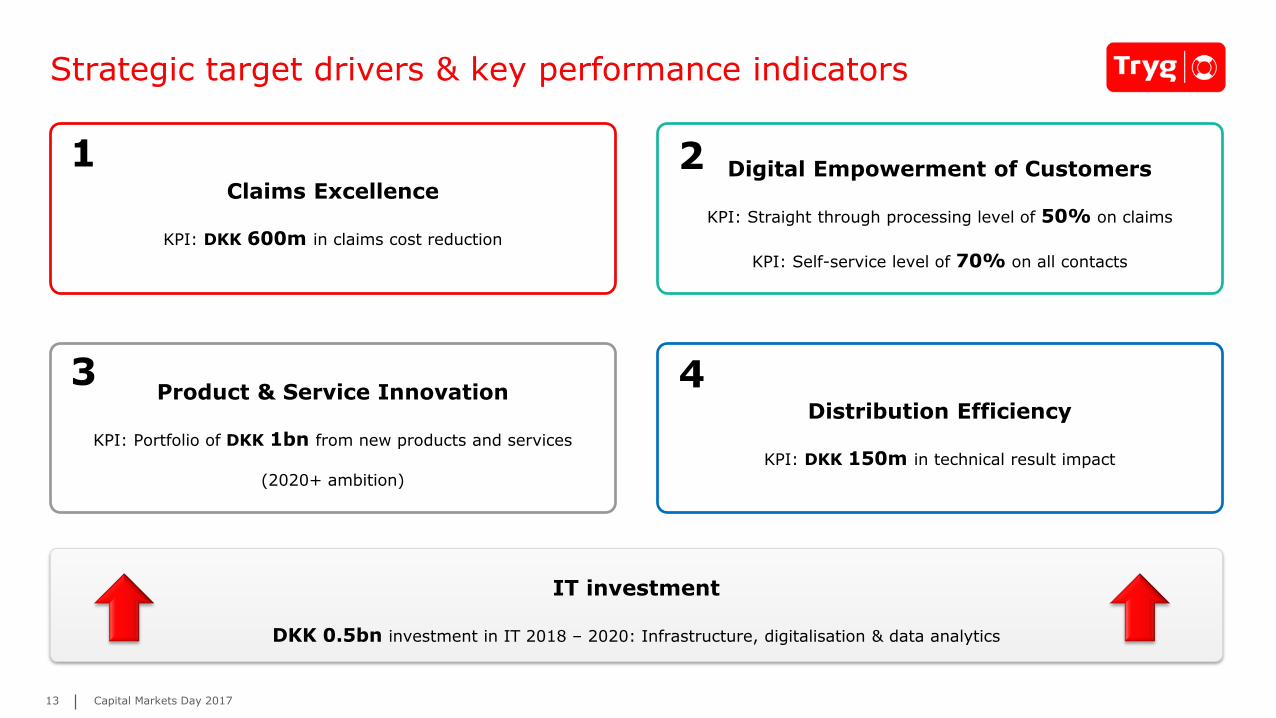
Strategic target drivers & key performance indicators
13
Claims Excellence
KPI: DKK 600m in claims cost reduction
Digital Empowerment of Customers
KPI: Straight through processing level of 50% on claims
KPI: Self-service level of 70% on all contacts
Product & Service Innovation
KPI: Portfolio of DKK 1bn from new products and services
(2020+ ambition)
Distribution Efficiency
KPI: DKK 150m in technical result impact
1 2
3 4
IT investment
DKK 0.5bn investment in IT 2018 – 2020: Infrastructure, digitalisation & data analytics
Capital Markets Day 2017

Front page slide
Strategic Theme: Claims Excellence

11,001
11,730
6.6%
0%
2%
4%
6%
8%
10%
10,500
10,750
11,000
11,250
11,500
11,750
12,000
01.14 07.14 01.15 07.15 01.16 07.16 01.17 07.17
Tryg Others Scale advantage (right axis)
-
5
10
15
20
25
2011 2016
Bumper Bumper incl. radar
Why is claims excellence important?
15
Targets the bulk of our cost (Q1-Q3 2017)
69.7% 14.1%
Claims ratio (2016 gross claims = DKK 11.6bn) Expense ratio
A bulwark against claims inflation jumps
Bumper prices 2011 – 2016, Ford Focus (DKK 1,000m)
Utilises scale
Avg. claim cost car – Tryg vs. others
+242%
+15%
Capital Markets Day 2017
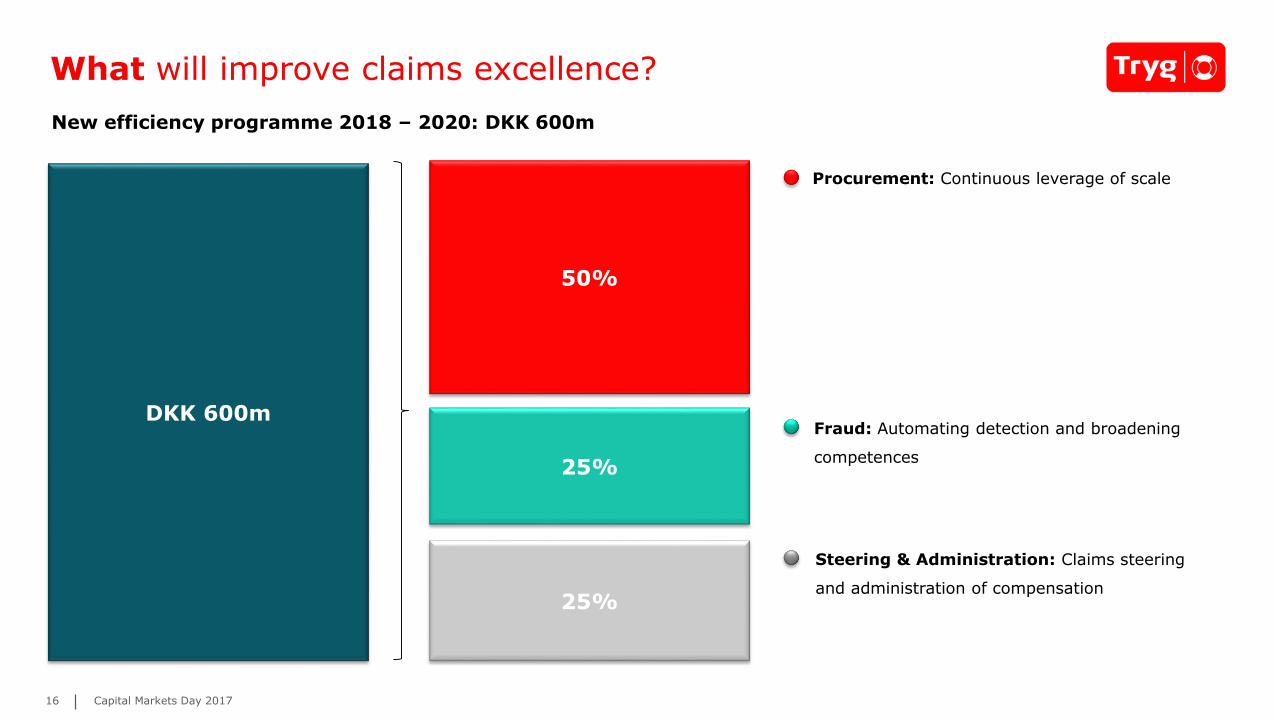
16
DKK 600m
25%
25%
What will improve claims excellence?
New efficiency programme 2018 – 2020: DKK 600m
50%
Procurement: Continuous leverage of scale
Fraud: Automating detection and broadening
competences
Steering & Administration: Claims steering
and administration of compensation
Capital Markets Day 2017
700
1,200 500
2012 - 2014 2015 - 2017 Total
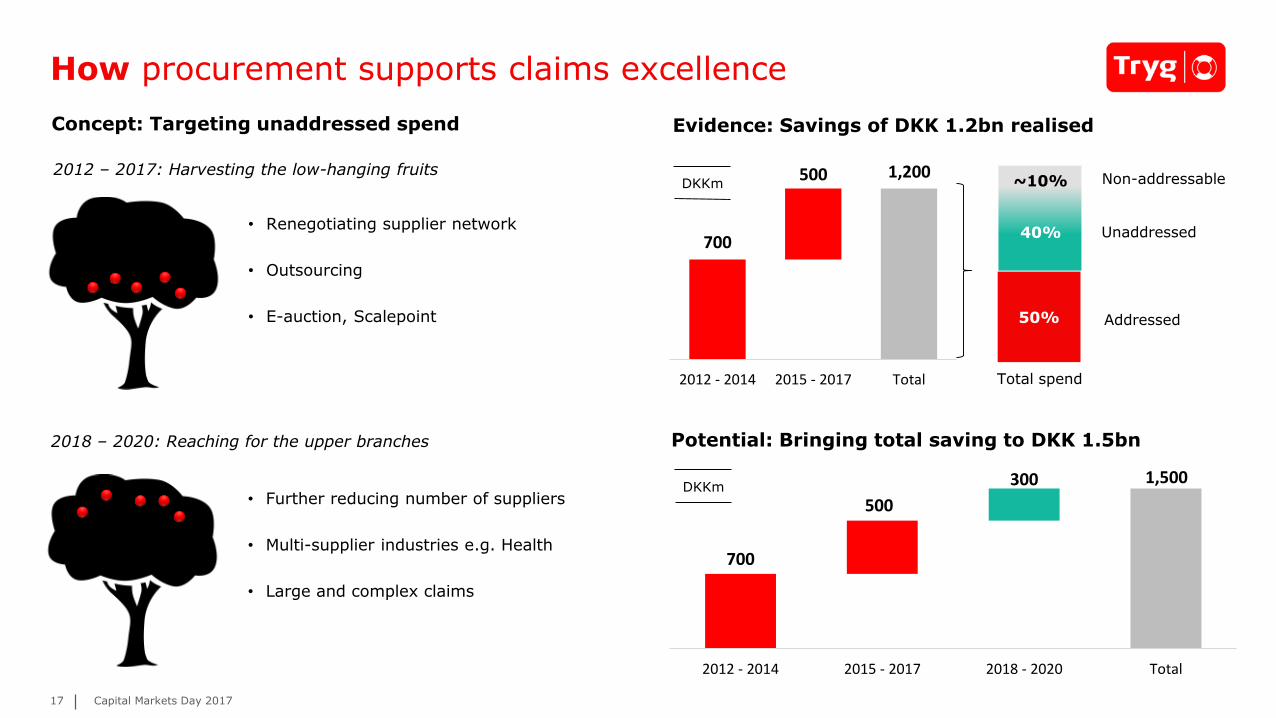
How procurement supports claims excellence
17
Concept: Targeting unaddressed spend Evidence: Savings of DKK 1.2bn realised
50%
50%
40% Unaddressed
Addressed
Non-addressable~10%2012 – 2017: Harvesting the low-hanging fruits
2018 – 2020: Reaching for the upper branches
• Further reducing number of suppliers
• Multi-supplier industries e.g. Health
• Large and complex claims
• Renegotiating supplier network
• Outsourcing
• E-auction, Scalepoint
Potential: Bringing total saving to DKK 1.5bn
Total spend
DKKm
700
1,500
500
300
2012 - 2014 2015 - 2017 2018 - 2020 Total
DKKm
Capital Markets Day 2017

1.5%
2.7%
2017 2018 2019 2020
15
50
2017 2018 2019 2020
How fraud and claims steering supports claims excellence
18
Fraud
Only ~20% of claims employees excel in fraud detection
Potential: Targeted 2020 detection level
Concept: Broadening competences and introducing automation
Claims steering
Evidence: Employees generated improvement in fraud detection
Concept: Better steering of claims to Tryg partners for lower cost
Evidence: Improved steering of car glass claims
Potential: Targeted 2020 cost reductions
DKKm
DKK 300m; ∆ DKK 150m
Tryg
partner
Local
workshop
Repair 60%
of claims
Repair 18%
of claims
40%
cheaper!
2017:
DKK -5m
Claim
1.0%1.5%
Tryg 2014 Tryg 2017
Capital Markets Day 2017

Front page slide
Strategic Theme: Digital Empowerment of Customers

Why digital customer empowerment?
20
Logins My Page /
My Company +34%
Growing interest in, and use of Tryg’s digital solutions
Online claims
+36%
Digital contact
~70% in 20200%
20%
40%60%80%
2016 2017 2018 2019 2020
Manual Digital
Tipping point
Capital Markets Day 2017
Customers increasingly request…
Convenience
Transparency
Empowerment
0%
10%
20%
30%
40%
Jan. Feb. Mar. Apr. May Jun. Jul. Aug. Sep.
Claims notified online 2016 Claims notified online 2017
0
500
1,000
1,500
Jan. Feb. Mar. Apr. May Jun. Jul. Aug. Sep.
No. of logins 2016 No. of logins 2017

What are we doing to empower our customers?
21
Tryg’s digital journey Digital targets 2020
50% Straight Through Processing
on claims
70% Self-service level
on all contacts
Time
Digitalisation
2018 – 2020
2015 – 2017
2000 – 2014
• Search online
• Quotes online
• Buy online
• File claim online
• Digital customers = ~80%
• Straight Through Processing
• Automation / Robotics
• Self-service
Total benefit 2020 =
~DKK 100m
Capital Markets Day 2017

80%
20%
20%
80%
No. of claims Claims handling cost
Low complexity claims High complexity claims
How to work with straight through processing
22
Concept: STP if simple, automation if complex
~850k DKK 1.4bn
Distribution of claims (number) and claims handling cost
Evidence: STP - Travel, NO (low complexity) Potential: STP = 50% / ~DKK 70m by 2020
Evidence: Automation – Private Car, DK (high complexity)
65%
Total automation = 34%
Notification Coverage Estimate Payout Closing Recourse
80%80%27%0%30%
= Automation level
2%
9%
22%
0%
10%
20%
30%
Q1 2017 Q2 2017 Q3 2017
50% notification 22% STP
3 sec. handling time
~10%
50%
2017 2018 2019 2020
Low complexity High complexity
2020:
Foundation build
for harvesting
next generation
potential
Capital Markets Day 2017

ClaimsService
200
400
600
800
1,000
1,200
1,400
1,600
1,800
No. of logins Oct. 2016 YTD (1,000) No. of logins Oct. 2017 YTD (1,000)
45%
70%
2017 2018 2019 2020
How to work with self-service
23
Evidence: My Page / My CompanyConcept: Empowerment & fewer non-value contacts
Number of incoming contacts
Non-value adding contacts e.g. status on claim
~70%
~30%
Value adding contacts e.g. claims notification
Empowerment across functionalities
Sales
• All products • Change mileage
• Adjust own risk
• …
Potential: Self-service = 70% / ~DKK 30m by 2020
+34%
• Track ‘n Trace
• Web notification
• …
Capital Markets Day 2017

Strategic Theme: Product & Service Innovation

1,055
1,856
98
502
-
500
1,000
1,500
2,000
2008 2009 2010 2011 2012 2013 2014 2015 2016
Number of insurees - DK (1,000) Number of insurees - NO (1,000)
Why is product and service innovation important?
25
Transformation of traditional risk pools …and emergence of new ones
• Drivers: Safety, loss prevention, technology
• Further impact from technology in the long-term e.g.:
o Car: Assisted driving
o Home/Contents: IOT devices like intelligent alarms
Example: Health insurance market DK & NO 2008 - 2016Denmark: Premium development 2007 – 2016 (index: 2008)*
Tryg: Avg. claims ratio on Health 2014 - 2016
* Source: F&P (incl. Workers’ Comp., Car, House/Contents, Accident) Source: F&P ; FNO.no
77%71%
Health - Tryg DK Health - Tryg NO
110%
90%
0%
20%
40%
60%
80%
100%
120%
140%
2008 2009 2010 2011 2012 2013 2014 2015 2016
Premium Premium ex. price increases (2.5% p.a.)
Capital Markets Day 2017

70
1,000
2017 2018 2019 2020 2020+
People Technology Tryg Garanti Other
26
What will boost product and service innovation?
Expanding existing business Development of new products Add-on services
Child PaYG Health +55
Sharing Eco.PetID theft
Product Service
Strong traction in new growth products (index = 2014) Target 2020+: DKK 1bn in new products & services
117 113
176
People (DKK 2,000m) Electronics (DKK 550m) Pets (DKK 125m)
Capital Markets Day 2017

How to expand existing business
27
Concept: Expanding Tryg Garanti’s market
• Offers surety contracts and trade credit insurance with very
strong performance ratios (Q1-Q3 2017):
Evidence: Cost ratio benchmark (2015)
Net Promoter
Score
63Expense
ratio
6.5 61Combined
ratio
Financial crisis
Potential: Topline growth of 20% in 2020 (CAGR)
-100
0
100
200
300
400
500
600
2005 2007 2009 2011 2013 2015 2016 2017F T2018 T2019 T2020
Premium (DKKm) Tech. result (DKKm)
NO SE FI Trade
Evidence: Market characteristics - Germany
• Expense ratio 30
• Claims ratio 43
• Average price twice as high vs. Nordics
• Banks to face increasing capital requirements
GER
Capital Markets Day 2017
0%5%
10%15%20%25%30%35%

650
8,500
16,000
23,000
26,500
Oct. 16 Jan. 17 Apr. 17 Jul. 17 Sep. 17
50 200
1,0001,400
4,000
Dec. 16 Jan. 17 Apr. 17 Jul. 17 Oct. 17
28
Child insurance – Private DK SME cyber insurance, DK
How to add new products and services
Concept: Cyber product in coop. with numerous domain experts
Evidence: number of policies sold since launch (SME, DK)
Only 5% of the portfolio
Potential: Targeted portfolio of DKK 100m in 2020 (Nordic)
Concept: Child insurance packages (Minimum, Basic, Super)
Evidence: number of policies sold since launch
Potential: Targeted portfolio of DKK 26m in 2020
Only 15% of portfolio with new child product
23
100
2
2017 2018 2019 2020
Premium (DKKm) Technical result (DKKm)
Claims ratio Oct. 2017 YTD: 62%
Capital Markets Day 2017
13
26
3
2017 2018 2019 2020
Premium (DKKm) Technical result (DKKm)

Strategic Theme: Distribution Efficiency

&
Why is distribution efficiency important?
30
Need for improving both cost and saleConstitute half of total cost
Distribution cost as a % of total cost:
Distribution cost improved the least since 2012
70%
80%
90%
100%
110%
2012 2013 2014 2015 2016
Claims & admin. cost Distribution cost
Index = 2012
A continuation of previous efforts
‘95 – ‘10 ‘10 – ‘17 ‘18 – ‘20
• 120 8 shops • Overhead cost
• Segmentation
• Leaner processes
• Leveraging tech.
• Simpler products
• New channels
… and more sale
~50%~50%Distribution cost
Claims & admin. cost
Lower cost
Capital Markets Day 2017

31
What will increase distribution efficiency?
Focus areas Levers (examples) Target 2020
Efficiency through
technology
Product
simplification
Exploring new
channels
DKK 150m in technical result impact
150
• Digital integration to partners
• Analytics
• Packaging
• Pay as you go
• Integrating claims and sales
• Online
Capital Markets Day 2017
46%
63%
2016 2017
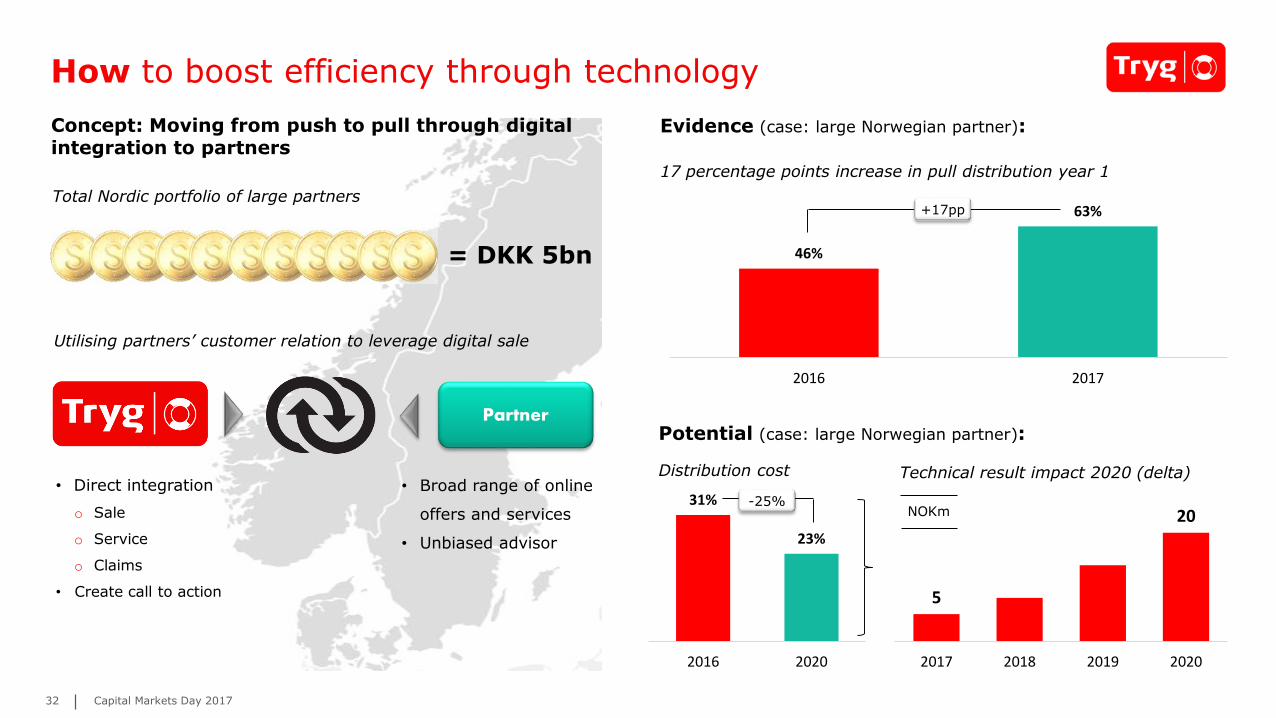
32
How to boost efficiency through technology
Concept: Moving from push to pull through digital integration to partners
Evidence (case: large Norwegian partner):
17 percentage points increase in pull distribution year 1
+17pp
Potential (case: large Norwegian partner):
Distribution cost
Utilising partners’ customer relation to leverage digital sale
31%
23%
2016 2020
-25%
Technical result impact 2020 (delta)
Total Nordic portfolio of large partners
= DKK 5bn
5
20
2017 2018 2019 2020
NOKm
Partner
• Direct integration
o Sale
o Service
o Claims
• Create call to action
• Broad range of online
offers and services
• Unbiased advisor
Capital Markets Day 2017

5
2028%
10%
0%
5%
10%
15%
20%
25%
30%
35%
40%
0
5
10
15
20
25
30
2017 2018 2019 2020
Direct cost per sale 2016 (%) Direct cost per sale 2017 - Claims/Sales
5
30
28%
18%
0%
10%
20%
30%
40%
50%
0
5
10
15
20
25
30
35
40
45
2017 2018 2019 2020
Direct cost per sale 2016 (%) Direct cost per sale 2017 post package launch (%)
22%
35%
50%
Previously: PureOutbound sales
Claims/SaleIntegration
Claims/Sale Integration- Best performers
3.7
1.4 1.3
4.1
1.5 1.6
Tied agents Inbound Outbound
Avg. no. of products sold - before Avg. no. of products sold - after
33
How to simplify products and explore new channels
Concept: Packaging of products
Evidence: Increase in avg. number of products sold
Concept: Sales & low complexity claims handling
Evidence: Win-rates improved 13pp on average
Potential: Technical result impact 2020 (delta) Potential: Technical result impact 2020 (delta)
11%
7% 23%
DKKm DKKm
Capital Markets Day 2017

Financial impact of strategic initiatives

35
Normalisedtechnical result 2017
Lower run-off Investment ClaimsExcellence
Digital Empower.of Customers
Growth and Product& Service Innovation
DistributionEfficiency
Technical result 2020
Total financial impact of strategic initiatives
* Normalised assumptions for weather claims and large claims
DKK 2,800m
Capital Markets Day 2017

Balance sheet optimisation

37
Sustained focus on shareholder return
• Maintain ordinary dividend policy: Nominal stable growing dividend
• ROE target increased from 21% to 23%
• Extraordinary dividend to adjust capital structure
Extraordinary dividends of DKK 1bn
(to be paid after AGM 2018)
Historical shareholder remuneration
5.2 5.4 5.8 6.0 6.24.8
2.6 3.2 3.4 3.5 3.5 3.6
2012 2013 2014 2015 2016 2017
Ordinary dividend Extraordinary buy back
Expected ordinary dividend Extraordinary dividend
7.88.6 9.2 9.5 9.7
9M
Shareholder return & balance sheet optimisation
Capital Markets Day 2017
• New dividend policy
• Reduced investment volatility
• Side-way reinsurance cover
• SII and partial internal model
• Increased subordinated debt
• Quarterly dividend
• SCR improvement
• Potential Tier 1 issue
• IT investment
2012 - 2014
2015 - 2017
2018 - 2020
Balance sheet optimisation remains core

38
SCR reduction, potential Tier 1 issue & IT investment
SCR reduction through model improvements
• SCR using partial internal model. Further optimisation = ~ -10%
• Workers’ Comp. DK approval = ~ DKK -100m (all else equal)
• Further work to be done on Sweden and other parts of the model
Potential Tier 1 issue
• Outstanding Tier 1 capacity of approximately DKK 1.1bn
• Potential Tier 1 issue H1 2018 subject to market conditions,
amount likely to be ~ DKK 500m to retain some financial
flexibility
• Increased IT spend impact P&L within 14% expense ratio,
DKK 0.5bn impact balance sheet.
• IT investment support:
• IT infrastructure upgrade
• Channel digitalisation
• Fraud detection
IT investment supporting 2020 targets
• Analytics
• New products & services
Reducing
long-term
operating cost
Enhanced
retention
and sales
Better
customer
experience
Capital Markets Day 2017

39
4,845 4,345
10,241 9,241
+0.5 -1.0+0.5 -0.5
Solvency ratioQ3 2017
SCR reduction of upto DKK 0.5bn
Extraordinary dividendof DKK 1.0bn
New Tier 1 issue ofDKK 0.5bn
IT investments ofDKK 0.5bn
Proforma solvency ratioQ3 2017
SCR Own funds
Pro-forma solvency ratio of 213 supports further shareholder returns
211% 213%
Capital Markets Day 2017

40
Portfolio rebalancing and M&A
PropertyCorp.
Private Cars
Health & Accident
Child Liability
Private Content
Property Comm.
Comm. Cars
House
Workers’ Comp.
• Portfolio optimisation across businesses, segments and products
• Constantly seeking to allocate capital for highest returns
Solvency ratio improvement via portfolio rebalancing
- Portfolio overview as of Q3 2017
Bubble size = Premium
Low High
Low
High
Combined ratio
Retu
rn
on
eq
uit
y
Continuously considering M&A opportunities
Long history of M&A
Strict criteria for value creating M&A
1999
2002 (DK+NO)
2009
2014 (Agriculture)
2014
2014
2015
2017
2017
Value creative
Potential synergies
Strategically supportive
Product / distribution enhancing
Capital Markets Day 2017

Concluding remarks

Delivering on 2017 targets
42
Category Key Performance Indicators Targets 2017 Q1-Q3 2017 Comments
Combined ratio ≤ 87 83.8 Delivered as promised
Expense ratio ≤ 14 14.1 Delivered as promised
Return on equity ≥ 21% 30.9% Delivered as promised
Efficiency programme DKK 750m DKK 633m On schedule
Net Promoter Score +100% (22) 22 Delivered as promised
Retention rate +1pp (88.9) 87.8Delivered in DK,
Not in NO
≥3 products +5pp (61.3) 58.9Delivered in DK,
not in NO
Targets presented on Capital Markets Day, 5 November 2014
Earnings
Customers
( )
( )
Capital Markets Day 2017

Tryg’s equity story – a leading Scandinavian non-life insurer
43
Claims Excellence
DKK 600m in claims
cost reduction
Digital Empowerment
of Customers
STP on claims: 50%
Self-service: 70%
Tryg 2018 – 2020:
Strengthening the core, while embracing the futureProduct & Service
Innovation
+DKK 1bn in new
products by 2020+
Distribution Efficiency
DKK 150m in technical
result impact
Financial targets 2020
• Technical result: DKK 2.8bn
• Combined ratio: ≤87
• Expense ratio: ~14
• ROE: ≥23%
Customer targets 2020
• TNPS: 70
• Number of products per customer: +10%
Dividend policy
• Targeting a nominal stable increasing dividend
• Extraordinary dividend to further adjust the capital structure
Long term profitable growth and attractive shareholder value creation
Capital Markets Day 2017

1%
2%
3%
82%84%86%88%90%
Tryg If Gjensidige
Tryg: A dividend stock
44
Tryg’s historical yield 2013 – 2016
- Continuous and attractive shareholder remuneration
Benchmark of combined ratio vs. volatility
- Leading combination of CR and volatility
• Nominally stable and increasing ordinary dividend
• Potential extraordinary dividend to further adjust the capital
structure
“Do you know the only thing that gives me
pleasure? It’s to see my dividend coming in”.
- John D. Rockefeller
Avg. combined ratio 2012 – Q1-Q3 2017
Sta
ndard
devia
tion
tech. re
sult
8.3%
6.6% 6.9%7.6%
-1%
1%
3%
5%
7%
9%
2013 2014 2015 2016
Total yield (dividend incl. buy back/market-cap)
Capital Markets Day 2017