trv - european securities and markets authority · esma report on trends, risks and vulnerabilities...
TRANSCRIPT

TRV
ESMA Report on Trends, Risks and Vulnerabilities No. 1, 2016
17 March 2016|ESMA/2016/348

ESMA Report on Trends, Risks and Vulnerabilities No. 1, 2016 2
ESMA Report on Trends, Risks and Vulnerabilities No. 1, 2016
© European Securities and Markets Authority, Paris, 2016. All rights reserved. Brief excerpts may be reproduced or translated provided the source is cited adequately. The reporting period of this Report is 01 July 2015 to 31 December 2015, unless indicated otherwise. The reporting quarter of the Risk Dashboard in the Risk Section is 4Q15. Legal reference of this Report: Regulation (EU) No 1095/2010 of the European Parliament and of the Council of 24 November 2010 establishing a European Supervisory Authority (European Securities and Markets Authority), amending Decision No 716/2009/EC and repealing Commission Decision 2009/77/EC, Article 32 “Assessment of market developments”, 1. “The Authority shall monitor and assess market developments in the area of its competence and, where necessary, inform the European Supervisory Authority (European Banking Authority), and the European Supervisory Authority (European Insurance and Occupational Pensions Authority), the ESRB and the European Parliament, the Council and the Commission about the relevant micro-prudential trends, potential risks and vulnerabilities. The Authority shall include in its assessments an economic analysis of the markets in which financial market participants operate, and an assessment of the impact of potential market developments on such financial market participants.” The charts and analyses in this report are, fully or in parts, based on data not proprietary to ESMA, including from commercial data providers and public authorities. ESMA uses these data in good faith and does not take responsibility for their accuracy or completeness. ESMA is committed to constantly improving its data sources and reserves the right to alter data sources at any time. The third-party data used in this publication may be subject to provider-specific disclaimers, especially regarding its ownership, its reuse by non-customers and, in particular, the accuracy, completeness or timeliness of the data provided and the provider’s liability related to those. Please consult the websites of the individual data providers, whose names are detailed throughout this report, for more details on these disclaimers.
European Securities and Markets Authority (ESMA) Risk Analysis and Economics Department 103, Rue de Grenelle FR–75007 Paris [email protected]

ESMA Report on Trends, Risks and Vulnerabilities No. 1, 2016 3
Table of contents Executive summary 4
Trends 6
Market environment 7
Securities markets 9
Investors 16
Infrastructures and services 22
Risks 26
ESMA Risk Dashboard 27
Securities markets 30
Investors 33
Infrastructures and services 34
Vulnerabilities 35
Investor protection 36
MREL/TLAC requirements 36
Financial Innovation: Risk and benefit assessment 42
Orderly markets 47
The central clearing landscape in the EU 47
Financial stability 53
Collateral scarcity premia in EU repo markets 53
Annexes 59
Statistics 60
Securities markets 60
Investors 73
Infrastructures and services 79
List of abbreviations 82

ESMA Report on Trends, Risks and Vulnerabilities No. 1, 2016 4
Executive summary Trends and risks
ESMA risk assessment
Risk segments Risk categories Risk sources
Risk Risk Change Outlook
Change
Overall ESMA remit
Liquidity
Macroeconomic environment
Systemic stress
Market
Low interest rate environment
Securities markets
Contagion
EU sovereign debt markets
Investors
Credit
Funding patterns
Infrastructures and services
Operational
Market functioning Note: Assessment of main risks by risk segments for markets under ESMA remit since last assessment, and outlook for forthcoming quarter. Assessment of main risks by risk categories and sources for markets under ESMA remit since last assessment, and outlook for forthcoming quarter. Risk assessment based on categorisation of the ESA Joint Committee. Colours indicate current risk intensity. Coding: green=potential risk, yellow=elevated risk, orange=high risk, red=very high risk. Upward arrows indicate an increase in risk intensities, downward arrows a decrease, horizontal arrows no change. Change is measured with respect to the previous quarter; the outlook refers to the forthcoming quarter. ESMA risk assessment based on quantitative indicators and analyst judgement.
Risk summary: Risk levels in the markets under ESMA remit remained high, reflecting elevated risks for
investors, infrastructures and services, and the financial system at large, as well as very high risks in
securities markets. We continue to consider market risk very high, following materialisation of the valuation
risk. Our credit risk assessment remains unchanged at very high levels. While still at a lower level, liquidity
risk is under scrutiny due to ongoing concerns about the reduction of liquidity provision on bond markets,
while contagion and operational risk remain unchanged at high and elevated, respectively. Key risk
sources remain uncertainty with respect to emerging market developments, in particular China; continued
downward pressure on commodity prices, especially oil; and sustained pressure on commodity-export-
oriented emerging economies, reinforced by potential weaknesses in market functioning. Subsequent
price movements and volatility on EU or US equity markets reflected this anxiety.
Market environment: The market environment in 2H15 confirmed ESMA financial stability concerns. EU
markets were characterised by the materialisation of valuation risk in equity markets together with a
resurgence of volatility. This was accompanied by the expectation of diverging monetary policy and
growing uncertainties surrounding economic growth, especially in EMs, which weighed on foreign
exchange and commodity markets. Market turmoil was fostered by reassessment of the situation for oil-
exporting countries and companies from the energy sector, with the potential for second-round effects. In
early 2016 an agreement between oil producers helped to stabilize commodity prices, although it may not
fully address excess supply issues. On bond markets, there were ongoing concerns regarding potentially
lower liquidity and increased credit risk premia, which may increase the potential for a market correction.
Overall, market sentiment declined close to its five-year average. Finally, issuance activity was sustained,
with capital market financing still exceeding bank loans.
Securities markets: Search for yield combined with concerns around equity overvaluations, emerging
market vulnerabilities and divergent monetary policy prospects produced a volatile market environment
amplified by potentially lower liquidity in some market segments. While contagion from earlier
developments in Greece had remained limited, risks materialised during the summer, when equity prices
experienced a sharp drop and volatility soared, driven by a large sell-off in Asian equity markets. Tensions
temporarily abated but resurfaced at the end of the year, highlighting the persistence of some of the
underlying issues, especially the slowdown in China and the drop in oil prices. Equity markets remained
volatile since then, and sensitive to adverse news. Conditions in other markets remained benign, with low
interest rates prevailing in bond and money markets. Wider spreads on low-grade fixed income securities,
such as corporate bonds and asset-backed securities, suggest an increase in credit risk premia, following
several years of yield compression. Volumes declined somewhat, with lower issuance in the sovereign and
non-financial corporate segments, and declining turnover in sovereign repo and money markets. The
volume of structured products sold to retail investors continued to decline despite an increase in the variety
of products.

ESMA Report on Trends, Risks and Vulnerabilities No. 1, 2016 5
Investors: Investment funds faced a combination of multi-year high volatility and declining flows.
Commodity funds continued to figure prominently here, reporting further negative performance in the wake
of declining commodity prices. These developments were passed on to retail investors, whose portfolio
generated lower returns yet with a higher level of risk. Against this background, concerns over liquidity
deepened. Unease is growing about a potential liquidity mismatch for funds that offer daily liquidity while
invested in less liquid assets, notably fixed-income instruments issued by corporates, in emerging markets
or exposed to the energy sector. Although the EU fund sector has proved resilient so far, recent examples
from the US market have also shown that risks were not purely theoretical, with some funds temporarily
failing to meet redemption requests or experiencing a liquidity discount.
Infrastructures and services: In the second half of 2015, the share of trading via electronic order books on
trading venues increased. For securities depositories, important regulatory reforms are under way, while
three CCPs extended their activities to clear new classes of assets. This increasing importance and
centrality of infrastructures and services makes their operational resilience and continuity crucial. Further
improvements in financial market governance have been observed, especially with regard to financial
benchmarks and more accurate credit ratings.
Vulnerabilities
MREL/TLAC requirements: This article analyses the Minimum Requirement for Own Funds and Eligible
Liabilities (MREL) and the Total Loss-Absorbing Capital (TLAC) requirements for banks. These bail-in tools
will complement the prudential requirements and contribute to absorb losses in case of failure. They may
also pose issues in terms of the consistency of rules within and across jurisdictions and transparency
around the securities that will be considered eligible, the trigger levels for conversion or write-off and the
setting of the Point of Non-Viability (PONV). Investors should thus undertake a careful investment analysis
that considers the liability profile of the banks, the MREL/TLAC requirements and the local Resolution
Authority’s discretionary powers. For their part, regulators should strive to provide investors with as much
transparency as is possible without undermining the Resolution Authority. Similarly, consistency in
approaches to the ‘what’ and ‘when’ across jurisdictions will make the investment analysis more robust.
Financial innovation: Risk and benefit assessment: This is the first of a two-part analysis of financial
innovation. We provide the reader with an overview of ESMA analytical process. This will be followed
in an upcoming TRV with a detailed analysis of our Financial Innovation scoreboard. ESMA has put in
place a monitoring framework designed to ensure that innovation does not undermine the core
objectives of investor protection, financial stability and orderly markets. In this article we outline the
scope of our work, the sources of information we employ and how we prioritize the work. We also
outline some of the key challenges of monitoring financial innovation across the EU. Finally, we
outline how this monitoring process will support ESMA’s product intervention powers which become
effective with the new MIFID legislation.
The central clearing landscape in the EU: This article gives an overview of the central clearing landscape
in the EU within the EMIR framework. In 2009, G20 leaders agreed that OTC derivative contracts should
be cleared by Central Counterparties (CCPs). The EMIR Regulation was subsequently adopted to
implement this commitment in the EU. Since the entry into force of EMIR on 16 August 2012, the process
of CCP authorisation has progressed, with sixteen CCPs having been authorised to operate in the EU.
The mandatory clearing requirement for several classes of OTC interest rate swaps and credit default
swaps should become applicable in 2016, and several interoperability arrangements are in place.
Collateral scarcity premia in EU repo markets: This analysis focuses on the drivers of the cost of obtaining
high-quality collateral in seven EU countries over the last two years. This period covered two important
changes in ECB monetary policy: The introduction of a negative deposit rate in June 2014 and the launch
of quantitative easing in January 2015. The analysis is based on a dataset matching information on
European repo markets with securities lending markets and bond-specific characteristics. Empirical results
show that the cost of obtaining high-quality collateral, proxied by specialness of government bond repos,
increases with demand in the cash market from short selling activities, even in calm financial conditions. In
bear market conditions – when good collateral is most needed – this may lead to tensions in some asset
market segments. Collateral reuse may alleviate these tensions, but requires transparency and monitoring
of risks from collateral chains. Understanding the drivers of specialness can help to identify factors and
practices liable to increase procyclicality in the financial system.

ESMA Report on Trends, Risks and Vulnerabilities No. 1, 2016 6
Trends

ESMA Report on Trends, Risks and Vulnerabilities No. 1, 2016 7
Market environment The market environment in 2H15 confirmed ESMA financial stability concerns. EU markets were
characterised by the materialisation of valuation risk in equity markets together with a resurgence of
volatility. This was accompanied by the expectation of diverging monetary policy and growing
uncertainties surrounding economic growth, especially in EMs, which weighed on foreign exchange and
commodity markets. Market turmoil was fostered by reassessment of the situation for oil-exporting
countries and companies from the energy sector, with the potential for second-round effects. In early
2016 an agreement between oil producers helped to stabilize commodity prices, although it may not fully
address excess supply issues. On bond markets, there were ongoing concerns regarding potentially
lower liquidity and increased credit risk premia, which may increase the potential for a market correction.
Overall, market sentiment declined close to its five-year average. Finally, issuance activity was
sustained, with capital market financing still exceeding bank loans.
Market performance was impacted by the
materialisation of market valuation concerns in
equity markets (-6.1%), while commodities
continued their downward trend (-33.6%).
Corporate and sovereign bond markets were more
stable despite the global uncertainty (T.1), but an
increase in credit risk premia at the end of the
reporting period may signal the potential for a
market correction. A succession of news reports
and events in emerging markets triggered market
sell-offs in an already volatile trading environment
due to concerns about possible overvaluations and
uncertainty around the path of US monetary policy.
Especially towards the end of the reporting period,
market unease was heightened by the steep
decline in oil prices in conjunction with China’s
slowdown and the potential prospect of lower
global growth (T.21). On the other hand, the
political agreements in the euro area on the Greek
financial situation reduced the likelihood of a
Eurozone crisis.
The slide in equity prices and general concerns
over high asset valuations temporarily drove
volatility (T.2) to a multi-year high in 2H15 across
asset classes. Equity and commodity markets
were the most severely impacted, with volatility
passed on to investment funds and ultimately to
retail investors. Corporate and sovereign bond
volatilities increased, but not on the same scale,
highlighting ongoing concerns over potentially
lower liquidity levels in bond markets.
Market liquidity issues remained a concern,
especially amid reports of the banks’ retreat from
market making activities as they refocused on their
core businesses. In contrast to the high volatility,
indicators suggest that overall liquidity on equity
markets remained ample. Conversely, the
development in bid-ask spreads seemed to
indicate temporary tensions on bond markets
(T.8).
Issues in EM countries were reflected in
exchange rate developments, with the EUR
partially recovering from its significant decline
during the first half of the year. The rebound was
particularly strong against EM currencies following
the devaluation of the CNY. However, the EUR
depreciated further against USD. Net capital flows
also show a strong domicile preference, with non-
residents withdrawing money from the EU area
during 3Q15 (T.3) and EU residents temporarily
reducing their outflows during the same period
(T.4). This home bias reflects the prevailing risk
aversion stemming from recent FX movements
and uncertain macroeconomic prospects.
Overall, market sentiment in financial services
receded in 2H15 close to its 5Y MA. Negative
developments in confidence levels were evenly
distributed within the financial sector, although
confidence in the insurance and pension fund
sector remained particularly subdued (T.6).
Capital market financing declined to EUR 543bn
in 2Q15 and 3Q15, following the record issuance
volume observed in 1Q15. Equity still represents
the bulk of capital market financing, while net
financial sector debt issuance remained negative.
From the investor side, the contribution by insurers
shrank, although remaining predominant, while
bond funds experienced outflows. The volume of
capital market issuance remains constantly higher
than net new lending, but overall it still plays a
limited role in financing the real economy.
Especially for SMEs, market-based sources of
financing are hardly relevant, with less than 5% of
the firms issuing debt securities. This highlights the
need to strengthen capital markets financing with a
view to a more diversified financing base for the
EU economy, which is a main element in the
Capital Markets Union work plan published by the
European Commission in September 2015.

ESMA Report on Trends, Risks and Vulnerabilities No. 1, 2016 8
T.1 T.2
Market performance Market volatilities Valuation risk materialised in equity Volatility temporarily reached multi-year high
T.3 T.4
Portfolio investment inflows Portfolio investment outflows Outflows in 2H15 Temporary home bias
T.5 T.6
Capital markets issuance Financial services survey Capital market financing continued to exceed loans Confidence levels receded
T.7 T.8
Institutional financing Sovereign bond liquidity Contribution of insurance declined Liquidity tensions in August
50
75
100
125
150
Dec-13 Apr-14 Aug-14 Dec-14 Apr-15 Aug-15 Dec-15
Equities CommoditiesCorporate bonds Sovereign bonds
Note: Return indices on EU equities (Datastream regional index), globalcommodities (S&P GSCI) converted to EUR, EA corporate and sovereignbonds (Iboxx Euro, all maturities). 02/12/2013=100Sources: Thomson Reuters Datastream, ESMA.
0
10
20
30
40
Dec-13 Apr-14 Aug-14 Dec-14 Apr-15 Aug-15 Dec-15
Equities Commodities
Corporate bonds Sovereign bonds
Note: Annualised 40D volatility of return indices on EU equities (Datastreamregional index), global commodities (S&P GSCI) converted to EUR, EAcorporate and sovereign bonds (Iboxx Euro all maturities), in %.Sources: Thomson Reuters Datastream, ESMA.
-75
-25
25
75
125
Nov-13 Mar-14 Jul-14 Nov-14 Mar-15 Jul-15 Nov-15Equities Short term debtLong term debt Net inflows
Note: Net inflows=BoP and international investment position. Portfolioinvestment liabilities of EA 19 (fixed composition) residents. Net transactionsover the period, EUR bn.Sources: ECB, ESMA.
-50
-25
0
25
50
75
Nov-13 Mar-14 Jul-14 Nov-14 Mar-15 Jul-15 Nov-15Equities Short term debtLong term debt Net outflows
Note: Net outflows=BoP and international investment position. Portfolioinvestment assets of EA 19 (fixed composition) residents. Net transactions overthe period, EUR bn.Sources: ECB, ESMA.
-250
0
250
500
750
10Q3 11Q3 12Q3 13Q3 14Q3 15Q3
Government debt NFC debtFinancial sector debt EquitySecuritised assets 1Y-MA markets1Y-MA loans
Note: Net issuance of debt securities, equities and securitised assets in the EA,by type of instrument and sector, in EUR bn. Securitised assets include ABS,MBS and covered bonds. Due to different netting and consolidationmethodologies, the data may not be fully reconciliable. 1Y-MA markets plotsthe 1Y-MA of the aggregate of all assets displayed in columns. 1Y-MA loansplots 1Y MA of loan-based financing.Sources: ECB, Dealogic, ESMA.
-10
0
10
20
30
40
Dec-13 Apr-14 Aug-14 Dec-14 Apr-15 Aug-15 Dec-15Financial intermediation Insurance and pension fund.
Auxiliary activities Overall financial sector
5Y-MA OverallNote: European Commission survey of EU financial services sector andsubsectors (NACE Rev.2 64, 65, 66). Confidence indicators are averages of netbalance of responses to questions on development of the business situationover the past three months, evolution of demand over the past three months andexpectation of demand over the next three months, in % of answers received.Sources: European Commission, ESMA.
-200
-100
0
100
200
300
400
10Q3 11Q3 12Q3 13Q3 14Q3 15Q3Other Hedge funds
Real estate funds Bond funds
Equity funds Insurance and pensions
1Y-MANote: EA institutional investment flows by type of investor, EUR bn. Other=financial vehicle corporations, mixed funds, other funds. EUR bn. 1Y-MA=1Ymoving average of all investment flows. 1Y-MA not shown for 10Q2 and 10Q3as not all series are available for 2009.Sources: ECB, ESMA.
0
1
2
3
4
5
6
Dec-13 Apr-14 Aug-14 Dec-14 Apr-15 Aug-15 Dec-15
Liquidity indicator 40D-MA 5Y-MA
Note: Liquidity measured as median across countries of the difference in bid-ask yields for 10Y sovereign bonds, in basis points. 24 EU countries are included.Sources: Bloomberg, ESMA.

ESMA Report on Trends, Risks and Vulnerabilities No. 1, 2016 9
Securities markets Search for yield combined with concerns around equity overvaluations, emerging market
vulnerabilities and divergent monetary policy prospects produced a volatile market environment
amplified by potentially lower liquidity in some market segments. While contagion from earlier
developments in Greece had remained limited, risks materialised during the summer, when equity
prices experienced a sharp drop and volatility soared, driven by a large sell-off in Asian equity
markets. Tensions temporarily abated but resurfaced at the end of the year, highlighting the
persistence of some of the underlying issues, especially the slowdown in China and the drop in oil
prices. Equity markets remained volatile since then, and sensitive to adverse news. Conditions in
other markets remained benign, with low interest rates prevailing in bond and money markets. Wider
spreads on low-grade fixed income securities, such as corporate bonds and asset-backed securities,
suggest an increase in credit risk premia, following several years of yield compression. Volumes
declined somewhat, with lower issuance in the sovereign and non-financial corporate segments, and
declining turnover in sovereign repo and money markets. The volume of structured products sold to
retail investors continued to decline despite an increase in the variety of products.
Equities: Volatility on the rise
EU equity markets were characterized by much
stronger volatility across EU countries than has
been seen over the last few years. During the
summer, a succession of news reports and
events in emerging markets triggered market
sell-offs in an already volatile trading
environment due to concerns about possible
overvaluations and uncertainty around the path
of US monetary policy. Although EU equity
prices subsequently recovered, they fell by
around 6% in 2H15, with comparable losses in
US and JP equity prices (both decreasing by
around 5%). EM stocks dropped 15%, and by
the end of the year they stood more than 20%
below their 2015 high in April (T.9).
Since these developments were driven primarily
by external events, EU equity markets were
affected relatively evenly. As a result, price
dispersion remained limited since June, with no
major unilateral movement to highlight since the
political tensions around the Greek financial
situation earlier in the year (A.18).
Equity market movements may have been
amplified by lower market liquidity, with the 40-
day average bid-ask spreads on large European
caps slightly higher at 6.3 basis points at the end
of 2015, compared to 5.7 basis points end-2014.
However, bid-ask spreads remained below their
long-term average, and ESMA’s illiquidity
indicator suggests that overall liquidity on equity
markets remains ample (A.20 and A.21).
The steepest drop in equity prices was
registered on 24 August with EU equities falling
5% in just one day. Concerns over growth
prospects in several large emerging markets
crystallized around China as local authorities
intervened to stem a prolonged sell-off in
equities. Due to negative market reactions
spilling over to other parts of the world and
reinforced by expectations of lower EM growth,
short-term realised volatility in EU equity
markets spiked to a multi-year high of 40%
towards the end of August, before falling back to
an average of 23% in the fourth quarter (T.11).
Tensions resurfaced at the end of the year, with
EM equity prices experiencing another sharp
drop, led by China, and volatility in EU markets
rising anew, against the backdrop of changes in
monetary policy stances in the US and EU.
Market movements were driven to some extent
by intensified short-selling activity, as reflected
in securities lending data. The utilisation rates
of European and especially Asian equities,
which are proxies for short-selling borrowing
demands, inched up after 24 August (T.10).
More broadly, securities lending activity in the
T.9 Equity prices Significant fall in EU equity prices
80
90
100
110
120
130
140
Dec-13 Apr-14 Aug-14 Dec-14 Apr-15 Aug-15 Dec-15
EU US JP EM
Note: Datastream regional equity indices for the EU, the US, JP and Emerging Markets, indexed with 31/12/2013=100. EM redenominated in EUR.Sources: Thomson Reuters Datastream, ESMA.

ESMA Report on Trends, Risks and Vulnerabilities No. 1, 2016 10
EU has trended up over the past two years,
driven mainly by equity (up to EUR 174bn in
December 2015 from EUR 141bn in December
2014) and government bond loans (up to
EUR 308bn from EUR 267bn over the same
period), primarily collateralised with other
securities.
T.10 Securities lending Increase in equity utilisation rates
Possibly as a result of lower valuations and
volatile markets, equity issuance in the EU
declined during the third quarter to EUR 26.8bn,
down from EUR 36.6bn in 3Q14. However,
issuance recovered during the fourth quarter,
leading to a 15% increase in 2H15 from the
same period last year, driven by an increase in
IPOs from EUR 12.7bn to EUR 27.4bn (A.15).
Regarding derivatives, global growth in the
market value of exchange-traded equity indices
continued, although they still represent a
relatively small fraction of total derivatives.
Turnover, meanwhile, peaked to an all-time high
of more than USD 100tn in notional value,
mainly as a result of the 36% quarterly increase
in equity futures. The growing role of derivatives
may have played a part in the 24 August market
crash by amplifying market movements due to
various options strategies and volatility hedging
(T.12).
Debt instruments: Yields remain low
Following a period of instability at the end of
1H15 amid mounting uncertainties over
developments in Greece, yields on ten-year
sovereign bonds decreased in both core and
peripheral countries as from end July (A.26).
The impact on EU sovereign bond markets of
uncertainty around the Greek financial situation
has been relatively limited, as shown by spreads
of ten-year sovereign bond yields in peripheral
countries relative to the corresponding German
yields, which widened only slightly and then
quickly returned to their previous levels (A.27).
This was also reflected by stable trends in
securities lending markets collateralised by
government bonds. The utilisation rates of
European government bonds, a proxy for short-
selling-related demand, have remained broadly
stable around 30% (A.61).
T.12 Equity prices and volatility The impact of Gamma hedging on equity markets On 24 August 2015, concerns over Chinese growth triggered a global sell-off in equity markets, with the Euro Stoxx 50 losing up to 5% intraday from its previous close. The large drop in some Asian equity markets (the Shanghai CSI 300 Composite index lost around 8%, with futures down 13%) had led to a steep overnight drop in index futures in Europe between Sunday and Monday.
Market intelligence suggests that part of the sell-off was driven by a combination of options strategies and a low-liquidity environment. Such strategies include for example index options (e.g. puts and collars), but also volatility-targeting portfolios and hedging of VIX-based products, acting as “stop-loss” orders executed beyond certain price or volatility thresholds. Analysts from JPMorgan estimated that the derivatives Gamma – the amount of equity sales triggered by such strategies for every 1% of market decline – in S&P 500 and ETF options had reached a record USD 25bn at the end of the previous week.
Such Gamma-hedging is sensible from a risk management perspective to limit losses and reduce exposures, but it also amplifies intraday market movements. A large share of the increase in pre-market trading volumes (where liquidity is typically scarce) was due to hedging flows, driving most of the price movements in futures indices. This in turn caused sharp increases in volatility measures, creating a self-reinforcing trend in equity markets.
There are several implications for financial stability. The first is that Gamma-hedging can be problematic from a macro-prudential perspective due to the losses it might impose on investors that are not fully hedged. The second is the amplification of stock price movements, with multiple trading halts on US stocks and exchange-traded funds resulting in numerous market dislocations (ETFs mispriced compared to their underlying index). The last is the cyclical impact on market liquidity, which is already becoming increasingly event-driven due to the structural move towards algorithmic trading.
Overall, yields remained at low levels in line with
the moderate perception of sovereign risk
reflected by the developments in sovereign CDS
spreads (A.31), despite the lower average credit
2
3
4
5
6
7
8
9
10
Dec-13 Apr-14 Aug-14 Dec-14 Apr-15 Aug-15 Dec-15
European Equities Asian Equities
Note: Utilisation rates calculated as lender value of securities on loan divided bylendable value, in %. The seasonal peaks in equity loans reflect tax arbitragerelated to dividends payment. The dashed line indicates 24/08/2015.Sources: Markit Securities Finance, ESMA.
T.11 Equity price volatility Volatility reached a 4Y high but receded
0
10
20
30
40
50
Dec-13 Apr-14 Aug-14 Dec-14 Apr-15 Aug-15 Dec-15VIX (US) VSTOXX 5Y-MA VSTOXX
Note: Implied volatility of EuroStoxx50 (VSTOXX) and S&P 500 (VIX), %.Sources: Thomson Reuters Datastream, ESMA.

ESMA Report on Trends, Risks and Vulnerabilities No. 1, 2016 11
quality of EU sovereign issuers following some
rating downgrades. Short-term repo rates for
debt instruments issued by EA sovereigns also
pushed deeper into negative territory, following
the ECB deposit rate cut. At an average -35
basis points in December, they were down 15
basis points from June (A.64).
EU sovereign bond issuance totalled
EUR 477bn in 2H15, on a par with 2H14 (EUR
472bn; A.23). On the other hand, sovereign
EUR repo volumes fell to a daily average of
EUR 155bn in 2H15, around 7% below 1H15
(A.65).
Corporate bond issuance by banks was
around EUR 191bn in 2H15, increasing by
40.8% compared to 2H14 but decreasing with
respect to 1H15 (-26.9%). However, since non-
financial corporation issuance contracted in the
same period to about EUR 133bn (versus
EUR 211bn in 1H15 and EUR 147bn in 2H14),
total corporate bond issuance declined by 31.2%
in 2H15, to EUR 356bn (A.36). Looking at the
type of instruments (T.13), the ABS and MBS
segment was stable versus 2H14, at EUR 36bn,
while the issuance of covered bonds increased
to EUR 68bn, higher than in both 1H15 (EUR
64bn) and 2H14 (EUR 42bn).
T.13 Corporate bond issuance Overall decrease
Corporate bond yields fell slightly across risk
categories, apart from BBB-rated securities (+7
bps), but remained at a low level. The difference
between higher- and lower-rated bonds
widened, with the differential between AAA-rated
bonds and BBB-rated bonds increasing from
47bps in June 2015 to 90bps in December
2015, the highest level since September 2013
(T.14). EA BBB-rated non-financial corporate
bond spreads to the risk-free rate reached a
two-year high of 194bps in September, possibly
reflecting repricing following a deterioration in
the average credit quality of both financial and
non-financial EU corporate issuers during the
first half of the year. It remains to be seen
whether this break in the long-term yield
compression trend will mark a decisive reversal
with broader consequences for European
securities markets and financial institutions.
T.14 Corporate bond yields Yield rise for lower rated issuers
Looking into securitised products, EUR 45bn
were placed in 1H15, representing 55% of
issuance, compared to EUR 48bn in 2H14 (50%
of issuance) and EUR 35bn in 1H14 (29% of
issuance; A.45). At the end of 1H15, EUR 1.3tn
of securitised products were outstanding, of
which more than half (EUR 729bn) were
retained, presumably for repos or securities
lending. Several initiatives have been taken to
revive securitisation in the EU. In particular, the
Commission Securitisation initiative adopted on
30 September 2015 is a package of two
legislative proposals: A Securitisation Regulation
and a proposal to amend the Capital
Requirements Regulation.
Spreads of EA AAA-rated securitised products
remained at low levels, but increased
nonetheless on average from 7 basis points in
1H15 to 15 basis points in 2H15. Spreads in the
US also widened from 80 to 100 basis points
(A.47).
The credit quality of securitised assets
improved in 1H15. This was driven by several
factors, including one rating agency updating its
methodology and the improvement in the credit
rating of various EU sovereigns, leading to an
increase in the share of AA-rated securities
finance instruments from 18.4% in 2H14 to
23.2% (T.15). The percentage of AAA-rated
securitised assets also edged up, to 23%, while
the share of securitised assets rated sub-
investment grade remained below 30% (A.51).
Overall, the number of rated securitised assets
continued to decline, due to a general decrease
across asset classes, particularly relevant for
ABCP (14%) and ABS (6%). At the same time,
0
100
200
300
400
500
10Q4 11Q4 12Q4 13Q4 14Q4 15Q4
Covered bond Corp. bond and MTNABS and MBS 5Y-MA
Note: Quarterly debt issuance in EU by deal type, EUR bn.Sources: Dealogic, ESMA.
0
1
2
3
4
Dec-13 Apr-14 Aug-14 Dec-14 Apr-15 Aug-15 Dec-15
AAA AA ABBB 5Y-MA
Note: Markit iBoxx euro corporate bond indices for maturities 5-7 years, %. 5Y-MA=five-year moving average of all indices.Sources: Thomson Reuters Datastream, ESMA.

ESMA Report on Trends, Risks and Vulnerabilities No. 1, 2016 12
the accuracy of ratings measured over the
previous twelve months fell for ABS and RMBS,
though remaining at high levels (A.52).
T.15 Credit ratings Focus on developments in structured finance ratings
The latest data from ESMA’s ratings central repository (CEREP) show a substantial improvement in the average quality of both structured finance instruments (SFIs) and covered bonds, as reflected in a strongly positive (notch-weighted) drift for these rating categories (A.57). This was driven by several factors, including the announcement by one rating agency in March that it was updating its rating methodology, and the improvement in the credit rating of some EU sovereigns. These factors led to a wave of upgrades that were not directly related to the credit quality of the outstanding instruments.
Changes in methodology have a short-term impact on outstanding ratings (stock effect), which is immediately visible in the data, as well as a longer term impact on the new ratings assigned (flow effect) in subsequent years. The latter will be gradually reflected in the distribution of ratings within that category. Changes in sovereign ratings may influence the rating of financial corporate issuers in particular, reflecting the ability of the sovereign to provide an additional backstop. These developments may eventually be reflected in the ratings assigned to SFIs, even if the payment of cash flows does not always depend directly on the issuer’s solvency.
The detailed breakdown of rating changes available in CEREP offers valuable information for understanding underlying dynamics. In the case of SFIs, for example, the factors highlighted above led to a sizeable increase in the number of double-A ratings and a corresponding reduction in single-A ratings (T.16). These numbers include all CRAs registered in the EU, as well as new ratings, withdrawals (including SFIs that have matured) and defaults. The net change in outstanding SFI ratings has been in negative territory since 2H09 as the number of new ratings has not been able to compensate for the number of instruments maturing, reflecting a broader contraction in securitisation markets. The calculation of net change in SFI ratings also includes the number of defaults, which has recently been increasing, although it remains low: The percentage of SFI defaults in 1H15 reached 1%, up from 0.5% in the previous period (T.17).
The wave of SFI upgrades was particularly concentrated in certain EU countries, namely Greece, Ireland, Italy, Portugal and Spain. The notch-weighted drift in these countries for Moody’s rose to 2.6% in 1H15, up from 1.6% in 2H14 (T.18). This followed an earlier wave of downgrades, with Moody’s displaying a larger negative SFI rating drift than its competitors in 2H12 and 1H13.
T.16 Structured finance instruments Rating changes negative on average
In 2H15 the total of covered bonds outstanding
in the EU shrank further by EUR 7bn to EUR
1,202bn. This was despite a rebound in gross
issuance volumes, which amounted to EUR
156bn in 2015, up 36.2% on 2014 (EUR 115bn)
and 44% in comparison to 2013 (EUR 109bn). In
a context of low interest rates, average covered
bond spreads (across all rating categories)
increased in the second half of the year, though
remaining at low levels (around 40bps for AAA-
rated securities). The increase was particularly
noteworthy for A-rated covered bonds, for which
spreads almost tripled from 42bps at the end of
June to 118bps at the end of December (A.54).
T.17 Structured finance instruments Increase in default rates
-1,500
-1,000
-500
0
500
1,000
1H09 1H10 1H11 1H12 1H13 1H14 1H15
CCC and lower B BB BBB A AA AAA Net change
Note: Change in the number of structured finance instruments ratingsoutstanding, by rating category. Net change is the sum of all ratings.Sources: CEREP, ESMA.
0.0%
0.2%
0.4%
0.6%
0.8%
1.0%
1.2%
1H152H141H142H131H132H121H12
Note: Default rate of rated structured finance instrument, in % of outstandingnumber of rated securities.Sources: CEREP, ESMA.

ESMA Report on Trends, Risks and Vulnerabilities No. 1, 2016 13
T.18 Structured finance instruments Rating drift in selected EU countries
EUR up against EM currencies
In foreign exchange markets, the EUR partially
recovered from its significant decline during the
first half of the year. The rebound was
particularly strong against a basket of EM
currencies including CNY, IDR, MXN, RUB and
TRY, with the single currency gaining around
10% in 2H15 (T.19). This development was
partly driven by two successive interventions by
CN monetary authorities to devaluate the CNY
in order to stimulate growth. Market intelligence
suggests that the EUR benefitted from a
renewed safe-haven status, signalling stronger
confidence in the single currency and
outweighing perceived dovish comments from
the ECB regarding the path of future monetary
policy.
T.19 Foreign exchange rates EUR appreciated against other currencies
The EUR remained relatively stable against
GBP, as expectations regarding the ECB asset
purchase programme counterbalanced the
pricing in of a later-than-previously-expected
interest rate hike in the UK: Markets are now
pricing in an initial BoE rate increase in January
2017, about a year later than had been
expected at the end of June. The EUR also
remained almost flat against USD following its
8% decline in the first half of the year. The
implied USD-EUR exchange rate volatility
subsided somewhat from its earlier levels, but
with periodic peaks from broader market risks.
The outstanding volume of exchange-traded
currency derivatives notionals increased
slightly to USD 295bn at the end of 1H15, up 3%
from 2H14 (A.81). Quarterly turnover stood at
USD 16.4tn year-to-date, up 12% from the same
period last year (A.82).
Commodity prices continued to trend down,
mainly due to developments in energy markets.
The overall commodity price index stood 30%
below its end-June level, with energy prices
down 43%. Here again, the main driver was
lower growth expectations in emerging markets,
combined in the case of oil with excess supply
capacity reflected in high inventories and crude
oil production forecasts for the years ahead. As
a result, volatility was on the rise, with 40-day
average volatility in energy prices up to 48% in
September, the highest since 1H09, before
subsequently subsiding. The implied volatility of
options on light crude oil prices rose in line. A
recent BIS report estimated global oil and gas
debt at USD 2.5tn in 2014, up from USD 1tn in
2006. The decline in asset values backing this
debt is likely to have caused financial strains,
with leverage amplifying the dynamics of energy
price decline (T.20).
T.21 Commodities Drop in oil prices adds to market concerns
Since July 2014 crude oil prices have fallen by almost 75%, from USD 105 per barrel to around USD 27 on 21 January 2016, hitting a twelve-year low (T.22). Supply factors seem to have played a somewhat more prominent role than demand factors in driving down the price of oil. Overall, the economic impact of low oil prices is generally assumed to be positive. Cheaper oil is expected to stimulate global economic growth: The benefits to oil importers are generally estimated to outweigh the loss to producers. However, lower oil prices may coincide with tensions in global financial markets.
-400%
-300%
-200%
-100%
0%
100%
200%
300%
1H11 1H12 1H13 1H14 1H15DBRS Fitch Ratings Moody's S&P's
Note: Rating drift of structured finance instruments issued in Greece, Ireland,Italy, Portugal and Spain, in %.
70
80
90
100
110
120
Dec-13 Apr-14 Aug-14 Dec-14 Apr-15 Aug-15 Dec-15
USD JPY GBP
CHF Emerging 5Y-MA USD
Note: Spot exchange rates to Euro. Emerging is a weighted average (2013 GDP)of spot exchange rates for CNY, BRL, RUB, INR, MXN, IDR and TRY.01/10/2013=100. Increases in value represent an appreciation of EUR. 5Y-MA ofthe USD exchange rate.Sources: ECB, IMF, ESMA.
T.20 Commodity prices Prices far below their mid-term average
20
40
60
80
100
120
140
Dec-13 Apr-14 Aug-14 Dec-14 Apr-15 Aug-15 Dec-15
Energy Industrial metalsNatural gas Precious metalsBrent 5Y-MA
Note: S&P GSCI Commodity indices and Brent price, indexed, 01/01/2014=100. 5Y-AVG=five-year average computed using S&P GSCI. Indices denominated in USD.Sources: Thomson Reuters Datastream, ESMA.

ESMA Report on Trends, Risks and Vulnerabilities No. 1, 2016 14
The confluence of factors re-confirms our strong negative market risk assessment.
Most immediately, the collapse in oil prices has a direct impact on the valuation of oil companies worldwide. This is true not only of companies that extract crude oil and face lower profit margins, but also of companies specialised in petrochemicals and refined petroleum products that are perceived to be negatively affected in the long run by low and volatile oil prices. The price of bonds from issuers in this sector is similarly impacted.
Through second-round effects, lower oil prices and growth slowdowns in oil-exporting countries are likely to strain corporates’ balance sheets and, by amplifying non-performing loans, also those of banks.
At the broader economic level, declining oil pricing impacts markets in which oil production plays a key role. Slacker GDP growth from lower oil prices may cause budgetary problems. The sovereign and corporate sectors of some oil-exporting countries also rely on global markets for funding. A reassessment of growth prospects by investors has already triggered capital outflows, reserve losses, sharp currency depreciations, and rising sovereign CDS spreads. Most of the increase in emerging market non-financial corporate (and US high-yield) debt in the last few years has been in oil and commodity industries. Although it may seem likely that the negative effects from lower oil prices highlighted above would remain concentrated in the economies directly involved and in the energy sector, there are several transmission channels through which oil price developments can have additional destabilising effects on global financial markets.
First, investors exposed to the energy sector, or to companies based in oil-producing countries, can face losses either through their direct portfolio holdings of securities (stocks and bonds), or through the exposure of funds in which they are invested. These funds may either hold securities themselves or track indices that are sensitive to changes in oil prices (e.g. S&P Oil and Gas index, emerging market bond indices, or key equity benchmarks in oil exporting countries). For example, EU equity prices in the oil and gas sector declined by 19% in 2H15 (T.23). In turn, this can trigger large fund outflows and redemptions that may have a destabilising effect, particularly in illiquid markets, and impose losses on other investors. The prospect of large funds, including public investors from oil producing countries, offloading assets to increase their cash buffers can weigh additionally on global asset prices.
Furthermore, given the possibility of substituting cheap oil for other energy sources, developments in the oil sector are likely to spill over into correlated industries such as gas, other conventional energy markets, or alternative energies and impact securities valuations there, too, although the direction and size of that impact is likely to vary.
An additional transmission channel is greater risk aversion. The turmoil in some market segments, combined with lower growth in China and lingering uncertainties around US monetary policy, has resulted in stronger volatility and lower global risk appetite. In the EU, this is in part reflected in significantly higher spreads of EU high-yield corporate bonds, with the difference between AAA-rated bonds and BBB-rated bonds widening by around 40bps in 2H15 to its highest level since September 2013. Increased volatility and tighter financing conditions are in turn expected to feed through to lower GDP growth, also in the EU, weighing on investor sentiment.
Overall, the recent rout in global markets from lower oil prices highlights the heightened market risk and prevailing volatility, particularly in riskier market segments; investors should bear this in mind when making their investment decisions and allocations. These developments also underscore our assessment that market risk remains very high.
T.22 Oil prices Low prices and heightened volatility
T.23 EU equity prices EU oil and gas sectors underperformed
Other markets
Conditions in short-term money markets were
mixed. In the EA, the EONIA remained in
negative territory, drifting down slightly
from -6bps to -23bps, while the 3M Euribor
declined 12bps to -13bps (A.71).
T.24 Money markets Volume decline
However, these relatively favourable
developments contrasted with a decline in
EONIA lending volumes, from EUR 1.3tn in
2Q15 to EUR 1.1tn in 3Q15 and to around EUR
700bn in 4Q15, reflecting reduced interbank
activity (T.24). The LIBOR-OIS spread edged up
0
10
20
30
40
50
60
70
80
20
30
40
50
60
70
80
90
100
110
120
Jan-14 May-14 Sep-14 Jan-15 May-15 Sep-15 Jan-16
Volatility (rhs) WTI Brent
Note: Benchmark front month oil contracts, in USD per barrel, and CBOE OilETF implied volatility index.Sources: Bloomberg, Thomson Reuters Datastream, ESMA.
60
70
80
90
100
110
120
Jan-14 May-14 Sep-14 Jan-15 May-15 Sep-15 Jan-16
EU all sectors EU oil and gas sectors
Note: EU equity indices, rebased 1/1/2014=100.Sources: Datastream, ESMA.
0
10
20
30
40
50
60
Dec-13 Apr-14 Aug-14 Dec-14 Apr-15 Aug-15 Dec-15
EONIA SONIA (rhs) 5Y-MA EONIANote: 20D moving average of daily lending volumes on Euro Overnight IndexAverage (EONIA) and Sterling Overnight Index Average (SONIA), EUR andGBP bn.Sources: ECB, Bloomberg, ESMA.

ESMA Report on Trends, Risks and Vulnerabilities No. 1, 2016 15
slightly, reflecting higher short-term interest rate
expectations in the UK. The USD LIBOR in
particular displayed higher, albeit limited,
volatility as the Federal Reserve changed its
communications on the main policy rate (A.72).
Implied interest rate volatility, as measured by one-
month forward Euro-Euribor swaptions, fluctuated
close to the levels observed earlier in the year, at
around 100%, up from around 50% on average
last year, although the five-year tenor volatility
increased somewhat (A.74). Higher historical and
implied volatilities in the context of interest rates
are partly related to their current levels, since they
are close to zero.
With regard to market-based credit
intermediation, the two main developments were
the increase in EU MMF liabilities and securities
lending activity, up 5% and 11% respectively as of
the mid-year from their year-end level (T.25).
However, these two types of market-based credit
intermediation combined to around EUR 1.5tn,
while European repo market activity has remained
relatively stable at around EUR 5.5tn over the past
two years.
T.25 Market-based credit intermediation Increase in MMF and securities lending
Meanwhile, interconnectedness between EA
investment funds and MFIs through loans and
debt securities holdings continued to decline, to
14% of total assets, down from more than 17%
in 2013. This development was driven mainly by
reduced MMF, bond funds and hedge funds’ on-
balance sheet exposures to MFIs (A.86).
The liquidity level of Prime EU MMFs remained
stable, with the share of liquid assets available
at one-day and one-week notice standing at
26% and 39% of AuM respectively (A.88). On
the other hand, the weighted-average maturity
and life of these funds shortened slightly, from
44 and 65 days respectively as at the end of
2Q15 to 42 and 62 days as of October, close to
their long-term average (A.87).
The volume of structured products sold to
retail investors in 2015 fell versus 2014 despite
a continuous increase in the number and variety
of products. Retail investors in search of yield
had access to more complex and structured
investment strategies with risk-return
characteristics that match specific needs and
investor demand. For example, 58% of the
structured products were sold without any
capital protection, which may signal greater risk
appetite.
T.26 Sales by asset class Equity products dominant
Products with equity instruments as their
underlying continued to constitute the bulk of
sales volumes and numbers but they
encompass a wide variety of products, including
convertible bonds which offer a debt-like payoff.
0
10
20
30
0
4
8
12
10Q2 11Q2 12Q2 13Q2 14Q2 15Q2
ABCP ABS
MMFs Securities lending
Repo % of bank liabilities (rhs)Note: Size of shadow banking system proxied by amounts of ABS and ABCPoutstanding, size of the EU repo market and EU securities on loan (collateralisedwith cash), and liabilities of MMF, in EUR tn. % of bank liabilities on rhs.Sources: ECB, AFME, ICMA, Markit Securities Finance, ESMA.
0
400
800
1,200
1,600
2,000
0
40
80
120
160
200
2010 2011 2012 2013 2014 2015
Th
ou
sa
nd
s
FX rate Interest rate
Other Commodities
Equity Number of products (rhs)Note: Volumes of structured products sold to retail investors by asset class,EUR bn. Number of products sold, thousand.Sources: StructuredRetailProducts.com, ESMA.

ESMA Report on Trends, Risks and Vulnerabilities No. 1, 2016 16
InvestorsInvestment funds faced a combination of multi-year high volatility and declining flows. Commodity
funds continued to figure prominently here, reporting further negative performance in the wake of
declining commodity prices. These developments were passed on to retail investors, whose portfolio
generated lower returns yet with a higher level of risk. Against this background, concerns over liquidity
deepened. Unease is growing about a potential liquidity mismatch for funds that offer daily liquidity
while invested in less liquid assets, notably fixed-income instruments issued by corporates, in
emerging markets or exposed to the energy sector. Although the EU fund sector has proved resilient
so far, recent examples from the US market have also shown that risks were not purely theoretical,
with some funds temporarily failing to meet redemption requests or experiencing a liquidity discount.
Investment funds: Surge in volatility amid constant liquidity concerns
In 2H15 heightened concerns across markets
negatively impacted the EU investment fund
industry. Compared to 1H15, performance
declined for all types of funds, and dispersion
between the different investment policies
narrowed. Equity funds in particular suffered
from the stock market correction over the
reporting period before temporarily recovering,
as their average monthly returns dropped to
0.96% (-0.40pp). They continued to outperform
other funds, with fund returns ranging from
0.05% for bond funds to 0.26% for alternatives.
Commodity funds continued to figure
prominently, reporting negative performance
(-1.82%) in the wake of declining commodity
prices.
T.27 Fund returns Performance down for most funds
Market developments in August led to the
highest level of volatility in years for equity and
commodity funds (T.28). While still high, bond
funds’ return volatility was lower than for equity
funds, reflecting the ongoing concerns regarding
the bond market’s potentially lower liquidity.
T.28 Fund return volatility Volatilities surged in 3Q15
Assets under management for the entire EA
investment fund industry followed market
performance with a decline in 3Q15, before
rebounding in October at EUR 10.5tn, with
bonds, equity and mixed funds representing the
bulk of the industry (A.95). Leverage was
broadly stable across fund categories (A.98).
Alternative investment funds increased their
market share a little to 36% of EU investment
fund volume, with UCITS representing 64% of
the industry (A.96).
Fund flows decreased versus 1H15, falling to
EUR 112bn in 2H15 (-51%). In a context of
greater macroeconomic uncertainty, all funds
investing in the US or in emerging markets
experienced substantial outflows. Moreover,
asset allocation between bond funds
(EUR -10.9bn) and money market funds
(EUR 30.3bn) was rebalanced. Flows into
money market funds were nevertheless volatile,
driving development of the sector during the
reporting period (T.29).
-2.5
-1.5
-0.5
0.5
1.5
2.5
Dec-13 Jun-14 Dec-14 Jun-15 Dec-15
Alternatives Equity BondCommodity Mixed Assets Real Estate
Note: EU domiciled investment funds' annual average monthly returns, asset weighted, %.Sources:Thomson Reuters Lipper, ESMA.
0
4
8
12
16
20
24
28
Dec-13 Apr-14 Aug-14 Dec-14 Apr-15 Aug-15 Dec-15
Alternatives Equity Bond
Commodity Mixed Real estateNote: Annualised 40D historical return volatility (%) of EU domiciled mutual funds.Sources: Thompson Reuter Lipper, ESMA.

ESMA Report on Trends, Risks and Vulnerabilities No. 1, 2016 17
T.29 Fund flows by fund type BF flows decline amid fund flow volatility
EU bond funds saw outflows in all asset
categories, with corporate and emerging bond
funds picking up the bulk of the decline (T.30).
T.30 Net flows for EU BF by strategic focus Outflows in all fund categories
Most strategies in the EU alternative
investment funds sector recorded negative
performance in 2H15. Although alternative
investment strategies claim low correlation with
standard asset classes, they were also affected
by equity markets and fears of a global
economic slowdown. The industry recorded a
loss of 2.1% over the reporting period, with
distressed debt (-4.6%), event driven (-5.8%)
and relative value (-3.4%) strategies turning in
the worst performances (A.112). Within the sub-
category of alternative mutual funds, flow
patterns were similar to other investment funds,
with outflows from US funds and better
resistance from EU funds (A.113). For all EA
hedge funds, assets under management
increased to EUR 306bn in 2H15 but remained
markedly below their temporary spike of early
2015. This was probably related to changes in
derivative positions in one member state.
Accordingly balance sheet leverage was stable,
around 1.37, but still noticeably below its early
2015 level (A.113).
Half of the EU money market fund industry is
delivering returns close to zero or negative, as
market rates have continued to decline. The
average monthly rate of return (RoR) dwindled
to 0.33% in 2H15 but was still above the 5Y
average. This performance was driven by funds
not denominated in EUR: US dollar-
denominated EU MMFs were among the best
performing funds although their yields declined
markedly to 0.9%, down from 1.7% in 1H15
(A.107). These particular developments were
related chiefly to foreign exchange dynamics
across economic regions, with the EUR
stabilizing against major currencies after
depreciating in 1H15, as expectations of
monetary policy divergence were factored in.
The weighted average maturity of MMF
portfolios declined for most funds, even though
some lengthened the overall maturity of their
portfolio to maintain positive returns.
Compared to 1H15, MMFs recorded higher
inflows (A.108). Flows were also concentrated,
with nineteen funds attracting 50% of the
positive flows. Assets under management stood
at EUR 1.0tn at the end of 2015, of which half
were invested in constant net asset value
(CNAV) funds1.
On the regulatory side, IOSCO published its
review of the regulation of MMFs2. This showed
that the EU framework was compliant with
IOSCO recommendations, taking into account
both the 2010 CESR Guidelines and the 2013
EC Proposal for Regulation currently under
discussion. EU jurisdictions in particular have in
force requirements on the types of assets MMFs
may invest in and the risks they may take, such
as liquidity, maturity or credit risk. The CNAV
feature of MMFs was also a key issue: where
this feature is permitted, IOSCO acknowledged
progress in addressing issues and risks
associated with CNAV. However, pending the
finalisation of EU regulation, it also asked for
further measures to reinforce their resilience and
their ability to face significant redemptions.
In 2H15, the performance of EU exchange-
traded funds declined to 0.7%, driven primarily
by the decline in equity markets but also by
other asset classes, notably commodities.
Performance distribution for the sector shifted
with the mean and ranged from -2.7% to 2.0%
(A.117). Like investment funds, ETFs
1 Fitch, “European MMF Quarterly”, 16 November 2015.
2 IOSCO, “Peer Review of Regulation of Money Market
Funds: Final Report”, September 2015.
-40
0
40
80
120
160
Dec-13 Apr-14 Aug-14 Dec-14 Apr-15 Aug-15 Dec-15
Total EU Equity Bond Mixed MMFs
Note: EU domiciled funds' 2M cumulative net flows, EUR bn.Sources: Thomson Reuters Lipper, ESMA.
-12
-6
0
6
12
Dec-13 Jun-14 Dec-14 Jun-15 Dec-15
Corporate GovernmentHY Inflation-protectedTotal return EmergingOther assets
Note: Net flows for bond funds, EUR bn. Funds investing in corporate and government bonds that qualify for another category are only reported once (e.g. funds investing in emerging government bonds will be reported as emerging; funds investing in HY corporate bonds will be reported as HY). Sources: Thomson Reuters Lipper, ESMA.

ESMA Report on Trends, Risks and Vulnerabilities No. 1, 2016 18
experienced a dramatic surge in volatility in
3Q15, which reached its highest level in 3 years.
The NAV of EU ETFs progressed by 4%, to
EUR 425bn (A.119).
Considering their higher risk and reward profile,
the best and the worst performing ETFs were
leveraged funds investing in equity or
commodities. To achieve their leverage ratio,
these leveraged ETFs typically use total return
swaps or futures. Their swap counterparties will
in turn hedge these contracts, transmitting the
rebalancing flows into markets. As a result,
leveraged ETFs are not only exposed to higher
liquidity risk by placing orders during a narrow
window at the end of the trading day, but also to
higher counterparty risk.
Increased volatilities fuelled ongoing financial
stability concerns around fund liquidity. The
combination of potentially lower market liquidity,
unprecedentedly high volatility (T.28) and
outflows challenges the EU fund industry’s
capacity to meet redemption needs at short
notice. This is giving rise to concerns about a
potential liquidity mismatch for funds that offer
daily liquidity while invested in less liquid assets,
notably fixed-income instruments. In the event
that a run were to materialise, the resulting fire
sales would spread risks through contagion
across asset classes and other financial
intermediaries. The IMF recently also indicated
that larger holdings by mutual funds, in particular
open-end mutual funds, are associated with
more severe liquidity declines during stress
periods.3
In this environment EU funds were nonetheless
able to maintain their portfolio liquidity (T.31). In
recent years they have tended to reduce the
liquidity of their assets while increasing their
maturity, presumably driven by search for yield
incentives. However in 2015 most bond funds
kept their liquidity risk profile stable by
compensating for less liquid exposure with
shorter maturity, and vice-versa. On the whole
non-sovereign bond funds held the maturity of
their holdings and the liquidity of their assets
almost stable. In contrast corporate bond funds
held less liquid assets but with shorter
maturities. HY funds continue to be hallmarked
by the low liquidity of their portfolios. Finally,
loan funds’ risk profile improved with a reduction
in the maturity of their holdings, although in
3 International Monetary Fund, “Global Financial Stability
Report”, October 2015.
relative terms they remained the most exposed
to liquidity risk.
T.31 Liquidity risk profile of EU BF Liquidity risk profile stable
Despite the resilience of EU bond funds, the
issue of fund liquidity still needs to be closely
monitored. We observed a slight dip below its
four-year average in the relative proportion of
cash and cash-equivalent derivatives in
corporate bond fund portfolios in 2H15, to 3.1%
of their holdings (T.32). These cash holdings
can be used in particular to supplement portfolio
diversificaton when relatively illiquid assets are
held. If this declining trend is confirmed it could
potentially reduce the funds’ capacity to meet
redemption needs, especially if the underlying
corporate bond market becomes less liquid.
T.32 Cash as a percentage of assets in corporate BF portfolio Cash below its 4Y-average
Similarly, bond funds recently captured attention
in the US. In December 2015, one large US
high-yield bond fund announced that it would
liquidate its portfolio and suspend redemptions.
The fund manager considered that he could not
meet redemption requests without selling assets
at a discounted price and disadvantaging the
remaining shareholders. This was the
consequence of the intrinsic illiquidity of the fund
holdings, such as corporate bonds rated below
CCC or unrated, coupled with a low level of cash
and other liquid assets.
-5
20
45
70
3 4 5 6 7 8 9
Liq
uid
ity
Maturity
Corporate bond funds All bond funds (excl. gov.)
HY funds Government bond funds
Loan funds
Note: Fund type is reported according to their average liquidity ratio, as a percentage (Y-axis), the effective average maturity of their assets (X-axis) and their size. Each series is reported for 2 years, i.e. 2014 (mid tones) and 2015 (hue).
Sources: Thomson Reuter Lipper, ESMA.
0.0
1.0
2.0
3.0
4.0
5.0
Dec-12 Jun-13 Dec-13 Jun-14 Dec-14 Jun-15 Dec-15
4Y-AVG CashNote: Cash and derivatives in percentage of holdings (%). Derivative positionscan have a negative value.Sources: Thomson Reuters Lipper, ESMA.

ESMA Report on Trends, Risks and Vulnerabilities No. 1, 2016 19
US ETFs also attracted attention for similar
reasons. On 24 August in particular, there was a
breakdown between ETFs and their
corresponding intraday NAV. Unlike other funds,
ETF shares are traded like stocks on secondary
markets. On primary markets, only “Authorized
Participants” (AP) ensure that the value of the
share traded on secondary markets does not
vary significantly from its net asset value. This
arbitrage mechanism allows ETF shares to be
traded close to their NAV price. But ultimately
the liquidity of ETFs still depends on the liquidity
of their underlying assets, which can evaporate
during market stress4, as happened on 24
August due to the stock market correction.
Moreover, there is evidence that some US ETFs
were still traded below their NAV several days
after the event, thus incorporating a discount
due to lower liquidity.
From a regulatory perspective, the first point to
note in this context is that both UCITS and
AIFMD are subject to various requirements in
relation to liquidity management which are
designed to avoid liquidity risks. The UCITS
Directive requires liquidity to be ensured for all
their investments and sets out specific rules for
the eligibility of transferable securities, money
market instruments and financial derivative
instruments. At the management company level,
rules on both risk and liquidity management
must be observed. With respect to the AIFMD,
the AIFM are obligated to put in place liquidity
management requirements if they manage
open-ended or leveraged closed-ended AIFs.
This includes alignment of the fund’s investment
strategy, liquidity profile and redemption policy,
as well as setting appropriate liquidity
management limits and stress tests.
In the light of the above it is necessary to ensure
that these regulatory standards are properly and
consistently implemented and to develop more
detailed guidance where needed. In addition the
IMF5 considers that liquidity mismatches in the
asset management industry should be mitigated,
especially for funds that invest in relatively
illiquid and infrequently traded assets but allow
investors to redeem their shares easily. It
recommends considering the use of tools that
adequately price in the cost of liquidity, including
minimum redemption fees, improvements in
illiquid asset valuation, and mutual fund share-
4 ESMA, “Performance and risks of Exchange-Traded
Funds”, TRV 2 2014. 5 International Monetary Fund, “Global Financial Stability
Report”, April 2015.
pricing rules. In that respect, international bodies
such as the FSB and IOSCO are currently
evaluating the role that existing or additional
policy measures could play in mitigating
potential risks and will make policy
recommendations as necessary. Such
recommendations would then provide the basis
for common standards across jurisdictions, in
particular in the EU.
Retail investors: Sentiment affected by adverse market conditions
T.33 Portfolio returns Declining portfolio returns
After a promising start to the year for retail
investors, returns on their representative
portfolios declined sharply during 2H15,
eventually returning to their five-year moving
average. This is due primarily to EU equity
markets, whose decline was felt by retail
investors either directly or indirectly through
collective investment schemes. Additionally,
retail investors were adversely impacted by
other financial events, such as the bursting of
the EM stock market bubble.
Reduced expectations for economic growth, if
realized, may eventually affect retail investors’
gross disposable income. Nonetheless, after
the consistent drop in income witnessed since
2011 the trend has turned mildly positive, as the
five-year moving average indicates.
0.0
0.2
0.4
0.6
0.8
1.0
Dec-13 Apr-14 Aug-14 Dec-14 Apr-15 Aug-15 Dec-15Average 5Y-MA
Note: Monthly return (%) for a representative portfolio for households. Assetweights, computed using ECB Financial Accounts by Institutional Sectors, are37% for collective investment schemes (of which 12% mutual funds and 25%insurance and pension funds), 31% for deposits, 22% for equity, 7% debtsecurities and 3% for other assets.Sources: Thomson Reuters Datastream, Thomson Reuters Lipper, ECB,ESMA.

ESMA Report on Trends, Risks and Vulnerabilities No. 1, 2016 20
T.34 Gross disposable income Slow increase
Global macroeconomic events adversely
affected investor sentiment and dampened
expectations of an economic recovery in the EA
by the end of 2015 – as can be seen from the
downward trend in the EA future indicators.
T.35 Investor sentiment Sentiment moderately affected by markets
As for retail investors’ portfolio allocation, they
further increased their holdings of investment
fund shares in 1H15. This can be explained by
the funds’ performance over the period
compared to other assets, and also by their use
as a vehicle for retirement savings. It is
particularly true of funds characterized by long-
term investment choices. In comparison the rate
of growth in direct investment into equity
decelerated compared to 1H14.
T.36 Financial assets Investment funds continue to attract retail investors
Retail investor complaints about the low quality
or even lack of information provided to investors
when they purchase financial instruments have
declined in relative terms since 2H13, when they
represented 61% of the total, a situation mainly
due at that time to the default of banking
institutions in two EU countries. However,
complaints in this category still represent the first
cause of complaints. Other important reasons
for complaint are unauthorized business and
incorrect or inappropriate execution of financial
orders. On the positive side, these complaints
can also be explained by investors’ deeper
knowledge and understanding of their own rights
vis-à-vis the financial instrument provider.
T.37 Complaints by cause Lack of information less prominent
0.0
0.5
1.0
1.5
2.0
2.5
3.0
3.5
4.0
4.5
5.0
Jan-10 Oct-10 Jul-11 Apr-12 Jan-13 Oct-13 Jul-14
Average 5Y-MA
Note: Annualised growth rates of average gross disposable income in 16 EUcountries (BE, CZ, DK, DE, IE, ES, FR, IT, NL, AT, PL, PT, SI, FI, SE, UK), %.Sources: Eurostat, ESMA.
-50
-25
0
25
50
Dec-10 Dec-11 Dec-12 Dec-13 Dec-14
EA institutional current EA private current
EA institutional future EA private future
Note: Sentix Sentiment Indicators for Euro Area private and institutional investorsfor a 10Y horizon. The zero benchmark marks a risk-neutral position. Monthlyfrequency.Sources: Thomson Reuters Datastream, ESMA.
-10-505
101520253035
Oct-13 Jan-14 Apr-14 Jul-14 Oct-14 Jan-15Deposits Debt securitiesShares Investment Fund sharesInsurance & Pension Funds Other assetsLoans
Note: Unweighted average annualised growth (%) in EU households' financialassets. Data from 25 EU countries excl. BG, CY, AT. Excluding DK, FI, GB,GR, HR, IE from loans; IE from investment funds; CZ, DK, FR, GR, LU, ROfrom other assets (derivatives and other accounts receivable/payable).Sources: ECB, ESMA.
0%
20%
40%
60%
80%
100%
Jan-13 Jul-13 Jan-14 Jul-14 Jan-15
Unauthorised business Fees/chargesQuality/lack of information Investment adviceExecution of orders
Note: Complaints data by cause of complaint in % over the total. Data collectedfrom NCAs, firms and Ombudsman of 27 EU countries (excluding CZ).Sources: ESMA complaints data collection by EU NCAs.

ESMA Report on Trends, Risks and Vulnerabilities No. 1, 2016 21
T.38 Complaints by financial instrument Complaints over equity and derivatives increase
As far as the type of financial instrument is
concerned, complaints focused chiefly on bonds
and equities. More recently the share of
complaints about derivative instruments has
increased, reflecting the growing importance of
more complex products in retail investor
portfolios.
T.39 Financial assets in investor portfolios Asset growth above its 5Y average
The value of both household real and financial
assets is growing at a rate slightly above the
five-year moving average, with financial assets
growing at 6.3% during 1Q15 and real assets at
1.3%. This reflects positive developments on
financial markets in 1H15 but does not reflect
the reversal that occurred in 2H15.
T.40 Financial assets and liabilities Steady drop in the liabilities-to-assets ratio
EU households held EUR 32.9tn in financial
assets and EUR 9.9tn in financial liabilities in
1Q15. The amount of financial assets continued
to increase while that of financial liabilities was
stable. As a result, the liabilities-to-assets ratio
continued to head down, with a drop of more
than 3.6 percentage points in the last two years,
falling to 30% in the first quarter of 2015.
Reasons behind the fall include a tight credit
environment and the consequent low
percentage of loans that banks grant to
households.
0%
20%
40%
60%
80%
100%
Jan-13 Jul-13 Jan-14 Jul-14 Jan-15
Financial contracts for difference Options/futures/swaps
Mutual funds Structured securities
Bonds/debt securities Shares/stocks/equity
Note: Complaints data by financial instrument in % over the total. Data collectedfrom NCAs, firms and Ombudsman of 27 EU countries (excluding CZ).Sources: ESMA complaints data collection by EU NCAs.
-4
-2
0
2
4
6
8
Jan-10 Oct-10 Jul-11 Apr-12 Jan-13 Oct-13 Jul-14
Financial assets 5Y-MA financial assets
Real assets 5Y-MA real assets
Note: Annualised growth rates of EA-18 households' real and financial assets, %.5Y-MA: 5 years moving average of the growth rate.Sources: ECB, ESMA.
28
29
30
31
32
33
34
35
0
5
10
15
20
25
30
35
13Q1 13Q2 13Q3 13Q4 14Q1 14Q2 14Q3 14Q4 15Q1
Mill
ion
s
Assets Liabilities Liabilities/Assets ratioNote: EU households' financial assets and liabilities, excl. BG, CY; EUR tn (lhs).Assets/Liabilities ratio, % (rhs).Sources: ECB, ESMA.

ESMA Report on Trends, Risks and Vulnerabilities No. 1, 2016 22
Infrastructures and services In the second half of 2015, the share of trading via electronic order books on trading venues
increased. For securities depositories, important regulatory reforms are under way, while three CCPs
extended their activities to clear new classes of assets. This increasing importance and centrality of
infrastructures and services makes their operational resilience and continuity crucial. Further
improvements in financial markets governance have been observed, especially with regard to
financial benchmarks and more accurate credit ratings.
Trading venues: Increased share of electronic order books
Trading volumes continued their upward trend,
notwithstanding the correction from the five-year
high recorded in April 2015; much of this peak
and subsequent correction was related to
activity recorded in trade reporting facilities6.
The share of equity transactions conducted via
electronic order books stood at over 63% in
November 2015. While this represents a
rebound from less than 60% in June, it is on a
par with the two-year average, which is
significantly below the average of the five
preceding years. On the other hand, just above
28% was reported to trade reporting facilities,
which is 1.5 percentage points below the two-
year average. Having fallen to a low of 6.2%
(down from 10% in March), the share of off-
order book transactions climbed back to 7%.
Dark pools retained a small share of 2.3%,
above the two-year average (T.41).
T.41 Equity turnover by transaction type Electronic order book share further increased
6 FESE Statistics Methodology, September
2015: “Reporting transactions refer to trades reported through a Trade Reporting Facility (TRF) when only one counterparty provides information on the trade and offers dissemination services at the request of the reporting trader. The other counterparty could use this facility if reporting is mandatory.”
0
500
1,000
1,500
2,000
2,500
Nov-13 Mar-14 Jul-14 Nov-14 Mar-15 Jul-15 Nov-15
Dark pools EOB
Off-order book TRF
All trading 2Y-AVGNote: Turnover on trading venues by category, EUR bn. 2Y-AVG = 2Y average ofall trading, EOB = Electronic Order Book, TRF = Trade Reporting Facilities. Datauntil November 2015.Sources: FESE, ESMA.
T.42 Circuit breakers
Circuit Breakers (CBs) are market-based trading halts triggered by a potential price disruption and intended to avoid discontinuity in price movements. CBs can thus facilitate investor protection and help assure fairness in, and integrity of, markets. CBs can be split into two types: market-wide and stock-specific, depending on whether trading is suspended across an entire trading venue, or for a single, or several single securities. Regulation and market practices on CBs differ significantly between the EU and US.
In the EU, several trading venues implement stock-specific CBs; however, trading rules differ significantly from exchange to exchange, and the variety of CB calibrations makes it difficult to generalise standard market practices. On the regulatory side, MiFID II art. 48(5) requires “regulated markets to be able to temporarily halt or constrain trading if there is a significant price movement in a financial instrument on that market or a related market”. As of today there is no mandatory reporting from trading venues on the parameters of CBs. Reporting will start in January 2017, when MiFID II enters into force. In this regard, ESMA is mandated to draft Guidelines on the appropriate calibration of CBs.
In the US, in 2012 the Securities and Exchange Commission (SEC) revised the market-wide CBs that halt the broad market at times of severe stress. CBs apply to stocks and to a list of exchange-traded products, including those that track broad-based stock indexes. Under these rules, cross-market trading halts occur when the S&P 500 falls 7% (Level 1), 13% (Level 2), and 20% (Level 3) from its previous closing price. The SEC has also introduced uniform CBs for individual stocks – limit up-down mechanism – that, depending on the stock price and when declines occur, halt the market for 5 or 15 minutes.
On 24 August 2015, market turmoil partly related to concerns about an economic slowdown in China caused stocks and ETFs traded on US trading venues to be halted more than 1,200 times. These trading halts may have helped avoid a flash crash. A total of 1,067 circuit breakers were triggered at NYSE while there were 165 at Nasdaq and three at BATS. Notwithstanding the presence of circuit breakers, ETFs showed “flash-crash”-style drops with the price falling up to 50% from the previous closing price, as investors sold their ETF shares at a deep discount to their NAV. ETF prices registered wider swings because of their unique structure. Like mutual funds, ETFs own a basket of investments. But they have the advantage of actively trading throughout the day. As stocks in the ETF basket were halted it became impossible to price the ETF itself. This pressured market makers, such as broker-dealers that facilitate trades, to sell ETFs at market orders (orders to sell without any restrictions as to price or timeframe such as market and stop-loss sell orders), thus fuelling price decline and triggering CBs.

ESMA Report on Trends, Risks and Vulnerabilities No. 1, 2016 23
In China, the China Securities Regulator Commission (CSRC) recently introduced a market-wide CB system which halts trading on the Shanghai and Shenzhen stock exchanges for 15 minutes whenever the CSI 300 Index moves up or down by 5% compared to the previous closing price and for the entire trading session if it moves by 7%. The CB rules entered into force on 1 January 2016. On the first day of trading after implementation (4 January 2016) market-wide CBs were triggered: Trading on the Shanghai and Shenzhen exchanges was halted for 15 minutes when the CSI300 index fell by 5% from the previous closing price and then for the rest of the day as the CSI300 index subsequently fell by 7%. On Thursday, 7 January 2016, CBs were triggered again and stock markets closed only 30 minutes after they had opened. In the evening of that day the CSRC suspended the CB rules, and the CSI 300 recovered 2% on the following day. This case highlights the complex dynamics and interaction between markets and trading rules in stress situations.
CCPs: Increasing coverage
Over the reporting period, three CCPs were
granted an extension of authorisation by their
competent authorities. Eurex Clearing AG, first
authorised in April 2014, was re-authorised to
also clear OTC Inflation Swaps. BME Clearing,
originally authorised in July 2015, now extends
its activities and services to clear OTC interest
rate derivatives and some cash equities both on
OTC and Regulated Markets. Finally, CME
Clearing Europe has been authorised to extend
its activities and services to clear short-term
interest rate futures (STIRs) and deliverable
swap futures (DSFs). Globally, the share of OTC
interest rate derivatives cleared increased for all
asset classes except FRAs and in November for
OIS where important non-cleared positions were
taken (T.43). Global IRS volumes reported to the
Depository Trust and Clearing Corporation
decreased by USD 46tn over the reporting
period.
T.43 Clearing activity Gradual increase
CSDs: Volatile activity
ESMA approved the last set of Technical
Standards related to the Regulation of Central
Securities Depositories (CSDR) in January
2016. These Technical Standards, which aim at
harmonising CSD requirements in the EU, cover
the cooperation requirements among authorities,
requirements concerning recognition of third-
country CSDs, requirements on risk monitoring
tools, record keeping, investment policy or
reconciliation measures, and requirements
regarding non-discriminatory access to CSDs by
market participants, including issuers, CCPs,
trading venues or other CSDs. Finally, the TS
include requirements on how to report
internalised settlements (for securities
transactions settled outside a securities
settlement system) as well as on settlement
discipline.
Settlement activity, as measured by the total
value of settled transactions, remained
dominated by government bond transactions in
the EU. The activity for this asset class was
more volatile over the reporting period. This
followed a spike at the end of June 2015, a
period corresponding to the highest point
reached by EU sovereign yields, notably Greek
government debt, during the summer (A.27).
Since then, there has been a gradual reduction
in bond activity (T.44). In the longer run,
settlement activity was stable, with the annual
value of settlement instructions processed by
EU CSDs in 2014 quite similar to the amount
settled in 2013 (A.144).
T.44 Settlement activity Stabilisation after gradual decrease
The share of transactions for which settlement
failed was lower for government bonds than for
equities and corporate bonds, with the former
still under 2% (T.45). Nevertheless, the share of
failed settlements was more volatile for all
categories of assets from end-1H15.
40
50
60
70
80
90
100
Dec-13 Apr-14 Aug-14 Dec-14 Apr-15 Aug-15 Dec-15
Swap OIS FRA Basis Swaps
Note: OTC interest rate derivatives cleared by CCPs, % of total notionalamount.Sources: DTCC, ESMA.
0
500
1,000
1,500
2,000
2,500
Jan-14 May-14 Sep-14 Jan-15 May-15 Sep-15
Corporate bonds Equities Government bonds
Note: Total value of settled transactions in the EU as reported by NCAs; dailyvalues in EUR bn. Free-of-payment transactions not considered.Sources: National Competent Authorities, ESMA.

ESMA Report on Trends, Risks and Vulnerabilities No. 1, 2016 24
T.45 Settlement fails More volatile for corporate bonds
Credit rating agencies: Stable ratings accuracy
In an environment of low interest rates and
mixed liquidity conditions on bond markets,
credit rating agencies fared relatively well during
1H15 in terms of the discriminatory power of
their credit ratings (as measured by Accuracy
Ratios). In the short term (one year), Accuracy
Ratios depicted the overall solid performance of
ratings across asset classes. The ratio for
financial corporates (90.8%) was the highest in
the last period, followed by non-financials
(90.1%) and structured finance (82.5%) (T.46).
This reflects the fact that structured finance
instruments have a relatively higher tendency to
experience defaults in higher rating classes, but
also that the overall default frequency is higher.
In contrast, defaults of financials and non-
financials have been scarce.
T.46 Rating performance Performance stable
The longer the time horizon, the lower the AR
typically is. This is well reflected by the five-year
cumulative accuracy profile (CAP)7 for the same
7 Cumulative Accuracy Profile (CAP) is a measure of a
rating scale’s rank-ordering capability. Each CAP has a corresponding Accuracy Ratio (AR) which measures the area between the CAP and a “random” curve (a 45
asset classes (T.47). The corresponding five
year AR for non-financial corporates, financials
and structured finance is 65.4%, 53.5% and
70.4% respectively. The shape of CAP and low
value of AR for financials is driven by the high
incidence of defaults in the highest rating
classes over the time horizon. Similarly, the
overall solid performance of non-financial
corporate ratings is negatively impacted by a
small number of highly rated defaults recorded
by one rating agency.
T.47 Rating accuracy Driven by low default frequency
Financial benchmarks: Enhanced
governance
The continuity of financial benchmarks in the EU
remained a key concern in 2H15. Administrators
of key reference rates made significant progress
in enhancing governance, quality, methodology
and accountability of their benchmarks. The
legislative process on an EU legal framework for
benchmarks is ongoing (T.51). In 2H15, the
European Parliament and Council were
negotiating a draft EU law aimed at improving
administrator governance and methodologies,
which will introduce for the first time EU-wide
direct supervision of administrators of
benchmarks such as interbank reference rates
and other indices. The European Money Market
Institute (EMMI), i.e. the international
association providing Euribor and Eonia, has
enhanced the Euribor control framework, as
described in the revised Code of Conduct
degree line). For the purpose of gauging credit rating agencies’ (CRAs) operational efficiency, 5-year CAP and 1-year AR for three asset classes (non-financial corporates, financials and structured finance) are presented. Importantly, the reliability of both measures is highly dependent on default occurrence. For small default samples the measures may be statistically insignificant. By extension, it is not possible to estimate CAP and corresponding AR for asset classes with no default history.
0
1
2
3
4
5
6
Jan-14 May-14 Sep-14 Jan-15 May-15 Sep-15
Corporate bonds Equities Government bonds
Note: Share of failed settlement instructions in EU; % of value, 5D-MA. Free-of-payment transactions not considered.Sources: National Competent Authorities, ESMA.
0
0.2
0.4
0.6
0.8
1
1H10 1H11 1H12 1H13 1H14 1H15
Non-financials Financials Structured finance
Note: Cumulative accuracy profile (CAP) coefficients measure the accurancy ofratings. The coefficient is derived from average defaulter position (AP), thencomputed as follows: CAP = 2*AP-1. The closer the coefficient is to 1, the higherthe accuracy of the ratings (i.e. defaults occur among low credit ratings).Sources: CEREP, ESMA.
0.0
0.2
0.4
0.6
0.8
1.0
0.0 0.2 0.4 0.6 0.8 1.0
Financials Non-financials
Structured finance Random
Note: Cumulative accuracy profile (CAP) curves for the 3 largest credit ratingagencies. 2H10-1H15. The CAP curve plots the cumulative proportion of issuersby rating grade (starting with the lowest grade on the left) against the cumulativeproportion of defaulters by rating grade.Sources: CEREP, ESMA.

ESMA Report on Trends, Risks and Vulnerabilities No. 1, 2016 25
published in October 2015. The EMMI launched
a consultative position paper on the evolution of
Euribor with the objective of developing and
evaluating a transaction-based benchmark
determination methodology, to be introduced in
July 2016.
Meanwhile, in the EU and elsewhere,
investigations into potential manipulations of
interbank interest reference rates, derivatives
prices, oil price benchmarks and exchange rates
are ongoing. Authorities also monitor submission
patterns to address data quality concerns. As
regards the contributors to the Euribor panel,
one contributor ceased to act as a submitter in
the reporting period. The panel is now
composed of 23 banks (T.48).
T.48 Euribor panel Stability among panel banks
The dispersion of quotes submitted for the
calculation of Euribor remained broadly stable in
2H15. In the reporting period the maximum
difference was observed in the three-month and
six-month tenor (T.49).
T.49 Euribor contributions Dispersion measure broadly stable
Enhanced governance and submission rules at
administrator and panel bank level may offer
some assurance that the quality and reliability of
contributions has nevertheless improved. For
the calculation of Euribor, the calculation agent
eliminates the top and bottom 15% of submitted
rates in order to reduce the impact of an outlier
submission. The gap between the actual Euribor
and the non-trimmed average rate for the three-
month tenor increased slightly at the beginning
of 2H15 before decreasing in December.
However, no spikes were observed in the
reporting period (T.50).
T.50 Dispersion of submission levels Slight increase in dispersion
On average in 2H15, 81% of banks decided to
keep to their previous-day submission, while 5%
decided to raise their quote and 14% chose to
lower it. Overall, the reporting of lower rates
from day to day in 2015 translated into a marked
decrease in the levels of the three-month
Euribor. Finally, in 2H15 the three-month Euribor
continued lower than the ECB interest rate for
main refinancing operations (A.150).
T.51 Reform under-way EU legal framework for benchmarks
The development of an EU legal framework for benchmarks is in progress. The September 2013 EU Commission “Proposal for a Regulation on indices used as benchmarks in financial instruments and financial contracts” states that:
– benchmark administrators should be regulated, and supervised by national competent authorities, and, for critical benchmarks, by colleges of national supervisors;
– all entities calculating benchmarks or contributing information used in their calculation should be required to tighten up their governance and scrutiny procedures, in particular to prevent conflicts of interest;
– data for the calculation of benchmarks would have to be publicly available, as well as information on the intended purposes of each benchmark measure;
– banks would have to assess the suitability of the benchmarks they use before entering into any financial contract, such as a mortgage.
The European Parliament and the Council engaged in trilogue negotiations in 2H15 towards a final agreement and adoption of the Regulation. Preliminary political agreement between the European Parliament and the Council was reached on 24 November 2015. Publication in the Official Journal of the EU is expected in 2Q16
0
5
10
15
20
25
30
35
Dec-13 Apr-14 Aug-14 Dec-14 Apr-15 Aug-15 Dec-15
Note: Number of banks contributing to the Euribor panel; non-viability isassumed at 12 contributing banksSources: Euribor-EBF, ESMA
0
0.2
0.4
0.6
0.8
Dec-13 Apr-14 Aug-14 Dec-14 Apr-15 Aug-15 Dec-15
Note: Normalised difference in percentage points between the highestcontribution submitted by panel banks and the corresponding Euribor rate. Thechart shows the maximum difference across the 8 Euribor tenors. The increasesince 2013 is linked to technical factors such as low Euribor rates. The spike inAugust 2014 reflects the fact that two panel banks submitted respectively aquote for the two-week tenor which was 7 times higher than Euribor and aquote for the 1M tenor which was 10 times higher than Euribor.Sources: Euribor-EBF, ESMA.
-0.2
0.0
0.2
0.4
0.6
Dec-13 Apr-14 Aug-14 Dec-14 Apr-15 Aug-15 Dec-15
Top 15% Core 70%
Bottom 15% 3M Euribor
Raw 3M Euribor ECB refinancing rate
Note:Dispersion of 3M Euribor submissions, in %. The "Raw 3M Euribor" rate iscalculated without trimming the top and bottom submissions of the panel for the3M Euribor.Sources: Euribor-EBF, ESMA.

ESMA Report on Trends, Risks and Vulnerabilities No. 1, 2016 26
Risks

ESMA Report on Trends, Risks and Vulnerabilities No. 1, 2016 27
ESMA Risk Dashboard
R.1
Main risks
Risk segments Risk categories Risk sources
Risk Risk Change Outlook
Change
Overall ESMA remit
Liquidity
Macroeconomic environment
Systemic stress
Market
Low interest rate environment
Securities markets
Contagion
EU sovereign debt markets
Investors
Credit
Funding patterns
Infrastructures and services
Operational
Market functioning Note: Assessment of main risks by risk segments for markets under ESMA remit since last assessment, and outlook for forthcoming quarter. Assessment of main risks by risk categories and sources for markets under ESMA remit since last assessment, and outlook for forthcoming quarter. Risk assessment based on categorisation of the ESA Joint Committee. Colours indicate current risk intensity. Coding: green=potential risk, yellow=elevated risk, orange=high risk, red=very high risk. Upward arrows indicate an increase in risk intensities, downward arrows a decrease, horizontal arrows no change. Change is measured with respect to the previous quarter; the outlook refers to the forthcoming quarter. ESMA risk assessment is based on quantitative indicators and analyst judgement.
Our 4Q15 risk assessment remains materially unchanged from the previous quarters. Systemic stress
remained high, driven by the materialisation of key risks in emerging markets, in particular China. A
low interest rate environment still prevails in the EU, with low December EA inflation numbers and the
continued downward trend in commodity market prices. The increased difference in yields across
rating classes indicating a higher credit risk premium could also signal an end to yield compression.
This, in an environment of still-high return volatility and increased interconnectedness in the fund
sector, together with potentially thin liquidity on some more vulnerable markets, could amplify the risk
of a reversal in global risk premia.
Risk summary
Risk levels in the markets under ESMA remit
remained high, reflecting elevated risks for
investors, infrastructures and services, and the
financial system at large, as well as very high risks
in securities markets. We continue to consider
market risk very high, following materialisation of
the valuation risk. Our credit risk assessment
remains unchanged at very high levels. While still
at a lower level, liquidity risk is under scrutiny due
to ongoing concerns about the reduction of liquidity
provision on bond markets, while contagion and
operational risk remain unchanged at high and
elevated, respectively. Key risk sources remain
uncertainty with respect to emerging market
developments, in particular China; continued
downward pressure on commodity prices,
especially oil; and sustained pressure on
commodity-export-oriented emerging economies,
reinforced by potential weaknesses in market
functioning. Subsequent price movements and
volatility on EU or US equity markets reflected this
anxiety.
Systemic stress decreased at the beginning of
4Q15, following the elevated sovereign debt and
equity market tensions in 3Q15, to return to
2Q15 levels.
R.2 ESMA systemic stress indicator Systemic stress higher and volatile
-0.4
-0.2
0
0.2
0.4
0.6
Dec-12 Jun-13 Dec-13 Jun-14 Dec-14 Jun-15 Dec-15
Money market contribution Bond market contribution
Equity market contribution ESMA CISS
Correlation contribution
Note: ESMA version of the ECB-CISS indicator measuring systemic stress insecurities markets. It focuses on three financial market segments: equity, bondand money markets, aggregated through standard portfolio theory. It is based onsecurities market indicators such as volatilities and risk spreads.Sources: ECB, ESMA.

ESMA Report on Trends, Risks and Vulnerabilities No. 1, 2016 28
Risk sources
Macroeconomic environment: The
macroeconomic environment in the EU was
mixed in 4Q15 with, for example, low industrial
production in some core Member States and
lower-than-expected inflation in December. On
the other hand, the European Commission’s
Economic Sentiment Indicator improved
markedly in the EU at the end of the reporting
period and growth seemed to be back on a
positive trend in some peripheral countries.
Internationally, employment figures in the US
were good at the end of the reporting period;
despite disappointing news from the
manufacturing sector, this increases the
probability of a gradual rise in interest rates
following the Federal Reserve’s December
decision to increase rates for the first time in
nearly a decade. Uncertainty around emerging
market developments persisted, notably with
equity price swings, low growth prospects in
China and spillovers to other markets. Low
commodity prices also heavily impacted global
financial markets, due chiefly to the
repercussions on energy corporates and
emerging market commodity-exporting
countries. The EUR exchange rate held stable in
4Q15 versus the USD, GBP, and CHF, but
slightly less so against a basket of emerging
market currencies including CNY, IDR, MXN,
RUB and TRY, against which the EUR gained
around 10%.
Low-interest rate environment: In December the
Federal Reserve raised its Federal Funds Rate
to 0.5%, ending –a long-lasting near-zero cost-
of-borrowing policy. Good employment figures
are driving expectations that US interest rates
will gradually be increased in 2016. In the EA,
low inflation in December, coupled with the
continued EUR 1.1tn bond buying programme,
confirmed expectations of a prolonged low
interest rate environment. This was illustrated by
low sovereign risk premia and price earnings
ratios in the EA close to their long-term average.
In this environment of continued search for yield,
potentially low secondary-market liquidity could
still harbour the risk of a sudden reversal in
global risk premia.
EU sovereign debt markets: Following the
tensions fuelled by uncertainties around EU
sovereign debt developments in 3Q15, the
situation improved from August after agreement
was reached with Greece on an overall EUR
85bn bailout package and the successful
release of the first tranches. Most of the
emergency capital market measures were totally
or partially lifted towards the end of 4Q15. But
tensions around public debt were still present on
EU markets amid low growth prospects in some
core countries and persistently low inflation in an
environment of still-high EU sovereign debt
levels.
Funding patterns: Issuance was stable, if not
indeed higher, over the reporting period
compared to 4Q14. HY issuance remained the
same as in 3Q15, at EUR 12bn, although it was
still up on the EUR 8bn issued in 4Q14. IG
issuance also remained unchanged and
issuance of sovereign debt in the EU amounted
to EUR 240bn, somewhat lower than the EUR
273bn in 3Q14 but similar to issuance in the
same year-earlier period (EUR 242bn in 4Q14).
Covered bond issuance was sustained at EUR
37bn, slightly below the EUR 43bn issued in
3Q15 when a large number of deals in the
covered bond primary market led to an increase
in the issuance of covered bonds, but still well
above the EUR 26bn issued in 4Q14 (R.14).
Investment funds increased their leverage ratios
for bond funds and held them stable for other
fund types, while volatilities in returns within
almost all segments fell from the 3Q15 peak
(R.22) related to the spillovers from equity
market price swings in China.
Market functioning: Resilience in systems
remained a key concern following market
disturbances in the US after the Chinese market
crash, notably the mispricing of several ETFs.
More recently, newly established trading halt
facilities for Chinese securities markets were
suspended by local authorities amid volatile
trading and high uncertainty. Market circuit
breakers were called into question in China as
analysts and investors argued that they might
have amplified losses during market turmoil. In a
different context, the lifting of the emergency
capital market measures adopted by Greece in
3Q15 was implemented without any relevant
effects on EU markets outside Greece.
However, due to ongoing recapitalisation
processes the short selling ban was still partially
in place until the end of 4Q15 on shares of at
least one credit institution admitted to trading on
the Athens Exchange and the Multilateral
Trading Facility of “EN.A” (Alternative Market of
the Athens Exchange). This also affected all
depository receipts (ADRs, GDRs) representing
those shares.
Risk categories
Market risk – very high: After a market correction
in 3Q15, notably in the EU in the wake of the

ESMA Report on Trends, Risks and Vulnerabilities No. 1, 2016 29
Chinese stock market crash, volatility held the
high levels reached in 3Q15. Price-earnings
ratios remained around their historical average
in the EA despite the equity market price
correction and were well above these averages
in the US (R.5). In EU sovereign bond markets
risk premia decreased from the two previous
quarters (R.8). Implied bond market volatilities
increased further in 4Q15, after having
fluctuated around already high levels in 3Q15
(R.6). Although the increase is amplified by the
fact that short term interest rates are very low,
this is nevertheless a sign of expected
uncertainty over future price developments.
These movements were also related to concerns
over low secondary market liquidity. Commodity
markets were very volatile, reaching historical
lows as Brent Crude fell below USD 40 per
barrel and copper and aluminium traded at a six-
year low. Sliding oil prices eventually translated
onto global financial markets through their direct
impact on energy corporates and energy-
dependent countries, and also due to the fear of
negative second-round effects and their impact
on growth. Finally, USD-EUR exchange rate
volatility peaked around the Fed’s December
committee meeting, when rates were raised for
the first time in nearly a decade (R.7).
Liquidity risk – high: Liquidity pressures were still
high in 4Q15 although the equity illiquidity index
remained around its long term average (R.4).
Sovereign bid-ask spreads decreased slightly for
most reported countries and returned to end-
2014 levels (R.9). Corporate bond spreads,
having peaked towards the end of 3Q15, were
also stable, although at a relatively high level.
Nevertheless, the difference in yields across
rating classes indicates a higher credit risk
premium than during the first half of the year
(R.11). Various market participants are reporting
a structural reduction in liquidity provision on
corporate bond markets, rendering them more
vulnerable to liquidity shocks than other
markets, but unequivocal evidence is scarce.
Finally, with the exception of real-estate funds
return volatility for funds was still high (R. 22),
which could exacerbate market liquidity
tensions.
Contagion risk – high: Sovereign market
clustering increased at the beginning of 4Q15
only to decrease towards the end of the
reporting period without having reached the
highs of the previous quarters, while the
dispersion in yield correlations also decreased,
potentially reflecting a change in the core-
periphery structure of the EU sovereign market
(R.12). The intra-country correlation between
sovereign and corporate bonds entered negative
territory at the beginning of 4Q15, returning to
positive levels towards the end of the reporting
period, possibly signalling improved
diversification potential in securities markets
(R.13). In the hedge fund sector, intra-sector
contagion between hedge funds remained low,
both for funds balancing the sector’s
performance trend and for those reinforcing it
(R.26).
Credit risk – very high: Gross sovereign debt
issuance contracted in 4Q15. In non-sovereign
markets, issuance decreased for MBS, covered
bonds and hybrid capital, held broadly stable for
high-yield and investment grades and increased
only for ABS. However, net sovereign debt
issuance started to accelerate again at the
beginning of 4Q15 to end up positive over the
reporting period (net calculated as the difference
between new issuance and outstanding debt
maturing over the same period). Fund sector
volatilities, having peaked at the end of 3Q15,
returned to lower levels, while leverage
remained high for the fund industry. This gave
rise to unease, especially in an environment of
continued search for yield. Finally, concerns
were raised that declining oil prices might
increase the probability of default for all
corporates in to the energy sector.
Operational risk – elevated: Operational risk,
including technology and conduct risks,
remained a key concern both within and outside
the EU, as several events reignited disquiet over
potential technology fragilities in the financial
system during the previous quarters. The level
of dispersion in 3M Euribor submissions fell
slightly in 4Q15 while investigations into financial
benchmark manipulations, including interbank
interest reference rates, derivatives prices, oil
price benchmarks and exchange rates, continue
both in the EU and elsewhere.

ESMA Report on Trends, Risks and Vulnerabilities No. 1, 2016 30
Securities markets R.3
Risk summary Risk drivers
Risk level – Emerging market risk materialisation.
– Low-interest-rate environment and high asset valuations.
– Low EU growth and inflation prospects.
– Spillovers from the fall in commodity prices(oil)
Risk change from 3Q15
Outlook for 1Q16
Note: Assessment of main risk categories for markets under ESMA remit since past quarter, and outlook for current quarter. Systemic risk assessment based on categorisation of the ESA Joint Committee. Colours indicate current risk intensity. Coding: green=potential risk, yellow=elevated risk, orange=high risk, red=very high risk. Upward arrows indicate a risk increase, downward arrows a risk decrease. ESMA risk assessment based on quantitative indicators and analyst judgement.
R.4 R.5 Equity illiquidity Equity valuation Around long-term average Around long-term average in EA
R.6 R.7 Financial instruments volatilities Foreign exchange volatilities Increasing bond volatilities Higher volatility
R.8 R.9 Sovereign risk premia Sovereign liquidity Low levels Slight reduction in liquidity end-4Q15
0.55
0.60
0.65
Dec-13 Apr-14 Aug-14 Dec-14 Apr-15 Aug-15 Dec-15
Illiquidity index 2Y-MA
Note: Composite indicator of liquidity in the equity market for the currentEurostoxx 200 constituents, computed by applying the principal componentmethodology to six input liquidity measures (Amihud illiquidity coefficient, bid-ask spread, Hui-Heubel ratio, turnover value, inverse turnover ratio, MEC). Theindicator range is between 0 (higher liquidity) and 1 (lower liquidity).Sources: Thomson Reuters Datastream, ESMA.
0.00
1.00
2.00
3.00
4.00
Dec-11 Jun-12 Dec-12 Jun-13 Dec-13 Jun-14 Dec-14 Jun-15 Dec-15
Adjusted P/E EA Average EA
Adjusted P/E US Average US
Sources: Thomson Reuters Datastream, ESMA
R
Note: Monthly earnings adjusted for trends and cyclical factors via Kalman filtermethodology based on OECD leading indicators; units of standard deviation;averages computed from 8Y. Data available until the end of October 2015.Sources: Thomson Reuters Datastream, ESMA.
0
200
400
5Y 10Y
0153045
Dec-13 Apr-14 Aug-14 Dec-14 Apr-15 Aug-15 Dec-15
VSTOXX 1M VSTOXX 3M
VSTOXX 12M VSTOXX 24MNote: Implied volatilities on 1M forward ICAP Euro-Euribor swaptions measuredas prices indices. Below, Eurostoxx50 implied volatilities, measured as priceindices; %.Sources: Thomson Reuters Datastream, ESMA.
0
5
10
15
20
25
Dec-13 Apr-14 Aug-14 Dec-14 Apr-15 Aug-15 Dec-15
USD-EUR USD-GBP 5Y-MA EURNote: Implied volatilities for continuous options on exchange rates traded in theChicago Mercantile Exchange. 5Y-MA EUR is the five-year moving average forthe implied volatility for the options on the USD / EUR exchange rate.Sources: Thomson Reuters Datastream, ESMA.
0
4
8
12
16
20
0
1
2
3
4
5
Dec-13 Apr-14 Aug-14 Dec-14 Apr-15 Aug-15 Dec-15
PT IE IT ES GR (rhs)
Note: Selected 10Y EA sovereign bond risk premia (vs. DE Bunds), in %.Sources: Thomson Reuters Datastream, ESMA.
0
1
10
100
Dec-13 Jun-14 Dec-14 Jun-15 Dec-15
EU Median GR ITIE PT ES
Note: Liquidity measured as difference of ask and bid yields for 10Y sovereign bonds, in basis points. EU Median computed using data for 24 countries. Logarithmic scale.Sources: Bloomberg, ESMA.

ESMA Report on Trends, Risks and Vulnerabilities No. 1, 2016 31
R.10 R.11 CDS volumes Corporate bond spreads Stable Greater difference between rating classes
R.12 R.13 Dispersion in sovereign yield correlation Dispersion in sovereign-corporate yield correlation. Correlation fluctuating at lower level Lower correlation
R.14 R.15 Debt issuance growth Net sovereign debt issuance Higher issuance for ABS Positive net issuance
R.16 R.17 HY issuance Hybrid capital issuance and outstanding Still low in 4Q15 Lower issuance
0
5
10
15
20
25
Nov-13 Mar-14 Jul-14 Nov-14 Mar-15 Jul-15 Nov-15
DE ES FR IE IT PT
Note: Value of outstanding net notional sovereign CDS for selected countries;USD bn.Sources: DTCC, ESMA.
0
50
100
150
200
Dec-13 Apr-14 Aug-14 Dec-14 Apr-15 Aug-15 Dec-15
AAA AA A BBBNote: EA non-financial corporate bond spreads by rating between iBoxx non-financial corporate yields and ICAP euro euribor swap rates for differentmaturities, basis points.Sources: Thomson Reuters Datastream, ESMA.
-1.0
-0.5
0.0
0.5
1.0
Dec-13 Apr-14 Aug-14 Dec-14 Apr-15 Aug-15 Dec-15
Top 25% Core 50%Bottom 25% Median
Note: Dispersion of correlations between 10Y DE Bunds and other EUcountries' sovereign bond redemption yields over 60D rolling windows.Sources: Thomson Reuters Datastream, ESMA.
-1.0
-0.5
0.0
0.5
1.0
Dec-13 Apr-14 Aug-14 Dec-14 Apr-15 Aug-15 Dec-15
Top 25% Core 50%Bottom 25% Median
Note: Dispersion of correlation between Barclays Aggregate for corporate and10Y sovereign bond redemption yields for BE, ES,FI, FR, IT, NL.Sources: Thomson Reuters Datastream, ESMA.
-2
-1
0
1
2
SO
V
4Q
13
SO
V 4
Q1
4
SO
V 4
Q1
5
MM
4
Q1
3
MM
4Q
14
MM
4Q
15
CB
4
Q1
3
CB
4Q
14
CB
4Q
15
IG
4Q
13
IG 4
Q1
4
IG 4
Q1
5
HY
4Q
13
HY
4Q
14
HY
4Q
15
AB
S 4
Q1
3
AB
S 4
Q1
4
AB
S 4
Q1
5
MB
S 4
Q1
3
MB
S 4
Q1
4
MB
S 4
Q1
5
10% 90% Current MedianNote: Growth rates in issuance volume in per cent normalised by standarddeviation for the following bond classes: sovereign (Sov); money market (MM);covered bonds (CB); investment grade (IG); high-yield (HY); asset backedsecurities (ABS); mortgage backed securities (MBS). Percentiles computedfrom 11Q rolling window. All data include securities with a maturity higher than18M. Bars denote the range of values between the 10th and 90th percentiles.Sources: Dealogic, ESMA.
0
40
80
120
160
200
-40
-20
0
20
40
60
AT
BE
BG
CY
CZ
DE
DK
EE
EL
ES FI
FR
HR
HU IE IT LT
LU
LV
MT
NL
PL
PT
RO
SE SI
SK
UK
EU
1Y high 1Y low 15Q4
Note: Quartely net issuance of EU sovereign debt by country, EUR bn. Netissuance calculated as the difference between new issuance over the quarterand outstanding debt maturing over the quarter. Highest and lowest quarterlynet issuance in the past year are reported. EU total on right-hand scale.Sources: Dealogic, ESMA.
40
0
40
80
120
10Q4 11Q4 12Q4 13Q4 14Q4 15Q4
Europe North America Asia ex JP Latin America
Note: Quarterly data on high-yield corporate bond issuance by region of issue;EUR bn.Sources: Dealogic, ESMA.
0
150
300
450
600
750
900
0
5
10
15
20
25
30
35
10Q4 11Q4 12Q4 13Q4 14Q4 15Q4Outstanding (rhs) Issuance
5Y-MA Issuance
Note: Outstanding amount computed as the cumulated sum of previously issueddebt minus the cumulated matured debt prior to reference date. EUR bn.Sources: Dealogic, ESMA.

ESMA Report on Trends, Risks and Vulnerabilities No. 1, 2016 32
R.18 R.19 Debt maturity Debt redemption profile Stable or lengthened maturity profiles Stable or reduced redemption profiles
-0.6
-0.4
-0.2
0.0
0.2
0.4
0.6
Sovereigns Banks Industrials Utilities
EU AVG EU MIN (if on scale)
EU MAX (if on scale) CGIIPS
Non-CGIIPS
Note: Quarterly change in maturity of outstanding debt by sector and countrygroups in the EU, years. CGIIPS include CY, GR, IT, IE, PT and ES. Min and Maxmay not be displayed where they are out of the scale provided in the graph.Sources: Dealogic, ESMA.
2Q15 3Q15 4Q15 2Q15 3Q15 4Q15 2Q15 3Q15 4Q15 2Q15 3Q15 4Q15
-10
0
10
20
30
-40
0
40
80
120
4Q15 2Q16 4Q16 2Q17 4Q17 2Q18 4Q18
Th
ou
sa
nd
s
Banks Ind and Util
Financials (rhs) Banks -1Y
Ind and Util-1Y Financials -1Y (rhs)
Note: Quarterly redemptions over a 3Y-horizon by European private corporates(banks, non-bank financials, and industrials and utilities), current and changeover last year (dotted lines), EUR bn. Excluding bank redemptions to centralbanks.

ESMA Report on Trends, Risks and Vulnerabilities No. 1, 2016 33
Investors R.20
Risk summary Risk drivers
Risk level – High return volatility.
– Higher interconnectedness among funds.
– Low interest rates and sustained search for yield
– Funds’ exposures to commodities and EMs.
Risk change from 3Q15
Outlook for 1Q16
Note: Assessment of main risk categories for markets under ESMA remit since past quarter, and outlook for current quarter. Systemic risk assessment based on categorisation of the ESA Joint Committee. Colours indicate current risk intensity. Coding: green=potential risk, yellow=elevated risk, orange=high risk, red=very high risk. Upward arrows indicate a risk increase, downward arrows a risk decrease. ESMA risk assessment based on quantitative indicators and analyst judgement.
R.21 R.22 Cumulative investment fund flows RoR volatilities by fund type Outflows for funds with regional focus Still high after peak in 3Q15
R.23 R.24 Leverage by fund type excluding HFs Retail fund synthetic risk and reward indicator Stable or slight increase Highest risks in the commodity and equity fund segments
R.25 R.26 Financial market interconnectedness Hedge fund interconnectedness Overall increase Low levels of interconnectedness
-200
200
600
1,000
1,400
1,800
2,200
Dec-13 Apr-14 Aug-14 Dec-14 Apr-15 Aug-15 Dec-15
Europe BF Europe EF
Emerging markets BF Emerging markets EF
North America BF North America EF
Note: Cumulative net flows into bond and equity funds (BF and EF) over time since2004 by regional investment focus, EUR bn.Sources: Thomson Reuters Lipper, ESMA.
0
4
8
12
16
20
24
28
Dec-13 Apr-14 Aug-14 Dec-14 Apr-15 Aug-15 Dec-15
Alternatives Equity BondCommodity Mixed Real Estate
Note: Annualised 40D historical return volatility (%) of EU domiciled mutual funds.Sources: Thompson Reuter Lipper, ESMA.
1.0
1.1
1.2
1.3
Oct-13 Feb-14 Jun-14 Oct-14 Feb-15 Jun-15 Oct-15
Bond Equity Mixed Real estate
Note: EA Investment funds' leverage by fund type computed as the AuM/NAVratio.Sources: ECB, ESMA.
1234567
Dec-13 Apr-14 Aug-14 Dec-14 Apr-15 Aug-15 Dec-15
Equity Bond
Alternative Commodity
Money market Real estate
Note:The calculated Synthetic Risk and Reward Indicator is based on ESMASRRI guidelines. It is computed via a simple 5 year annualised volatilitymeasure which is then translated into categories 1-7 (with 7 representinghigher levels of volatility).Sources:Thomson Reuters Lipper, ESMA.
50
55
60
65
70
75
0
5
10
15
20
25
10Q3 11Q3 12Q3 13Q3 14Q3 15Q3
Total funds Hedge fundsBond funds MMFs (rhs)
Note: Loan and debt securities vis-à-vis MFI counterparts, as a share of totalassets. EA investment funds and MMFs, in %. Data until September 2015.Sources: ECB, ESMA.
-0.02
-0.01
0
0.01
0.02
Nov-11 Nov-12 Nov-13 Nov-14 Nov-15
Trend reinforcing HF (coeff. +) Trend Reverting HF (coeff. -)
Note: Systemic stress indicator based on products of fractions of regressions withpositive (negative) estimated coeffcient individual fund return's impact on averagereturn of sector significant at 99% level and respective average estimators.Coefficients stem from VAR models regressing individual fund returns on lags andgeneral financial markets indices. Measures aggregated across individualregressions. Data until November 2015.Sources: Barclayhedge, Eurekahedge, TASS, HFR, ESMA.

ESMA Report on Trends, Risks and Vulnerabilities No. 1, 2016 34
Infrastructures and services R.27
Risk summary Risk drivers
Risk level – Operational risks, incl. insufficient technology management,
cyber-attacks.
– Conduct risk, incl. intentional or accidental behaviour by
individuals, market abuse.
– Systemic relevance of individual operations, including size,
market share, complexity of operations, interconnectedness
with other infrastructures or financial activities and entities,
substitutability of systems.
Risk change from 3Q15
Outlook for 1Q16
Note: Assessment of main risk categories for markets under ESMA remit since past quarter, and outlook for current quarter. Systemic risk assessment based on categorisation of the ESA Joint Committee. Colours indicate current risk intensity. Coding: green=potential risk, yellow=elevated risk, orange=high risk, red=very high risk. Upward arrows indicate a risk increase, downward arrows a risk decrease. ESMA risk assessment based on quantitative indicators and analyst judgement.
R.28 R.29 IRS clearing Settlement fails Increase in clearing across all products Fluctuation, notably for corporate bonds
o%%%
R.30 R.31 Euribor – Dispersion of submissions Euribor – Variation in daily changes Level unchanged Peak in rate reductions
R.32 R.33 Euribor - Dispersion of submission levels Rating changes Decreased dispersion towards end-4Q15 Positive drift for covered bonds and structured finance
40
50
60
70
80
90
100
Dec-13 Apr-14 Aug-14 Dec-14 Apr-15 Aug-15 Dec-15
Swap OIS FRA Basis Swaps
Note: OTC interest rate derivatives cleared by CCPs, % ot total notionalamount.Sources: DTCC, ESMA.
0
1
2
3
4
5
6
Jan-14 May-14 Sep-14 Jan-15 May-15 Sep-15
Corporate bonds Equities Government bonds
Note: Share of failed settlement instructions in EU; % of value, 5D-MA. Free-of-payment transactions not considered.Sources: National Competent Authorities, ESMA.
0
0.2
0.4
0.6
0.8
Dec-13 Apr-14 Aug-14 Dec-14 Apr-15 Aug-15 Dec-15
Note: Normalised difference in percentage points between the highestcontribution submitted by panel banks and the corresponding Euribor rate. Thechart shows the maximum difference across the 8 Euribor tenors. The increasesince 2013 is linked to technical factors such as low Euribor rates. The spike inAugust 2014 reflects the fact that two panel banks submitted respectively a quotefor the two-week tenor which was 7 times higher than Euribor and a quote for the1M tenor which was 10 times higher than Euribor.Sources: Euribor-EBF, ESMA.
-0.2
0.0
0.2
0.4
0.6
0.0
0.2
0.4
0.6
0.8
1.0
Dec-13 Apr-14 Aug-14 Dec-14 Apr-15 Aug-15 Dec-15
Rate increase Rate unchanged
Rate reduction ECB refinancing rate (rhs)
Three-month Euribor (rhs)
Note: Number of banks changing their three-month Euribor submission from dayto day, %.Sources: Euribor-EBF, ESMA.
-0.2
0.0
0.2
0.4
0.6
Dec-13 Apr-14 Aug-14 Dec-14 Apr-15 Aug-15 Dec-15
Top 15% Core 70%
Bottom 15% 3M Euribor
Raw 3M Euribor ECB refinancing rate
Note:Dispersion of 3M Euribor submissions, in %. The "Raw 3M Euribor" rate iscalculated without trimming the top and bottom submissions of the panel for the3M Euribor.Sources: Euribor-EBF, ESMA.
-70%
-50%
-30%
-10%
10%
30%
1H10 1H11 1H12 1H13 1H14 1H15Non-financials FinancialsInsurances SovereignsStructured finance Covered bonds
Note: Drift of ratings from all credit rating agencies by asset class computed aspercentage number of upgrades minus percentage number of downgrades, %.Sources: CEREP, ESMA.

ESMA Report on Trends, Risks and Vulnerabilities No. 1, 2016 35
Vulnerabilities

ESMA Report on Trends, Risks and Vulnerabilities No. 1, 2016 36
Investor protection
MREL/TLAC requirements Contact: [email protected]
1
This article analyses the Minimum Requirement for Own Funds and Eligible Liabilities (MREL) and the
Total Loss-Absorbing Capital (TLAC) requirements for banks. These bail-in tools will complement the
prudential requirements and contribute to absorb losses in case of failure. They may also pose issues
in terms of the consistency of rules within and across jurisdictions and transparency around the
securities that will be considered eligible, the trigger levels for conversion or write-off and the setting
of the Point of Non-Viability (PONV). Investors should thus undertake a careful investment analysis
that considers the liability profile of the banks, the MREL/TLAC requirements and the local Resolution
Authority’s discretionary powers. For their part, regulators should strive to provide investors with as
much transparency as is possible without undermining the Resolution Authority. Similarly, consistency
in approaches to the ‘what’ and ‘when’ across jurisdictions will make the investment analysis more
robust.
Background1
In the aftermath of the financial crisis, global
financial regulators determined to adopt a more
robust position on financial institutions’ capital. A
key pillar of the approach is the Basel III Accord,
which was approved in 2011 and is to be
implemented between 2013 and 2019. The
Accord’s aim is to ensure that banks have
sufficient resources to withstand times of
financial distress through strengthening bank
capital requirements by increasing bank liquidity
and decreasing bank leverage. The renewed
capital requirements are further articulated
through required common equity Tier 1 and
capital buffers, while complementary liquidity
and leverage ratios have been introduced.
Within the EU, the Accord is implemented
through CRD IV2 and CRR
3, which transpose
the capital requirements into EU law.
Additionally, the EU approved in 2014 the
Banking Recovery and Resolution Directive
(BRRD)4, which entered into force on 1 January
2016. It contains policy on how Resolution
Authorities are to resolve a bank once it is
threatened with failure and establishes a set of
common tools available to European authorities
to deal with failing institutions. The tools
designed are fourfold: the sale of business, the
bridge institution, the asset separation and the
1 This article was co-authored by Patrick Armstrong and
Livia Polo Friz. 2 Directive 2013/36/EU.
3 Regulation (EU) No 575/2013.
4 Directive 2014/59/EU.
bail-in tool. The focus of this article is the bail-in
tool.
The criteria for determining the Minimum
Requirement for Own Funds and Eligible
Liabilities for bail-in are called MREL. With the
MREL, European authorities seek to ensure that
banks have enough liabilities to absorb losses in
case of failure, and therefore shareholders and
creditors will shoulder much of the
recapitalisation burden instead of tax-payers, as
was the case with earlier bail-outs.
Additionally, the Financial Stability Board (FSB)
has finalised5 its Total Loss-Absorbing Capacity
(TLAC) requirement for 30 (16 of which are
European) Globally Systemically Important
Banks (G-SIBs). The TLAC requirement needs
to be viewed in complement to the MREL. The
intent of TLAC is to limit the probability and
impact of the failure of a large globally
systemically important financial institution on
financial stability, i.e. to put an end to the “too-
big-to-fail” phenomenon.
There are a number of reasons for analysing
MREL and TLAC together. First, MREL and
TLAC have a similar objective, namely to ensure
that banks have sufficient capital to continue
functioning in times of financial distress. Second,
the TLAC requirement applies to a subset of
banks subject to MREL and can be viewed as a
still tighter version of MREL requirements. Third,
as banks prepare for MREL requirements, that
5 http://www.financialstabilityboard.org/2015/11/tlac-press-
release/

ESMA Report on Trends, Risks and Vulnerabilities No. 1, 2016 37
subset of banks must at the same time prepare
for TLAC, which is effective as from 2019. As a
result, when determining their financing needs
G-SIB banks need to take both MREL and TLAC
requirements into consideration, as they issue
securities which comply with both requirements.
ESMA is interested in the topic from the
investor’s standpoint. We recognize that bail-in
tools are a necessary departure from tax-payer-
based bank bail-outs and will help to ensure that
the banks have enough liabilities to absorb
losses in case of failure. However, these new
instruments also have implications that investors
should be aware of. They may pose issues in
terms of consistency of implementation across
jurisdictions and transparency around the
securities which will be considered eligible for
bail-in. Investors must be cautioned to undertake
a careful investment analysis that considers both
the liability profile of the institution and also
relevant MREL/TLAC requirements, localized
jurisdictional requirements and discretionary
powers. For their part, regulators should strive to
provide investors with as much transparency as
to what will be eligible collateral and when it will
be called upon, as is possible without
undermining the Resolution Authority.
Banking Recovery and Resolution
Directive: The bail-in tool
In order to prevent the circumvention of bail-in
rules and to avoid contagion effects, the BRRD
defines some minimum funds6, i.e. the MREL,
which each bank will need to hold and which will
be deemed eligible for bail-in if necessary. They
will be set on a case-by-case basis. The
rationale is that banks need always to have
sufficient loss-absorbing capacity, i.e. bail-in-
able capital.
The bail-in tool applies to failing or likely-to-fail
EU institutions. As outlined above, according to
the Directive such firms must cover losses to
their required capital levels with at least 8% of
the total liabilities (debt and equity). The
Directive calls for the establishment of a
resolution fund to act as a back-stop to bail-in.
The resolution fund will be set up in each
country so that by 2025 it reaches 1% of all
covered deposits of all the credit institutions
authorized in that country. In order to reach the
target level, banks will have to make annual
6 See Article 45 of Directive 2014/59/EU.
contributions based on their liabilities (excluding
own funds and covered deposits) adjusted for
risk7. Banks may request resolution financing
from the resolution funds during the bail-in
phase only after 8% of total liabilities including
own funds has been bailed in. As an additional
safeguard to contain losses, the resolution fund
contribution may not exceed 5% of the total
liabilities. Bail-in potentially applies to any
liabilities not backed by assets or collateral,
unless explicitly excluded in the BRRD8.
Resolution Authorities may, under exceptional
circumstances, decide to exclude other liabilities
based on a case-by-case analysis9.
The introduction of the resolution tools
envisaged in the BRRD provides national
authorities with common powers and
instruments to anticipate bank crises and
resolve financial institutions in an orderly
manner if a failure occurs, while at the same
time ensuring the continuity of essential bank
operations and minimising taxpayers’ exposure
to losses10
.
BRRD aims to ensure that banks will be safer,
as they will have committed resources available
to restore eventual losses. For investors,
however, the possibility of being bailed in raises
some issues with regard to transparency of the
actual risk, the probability of being subject to
bail-in, and the consistency of rules within and
across jurisdictions.
Features of MREL and TLAC
For the 16 European G-SIBs, the MREL
requirements will have to be evaluated together
with the TLAC regulations. MREL and TLAC
have been set up to pursue a similar objective,
that is to ensure that banks are endowed with
sufficient internal resources to compensate
potential losses and to continue functioning in
case of distress, without resorting to public funds
(as was the case with bail-out). However, MREL
and TLAC also differ in a number of ways.
7 http://www.consilium.europa.eu/uedocs/cms_data/docs/p
ressdata/en/ecofin/142492.pdf 8 See Article 44(2) of Directive 2014/59/EU.
9 See Article 44(3) of Directive 2014/59/EU.
10 European Council PR 9510/14.

ESMA Report on Trends, Risks and Vulnerabilities No. 1, 2016 38
– MREL is an EU legal requirement, while
TLAC rules are proposed by the Financial
Stability Board11
.
– TLAC regulates a subset of the institutions
regulated by MREL, that is, the G-SIBs.
– MREL does not impose any public disclosure
requirements, while TLAC does so at the
legal entity level.
– Whereas the level of MREL is bank-specific,
banks defined as G-SIBs under TLAC will be
required to have bail-in-able debt in the order
of at least 16% of Risk-Weighted Assets
(RWAs) in 2019 and at least 18% of RWAs in
202212
. In practice, as evident in Charts V.1
and V.2, the two metrics are similar, since
the level of RWAs is a fraction of total assets.
– MREL does not impose additional leverage
requirements, whereas TLAC requires G-
SIBs to hold at least twice the Basel III Tier 1
leverage ratio requirement, that is, at least
6% by 2019 and at least 6.75% by 2022.
– Finally, MREL potentially applies to all
instruments which satisfy the following
conditions: “the instrument is issued and fully
paid up, the liability is not owed to, secured
or guaranteed by the institution itself, the
purchase of the instrument was not funded
directly or indirectly by the institution, the
liability has a remaining maturity of at least
one year” and “the liability does not arise
from a derivative or (…) a deposit which is
preferred in the national insolvency law”13
.
On the other hand, liabilities eligible for TLAC
must: “be paid in, be unsecured, not be
subject to set off or netting rights that would
undermine their loss-absorbing capacity in
resolution, have a minimum remaining
contractual maturity of at least one year or be
perpetual, not be redeemable by the holder
(i.e. not contain an exercisable put) prior to
maturity14
.
11
The FSB is an international body established by the G-20 in 2009 which monitors and makes recommendations on the global financial system.
12 http://www.financialstabilityboard.org/2015/11/tlac-press-
release/ 13
See article 45(4) of Directive 2014/50/EU. 14
http://www.financialstabilityboard.org/2015/11/tlac-press-release/
V.1 Bail-in requirements Minimum 8% of total assets
V.2 TLAC requirements 16% of RWA in 2019
National initiatives for MREL/TLAC
eligibility
Even though they formally involve the globally
largest banks, the new prescriptions are
expected to have a wide reach in terms of the
set of banks which can potentially be required to
improve on their capital. Several national
initiatives to adapt to the new rules on
MREL/TLAC requirements have already taken
place in EU countries and others are ongoing.
National authorities must choose a strategy to
determine which instruments will be considered
eligible for bail-in and the order of loss
absorption in case of insolvency or failure.
However, they do have a certain degree of
discretion in terms of the possible approaches.
One key feature to be determined is the ranking
of senior unsecured debt in national insolvency
law. Standard capital prioritization views
Note: Percentages of Risk-Weighted Assets (RWAs). The combined buffer is givenby the sum of the capital conservation buffer (2.5%), the countercyclical capitalbuffer (0-2.5%) and the higher of systemic risk, G-SII and O-SII buffers (0-5%) for atotal between 2.5% and 10%. Pillar 2 can be above 2%.Sources: BIS, ESMA.
CET1 4.5%
AT1 1.5%
% of total assets
equivalent to % of RWA
T2 2.0%
Combined buffer 2.5-10%
Pillar 2 2.0%
MREL Eligible Instruments
Recapitalisation amount could
be larger or smaller, as
determined by RA on the basis
of resolution profile and RWA
8% MREL loss absorption threshold
8% loss absorption
threshold for participation to resolution
fund
Bank’s own buffer 1.0-2.0%
Loss
ab
sorp
tio
n a
mo
un
tR
ecap
ital
isat
ion
am
ou
nt
Note: Percentages of Risk-Weighted Assets (RWAs). The FSB has establishedthat TLAC capital will have to be at least 16% by 2019 and 18% by 2022. As to theleverage ratio, it will have to be at least 6% by 2019 and at least 6.75% by 2022.Source: ESMA.
CET1 4.5%
AT1 1.5%
Long-term unsecured
debt
Leverage Ratio 3.0%
T2 2.0%
TLAC Pillar 2
6%
0
10
20
30
40
50
60
70
80
90
0
5
10
15
20
25
Dec-09 Sep-10 Jun-11 Mar-12 Dec-12 Sep-13 Jun-14
FVC IFMMFs Other OFIRatio with other OFI Ratio without other OFI
0
10
20
30
40
50
60
70
80
90
0
5
10
15
20
25
Dec-09 Sep-10 Jun-11 Mar-12 Dec-12 Sep-13 Jun-14
FVC IFMMFs Other OFIRatio with other OFI Ratio without other OFI
0
10
20
30
40
50
60
70
80
90
0
5
10
15
20
25
Dec-09 Sep-10 Jun-11 Mar-12 Dec-12 Sep-13 Jun-14
FVC IFMMFs Other OFIRatio with other OFI Ratio without other OFI
0
10
20
30
40
50
60
70
80
90
0
5
10
15
20
25
Dec-09 Sep-10 Jun-11 Mar-12 Dec-12 Sep-13 Jun-14
FVC IFMMFs Other OFIRatio with other OFI Ratio without other OFI
0
10
20
30
40
50
60
70
80
90
0
5
10
15
20
25
Dec-09 Sep-10 Jun-11 Mar-12 Dec-12 Sep-13 Jun-14
FVC IFMMFs Other OFIRatio with other OFI Ratio without other OFI
0
10
20
30
40
50
60
70
80
90
0
5
10
15
20
25
Dec-09 Sep-10 Jun-11 Mar-12 Dec-12 Sep-13 Jun-14
FVC IFMMFs Other OFIRatio with other OFI Ratio without other OFI
0
10
20
30
40
50
60
70
80
90
0
5
10
15
20
25
Dec-09 Sep-10 Jun-11 Mar-12 Dec-12 Sep-13 Jun-14
FVC IFMMFs Other OFIRatio with other OFI Ratio without other OFI
0
10
20
30
40
50
60
70
80
90
0
5
10
15
20
25
Dec-09 Sep-10 Jun-11 Mar-12 Dec-12 Sep-13 Jun-14
FVC IFMMFs Other OFIRatio with other OFI Ratio without other OFI

ESMA Report on Trends, Risks and Vulnerabilities No. 1, 2016 39
subordinated debt as junior to senior debt, which
means that, in the case of a bail-in, it would
have to be written-down earlier than senior debt.
However, for TLAC purposes, part of the senior
liabilities will have to be made TLAC-eligible. In
addition, the general principle is that if a liability
ranks pari passu with non-eligible TLAC
liabilities, then it cannot also be TLAC-eligible
(No Creditor Worse-Off principle).
At a general level, debt can be subordinated in
three different ways: structurally, contractually
and statutorily.
– First, the structural approach envisages the
issuance of MREL/TLAC eligible debt
through a holding company (‘HoldCo’), either
already in existence or newly created. The
downside to this approach is that it increases
the firm’s structural complexity.
– Second, contractual subordination refers to
the issuance of Tier 2 capital. In this
approach, compliance with MREL/TLAC
would be ensured by simply increasing total
capital. The main advantage is that Tier 2
has regulatory capital recognition and the
instruments are already present and known
in the market. However, Tier 2 issuance is
the most expensive option for banks and can
affect spreads across asset classes for
relative pricing reasons. An alternative
contractual approach is for the bank to issue
subordinated debt (potential Tier 3
instruments) ranking between traditional Tier
2 and senior debt. This would be cheaper
than traditional Tier 2, but would add
complexity to the capital structure.
– The third and final approach would be the
statutory one, whereby the national
insolvency law would allow senior debt to be
MREL/TLAC-eligible. This would be the least
expensive option, since TLAC-eligibility could
apply retroactively if the national law allows it
and banks may potentially use existing
stocks of debt. Criteria for the bail-in-ability of
senior debt will depend on national regimes.
The main risk associated with this scenario is
lack of clarity, since senior debt would be
statutory but not contractually subordinated.
Moreover, certain bank treasuries would not
be able to purchase bail-in-able senior debt,
since G-SIBs’ claims on other G-SIBs’ TLAC
must be deducted from their own TLAC or
regulatory capital.
At the European level, two of the approaches
described above are predominant, namely the
structural and the statutory one. The structural
approach is that adopted by the United Kingdom
and Switzerland, where G-SIBs have started
issuing senior debt through HoldCos, which can
be bailed-in before the OpCo in the case of
failure. The statutory approach is the one being
adopted by France, Germany, Italy and Spain,
where changes in national laws are allowing
senior debt to be bail-in-able. The estimated
capital shortfall for European banks varies
widely. In 2015, for a sample of 64 banks (14 of
which are G-SIBs) the EBA estimated that if all
senior unsecured debt (with maturity above one
year) and uncovered deposits were feasibly and
credibly loss-absorbing, with an MREL threshold
at 8% of total liabilities and equity seven banks
would have a shortfall of EUR 13bn. If, on the
other hand, only equity and subordinated debt
are deemed eligible, the MREL shortfall is
estimated to reach around EUR 510bn across
47 banks15
.
To date, the European market remains
heterogeneous in terms of issuance. We
observe issuance of Tier 1 instruments coming
to market with different trigger levels, write-down
mechanisms, notional size, credit ratings and
listing venues. As shown in Chart V.3, Tier 1
issuance totalled EUR 72.2bn between October
2013 and October 2015, while Tier 2 issuance
reached EUR 117.8bn in the same period. The
so-called Tier 3 instruments have not yet been
issued.
V.3 Issuances of AT1 and T2 Majority of Tier 2 issuances
15
http://www.eba.europa.eu/documents/10180/1132900/EBA-RTS-2015-05+RTS+on+MREL+Criteria.pdf
0
2
4
6
8
10
12
14
16
18
20
Oct-13 Feb-14 Jun-14 Oct-14 Feb-15 Jun-15 Oct-15
Tier 1 Tier 2
Note: Amount issued in EUR bn.Sources:Dealogic, ESMA
0
10
20
30
40
50
60
70
80
90
0
5
10
15
20
25
Dec-09 Sep-10 Jun-11 Mar-12 Dec-12 Sep-13 Jun-14
FVC IFMMFs Other OFIRatio with other OFI Ratio without other OFI
0
10
20
30
40
50
60
70
80
90
0
5
10
15
20
25
Dec-09 Sep-10 Jun-11 Mar-12 Dec-12 Sep-13 Jun-14
FVC IFMMFs Other OFIRatio with other OFI Ratio without other OFI
0
10
20
30
40
50
60
70
80
90
0
5
10
15
20
25
Dec-09 Sep-10 Jun-11 Mar-12 Dec-12 Sep-13 Jun-14
FVC IFMMFs Other OFIRatio with other OFI Ratio without other OFI
0
10
20
30
40
50
60
70
80
90
0
5
10
15
20
25
Dec-09 Sep-10 Jun-11 Mar-12 Dec-12 Sep-13 Jun-14
FVC IFMMFs Other OFIRatio with other OFI Ratio without other OFI

ESMA Report on Trends, Risks and Vulnerabilities No. 1, 2016 40
Impact on investors
Lack of transparency with regard to the
known Point of Non-Viability or trigger point.
The Resolution Authority cannot know in
advance the exact circumstances in which an
institution approaches non-viability. There may
be a wide variety of circumstances or events,
both exogenous and endogenous, which bring
about failure. For that reason, forecasting in
advance the exact terms under which the
Resolution Authority will take action is difficult at
best. This creates uncertainty for investors as to
the precise conditions within which the
Resolution Authority will declare non-viability
and bail in the instrument. Investors must
appreciate this risk before undertaking such
investments.
Lack of consistency with regard to to the
terms of the MREL within a jurisdiction. The
Resolution Authority will determine eligible
capital for the MREL on a case-by-case basis
depending on the characteristics of a given
institution. Consequently, there is no set
required common minimum MREL. From an
investment standpoint, this may make
comparison of the risks across a given
jurisdiction challenging.
Lack of consistency with regard to the terms
of MREL across jurisdictions. As explained
above, bail-in potentially applies to any of an
institution’s liabilities not backed by assets or
collateral, unless explicitly excluded in the
BRRD. The Resolution Authority has the
discretion, in the interest of financial stability, to
exclude certain additional liabilities from the list
of bail-in-able securities. For example, the
approach taken by France, Germany, Italy and
Spain differs from that adopted by the UK and
Switzerland. In the former, legislation has been
drafted to allow existing debt instruments to be
made bail-in-able. In the latter, there has been a
greater push to issue new explicitly bail-in-able
instruments. This creates potential divergences
across jurisdictions and makes a comparative
investment analysis of institutions operating in
different jurisdictions challenging.
Differences between MREL and TLAC. MREL
is set as a ratio of eligible capital relative to Total
Assets while TLAC is expressed as eligible
capital as a percentage of RWAs and as a
leverage ratio, which may be another source of
confusion. Moreover, TLAC defines eligible
capital contractually, whereas under MREL the
Resolution Authority sets the amount of eligible
capital on a case-by-case basis. TLAC eligibility
and bail-in eligibility may not necessarily
coincide. Hence, a liability may be bail-in-eligible
but not TLAC-eligible. Investors need to be able
to assess the overall amount of liabilities as well
as the exact waterfall of write-down in order to
correctly price the risk and evaluate whether it
suits their risk-return profile. Unless the two
methods achieve convergence, investors may
struggle to reconcile the two approaches.
Risk mitigants
As for the lack of transparency risk, there are
existing obligations on the issuer in relation to
the public offers and/or admission to trading on
a regulated market; these would be determined
by the Prospectus Directive and relevant
national law in areas which fall within certain
exemptions or under certain thresholds set out
in that Directive. Where the financial instrument
is marketed, distributed or sold by a MiFID firm
(investment firm or credit institution), the usual
obligations in relation to pre-sale disclosure,
including disclosure of the relevant risks,
assessment of appropriateness, and, where
investment advice is provided, suitability would
apply16
. Moreover, there is some question as to
whether certain information in the possession of
the issuer is sufficiently material to require
disclosure consistent with the Market Abuse
Regulation.
In addition, with regard to the information for
investors on the likelihood of their being bailed
in, firms have to provide information to the client
about the financial instrument, including
“warnings of the risks associated with
investments in those instruments or in respect of
particular investment strategies”17
, both in cases
where investment advice is provided and where
it is not. The fact that the security is bail-in-able,
and the consequences for investors if it is bailed
in, are expected to be included in these
disclosures. Where investment advice is
provided, the adviser is obliged to ensure that
the instrument is suitable for the client. It should
be mentioned that ESMA has recently published
Guidelines on complex debt instruments under
MiFID II; in this context all bail-in-able debt
instruments are deemed complex and the
16
See Article 19 of MiFID 1, Articles 24-25 of MiFID 2. 17
See Article 19(3) of MiFID 1.

ESMA Report on Trends, Risks and Vulnerabilities No. 1, 2016 41
provision of “execution-only” services will never
be possible for these instruments18
.
In terms of the lack of harmonization risk within
and across jurisdictions it is important that
Resolution Authorities work together to try and
develop a harmonized set of rules that would
allow investors to evaluate with a greater degree
of confidence the risks associated with each
security. Harmonization could improve the
standardization of new instruments in the event
of their issue, further increasing understanding
for investors.
Conclusion
The MREL and TLAC requirements are
expected to strengthen banks’ position and
prevent situations of financial distress and
financial contagion. Banks will at all times need
to hold a minimum amount of securities which
satisfy eligibility conditions and can be either
converted or written-down in case of a shortfall
of capital. At the same time, it is possible that
the bail-in-ability of some securities will pose
new risks to investors due to the lack of
transparency and lack of harmonization within
and across jurisdictions.
As a consequence of the two factors mentioned
above, investors face uncertainty which may
prevent them from correctly assessing and
pricing risk and from understanding the concrete
probability of being bailed-in. Investors active in
more than one country will have to deal with
possible different approaches to recognition of
the subordination of debt. Different calculations
for MREL and TLAC further add to the
complexity. Such features may entail risks in the
area of consumer protection, since they make it
more difficult for investors to thoroughly assess
the suitability of the security to their own risk
profile.
18
See Article 19(3) of MiFID 1. See ESMA Guidelines on debt instruments and structured deposits (ESMA/2015/1783), published in November 2015, aimed at identifying certain categories of complex debt instruments for the purpose of Article 25(4) of MiFID II (so-called “execution-only” regime). The qualification as complex instruments implies that, when investment advice is not provided, investment firms will be required to ask clients or potential clients to provide information regarding their knowledge and experience in order to assess the appropriateness of these instruments for them. These guidelines will be applicable from the application date of MiFID 2 (3 January 2017) and are intended to enhance investor protection and reduce potential detriment associated with those instruments being sold to investors unable to understand the risks involved in such an investment.
Bail-in gives Resolution Authorities an innovative
tool to deal with failing institutions, and
regulation should help reduce uncertainty and
improve comprehension for investors. While
these rules are aimed at ensuring protection and
safety, more transparency and consistency is
needed to enable investors better to analyse
risks and to avoid excessive divergence of
approaches across the EU.

ESMA Report on Trends, Risks and Vulnerabilities No. 1, 2016 42
Investor protection
Financial innovation: Risk and benefit assessment Contact: [email protected]
1
This is the first of a two-part analysis of financial innovation. We provide the reader with an overview
of ESMA analytical process. This will be followed in an upcoming TRV with a detailed analysis of our
Financial Innovation scoreboard. ESMA has put in place a monitoring framework designed to ensure
that innovation does not undermine the core objectives of investor protection, financial stability and
orderly markets. In this article we outline the scope of our work, the sources of information we employ
and how we prioritize the work. We also outline some of the key challenges of monitoring financial
innovation across the EU. Finally, we outline how this monitoring process will support ESMA’s product
intervention powers which become effective with the new MIFID legislation.
Introduction 1
ESMA is charged with ensuring that the EU
national supervisory authorities achieve a
harmonised approach to the supervision and
regulation of innovative financial activities and
provide the EU institutions with relevant
advice. ESMA has appointed the Financial
Innovation Standing Committee (‘FISC’)2 to
undertake this work.
We employ the following definition for financial
innovation, (‘...the act of creating and
distributing new financial instruments,
processes, business models and markets,
including the new application of existing ideas
in a different market context.’)3 Over the past
three years, ESMA has put in place a
framework within which the analysis of
financial innovation can best take place. The
framework provides a principles-based
approach to the work both in terms of the
range of innovation we track as well as the
tools we employ. In designing the framework,
we have been guided by the three core
objectives of ESMA --- investor protection,
financial stability and orderly markets.
The ESMA objectives serve to ground the
analysis of financial innovation for a number of
reasons.
1 This article was authored by Patrick Armstrong.
2 Regulation (EU) No 1095/2010, Article 9.4.
3 Lerner, Josh; Tufano, Peter (2011): The
Consequences of Financial Innovation: A Counterfactual Research Agenda. In NBER Working Paper (w16780). page 5. Available online at http://www.nber.org/papers/w16780.
– First, while innovation in finance can
contribute to economic growth, some
financial innovation has been identified as a
factor that gave rise to financial instability
during the recent crisis. Analysing financial
innovation can assist supervisors, policy
makers and market participants to be more
aware of the types of innovations that may
give rise to financial instability and those
which support growth and prosperity.
– Second, innovations that lead to deliberate
misinformation or fraudulent behaviour
among market participants threaten orderly
markets. This in turn can lead to a loss of
confidence among investors and participant
withdrawal. Financial innovation analysis
can alert regulators to potential threats to
market integrity.
– Third, investor confidence is critical to the
robust functioning of markets. In the
monitoring of innovation the analysis
serves to guard against information
asymmetry. Investors should have
sufficient information as to the risk/return
profile of a product to make investment
decisions appropriate to their
circumstances and needs.
Importantly, we realize that financial innovation
has also beneficially contributed to the key
economic pillars through which finance
operates – providing a system of payments, a
means to pool funds for savings, mechanisms
to transfer savings for productive investments,
and ways in which to manage and optimize the
allocation of risk. In turn, innovation has
brought investors and consumers material
benefits, whether through the widespread use

ESMA Report on Trends, Risks and Vulnerabilities No. 1, 2016 43
of credit cards, the growth in index mutual
funds or access to futures and swaps to
manage risk. However, we have also observed
that those positive benefits originating from
financial innovation are sometimes overlooked
when the topic is discussed in favour of
adverse innovations tied to the financial crisis.
We bring to the subject a balanced approach,
both protective and supportive.
Challenges
The design of a framework to analyse financial
innovation across the EU is subject to certain
challenges.
– First is the heterogeneity of the financial
markets across the 28 Member States.
They differ in breadth, depth, volume, and
sophistication of market participants.
– Second is the concept of ‘innovation spiral’.
What may have been designed and
targeted to a given segment of
sophisticated market participants may over
time migrate to a market segment home to
less informed investors for whom the
product introduces unexpected risks.
– Third, our task is complicated by the fact
that when an innovation is newly introduced
its user base is typically narrow and in turn
its scope for creating systemic harm is
limited. Our challenge lies in recognizing
and inhibiting the growth in flawed products
before they become widely distributed.
– Fourth, we observe that the perceived
utilities of innovations are often
situation/time-dependent. Weaknesses in
certain innovations may only become
apparent during periods of extreme
illiquidity or economic crisis, e.g. U.S. sub-
prime securities.
– Fifth, our ability to monitor innovative
products using classical risk management
tools is limited. One of the primary
obstacles to understanding the risk profile
of newly introduced products is the lack of
time series information with which to
measure volatility and tail risk.
– Finally, we recognize the existence of the
‘regulatory dialectic’.4 The private sector
4 Kane, Edward J., 1981. "Accelerating Inflation,
Technological Innovation, and the Decreasing Effectiveness of Banking Regulation," Journal of Finance, 36 (May), 355-367.
has incentives and resources to respond
frequently to regulatory measures with
innovative tools, techniques and products
that seek to circumvent the intended
regulation.
Scope
In terms of innovation breadth, as market
regulators we focus most closely on the
securities markets; yet we remain aware of the
need to follow other markets, knowing that
innovations found in one sector, i.e. banking,
may migrate to the securities markets. In
defining innovation, we have included financial
innovations both in terms of products and
processes. By products we refer to an
innovative instrument or class of instruments,
such as an exchange traded fund. An
innovative process is an inventive way or
technique in which to produce and distribute
products or services to targeted participants in
financial or commodities markets.
Crowdfunding is an example of an innovative
process that leverages technology to attract
investors. However, we realize that the
differences between innovative products and
processes may at times be blurred, and for
that reason we will define innovation using a
functional approach so as not to overlook
innovations doing much the same thing, but
employing a different name. We employ a
variation on the Merton framework used to
define the core functions performed by
financial products or processes.5 In analysing
innovations we monitor those that may cause
potential detriment while also observing those
that may introduce potential benefits.
As to market participants, we track the life
cycle of innovation with the aim of monitoring
product originators, distributors and
intermediaries as well as the end investor, in
both institutional and retail markets. It is
important that we follow the growth and
development of products across market
5 ‘Financial Innovation is the act of creating and then
popularizing new financial instruments, as well as new financial technologies, institutions, and markets. The innovations are sometimes divided into product or process variants, with product innovations exemplified by new derivative contracts, new corporate securities, or new forms of pooled investment products, and process improvements typified by new means of distributing securities, processing transactions, or pricing transactions.’ Lerner, Josh and Peter Tufano, February 2011, “The consequences of financial innovation: a counterfactual research agenda, national bureau of economic research”.

ESMA Report on Trends, Risks and Vulnerabilities No. 1, 2016 44
sectors from origination to end investors for a
variety of reasons.
– First, products may be segregated to a
corner of the market but remain in need of
monitoring, such as products oriented and
limited to niche institutional investors. We
think most recently of synthetic CDOs,
which while not widely diffused, were
material contributors to the financial crisis.
On the other hand, we must also recognize
that there are complex products that are
targeted specifically towards retail investors
for which the institutional space has no
appetite, and structured retail products are
a ready example.
– Second, we recognize that over time
products evolve and those that may have
been designed for one segment may find
their way into other market segments. The
classic model of product innovation
suggests it is the sophisticated, less risk-
averse consumers that adopt a given
innovation in its early stages. Later, as the
product matures, it becomes more widely
diffused, accepted and employed. This is
true in finance, with exchange traded funds,
particularly in the US, providing an example
of a product that successfully diffused from
a small set of sophisticated institutional
investors to the retail market.
– Third, as the innovative product passes
from originator to distributor to end investor,
it is critical to ensure that information
disclosure and transparency remains in
place or is further targeted and enhanced.
– Finally with the realization that innovation
does not stop at the European waters’
edge, despite a primary EU focus our
horizon in following innovation is a global
one. Securities markets, more than most
other economic functions, operate
worldwide. In a complementary fashion, we
monitor localized Member State market
developments with an eye to determining
whether those developments are
reproduced elsewhere.
Regulation, support and
consistency
As outlined in our core objectives, our first duty
is to ensure investor protection. However, in
the pursuit of investor protection we may find
innovations that call for a higher level of
regulatory protection while at the same time
demanding a greater degree of support
through regulatory transparency or regulatory
convergence in order to grow. Crowdfunding
provides a good example of where, on the one
hand, there may be a need for greater
regulatory presence to protect investors given
the relatively unique characteristics of
crowdfunding that existing regulations had not
anticipated. On the other hand, in the absence
of an EU-wide directive on the topic of crowd-
funding, Member States have treated the
matter with differing levels of regulatory
intensity, and the absence of a more
harmonized approach to crowdfunding may
serve to stultify its development within the EU.
In this sense, we may seek to provide
proportionate and consistent regulatory
responses to allow for the growth of
crowdfunding consistent with our regulatory
aims.
Sources of information
The ways in which we source knowledge of
financial innovation is both a challenge and an
opportunity. There is no ‘cookbook’ to this
process dictating the steps we need to take to
track innovation. On the other hand, the
absence of a known accepted process gives
us an opportunity to build what we consider to
be the most effective framework. We look for
market intelligence from both qualitative and
quantitative sources.
– First, from the standpoint of product
providers, we have developed and continue
to nurture relationships with large globally
active financial institutions both on the buy
side and the sell side. These entities are all
closely involved in the development and
dispersion of financial products. As well we
have established productive relationships
with the major credit rating agencies that
see a wide breadth of innovative products
across the global markets.
– Second, as to users, we maintain close
contact with investors both retail and
institutional.
– Third, we have a broad dialogue with the
financial service consultant community,
whose work frequently provides objective
insights into market developments.
– Fourth, we have developed a working
relationship designed to share relevant
information with other global public
organisations interested in the topic of
financial innovation. Those organisations

ESMA Report on Trends, Risks and Vulnerabilities No. 1, 2016 45
include the OECD, IOSCO, the Financial
Stability Board as well as non-EU
regulators notably the US SEC, US Fed,
CFPB, FINRA, ASIC and the Hong Kong
Monetary Authority.
– Fifth and by no mean least, we look to our
28 Member States to report to us what they
are seeing in their markets. They are best
positioned and resourced to appreciate
local developments. It is then our work to
identify any patterns across the Member
States.
– Sixth, we closely follow developments
originating from the European Commission.
Along with the European Investment Bank
and the European Investment Fund it has
been actively involved in reviewing
innovative ways in which to revive
economic growth across the EU.
– Seventh, as to research we follow
academic publications and have access to
a number of market-based information
providers and data bases.
– Finally, our Consultative Working Group is
well-placed to contribute to our work.
Coming from the industry, academia and
consulting, the members bring to the topic
complementary insight, knowledge and
constructive criticism which we have found
most valuable.
Monitoring and filtering metrics:
Financial Innovation scoreboard
Innovations come to the market at a pace that
is impossible to track on an individual basis.
Moreover, the vast majority of these
innovations will fail and not survive to be
widely diffused. We nonetheless need to
determine how best to allocate our limited
resources to monitor innovations with the
potential to be both detrimental and beneficial.
In turn, we have developed what we view as a
structured methodology for evaluating
innovations in securities markets. The
methodology results in a scoring system that
better enables us to focus our attention.
The scoreboard methodology follows a
stepwise process.
– First, we seek to identify innovations. For
this process we rely heavily on the sources
of information described above, which
combine to provide us with the necessary
market intelligence.
– Second, we categorize the innovation by
type: is it a product, process or some other
form of innovation such as a marketing
method or inventive organizational
method? Additionally, we do not want to be
misled by the labelling of a given
innovation, so we further divide the
innovation by functional type as described
by Merton, i.e., is it a payment service,
pooling of funds, transferring resources
over time, managing risks, providing price
information, or addressing asymmetric
information/incentives problems?
– Third, we prioritize financial innovation
relative to the objectives of investor
protection, financial stability and market
integrity. The filtering is done by assigning
scores on criteria that are relevant to the
objective in question. Each of the
objectives has a set of risk factors that we
believe best reflects its unique
characteristics. The resulting scores rank
the innovation according to deemed threat
to the objectives.
– Fourth is the analytical stage of the process
where we try to better understand such
questions as the drivers of the innovation,
e.g., regulation, technology, competition.
We also analyse the market context in
which the innovation operates, the market
participants involved and the distribution
channels employed.
– Finally, based on the results of our analysis
we determine how to respond. Based on its
founding regulations ESMA may employ a
number of different legal instruments in
response. Before doing so, we ask a
number of fundamental questions as to the
innovation to better guide our action, such
as understanding the primary issue of
problem and urgency, and what outcome
are we hoping to achieve and what impact
would it have on the market. Our response
may come in the form of an Opinion,
Advice, Statement, Warning or ultimately
product intervention.
Product Intervention
With the upcoming implementation of MiFID,
ESMA may ‘….temporarily prohibit or restrict
the marketing, distribution or sale of certain
financial instruments...’ that address significant
investor protection concerns, that threaten the
orderly functioning and integrity of financial
markets or the stability of the whole or part of

ESMA Report on Trends, Risks and Vulnerabilities No. 1, 2016 46
the financial system. The Member State NCAs
will be granted a similar set of powers. Among
the conditions that must be met before the
powers can be employed is that the response
is proportionate and justified, non-
discriminatory, and not sufficiently addressed
by existing Union law or better supervision.
The preparatory work for this forthcoming
responsibility has involved two phases, with
Phase 1, largely conducted in 2015, assessing
the scope of the powers, understanding NCA
preparedness, developing the market
monitoring process and an assessment
framework to better understand whether the
conditions for acting are met. The preparatory
work in 2016 will include better understanding
of NCA market monitoring, assessing product
interventions already in place within NCAs on
which ESMA must opine, articulating a
detailed implementation process, raising
awareness across relevant ESMA standing
committees, and building a pipeline of issues.
By exercising its informal and formal powers,
ESMA will seek to meet its Investor Protection,
Financial Stability and Orderly Markets
objectives, while allowing appropriate freedom
to innovate. In short, only when the benefit of
mitigating detriment to investors and markets
outweighs limiting choice to a segment of
investors, can this material decision be
considered. What are some of the conditions
or circumstances that will give rise to such a
scenario? We can consider various instances
of material market failure, such as inadequate
level of competition or information asymmetry
that allows a product provider to act in ways
that are detrimental to investors. However,
given the enormity of any such action, it can
only be taken after thorough market analysis
confirms the source and severity of risk to
investors. We further recognize that the
absence of intervention cannot and should not
be viewed as implicit endorsements of
products. We must also recognize that at times
it is appropriate for a regulatory body to
intervene to stimulate innovations that will
serve society, businesses, and households.
Conclusion
We outlined at the beginning of this paper that
the framework for our financial innovation work
is a principles-based approach. In using this
approach we recognize that the topic of
innovation differs in magnitude from the vast
majority of work ESMA does in the policy
space. There is no Level I legal provision to
follow within the sphere of financial innovation.
The types of innovation and need for
innovation differ greatly across Member
States. In turn, our framework needs to remain
flexible and adaptive to market events. It also
needs the subtlety to know when to respond in
a supportive as opposed to a protective
manner. We intend to revisit the framework on
a regular basis to ensure it remains effective
and relevant.

ESMA Report on Trends, Risks and Vulnerabilities No. 1, 2016 47
Orderly markets
The central clearing land-scape in the EU Contact: [email protected]
1
This article gives an overview of the central clearing landscape in the EU within the EMIR framework.
In 2009, G20 leaders agreed that OTC derivative contracts should be cleared by Central
Counterparties (CCPs). The EMIR Regulation was adopted subsequently to implement this
commitment in the EU. Since the entry into force of EMIR on 16 August 2012, the process of CCP
authorisation has progressed, with sixteen CCPs having been authorised to operate in the EU. The
mandatory clearing requirement for several classes of OTC interest rate swaps and credit default
swaps should become applicable in 2016, and several interoperability arrangements are in place.
Introduction
During1 the financial crisis, events like the default
of Lehman Brothers or the bail-out of AIG exposed several problems with the functioning of OTC derivative markets. Excessive exposures, under-collateralisation of operations, deficient risk modelling, high interconnectedness of market participants, and a lack of transparency were contributors to the financial crisis. As a consequence, in 2009, G20 leaders agreed that OTC derivative contracts should be traded on exchanges or electronic trading platforms, that these operations should be cleared in central counterparties and that all OTC derivative transactions should be reported to trade repositories. The European Market Infrastructure Regulation (EMIR) was one of the measures adopted in the European Union (EU) to implement the G20 commitments together with MiFIDII/MiFIR trading obligation for derivatives.
Since entry into force of the EMIR Regulation
sixteen CCPs have been authorised to operate
in the EU, and some interest rate swaps as well
as the main index CDS have been proposed for
the clearing obligation. Central clearing and the
associated benefits, such as those related to
netting, for example a reduction in exposures
and liquidity demand during stressed market
conditions or the mutualisation and orderly
distribution of losses, are now at a more mature
stage in the EU.
The first part of this article gives an overview of
the CCPs that have been authorised to operate
in the EU, the second part is focused on the
clearing obligation procedures, and the last part
1 This article was authored by Yanis El Omari
describes the different interoperability
arrangements in place.
V.1 Selected EMIR definitions (REG (EU) No 648/2012 Article 2)
‘CCP’ means a legal person that interposes itself between the counterparties to the contracts traded on one or more financial markets, becoming the buyer to every seller and the seller to every buyer.
‘Clearing’ means the process of establishing positions, including the calculation of net obligations, and ensuring that financial instruments, cash, or both, are available to secure the exposures arising from those positions.
‘OTC derivative’ or ‘OTC derivative contract’ means a derivative contract the execution of which does not take place on a regulated market as within the meaning of Article 4(1)(14) of Directive 2004/39/EC or on a third- country market considered as equivalent to a regulated market in accordance with Article 19(6) of Directive 2004/39/EC.
‘Interoperability arrangement’ means an arrangement between two or more CCPs that involves cross-system execution of transactions.
Authorisation
Under EMIR, each EU CCP wishing to offer
services in the EU must be granted an
authorisation by the competent authority of the
Member State in which it is established. In
accordance with EMIR, the competent authority
in charge establishes a college of relevant
European competent authorities which gives an
opinion on the CCP authorisation, and on
extensions of authorisations, reviews of margin
setting models or the setting of interoperability
arrangements.

ESMA Report on Trends, Risks and Vulnerabilities No. 1, 2016 48
V.2 Composition of colleges of supervisors for CCPs (REG (EU) No 648/2012 Article 18(2))
The college shall consist of:
(a) ESMA;
(b) the CCP’s competent authority (Chair);
(c) the competent authorities responsible for the supervision of the clearing members of the CCP that are established in the three Member States with the largest contributions to the default fund of the CCP referred to in Article 42 on an aggregate basis over a one-year period;
(d) the competent authorities responsible for the supervision of trading venues served by the CCP;
(e) the competent authorities supervising CCPs with which interoperability arrangements have been established;
(f) the competent authorities supervising central securities depositories to which the CCP is linked;
(g) the relevant members of the ESCB responsible for the oversight of the CCP and the relevant members of the ESCB responsible for the oversight of the CCPs with which interoperability arrangements have been established;
(h) the central banks of issue of the most relevant Union currencies of the financial instruments cleared.
CCPs established in third countries (outside the
EU) and willing to provide clearing services to
EU clearing members or trading venues may do
so only when they are recognised by ESMA.
ESMA can recognise a CCP from a third country
under certain conditions including:
– the fact that the European Commission has
adopted so called “equivalence decisions” in
respect of the third-country in which they are
established, ensuring that CCPs authorised
in that third country are subject to regulatory
and supervisory legal requirements
equivalent to those of EMIR;
– the fact that the CCP is duly authorised in its
home country.
Before granting recognition, ESMA must consult
certain EU competent authorities (e.g.
competent authorities of EU clearing members
of the CCP, central banks of issue of Union
currencies cleared by the CCP).
To date, ESMA has recognised sixteen third-
country CCPs established in Australia, Canada,
Japan, Hong Kong, Mexico, Singapore and
South Africa.
Prudential requirements
When authorised to operate in the EU, a CCP is
then subject, inter alia, to a set of prudential
requirements. In order to be able to measure
and assess its liquidity and credit exposures with
respect to each of its clearing members or
another CCP with which it has concluded an
interoperability arrangement, a CCP should also
have timely access to all the relevant pricing
sources on a near to real-time basis.
Further to general requirements on business
conduct, proper capitalisation and operational risk
management procedures, margins are called
and collected by CCPs to limit credit exposures
with respect to clearing members. For OTC
derivatives, margins should cover, at least, losses
over a potential five-day liquidation period of the
asset, with a confidence interval of 99.5%.
In addition to margins, CCPs have to maintain a
pre-funded default fund to cover any losses that
exceed those already covered by margins. The
contribution to this default fund is proportional to
each clearing member’s exposure. The default
fund should cover, under extreme market
conditions, the default of the clearing member to
which it has the largest exposure or of the second
and third-largest clearing members if the sum of
their exposures is greater.
A CCP should also maintain enough “skin-in-the-
game” in the form of pre-funded available
financial resources to cover potential losses not
covered by the margins and the pre-funded
default fund. These additional available financial
resources should be available to the CCP and
should come on top of the CCP’s initial capital,
including retained earnings and reserves. The
overall financial resources of the CCP should be
large enough to withstand the default of at least
the two clearing members to which it has the
largest exposure, including under extreme but
plausible market conditions.
Finally, CCPs may require non-defaulting clearing
members to provide additional funds in the
event of a default of another clearing member.
More generally the exhaustion of financial
resources in case of default will occur following a
given default waterfall established by the
Regulation (V.3).
V.3
Default waterfall
Order Resources
1 Margins posted by a defaulting
clearing member Defaulting clearing
member’s resources 2
Default fund contribution of the
defaulting clearing member
3 CCP's own dedicated resources
or "skin-in-the-game" CCP own resources
4
Contributions to the default fund
of the non-defaulting clearing
members
Other clearing
members’ resources
Source: ESMA.

ESMA Report on Trends, Risks and Vulnerabilities No. 1, 2016 49
So far the list of EU CCPs authorised in the
union includes:
V.4 List of authorised CCPs in the EU
Securities Derivatives Other
EQ FI IR CD FX EQ Cdt
Nasdaq OMX Clearing (SE)
Y Y Y Y Y
European Central Counterparty (NL)
Y
KDPW_CCP (PL) Y Y Y Y Y Y Y
Eurex Clearing (DE) Y Y Y Y Y Y Y Y
CCG (IT) Y Y Y Y Y
LCH. Clearnet SA (FR) Y Y Y Y Y Y Y
European Commodity Clearing (DE)
Y Y
LCH. Clearnet Ltd (UK)
Y Y Y Y Y Y Y Y
Keler CCP (HU) Y Y Y Y Y Y Y Y
CME Clearing Europe (UK)
Y Y Y Y
CCP.A (AT) Y Y
LME Clear (UK) Y
BME Clearing (ES) Y Y Y Y Y Y Y
OMIClear-C.C. (PT)
Y
ICE Clear Netherlands (NL)
Y
Athex Clear (GR)
Y Y Y Y Y Y
Note: Securities: Equity (EQ), Debt (FI). Derivatives: Interest rate (IR), credit (CD), foreign exchange (FX), equity (EQ), Commodity (Cdt). Source: ESMA.
Clearing obligation
EMIR, with the overarching objective of reducing
systemic risk, states that certain classes of OTC
derivatives should be subject to a clearing
obligation. Although the clearing obligation
refers to OTC derivatives, CCPs do clear other
products such as derivatives traded on regulated
markets as well as cash equities or bonds, and
EMIR provisions on CCPs also apply to these
products.
In terms of procedure and in accordance with
EMIR, ESMA, after having consulted the
relevant stakeholders, has to develop and
submit to the European Commission draft
technical standards defining the classes of OTC
derivatives that should be subject to the clearing
obligation.
EMIR foresees two possible procedures for the
identification of classes of OTC derivatives to be
subject to the clearing obligation:
– the “bottom-up approach” in which the
determination of classes is based on
classes of assets already cleared by
authorised or recognised CCPs;
– the “top-down” approach according to which
ESMA on its own initiative identifies classes
that should be subject to the clearing
obligation but for which there is not yet a
clearing offer.
The different classes proposed for the clearing
obligation so far have resulted from the bottom-
up approach only.
In that context, ESMA consulted stakeholders
with a discussion paper2 and four consultation
papers. The first covered interest rate
derivatives denominated in EUR, GBP, JPY and
USD3, the second credit default swaps
4, the third
foreign exchange non-deliverable forwards5 and
the fourth interest rate derivative classes
denominated in CZK, DKK, HUF, NOK, PLN and
SEK6.
Having taken into account, in accordance with
EMIR, the degree of standardisation of the
relevant classes of OTC derivatives, their
volume and liquidity as well as the availability of
fair, reliable and generally accepted pricing
information on the given class of OTC
derivatives, ESMA proposed a clearing
obligation for some assets in the interest rate
and credit categories.
For interest rates, ESMA first proposed four
instruments: basis swaps, fixed-to-float interest
rate swaps, forward rate agreements and
overnight index swaps settled in four currencies
(EUR, USD, GBP, JPY). The RTS for this set of
instruments entered into force on 21 December
2015. In a draft RTS submitted to the European
2 2013/ESMA/925 Discussion Paper on the Clearing
Obligation published on 12 July 2013 3 2014/ESMA/799 Consultation Paper, Clearing Obligation
under EMIR No. 1 published on 11 July 2014 4 2014/ESMA/800 Consultation Paper, Clearing Obligation
under EMIR No. 2 published on 11 July 2014 5 2014/ESMA/1185 Consultation Paper, Clearing
Obligation under EMIR No. 3 published on 1 October 2014
6 2015/ESMA/807 Consultation Paper, Clearing Obligation
under EMIR No. 4 published on 11 May 2015
ESMA Report on Trends, Risks and Vulnerabilities No. 1, 2016 50
Commission ESMA recently proposed extension
of the clearing obligation to fixed-to-float interest
rates and forward rate agreements settled in
three additional currencies (NOK, PLN, SEK).
For credit derivatives, in an RTS submitted to
the European Commission ESMA proposed that
the following CDS classes be subject to the
clearing obligation: untranched indices with the
iTraxx Europe Main and the iTraxx Europe
Crossover (five-year tenor) as the underlying,
these two series being by far the most liquid of
the CDS index market (around 50% of total
index volume in trade count as of 2Q14). In
comparison, CDS single names, while
accounting for a large part of the credit OTC
derivative market, have a relatively more
moderate amount of activity on a reference-by-
reference basis. As a result, ESMA will continue
to monitor their activity but has not yet proposed
subjecting single names to the clearing
obligation.
For equity derivatives, taking into account the
feedback received during the consultation,
notably the fact that a clearing obligation would
require more time and consultation on the
relevant characteristics of products to be
cleared, the fact that the equity derivative market
is predominantly exchange based, and the need
for further international convergence, ESMA has
not proposed any class of equity derivatives for
the clearing obligation.
In the case of foreign-exchange non-
deliverable forwards (NDFs), given in particular
the limited experience of counterparties with
NDF clearing and the importance of international
consistency in the implementation schedule of
the clearing obligation, ESMA has not proposed
a clearing obligation on the NDF classes at this
stage.
Counterparties subject to these clearing
obligations are all financial counterparties and
non-financial counterparties (NFCs) for which
the non-hedging OTC derivative activity crosses
certain thresholds.
V.5 Non-financial counterparties’ activity
7
In February 2015, ESMA published as part of the EMIR review an analysis on the use of OTC derivatives by non-financial counterparties. On OTC derivative markets 27% of the counterparties are financials and 73% NFCs. But in terms of notional amounts, 98% is realized by financials and only 2% by NFCs. Among those NFCs, only less than 1% of counterparties have non-hedging exposure above the threshold, representing 16% of the amounts of all NFCs.
Nevertheless, a class by class analysis focusing on systemic risks reveals that among the different classes of OTC derivatives traded by NFCs only commodity and foreign exchange derivative classes can be considered systematically relevant when compared to derivative classes traded by financial counterparties.
Finally, ESMA found that particularly in the commodity asset classes, among the main market participants many groups of NFCs do not exceed the thresholds. ESMA therefore suggests that the European Commission may wish to revisit the way in which NFC+ (i.e. those that exceed the threshold and are thus subject to mandatory clearing) are identified, to ensure that the entities that qualify as NFC+ are in effect the ones that pose the most significant risks to the system, for example by aggregating the positions of NFC in OTC derivatives per asset class irrespective of their hedging or non-hedging nature.
Equivalent financial and non-financial
counterparties established in a third country
might also have to clear if they enter a
transaction that would have to be cleared with
an EU counterparty subject to clearing, or if the
transaction has a direct, substantial and
foreseeable effect within the EU.
Non-financial counterparties with non-hedging
exposure below the aforementioned thresholds
are exempt from clearing. Pension funds are
also exempt from clearing until 2017, and
transactions between companies belonging to
the same group are likewise exempt subject to
an approval or non-objection by their competent
authorities.
Finally, if a class of OTC derivatives no longer
has an authorised or recognised CCP in order to
clear its contracts, it ceases to be subject to the
clearing obligation.
7 ESMA EMIR Review Report No. 1, “Review on the use
of OTC derivatives by non-financial counterparties”.

ESMA Report on Trends, Risks and Vulnerabilities No. 1, 2016 51
V.6 Status of clearing obligations
Asset class Classes Status of RTS Interest Rate Basis, Fixed-to-
float, FRA and IOS in EUR, GBP, JPY and USD
RTS published in the Official Journal on 1 Dec 2015
Credit Index Credit Default Swaps
RTS delivered to the European Commission on 1 Oct 2015
Interest Rate FRA and Fixed-to-float swaps in NOK, PLN, SEK
RTS delivered to the European Commission on 10 Nov 2015
Equity Lookalike/Flexible equity derivatives and CFD
No RTS proposed at this stage
Foreign Exchange
Non-deliverable Forward (NDF)
No RTS proposed at this stage
Source: ESMA.
Interoperability arrangements8
EMIR defines an interoperability arrangement as
an arrangement between two or more CCPs that
involves a cross-system execution of
transactions, or in other words a reciprocal link
between the CCPs.
Given the complexities involved in an
interoperability arrangement on the clearing of
derivatives, the scope of EMIR provisions on
interoperability was restricted to transferable
securities and money market instruments. This
does not mean that arrangements on derivative
clearing are forbidden. They are indeed
authorised, but the framework described in
EMIR does not apply to the corresponding
arrangements. Nevertheless, the guidelines and
recommendations published by ESMA9 are
intended to be applied as a basis for national
competent authorities’ risk assessment to all
interoperability arrangements, including those on
derivatives. These guidelines are related to open
and fair access, risk identification and
monitoring, the deposit of collateral and
cooperation between national competent
authorities. Most EMIR items on interoperability
focus on risks and ensure that any extra or
different risks arising from interoperability
arrangements that would not arise for a
standalone CCP are taken into account.
Furthermore, according to EMIR, risk is the only
relevant basis on which the implementation of
an interoperability arrangement can be refused.
8 See ESMA’s final report on “The extension of the scope
of interoperability arrangements”. 9 ESMA “Guidelines and Recommendations for
establishing consistent, efficient and effective assessments of interoperability arrangements”.
V.7 Existing interoperability arrangements
Markets Interoperable CCPs
EQ
BATS Chi-X
EuroCCp NV SIX x-Clear LCH.Clearnet
Ltd
Burgundy EuroCCp NV SIX x-Clear
Aquis Exchange
EuroCCp NV SIX x-Clear LCH.Clearnet
Ltd
LSE EuroCCp NV SIX x-Clear LCH.Clearnet
Ltd
Turquoise EuroCCp NV SIX x-Clear LCH.Clearnet
Ltd
UBS MTF EuroCCp NV SIX x-Clear
Equiduct EuroCCp NV SIX x-Clear LCH.Clearnet
Ltd Oslo Børs/ Oslo Axess
LCH.Clearnet Ltd
Oslo Clearing
FI LCH.Clearnet
SA CCG
ETDs LCH.Clearnet
Ltd Oslo Clearing
Source: ESMA.
Most of the interoperability arrangements in
place in the EU are set for equity clearing. The
majority of these equity arrangements were
already in place before the entry into force of
EMIR, the exception being the arrangement
operating on the Oslo Børs/Oslo Axess market,
even though a Memorandum of Understanding
had been signed between the two CCPs back in
2009.
For government bonds, only one arrangement is
in place in the EU, between LCH.Clearnet SA
and Cassa di Compensazione e Garanzia
(CC&G). This arrangement, activated in 2004
and since then authorised and thus deemed
compliant with EMIR, covers the clearing of
outright transactions and repos on Italian
government bonds.
Finally, one (ETD) derivative interoperability
arrangement is in place between
LCH.Clearnet Ltd and Oslo Clearing, covering
index and single Norwegian stock futures and
options listed on Oslo Børs and Turquoise.
In its report on the extension of the scope of
interoperability arrangements published in July
2015, ESMA recommended extension of the
EMIR provision relating to interoperability
arrangements to ETD derivatives, while
mentioning that a further extension to OTC
derivatives should be assessed at a later stage.

ESMA Report on Trends, Risks and Vulnerabilities No. 1, 2016 52
Conclusion
Central clearing varies across Europe, both
geographically and in terms of assets cleared.
Its structure might still evolve in the coming
years, but the central clearing landscape in the
EU has already come a long way since the entry
into force of EMIR in 2012. Almost all EU CCPs
have now been re-authorised under EMIR, and
so have most of the related interoperability
arrangements. ESMA has analysed a large
number of OTC derivative classes to determine
whether they should be subject to the clearing
obligation and has proposed a clearing
obligation in the interest rate and credit asset
classes. Finally, in recent reports on how the
EMIR framework has been functioning, ESMA
has provided input and recommendations to the
European Commission, including
recommendations on amending EMIR in relation
to the clearing obligation and on recognition of
third country CCPs.

ESMA Report on Trends, Risks and Vulnerabilities No. 1, 2016 53
Financial stability
Collateral scarcity premia in EU repo markets Contact: [email protected]
1
This analysis focuses on the drivers of the cost of obtaining high-quality collateral in seven EU
countries over the last two years, covering two important changes in ECB monetary policy: The
introduction of a negative deposit rate in June 2014 and the launch of quantitative easing in January
2015. The analysis is based on a dataset matching information on European repo markets with
securities lending markets and bond-specific characteristics. Empirical results show that the cost of
obtaining high-quality collateral, proxied by specialness of government bond repos, increases with
demand in the cash market from short selling activities, even in calm financial conditions. In bear
market conditions – when good collateral is most needed – this may lead to tensions in some asset
market segments. Collateral reuse may alleviate these tensions, but requires transparency and
monitoring of risks from collateral chains. Understanding the drivers of specialness can help to identify
factors and practices liable to increase procyclicality in the financial system.
Introduction1
Collateral plays a very important and growing role in financial markets, enabling, for instance, dealers to finance their market-making activities and market participants to enter into derivative contracts
2. This role has become increasingly
significant since the crisis, due partly to regulatory reforms, but also to generally greater reliance on secured funding. Without good access to high-quality collateral, dealers and market participants would find it more costly to trade, with a negative impact on financial stability through reduced market liquidity and on the real economy through increased frictions in bond market financing for non-financial corporations.
Securities Financing Transactions (SFTs) play a
key role in supporting collateral fluidity – i.e.
collateral being in the right place, at the right
time, for the right entity – by ensuring collateral
flows to counterparties that need them for
regulatory and business purposes (Singh, 2013).
The principal types of SFTs are repos and
securities lending. A repo is the sale of
securities together with an agreement for the
1 This article was authored by Massimo Ferrari, Claudia
Guagliano and Julien Mazzacurati. It provides a non-technical summary of the forthcoming ESMA working paper “Collateral scarcity premia in EU repo markets”.
2 See Singh, M. (2014) “Collateral and Financial
Plumbing”, Risk publications; Duffie, D., M. Scheicher and G. Vuillemey (2015) "Central Clearing and Collateral Demand"), Journal of Financial Economics, Vol. 116, pp. 237-256.
seller to repurchase equivalent securities at a
later date. The repo rate is an annualized
interest rate capturing the difference between
the spot and forward prices. Securities lending is
an agreement whereby one party lends a
security to another party against a fee for a
limited period of time in exchange for either
other securities or cash. The two types of
instrument have many similarities and can
sometimes be used as substitutes for each
other, although the main categories of users are
typically different. The instruments are used
mainly to obtain funding or to source collateral
for a broad range of activities, including hedging,
liquidity management, trading, etc.
The objective of this article is to analyse the
drivers of the cost of obtaining high-quality
collateral, proxied by specialness of government
bond repos.
Specialness is defined as the difference
between the General Collateral (GC) repo rate
and the special collateral rate for a specific
instrument. GC assets are homogeneous liquid
securities used indiscriminately by market
participants for a certain rate (the GC rate)
driven by the usual supply and demand
dynamics. In GC repos, the choice of bond to be
delivered as collateral is made after the trade,
typically from a collateral pool (i.e. a basket of
securities meeting certain eligibility criteria).
Specific collateral repos, on the other hand, are
repos in which the collateral is known before the
trade is executed and has specific
characteristics. When these characteristics are

ESMA Report on Trends, Risks and Vulnerabilities No. 1, 2016 54
in high demand, such trades are known as
specials. Thus, special collateral (SC) rates tend
to be lower than GC rates3. Specialness can be
used as a proxy for the scarcity premium to be
paid for procuring a specific security (Duffie,
1996). Indeed, if a specific security becomes
more limited relative to existing demand, the
corresponding repo rate falls (the specialness of
the specific security increases). This may
happen in response to a reduction in the amount
of that security available or following an increase
in demand for that security on the cash market.
V.1 Securities Financing Transactions
4: At the core of
financial markets
Securities financing is an activity that consists in the temporary transfer of a security to a counterparty against collateral of equal or greater value, either in the form of cash or another security. SFTs are versatile instruments employed for various purposes by a wide variety of market participants. The various types of SFTs (repos, sell-buy backs, securities loans, etc.) have similar economic effects. Main uses include: funding, including from central banks; liquidity and collateral management; yield-enhancement strategies; short sales; and dividend tax arbitrage.
There are two types of repos: General Collateral (GC) transactions and specific collateral transactions. GC assets are liquid securities considered as being homogeneous and used indiscriminately by market participants for a certain rate (the GC rate) driven by the usual supply and demand dynamics. Specific collateral transactions, on the other hand, are repos in which the collateral is known before the trade is executed and has specific characteristics. When these characteristics are in high demand, the trades are known as specials. Buyers thus bid competitively for special collateral (SC), implying that SC rates are lower than GC rates. SC transactions are therefore security-driven transactions in which the collateral is specifically sought after, while GC deals are mainly cash-driven, implying different incentives for market participants. As a result, repo trading is based on different GC and SC rates.
The results of our empirical analysis show that
the cost of obtaining high-quality collateral
increases with demand in the cash market from
short selling activities, even in calm financial
conditions. In bear market conditions – when
good collateral is needed the most – this may
lead to tensions in some asset market
segments. Collateral reuse, by reducing the
collateral scarcity premium, may alleviate these
tensions but requires transparency and
monitoring of associated financial stability risks.
Both the negative deposit rate and central bank
3 While specific collateral is not always special, in the case
of sovereign repos it should be a reliable proxy. Indeed, the underlying sovereign bonds in our dataset are eligible for ECB refinancing (and therefore also for the Eurex GC Pooling ECB basket), implying that collateral providers should be able to borrow cash at the GC rate.
4 See ESMA TRV 2-2014, “The systemic relevance of
securities financing markets in the EU” for additional details.
asset purchases seem to affect regular repo
market dynamics. In particular, public sector
asset purchases as part of the ECB’s
Quantitative Easing (QE) may reduce the
available supply of high-quality collateral.
However, this is likely to be offset by the central
bank’s securities lending programmes.
Policy context
In the aftermath of the global financial crisis,
global regulators set out several policy
recommendations to address risks specific to
securities financing markets which were
perceived to have played a role in the crisis
(FSB, 2013). These risks included
interconnectedness between financial
institutions, increased system leverage, and
facilitated maturity and liquidity transformation
within shadow banks (FSB, 2012). The FSB
policy recommendations were followed in the EU
by a Regulation to increase the transparency of
SFTs adopted in December 2015.
The SFT Regulation aims to improve the
transparency of SFTs – mainly in the following
two ways: The Regulation requires all
transactions to be reported to Trade
Repositories and the data to be made available
to EU and national authorities.
The Regulation also improves the transparency
of reuse (any use of collateral by the collateral
taker for their own purposes) of financial
instruments by setting minimum conditions to be
met by the parties involved, including written
agreement and prior consent.
Most of the recent regulatory initiatives focus on
the risks that collateral may pose to financial
stability arising from the opacity of collateral
reuse, collateral management practices and
collateral valuation. For example, valuation is
thought to increase system procyclicality, as
easier (tighter) conditions on securities financing
transactions, e.g. changes in haircuts, tend to
increase (decrease) leverage when market
conditions are benign (deteriorating) (BIS,
2010).
Within this analytical framework, specialness,
which is the focus of this article, is of particular
interest. Specialness is a measure of the price of
the underlying collateral (Duffie, 1996).
Therefore, understanding what the drivers of
specialness are can help to single out individual
factors and practices liable to increase
procyclicality in the financial system.

ESMA Report on Trends, Risks and Vulnerabilities No. 1, 2016 55
The dataset
Our dataset covers the period between 7 March
2013 and 21 September 2015. The period
analysed includes two important changes in
ECB monetary policy: the introduction of a
negative rate on the deposit facility in June 2014
and the launch of quantitative easing in January
2015.
For repo variables, we rely on data from
RepoFundsRate (RFR), which include
information on repo transactions executed on
BrokerTec or MTS, two CCP-based electronic
trading platforms for euro repos. The data we
use are aggregated in two different ways: at
ISIN level and at country level. In both cases,
the data contain daily observations of CCP-
cleared repo transactions collateralized with
government bonds issued by seven EU
countries (Austria, Belgium, Finland, France,
Germany, Italy and the Netherlands).
At ISIN level, we define specialness as the
difference between the GC repo rate for country
i at time t and volume-weighted average repo
rate (VWAR) for ISIN i at time t:
Specialnessi,j,t= GCi,t-VWARi,j,t
Both the GC rate and SC rate decreased during
the period analysed, following changes in
monetary policy. In particular, both rates have
turned negative on average since June 2014
after the ECB introduced a negative interest rate
on its deposit facility (V.2).
During crisis periods more bonds tend to become special and investors may pay larger premia to acquire some specific securities. At the same time, very special bonds – the upper tail of the distribution – are particularly susceptible to changes in market demand, especially in periods of market stress (Corradin et al, 2015). Therefore, in crisis periods specialness distribution tends to become more
dispersed. In Chart V.3, which provides a graphical illustration of the distribution of specialness in our data, this particular feature is hardly predominant since we analyse a time period mainly characterised by very low interest rates and reduced volatility.
For each day and ISIN we are able to match the
data on the repo market with data on the
securities lending market.
The traditional securities lending channel is
captured in our data by lender quantity on loan,
i.e. the quantity of securities on loan from
lenders (mainly agency lending on behalf of
institutional investors, or proprietary lending from
investment funds, for example). However, lender
quantity on loan, which is relatively stable in
time, is not equal to the total amount of
securities on loan (quantity on loan). The
difference between the two quantities is a proxy
for broker-to-broker activity, which we use as a
proxy for collateral reuse5. When broker-to-
broker activity increases, this reflects strong
demand in cash bond markets that cannot be
satisfied by the classic securities lending chain
(V.4).
Utilisation rate is defined as the ratio between
lender quantity on loan and lendable quantity
(the quantity of securities in lending
programmes, i.e. a proxy of the supply of
collateral in the market). Utilisation rates are
recognised proxies for short-selling activity in the
cash market. Indeed, securities lending allows
short sellers to cover their bet against a security.
5 There are several reasons why broker-to-broker activity
can be used as a proxy for collateral reuse. First, lenders do not reuse non-cash collateral. Second, brokers almost exclusively use non-cash collateral, and peaks in broker-to-broker activity reflect either high demand for securities, limited availability, or a combination of both. Given that the lendable quantities of securities are relatively stable over time, the most likely adjustment variable is collateral reuse by brokers.
V.2
Repo rates and specialness Rates fall after introduction of a negative deposit rate
V.3
Distribution of specialness Dispersion remained low during sample period
-30
-10
10
30
50
Mar-13 Sep-13 Mar-14 Sep-14 Mar-15 Sep-15
GC rate SC rate Specialness
Note: Average specialness, GC and SC rates (country means). Weekly data in basis points. The vertical lines indicate, respectively, the introduction of negative deposit rate (grey) and the launch of ECB QE (blue).Sources: RepoFunds Rate (BrokerTec, MTS, ICAP), ESMA.
0
4
8
12
16
Mar-13 Sep-13 Mar-14 Sep-14 Mar-15 Sep-15
Median 75th perc 90th perc
Note: Median, 75th and 90th percentile of specialness, defined as the difference between GC and SC rate. Weekly data.Sources: RepoFunds Rate (BrokerTec, MTS, ICAP), ESMA.

ESMA Report on Trends, Risks and Vulnerabilities No. 1, 2016 56
Empirical approach
We employ panel data analysis to study how the
degree of specialness of a specific bond in the
repo market is affected by broker-to-broker
activity, short selling, bond-specific
characteristics and market dynamics. Our
baseline model is the following:
Specialnessit = i + (broker-to-broker activity)it
+ (short selling)it + (bond specific controls)it +
tt + it
where i is a bond-specific fixed effect and tt is a
time trend. Specialness measures the cost of
obtaining high quality collateral. We use broker-
to-broker activity as a proxy for the reuse of
collateral in the market. In normal times, we
expect a negative relation between broker-to-
broker activity and specialness: Greater reuse of
collateral increases the supply of securities. This
decreases the probability that these securities
are on special and reduces the scarcity
premium.
Short selling is proxied by the utilisation rate
(V.5). In line with previous literature we expect a
positive relation between short selling and
specialness. Indeed, if a trader sells short a
bond in the cash market, he or she is likely to
borrow this bond from securities lending markets
to cover the short position (see Duffie, 1996).
We include four dummy variables equal to one
when the bond is respectively “on the run” with
one-year maturity, with five-year maturity, with
seven-year maturity, or with ten-year maturity,
and zero otherwise (“off the run”)6. We use the
6 “On-the-run” bonds are the most recently issued
government debt securities within a maturity basket. They are typically more liquid than “off-the-run” bonds,
above dummies to investigate whether certain
maturities among the on-the-run bonds tend to
have a higher degree of specialness than
others. Moreover, we add a dummy variable
equal to one the first day a bond is off the run
and zero otherwise: We expect a negative
relation between this variable and specialness,
in line with previous literature showing that on-
the-run bonds are typically more special due to
their liquidity premium (Duffie, 1996;
Krishnamurthy, 2002).
We analyse three different sub periods: between
7 March 2013 and 11 June 2014 (date of the
introduction of negative interest rates on
deposits); between 11 June 2014 and
22 January 2015 (the launch of quantitative
easing); between 22 January 2015 and
21 September 2015. Our regressions are run
separately on the three periods since we expect
our variables of interest to respond differently
before and after the changes in monetary policy.
Results
Table V.6 shows the results for the whole
sample.
In the first period, before the introduction of the
negative interest rate on deposits, and in the
third period, after the launch of ECB QE7, we
find that collateral reuse is negatively related to
specialness. However, in the second period,
after the introduction of negative interest rates
on deposits, the relation between broker-to-
broker activity and specialness turns positive. A
which are older government debt securities within the same maturity basket.
7 The ECB QE focuses on bonds that are usually liquid
with a high degree of interdealer activity, and therefore such bonds tend to go on special more frequently, as in Duffie (1996).
V.4 Government debt securities on loan Broker-to-broker activity as adjustment variable
V.5 Government bond utilisation rates Heterogeneous across countries
0
100
200
300
400
Mar-13 Sep-13 Mar-14 Sep-14 Mar-15 Sep-15
Broker-to-broker activity Lender quantity on loanQuantity on loan
Note: Quantity of European government debt securities on loan, in billion of securities.Sources: Markit Securities Finance, ESMA.
0
10
20
30
40
50
60
Mar-13 Sep-13 Mar-14 Sep-14 Mar-15 Sep-15
AT BE DE FI
FR IT NLNote: Lender value on loan divided by lendable value, EA governmentbonds, in %.Sources: Markit Securities Finance, ESMA.

ESMA Report on Trends, Risks and Vulnerabilities No. 1, 2016 57
possible interpretation is that although a
negative deposit rate lowers both GC and SC
rates, the low interest rate environment and
prudential regulatory requirements caused
banks to scale back their GC repo business in
bonds, as a result of which inter-dealer activity
declined. Lower activity in this repo market
segment would translate into higher GC rates,
and therefore a larger scarcity premium.
As expected and consistent with the existing
literature, short-selling activity has a positive and
significant relation with specialness across
different periods. Indeed, short sales increase
demand and the relative scarcity of a bond, and
therefore the scarcity premium. The average
size of repo transactions is negatively and
generally significantly related to specialness,
meaning that larger transaction volumes tend to
reduce scarcity premia. This result is in line with
collateral borrower concentration, which also
has a negative effect on specialness – a lower
number of borrowers trading larger volumes
corresponds to lower premia.
V.6 Baseline model results Impact across sub-periods at ISIN level
Before Between After
(1a) (1b) (2a) (2b) (3a) (3b)
btb - *
- *
+ **
+ **
- **
- ***
utilis +
*** +
*** +
*** +
*** +
*** + *
size -
*** -
*** - *
- *
- ***
- ***
5Yon + *
+ *
+
+
-
-
1D off -
*** -
*** +
+
+
+
conc -
***
-
- **
Note: Before: 7 March 2013-10 June 2014; Between: 11 June 2014-21 January 2015; After: 22 January 2015-21 September 2015. btb: broker to broker activity; utilis: utilisation rate; size: average size of repo transaction; 5Yon: 5Y on the run; 1D off: first day off the run; Conc: collateral borrower concentration. ***p<0.01,**p<0.05,*p<0.1.
Country level analysis
Next, we look at country-level data using the
country indices made available by
RepoFundsRate.
The baseline model remains the same as in the
ISIN-level regression, with some small
differences. We run pooled OLS estimations
with robust standard errors using countries as
the cross-sectional dimension:
Specialnessit = + (broker-to-broker activity)it +
(short selling)it + (controls)t + Negt+ QEt+ εit
where specialness, utilisation rate and broker-to-
broker activity are defined as in the ISIN level
regression using securities lending data,
(controls)t is a vector of time-varying control
variables, and Negt and QEt are dummy
variables equal to one after the ECB sets a
negative deposit rate, and after the beginning of
the ECB QE programme respectively.
Table V.7 shows the results for the country-level
regressions. The coefficient signs of the short-
selling and broker-to-broker activity variables are
consistent with the repo market framework
introduced above, and the results of the ISIN-
level regressions. Almost all the coefficients are
significant at the 1% level, and results are robust
under various specifications.
The utilisation rate coefficient is consistently
positive and the collateral reuse coefficient
negative. As in the ISIN-level regression, a
negative coefficient reflects an increase in the
supply of collateral from reuse and results in a
lower premium.
V.7 Baseline model results Impact at country level
(1) (2) (3) (4) (5) (6)
(7)
btb -
*** -
*** -
*** -
*** -
*** -
*** -
***
utilis +
*** +
*** +
*** +
*** +
*** +
*** +
***
Neg +
*** +
***
+ ***
+ ***
+ ***
+ ***
QE +
***
+ ***
+ *
+ **
-
+
Neg-Util + *
Neg-btb +
***
QE-util +
***
QE-btb +
***
country No Yes Yes No No No
No
Note: btb: broker-to-broker activity; utilis: utilisation rate; Neg: dummy for negative deposit rates introduction; QE: dummy for the launch of ECB QE; Neg-Util and Neg-btb: variables interacting negative deposit rate dummy with utilisation rate and broker-to-broker activity; QE-util and QE-btb: variables interacting QE dummy with utilization rate and broker-to-broker activity. ***p<0.01,**p<0.05,*p<0.1.
The negative deposit rate and QE dummies
coefficients are positive and strongly significant,
reflecting the positive impact of these policy
developments on the collateral scarcity
premium. A negative deposit rate makes ECB
refinancing relatively cheaper and therefore
reduces liquidity-driven demand on repo
markets. Although ECB rates impact both GC
and SC rates, the asymmetric impact on repo

ESMA Report on Trends, Risks and Vulnerabilities No. 1, 2016 58
demand leads to relatively higher GC rates, i.e.
a larger scarcity premium. Interacting these two
dummy variables with the short-selling and
broker-to-broker variables, we observe three
things. First, the original QE dummy variable
becomes non-significant while the negative
deposit dummy variable remains statistically
significant, suggesting that the negative deposit
rate has a broader market impact while the
impact of QE on collateral scarcity premium only
feeds through short-selling and collateral reuse.
Second, both the negative deposit rate and QE
have a larger coefficient through collateral reuse
than through short selling. Taken together, these
three different elements highlight the magnitude
of changes introduced by the negative deposit
rate as well as the crucial role of reuse in
collateral markets.
V.8 Collateral reuse: Need for transparency
Most SFTs in Europe are title-of-transfer agreements that give full right of reuse to the collateral receiver, which has become a widespread practice in financial markets over the last decade.
Reuse of collateral provides liquidity and enables counterparties to reduce funding costs. However, it tends to create complex collateral chains between market participants, giving rise to financial stability risks. The lack of transparency on the extent to which collateral is reused can amplify risks to financial stability.
The new Regulation8 on the transparency of securities
financing transactions and of reuse recently adopted by the EU sets out minimum conditions to be met by the parties involved in SFTs, including disclosure and written agreement. This would ensure that clients or counterparties have to give their consent before reuse takes place and that they make decisions based on clear information on the risks that it might entail.
Conclusion
This article summarises our findings on the
drivers of the cost of obtaining high-quality
collateral, proxied by specialness of government
bond repos, in seven European countries over
the last two years. Without good access to high-
quality collateral, market participants would find
it more costly to trade, with a negative impact on
financial stability through reduced market
liquidity and on the real economy through
increased frictions in bond market financing for
non-financial corporations.
Empirical results show that the cost of obtaining
high-quality collateral increases with pressures
in the cash market (short selling activities), even
8 Regulation (EU) 2015/2365 of the European Parliament
and of the Council of 25 November 2015 on transparency of securities financing transactions and of reuse and amending Regulation (EU) No 648/2012
in calm financial conditions. In bear market
conditions – when good collateral is most
needed – this may lead to tensions in some
asset market segments. Collateral reuse may
alleviate these tensions, but requires
transparency and monitoring due to the risk
entailed in collateral chains.
The period analysed covers two important
changes in ECB monetary policy: the
introduction of negative deposit rates in June
2014 and the launch of quantitative easing in
January 2015. We observe a significant, albeit
marginal, impact of these two policy changes on
the scarcity premium. In the case of QE, this is
likely alleviated by the ECB and NCB securities
lending programmes, which would address
potential collateral shortages.
The availability of new data on SFTs coming
from the new EU Regulation will significantly
improve transparency in this market. For the
time being, the distribution of specialness (V.2)
will be used as an additional risk indicator in
ESMA TRV and Risk Dashboards to detect
stress in repo markets, for example arising from
short sales, or reduced collateral availability.
References
BIS (2010) “The role of margin requirements and
haircuts in procyclicality”, CGFS Publications No 36.
Corradin, S. and A. Maddaloni (2015) “The
Importance of Being Special: Repo Markets
during the Crisis,” working paper.
Duffie, D. (1996) “Special repo rates” Journal of
Finance 51, 493-526.
Duffie, D., M. Scheicher and G. Vuillemey
(2015) "Central Clearing and Collateral
Demand"), Journal of Financial Economics, Vol.
116, pp. 237-256.
FSB (2012) “FSB Report on Securities Lending
and Repos: Market Overview and Financial
Stability Issues”.
FSB (2013) “Strengthening Oversight and
Regulation of Shadow Banking. Policy
Framework for addressing Shadow Banking
Risks in Securities Lending and Repos”.
Singh, M. (2013) “Collateral and monetary
policy”, IMF Working Paper, WP/13/186.
Singh, M. (2014) “Collateral and Financial
Plumbing”, Risk Publications.

ESMA Report on Trends, Risks and Vulnerabilities No. 1, 2016 59
Annexes

ESMA Report on Trends, Risks and Vulnerabilities No. 1, 2016 60
Statistics
Securities markets
Market environment
A.1 A.2 Market price performance Market volatilities
A.3 A.4 Equity implied volatilities Euro exchange rate
A.5 A.6 Exchange rate volatility Market confidence
50
75
100
125
150
Dec-13 Apr-14 Aug-14 Dec-14 Apr-15 Aug-15 Dec-15
Equities CommoditiesCorporate bonds Sovereign bonds
Note: Return indices on EU equities (Datastream regional index), globalcommodities (S&P GSCI) converted to EUR, EA corporate and sovereignbonds (Iboxx Euro, all maturities). 02/12/2013=100Sources: Thomson Reuters Datastream, ESMA.
0
10
20
30
40
Dec-13 Apr-14 Aug-14 Dec-14 Apr-15 Aug-15 Dec-15
Equities Commodities
Corporate bonds Sovereign bonds
Note: Annualised 40D volatility of return indices on EU equities (Datastreamregional index), global commodities (S&P GSCI) converted to EUR, EAcorporate and sovereign bonds (Iboxx Euro all maturities), in %.Sources: Thomson Reuters Datastream, ESMA.
0
10
20
30
40
50
Dec-13 Apr-14 Aug-14 Dec-14 Apr-15 Aug-15 Dec-15
VSTOXX 1M VSTOXX 3M
VSTOXX 12M VSTOXX 24M
Note: Eurostoxx50 implied volatilities, measured as price indices; %.Sources: Thomson Reuters Datastream, ESMA.
70
80
90
100
110
Dec-13 Apr-14 Aug-14 Dec-14 Apr-15 Aug-15 Dec-15
USD JPY GBP
CHF Emerging 5Y-MA USD
Note: Spot exchange rates to Euro. Emerging is a weighted average (2013 GDP)of spot exchange rates for CNY, BRL, RUB, INR, MXN, IDR and TRY.02/12/2013=100. Increases in value represent an appreciation of EUR. 5Y-MA ofthe USD exchange rate.Sources: ECB, IMF, ESMA.
0
5
10
15
20
25
Dec-13 Apr-14 Aug-14 Dec-14 Apr-15 Aug-15 Dec-15
USD-EUR USD-GBP 5Y-MA EURNote: Implied volatilities for continuous options on exchange rates traded in theChicago Mercantile Exchange. 5Y-MA EUR is the five-year moving average forthe implied volatility for the options on the USD / EUR exchange rate.Sources: Thomson Reuters Datastream, ESMA.
-10
0
10
20
30
40
Dec-13 Apr-14 Aug-14 Dec-14 Apr-15 Aug-15 Dec-15Financial intermediation Insurance and pension fund.
Auxiliary activities Overall financial sector
5Y-MA OverallNote: European Commission survey of EU financial services sector andsubsectors (NACE Rev.2 64, 65, 66). Confidence indicators are averages of netbalance of responses to questions on development of the business situationover the past three months, evolution of demand over the past three months andexpectation of demand over the next three months, in % of answers received.Sources: European Commission, ESMA.

ESMA Report on Trends, Risks and Vulnerabilities No. 1, 2016 61
A.7 A.8 Portfolio investment inflows Portfolio investment outflows
A.9 A.10 Securities issuance Debt issuance
A.11 A.12 Equity issuance by sector Debt maturity
A.13 A.14 Securities investments Institutional financing
-75
-25
25
75
125
Oct-13 Feb-14 Jun-14 Oct-14 Feb-15 Jun-15 Oct-15Equities Short term debtLong term debt Net inflows
Note: Net inflows=BoP and international investment position. Portfolioinvestment liabilities of EA 19 (fixed composition) residents. Net transactionsover the period, EUR bn.Sources: ECB, ESMA.
-50
-25
0
25
50
75
Oct-13 Feb-14 Jun-14 Oct-14 Feb-15 Jun-15 Oct-15Equities Short term debtLong term debt Net outflows
Note: Net outflows=BoP and international investment position. Portfolioinvestment assets of EA 19 (fixed composition) residents. Net transactions overthe period, EUR bn.Sources: ECB, ESMA.
-250
0
250
500
750
10Q3 11Q3 12Q3 13Q3 14Q3 15Q3
Government debt NFC debtFinancial sector debt EquitySecuritised assets 1Y-MA markets1Y-MA loans
Note: Net issuance of debt securities, equities and securitised assets in the EA,by type of instrument and sector, in EUR bn. Securitised assets include ABS,MBS and covered bonds. Due to different netting and consolidationmethodologies, the data may not be fully reconcilable. 1Y-MA markets plots the1Y-MA of the aggregate of all assets displayed in columns. 1Y-MA loans plots1Y MA of loan-based financing.Sources: ECB, Dealogic, ESMA.
-2
-1
0
1
2
SO
V
4Q
13
SO
V 4
Q1
4
SO
V 4
Q1
5
MM
4
Q1
3
MM
4Q
14
MM
4Q
15
CB
4
Q1
3
CB
4Q
14
CB
4Q
15
IG
4Q
13
IG 4
Q1
4
IG 4
Q1
5
HY
4Q
13
HY
4Q
14
HY
4Q
15
AB
S 4
Q1
3
AB
S 4
Q1
4
AB
S 4
Q1
5
MB
S 4
Q1
3
MB
S 4
Q1
4
MB
S 4
Q1
5
10% 90% Current MedianNote: Growth rates of issuance volume in per cent normalised by standarddeviation for the following bond classes: sovereign (Sov); money market (MM);covered bonds (CB); investment grade (IG); high-yield (HY); asset backedsecurities (ABS); mortgage backed securities (MBS). Percentiles computedfrom 11Q rolling window. All data include securities with a maturity higher than18M. Bars denote the range of values between the 10th and 90th percentiles.Sources: Dealogic, ESMA.
0
20
40
60
80
10Q4 11Q4 12Q4 13Q4 14Q4 15Q4Utilities, mining and energy Industry and services
Real estate Finance
Note: EU equity issuance by sector, EUR bn. Finance includes closed-endfunds, finance corporations, holding companies and insurance companies.Sources: Dealogic, ESMA.
-0.6
-0.4
-0.2
0.0
0.2
0.4
0.6
Sovereigns Banks Industrials Utilities
EU AVG EU MIN (if on scale)
EU MAX (if on scale) CGIIPS
Non-CGIIPS
Note: Quarterly change in maturity of outstanding debt by sector and countrygroups in the EU, years. CGIIPS include CY, GR, IT, IE, PT and ES. Min and Maxmay not be displayed where they are out of the scale provided in the graph.Sources: Dealogic, ESMA.
2Q15 3Q15 4Q15 2Q15 3Q15 4Q15 2Q15 3Q15 4Q15 2Q15 3Q15 4Q15
-300
-150
0
150
300
450
600
10Q3 11Q3 12Q3 13Q3 14Q3 15Q3
Govt. and househ. Other financeInsurance and pensions MFIsNFC 1Y-MA
Note: Quarterly Sector Accounts. Investment flows by resident sector in equity(excluding investment fund shares) and debt securities, EUR bn. 1Y-MA=1Ymoving average of all investment flows.Sources: ECB, ESMA.
-200
-100
0
100
200
300
400
10Q3 11Q3 12Q3 13Q3 14Q3 15Q3Other Hedge funds
Real estate funds Bond funds
Equity funds Insurance and pensions
1Y-MANote: EA institutional investment flows by type of investor, EUR bn. Other=financial vehicle corporations, mixed funds, other funds. EUR bn. 1Y-MA=1Ymoving average of all investment flows. 1Y-MA not shown for 10Q2 and 10Q3as not all series are available for 2009.Sources: ECB, ESMA.

ESMA Report on Trends, Risks and Vulnerabilities No. 1, 2016 62
Equity markets
A.15 A.16 Issuance by deal type Price performance
A.17 A.18 Price-earnings ratios Price dispersion
A.19 A.20 Volatility Illiquidity indicator
A.21 A.22 Bid-ask spreads Liquidity dispersion
0
100
200
300
400
0
20
40
60
80
10Q4 11Q4 12Q4 13Q4 14Q4 15Q4
Value of FOs Value of IPOs5Y-MA IPO+FO Number of deals (rhs)
Note: EU deal value and number of deals of IPO and Follow on issuance. EUR bn. 5Y-MA for the sum of deal values.Sources: Dealogic, ESMA.
80
100
120
140
Dec-13 Apr-14 Aug-14 Dec-14 Apr-15 Aug-15 Dec-15
EU US JP
Note: Datastream regional equity indices for the EU, the US and Japan, indexedwith 02/12/2013=100. Indices in their regional currency.Sources: Thomson Reuters Datastream, ESMA.
0.00
1.00
2.00
3.00
4.00
Dec-11 Jun-12 Dec-12 Jun-13 Dec-13 Jun-14 Dec-14 Jun-15 Dec-15
Adjusted P/E EA Average EA
Adjusted P/E US Average US
Sources: Thomson Reuters Datastream, ESMA
R
Note: Monthly earnings adjusted for trends and cyclical factors via Kalman filtermethodology based on OECD leading indicators; units of standard deviation;averages computed from 8Y. Data available until the end of October 2015.Sources: Thomson Reuters Datastream, ESMA.
25
50
75
100
125
150
175
Dec-13 Apr-14 Aug-14 Dec-14 Apr-15 Aug-15 Dec-15
Top 25% Core 50%Bottom 25% Median
Note: Dispersion of 26 of the main national equity indices in the EU, indexedwith 02/12/2013=100.Sources: Thomson Reuters Datastream, ESMA.
0
10
20
30
40
50
Dec-13 Apr-14 Aug-14 Dec-14 Apr-15 Aug-15 Dec-15VIX (US) VSTOXX 5Y-MA VSTOXX
Note: Implied volatility of EuroStoxx50 (VSTOXX) and S&P 500 (VIX), %.Sources: Thomson Reuters Datastream, ESMA.
0.58
0.59
0.60
0.61
0.62
Dec-13 Apr-14 Aug-14 Dec-14 Apr-15 Aug-15 Dec-15
Illiquidity index 2Y-MA
Note: Composite indicator of liquidity in the equity market for the currentEurostoxx 200 constituents, computed by applying the principal componentmethodology to six input liquidity measures (Amihud illiquidity coefficient, bid-ask spread, Hui-Heubel ratio, turnover value, inverse turnover ratio, MEC). Theindicator range is between 0 (higher liquidity) and 1 (lower liquidity).Sources: Thomson Reuters Datastream, ESMA.
0.00
0.02
0.04
0.06
0.08
0.10
Dec-13 Apr-14 Aug-14 Dec-14 Apr-15 Aug-15 Dec-15
Liquidity indicator 40D-MA 5Y-MA
Note: Liquidity measures as median of the bid-ask price percentage differenceof the current EU constituents of Stoxx Europe Large 200. %.Sources: Thomson Reuters Datastream, ESMA.
0
1
2
3
4
Jan-14 May-14 Sep-14 Jan-15 May-15 Sep-15 Jan-16Top 25% Core 50%
Bottom 25% MedianNote: Dispersion across EU countries of the national median bid-ask pricepercentage difference for the current EU constituents of the main nationalindices, %. Truncated at 4% for clarity purposes. No data for HR, CY, EE, LV,LT, MT and SK.Sources: Thomson Reuters Datastream, ESMA.

ESMA Report on Trends, Risks and Vulnerabilities No. 1, 2016 63
Sovereign-bond markets
A.23 A.24 Issuance and outstanding Issuance by credit rating
A.25 A.26 Net issuance by country 10Y yields
A.27 A.28 10Y spreads Yield dispersion
A.29 A.30 Volatility Yield correlation dispersion
0
100
200
300
400
0
2
4
6
8
10
12
14
10Q4 11Q4 12Q4 13Q4 14Q4 15Q4
Outstanding EA Outstanding EU ex.EA
Euro area issuance (rhs) EU ex.EA issuance (rhs)
5Y-MA EU (rhs)
Note: Quarterly issuance (rhs), EUR bn, and outstanding debt (lhs), EUR tn.Amounts outstanding after 15Q2 forecasted.Sources: Dealogic, Eurostat, AMECO, ESMA.
13
15
17
19
21
0
100
200
300
400
10Q4 11Q4 12Q4 13Q4 14Q4 15Q4
Below AA- AA+ to AA-AAA 5Y-MAAvg Rating (rhs)
Note: Quarterly issuance in the EU ranked by S&P ratings at launch, EUR bn.Weighted average rating computed by converting ratings into a numeric scale(AAA=21, AA+=20, etc).Sources: Dealogic, ESMA.
AAA
AA
A+
A-
BBB
0
40
80
120
160
200
-40
-20
0
20
40
60
AT
BE
BG
CY
CZ
DE
DK
EE
EL
ES FI
FR
HR
HU IE IT LT
LU
LV
MT
NL
PL
PT
RO
SE SI
SK
UK
EU
1Y high 1Y low 15Q4
Note: Quartely net issuance of EU sovereign debt by country, EUR bn. Netissuance calculated as the difference between new issuance over the quarterand outstanding debt maturing over the quarter. Highest and lowest quarterlynet issuance in the past year are reported. EU total on right-hand scale.Sources: Dealogic, ESMA.
0
1
2
3
4
5
Dec-13 Apr-14 Aug-14 Dec-14 Apr-15 Aug-15 Dec-15DE BE ESFR IT SEGB 5Y-MA
Note: Yields on 10Y sovereign bonds, selected EU members, %. 5Y-MA=5Ymoving average of EA 10Y bond indices computed by Datastream.Sources: Thomson Reuters Datastream, ESMA.
0
4
8
12
16
20
0
1
2
3
4
5
Dec-13 Apr-14 Aug-14 Dec-14 Apr-15 Aug-15 Dec-15
PT IE IT ES GR (rhs)
Note: Selected 10Y EA sovereign bond risk premia (vs. DE Bunds), in %.Sources: Thomson Reuters Datastream, ESMA.
0
4
8
12
16
20
Dec-13 Apr-14 Aug-14 Dec-14 Apr-15 Aug-15 Dec-15
Top 25% Core 50%
Bottom 25% Median
Note: Dispersion of yields on 10Y sovereign bonds of EU 17 countries, in %.Sources: Thomson Reuters Datastream, ESMA.
0
5
10
15
Dec-13 Apr-14 Aug-14 Dec-14 Apr-15 Aug-15 Dec-15DE BE ESFR IT SEGB 5Y-MA
Note: Annualised 40D volatility of 10Y sovereign bonds, selected EU members,%. 5Y-MA=5Y moving average of EA 10Y bond indices computed by Datastream.Sources: Thomson Reuters Datastream, ESMA.
-1.0
-0.5
0.0
0.5
1.0
Dec-13 Apr-14 Aug-14 Dec-14 Apr-15 Aug-15 Dec-15
Top 25% Core 50%Bottom 25% Median
Note: Dispersion of correlations between 10Y DE Bunds and other EUcountries' sovereign bond redemption yields over 60D rolling windows.Sources: Thomson Reuters Datastream, ESMA.

ESMA Report on Trends, Risks and Vulnerabilities No. 1, 2016 64
A.31 A.32 CDS spreads CDS volumes
A.33 A.34 Liquidity Liquidity dispersion
Corporate-bond markets
A.35 A.36 Issuance by instrument type Issuance by sector
A.37 A.38 High-yield issuance Debt redemption profile by sector
0
50
100
150
200
Dec-13 Apr-14 Aug-14 Dec-14 Apr-15 Aug-15 Dec-15
EU US 5Y-MA EU
Note: Datastream CDS sovereign indices (5 years, mid-spread).Sources: Thomson Reuters Datastream, ESMA.
0
5
10
15
20
25
Nov-13 Mar-14 Jul-14 Nov-14 Mar-15 Jul-15 Nov-15
DE ES FR IE IT PT
Note: Value of outstanding net notional sovereign CDS for selected countries;USD bn.Sources: DTCC, ESMA.
0
1
2
3
4
5
6
Dec-13 Apr-14 Aug-14 Dec-14 Apr-15 Aug-15 Dec-15
Liquidity indicator 40D-MA 5Y-MA
Note: Liquidity measured as median across countries of the difference in bid-ask yields for 10Y sovereign bonds, in basis points. 24 EU countries are included.Sources: Bloomberg, ESMA.
0
20
40
60
80
100
Jan-14 May-14 Sep-14 Jan-15 May-15 Sep-15 Jan-16
Top 25% Core 50% Bottom 25% Median
Note: Dispersion of liquidity measured as median across countries of thedifference in ask and bid yields for 10Y sovereign bonds, in basis points. 24 EUcountries are included.Sources: Bloomberg, ESMA.
0
100
200
300
400
500
10Q4 11Q4 12Q4 13Q4 14Q4 15Q4
Covered bond Corp. bond and MTNABS and MBS 5Y-MA
Note: Quarterly debt issuance in EU by deal type, EUR bn.Sources: Dealogic, ESMA.
0
100
200
300
400
500
10Q4 11Q4 12Q4 13Q4 14Q4 15Q4
Other CorporatesBanks 5Y-MA
Note: Quarterly debt issuance in EU by sector, EUR bn.Sources: Dealogic, ESMA.
40
0
40
80
120
10Q4 11Q4 12Q4 13Q4 14Q4 15Q4
Europe North America Asia ex JP Latin America
Note: Quarterly data on high-yield corporate bond issuance by region of issue;EUR bn.Sources: Dealogic, ESMA.
0
5
10
15
20
25
0
20
40
60
80
100
4Q15 2Q16 4Q16 2Q17 4Q17 2Q18 4Q18
Th
ou
sa
nd
s
Banks Ind and Util Financials (rhs)
Note: Quarterly redemptions over a 3Y horizon by European private corporates(banks, non-bank financials, and industrials and utilities), EUR bn. Excludingbank redemptions to central banks.Sources: Dealogic, ESMA.
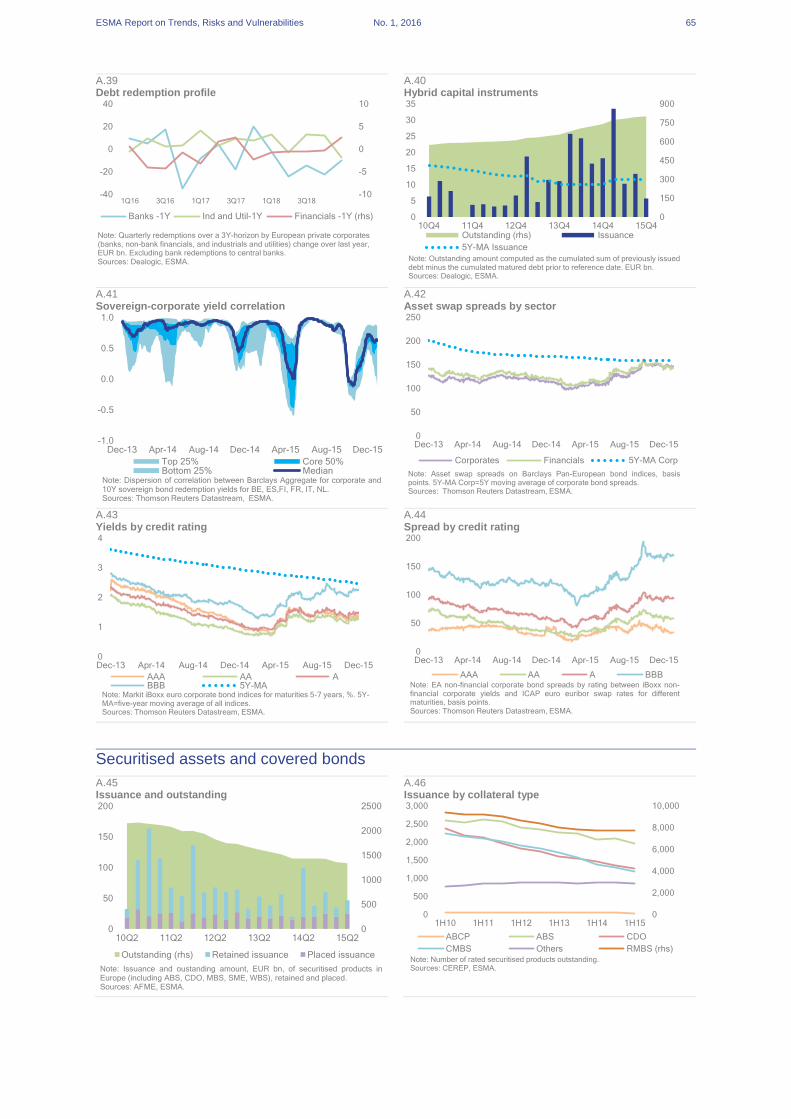
ESMA Report on Trends, Risks and Vulnerabilities No. 1, 2016 65
A.39 A.40 Debt redemption profile Hybrid capital instruments
A.41 A.42 Sovereign-corporate yield correlation Asset swap spreads by sector
A.43 A.44 Yields by credit rating Spread by credit rating
Securitised assets and covered bonds
A.45 A.46 Issuance and outstanding Issuance by collateral type
-10
-5
0
5
10
-40
-20
0
20
40
1Q16 3Q16 1Q17 3Q17 1Q18 3Q18
Th
ou
sa
nd
s
Banks -1Y Ind and Util-1Y Financials -1Y (rhs)
Note: Quarterly redemptions over a 3Y-horizon by European private corporates(banks, non-bank financials, and industrials and utilities) change over last year,EUR bn. Excluding bank redemptions to central banks.Sources: Dealogic, ESMA.
0
150
300
450
600
750
900
0
5
10
15
20
25
30
35
10Q4 11Q4 12Q4 13Q4 14Q4 15Q4Outstanding (rhs) Issuance
5Y-MA Issuance
Note: Outstanding amount computed as the cumulated sum of previously issueddebt minus the cumulated matured debt prior to reference date. EUR bn.Sources: Dealogic, ESMA.
-1.0
-0.5
0.0
0.5
1.0
Dec-13 Apr-14 Aug-14 Dec-14 Apr-15 Aug-15 Dec-15
Top 25% Core 50%Bottom 25% Median
Note: Dispersion of correlation between Barclays Aggregate for corporate and10Y sovereign bond redemption yields for BE, ES,FI, FR, IT, NL.Sources: Thomson Reuters Datastream, ESMA.
0
50
100
150
200
250
Dec-13 Apr-14 Aug-14 Dec-14 Apr-15 Aug-15 Dec-15
Corporates Financials 5Y-MA Corp
Note: Asset swap spreads on Barclays Pan-European bond indices, basispoints. 5Y-MA Corp=5Y moving average of corporate bond spreads.Sources: Thomson Reuters Datastream, ESMA.
0
1
2
3
4
Dec-13 Apr-14 Aug-14 Dec-14 Apr-15 Aug-15 Dec-15
AAA AA ABBB 5Y-MA
Note: Markit iBoxx euro corporate bond indices for maturities 5-7 years, %. 5Y-MA=five-year moving average of all indices.Sources: Thomson Reuters Datastream, ESMA.
0
50
100
150
200
Dec-13 Apr-14 Aug-14 Dec-14 Apr-15 Aug-15 Dec-15
AAA AA A BBBNote: EA non-financial corporate bond spreads by rating between iBoxx non-financial corporate yields and ICAP euro euribor swap rates for differentmaturities, basis points.Sources: Thomson Reuters Datastream, ESMA.
0
500
1000
1500
2000
2500
0
50
100
150
200
10Q2 11Q2 12Q2 13Q2 14Q2 15Q2
Outstanding (rhs) Retained issuance Placed issuance
Note: Issuance and oustanding amount, EUR bn, of securitised products inEurope (including ABS, CDO, MBS, SME, WBS), retained and placed.Sources: AFME, ESMA.
0
2,000
4,000
6,000
8,000
10,000
0
500
1,000
1,500
2,000
2,500
3,000
1H10 1H11 1H12 1H13 1H14 1H15
ABCP ABS CDO
CMBS Others RMBS (rhs)Note: Number of rated securitised products outstanding.Sources: CEREP, ESMA.

ESMA Report on Trends, Risks and Vulnerabilities No. 1, 2016 66
A.47 A.48 Spreads Rating distribution of securitised products
A.49 A.50 Rating changes for securitised products
Size of rating changes
A.51 A.52 Rating distribution Rating accuracy
A.53 A.54 Covered bond outstanding Covered bond spreads
-50
0
50
100
150
200
Dec-13 Apr-14 Aug-14 Dec-14 Apr-15 Aug-15 Dec-15
EA US 5Y-MA EA
Note: Asset swap spreads on Barclays Euro Area and US securitised indices,basis points.Sources: Thomson Reuters Datastream, ESMA.
0
25
50
75
100
10Q2 11Q2 12Q2 13Q2 14Q2 15Q2
<Baa Baa A Aa Aaa
Note: Securitised products in the EU rated by Moody's. Rating classes in % oftotal amount outstanding.Sources: AFME, Moody's, ESMA.
0
200
400
600
800
10Q2 11Q2 12Q2 13Q2 14Q2 15Q2
Downgrades Upgrades
Note: Securitised products in the EU rated by Moody's. Number of ratingchanges per quarter.Sources: AFME, Moody's, ESMA.
0
1
2
3
4
1H10 1H11 1H12 1H13 1H14 1H15
Upgrades Downgrades
Note: Average size of upgrades and downgrades when credit rating agenciestook rating actions on securitised assets, number of buckets traversed.Sources: CEREP, ESMA.
0.0
0.1
0.2
0.3
0.4
0.5
0.6
0.7
0.8
0.9
1.0
1H10 1H11 1H12 1H13 1H14 1H15
Aaa Aa A Baa Ba B Caa<
Note: Distribution of ratings of securitised assets across rating buckets; fractionof total pool.Sources: CEREP, ESMA.
0
0.2
0.4
0.6
0.8
1
1H10 1H11 1H12 1H13 1H14 1H15
SF ABS CMBS RMBS CDO
Note: Ratings accuracy by type of collateral.Sources: CEREP, ESMA.
0
500
1000
1500
2000
0
50
100
150
10Q4 11Q4 12Q4 13Q4 14Q4 15Q4
Outstanding (rhs) Issuance
5Y-MA IssuanceNote: Outstanding amount computed as the historical cumulated sum of thedifference between issuance and maturity of covered bonds, EUR bn. 5Y-MA isfive-year moving average for issuance.Sources: Dealogic, ESMA.
0
50
100
150
200
Dec-13 Apr-14 Aug-14 Dec-14 Apr-15 Aug-15 Dec-15
All AAA AA A 5Y-MA
Note: Asset swap spreads based on iBoxx covered bond indices, basis points. 5Y-MA=five year moving average of all bonds.Sources: Thomson Reuters Datastream, ESMA.

ESMA Report on Trends, Risks and Vulnerabilities No. 1, 2016 67
Credit quality
A.55 A.56 Rating actions Rating activity
A.57 A.58 Rating changes Rating volatility
Securities financing and collateral
A.59 A.60 Securities lending by instrument type Securities lending, total values by region
A.61 A.62 Securities utilisation rate Securities lending against cash collateral
0
0.5
1
1.5
2
2.5
Non-fin Fin Ins Sov SF CB
Upgrades Downgrades
Note: Average size of upgrades and downgrades from all credit rating agenciesby asset class for 1H15, average number of notches. SF=structured finance,CB=covered bonds, Sovereign includes public finance.Sources: CEREP, ESMA.
0
2
4
6
8
10
12
14
New Ratings Upgrades Downgrades Withdrawals Defaults
Non-financials Financials Insurances
Sovereigns Structured finance Covered bonds
Note: Rating activity of all credit rating agencies (CRAs) by asset class for1H15, % of outstanding ratings. Sovereign including public finance.Sources: CEREP, ESMA.
-70%
-50%
-30%
-10%
10%
30%
1H10 1H11 1H12 1H13 1H14 1H15Non-financials FinancialsInsurances SovereignsStructured finance Covered bonds
Note: Drift of ratings from all credit rating agencies by asset class computed aspercentage number of upgrades minus percentage number of downgrades, %.Sources: CEREP, ESMA.
0
0.1
0.2
0.3
0.4
0.5
0.6
0.7
1H10 1H11 1H12 1H13 1H14 1H15Non-financials FinancialsInsurances SovereignsStructured finance Covered bonds
Note: Volatility of ratings by all credit rating agencies for corporates, financials,insurances, sovereigns and structured finance, computed as number ofupgrades and downgrades over number of ratings outstanding.Sources: CEREP, ESMA.
0
140
280
420
560
700
Dec-13 Apr-14 Aug-14 Dec-14 Apr-15 Aug-15 Dec-15
Equities Government bonds Corporate bonds
Note: Total value of EU securities on loan, in EUR bn.Sources: Markit Securities Finance, ESMA.
0
200
400
600
800
1,000
Dec-13 Apr-14 Aug-14 Dec-14 Apr-15 Aug-15 Dec-15
EU US 5Y-MA EU
Note: Total value of EU and US securities on loan, in EUR bn. 5Y-MA EU= fiveyear moving average for EU securities.Sources: Markit Securities Finance, ESMA.
0
10
20
30
40
Dec-13 Apr-14 Aug-14 Dec-14 Apr-15 Aug-15 Dec-15
Corporate bonds Government bonds Equities
Note: European securities lending utilisation rate, computed as outstandingvalue of securities on loan over outstanding total lendable value, %. Corporatebonds comprise euro denominated bonds only.Sources:Markit Securities Finance, ESMA.
0
10
20
30
40
Dec-13 Apr-14 Aug-14 Dec-14 Apr-15 Aug-15 Dec-15
Equities Government bonds Corporate bonds
Note: Ratio of European securities on loan collateralised with cash over totalsecurities on loan, outstanding values, %.Source: Markit Securities Finance, ESMA.

ESMA Report on Trends, Risks and Vulnerabilities No. 1, 2016 68
A.63 A.64 Securities lending with open maturity Sovereign repo rate dispersion
A.65 A.66 Sovereign repo volumes Supply of collateral
Short selling
A.67 A.68 Value of short selling positions on shares Dispersion of net short positions on shares
A.69 A.70 Net short positions on sovereigns Dispersion of net short positions on sovereigns
60
70
80
90
100
Dec-13 Apr-14 Aug-14 Dec-14 Apr-15 Aug-15 Dec-15
Equities Government bonds Corporate bonds
Note: Ratio of European securities on loan at open maturity over total securities on loan, outstanding values, %.Sources: Markit Securities Finance, ESMA.
-0.8
-0.6
-0.4
-0.2
0.0
0.2
0.4
0.6
0.8
Dec-13 Jun-14 Dec-14 Jun-15 Dec-15Top 25% Core 50%Bottom 25% Median
Note: Dispersion of seven sovereign EUR repo markets (AT, BE, DE, FI, FR, IT and NL), volume -weighted average of fixed rates index value, %.Sources: RepoFunds Rate (BrokerTec,MTS,ICAP), ESMA.
100
125
150
175
200
Dec-13 Apr-14 Aug-14 Dec-14 Apr-15 Aug-15 Dec-15
Volume 20D-MA
Note: 20D-MA of specific and general collateral transaction volumes executedthrough CCPs in seven sovereign EUR repo markets (AT, BE, DE, FI, FR, ITand NL), in EUR bn. Index volumes filter out atypical transactions.Sources: RepoFunds Rate (BrokerTec,MTS,ICAP), ESMA.
0
2
4
6
8
10
12
14
10Q4 11Q4 12Q4 13Q4 14Q4 15Q4
Quasi high-quality collateral outstanding
High-quality collateral outstanding
Note: Amount outstanding and quarterly change, EUR tn. High-quality collateralis the sum of outstanding debt securities issued by EU governments with arating equal or higher than BBB-.Quasi high-quality is outstanding corporatedebt with rating equal or higher than AA-.Sources: Dealogic, Eurostat, AMECO, Standard & Poor's, ESMA.
0
100
200
300
400
0.0
0.2
0.4
0.6
0.8
1.0
Sep-13 Jan-14 May-14 Sep-14 Jan-15 May-15 Sep-15
Percent Market Value Number (rhs)
Note: Market value of short selling positions as percentage of total market valuein the EU (lhs). Number of listed shares on which short positions were reportedby NCAs under EU Short Selling Regulation (rhs).Sources: National Competent Authorities, Datastream, ESMA.
0
1
2
3
4
5
6
Sep-13 Jan-14 May-14 Sep-14 Jan-15 May-15 Sep-15
Top 25% Core 50%
Bottom 25% MedianNote: Dispersion of net short positions by country as percentage of marketvalue of those positions to each country's blue chip index market value. Sampleconsists of all equities that were reported since 01/11/2012.Sources: National Competent Authorities, Datastream, ESMA.
0.0
0.2
0.4
0.6
0.8
1.0
1.2
1.4
1.6
Sep-13 Jan-14 May-14 Sep-14 Jan-15 May-15 Sep-15
Percent of total debt securities
Note: Net short positions held on sovereigns, % of total debt securities in EU.Sample consists of all EU Member States that were reported since 01/11/2012.Sources: National Competent Authorities, Eurostat, Ameco, ESMA.
0
3
6
9
Jan-14 May-14 Sep-14 Jan-15 May-15 Sep-15
Top 25% Core 50%
Bottom 25% MedianNote: Dispersion of net short positions held on selected sovereigns, % of eachcountry's total debt securities. Sample consists of all equities that were reportedsince 01/11/2012.Sources: National Competent Authorities, Datastream, ESMA.

ESMA Report on Trends, Risks and Vulnerabilities No. 1, 2016 69
Money markets
A.71 A.72 Interest rates Spreads to OIS
A.73 A.74 Interbank overnight activity Euribor volatility
Commodity markets
A.75 A.76 Prices Volatility
A.77 A.78 Open interest Implied volatility
-0.3
-0.1
0.1
0.3
0.5
0.7
Dec-13 Apr-14 Aug-14 Dec-14 Apr-15 Aug-15 Dec-15
EONIA 5Y-MA EONIA3M Euribor ECB rate
Note: Money market rates in %.Sources: Thomson Reuters Datastream, ESMA.
0
10
20
30
40
Dec-13 Apr-14 Aug-14 Dec-14 Apr-15 Aug-15 Dec-15
Euribor GBP LiborUSD Libor 5Y-MA Euribor
Note: Spreads between 3M interbank rates and 3M Overnight Index Swap (OIS), inbasis points. 5Y-MA Euribor, 5 years moving average for Euribor spread.Sources: Thomson Reuters Datastream, ESMA.
0
10
20
30
40
50
60
Dec-13 Apr-14 Aug-14 Dec-14 Apr-15 Aug-15 Dec-15
EONIA SONIA (rhs) 5Y-MA EONIANote: 20D moving average of daily lending volumes on Euro Overnight IndexAverage (EONIA) and Sterling Overnight Index Average (SONIA), EUR andGBP bn.Sources: ECB, Bloomberg, ESMA.
0
100
200
300
400
500
600
700
Dec-13 Apr-14 Aug-14 Dec-14 Apr-15 Aug-15 Dec-15
2Y 5Y 10Y
Note: Implied volatilities on 1M forward ICAP Euro-Euribor swaptions measuredas price indices, %.Sources: Thomson Reuters Datastream, ESMA.
20
40
60
80
100
120
140
Dec-13 Apr-14 Aug-14 Dec-14 Apr-15 Aug-15 Dec-15
Energy Industrial metalsNatural gas Precious metalsBrent 5Y-MA
Note: S&P GSCI Commodity indices and Brent price, indexed, 01/01/2014=100. 5Y-AVG=five-year average computed using S&P GSCI. Indices denominated in USD.Sources: Thomson Reuters Datastream, ESMA.
0
15
30
45
60
75
Dec-13 Apr-14 Aug-14 Dec-14 Apr-15 Aug-15 Dec-15Energy Industrial metalsNatural gas Precious metalsBrent 5Y-MA
Note: Annualised 40D volatility of S&P GSCI Commodity indices and Brent price.%. 5Y-MA=five-year moving average computed using S&P GSCI.Sources: Thomson Reuters Datastream, ESMA.
0.0
0.5
1.0
1.5
2.0
Dec-13 Apr-14 Aug-14 Dec-14 Apr-15 Aug-15 Dec-15
Light crude oil future Natural gas future
Note: Continuous future open interests on number of barrels, millions.Sources: Thomson Reuters Datastream, ESMA.
0
20
40
60
80
100
Dec-13 Apr-14 Aug-14 Dec-14 Apr-15 Aug-15 Dec-15
Ligth Crude Oil implied volatility
Natural Gas implied volatility
Note: One month implied volatility of at the money options, %.Sources: Thomson Reuters Datastream, ESMA.

ESMA Report on Trends, Risks and Vulnerabilities No. 1, 2016 70
Derivatives markets
A.79 A.80 OTC notional outstanding OTC market value
A.81 A.82 ETD notional outstanding ETD turnover
Shadow banking and market based credit intermediation
A.83 A.84 EU shadow banking liabilities US shadow banking liabilities
A.85 A.86 MMF and other financial institutions Financial market interconnectedness
0
175
350
525
700
10H1 11H1 12H1 13H1 14H1 15H1
Credit default swaps CommodityEquity-linked Interest rateForeign exchange
Note: Gross notional amounts of outstanding OTC derivatives by productcategory, USD tn.Sources: Bank for International Settlements, ESMA.
0
5
10
15
20
25
30
10H1 11H1 12H1 13H1 14H1 15H1Credit default swaps CommodityEquity-linked Interest rateForeign exchange
Note: Gross market values of outstanding OTC derivatives by category, USD tn.Gross market values represent the cost of replacing all open contracts at theprevailing market prices.Sources: Bank for International Settlements, ESMA.
0
15
30
45
60
75
90
10Q3 11Q3 12Q3 13Q3 14Q3 15Q3
Equity index Currency Interest rate
Note: Gross notional amounts of outstanding derivatives traded in organisedexchanges by category, USD tn.Sources: Bank for International Settlements, ESMA.
0
100
200
300
400
500
600
10Q2 11Q2 12Q2 13Q2 14Q2 15Q2
Equity index Currency Interest rate
Note: Quarterly turnover in notional amounts for derivatives traded in organisedexchanges by category, USD tn.Sources: Bank for International Settlements, ESMA.
0
5
10
15
20
25
0
4
8
12
10Q2 11Q2 12Q2 13Q2 14Q2 15Q2
ABCP ABS
MMFs Securities lending
Repo % of bank liabilities (rhs)Note: Size of shadow banking system proxied by amounts of ABS and ABCPoutstanding, size of the EU repo market and EU securities on loan (collateralisedwith cash), and liabilities of MMF, in EUR tn. % of bank liabilities on rhs.Sources: ECB, AFME, ICMA, Markit Securities Finance, ESMA.
0
30
60
90
120
150
0
5
10
15
20
10Q3 11Q3 12Q3 13Q3 14Q3 15Q3
CP ABS,GSEs
MMF Securities lending
Repo % of bank liabilities (rhs)Note:Size of shadow banking system proxied by liabilities of ABS issuers, GSEsand pool securities, open commercial paper (CP), size of the US repo andsecurities lending (collateralised with cash) markets, and liabilities of MoneyMarket Funds, USD tn. % of bank liabilities on rhs.Sources: Federal Reserve Flow of Funds, Thomson Reuters Datastream, ESMA.
0
20
40
60
80
100
0
5
10
15
20
25
30
10Q3 11Q3 12Q3 13Q3 14Q3 15Q3
IF MMFs
FVC Other OFI
OFIs + MMFs % of MFI (rhs) IF+MMFs % of MFI (rhs)
Note: Total assets for EA Money Market Funds (MMFs) and other financialinstitutions (OFI): investment funds (IF), financial vehicle corporations (FVC),other OFI estimated with ECB Quarterly Sector Accounts MFUA. EUR tn, in %of banks' assets on rhs.Sources: ECB, ESMA.
0
20
40
60
80
0
5
10
15
20
25
10Q3 11Q3 12Q3 13Q3 14Q3 15Q3
Total funds Hedge fundsBond funds MMFs (rhs)
Note: Loan and debt securities vis-à-vis MFI counterparts, as a share of totalassets. EA investment funds and MMFs, in %.Sources: ECB, ESMA.

ESMA Report on Trends, Risks and Vulnerabilities No. 1, 2016 71
A.87 A.88 MMF maturities MMF liquidity
0
10
20
30
40
50
60
70
Oct-13 Feb-14 Jun-14 Oct-14 Feb-15 Jun-15 Oct-15
WAM WAL
Note: Weighted average maturity (WAM) and weighted average life (WAL) ofEU Prime MMFs, in days. Aggregation carried out by weighting individual MMFsWAM and WAL by AuM.Sources: Fitch Ratings, ESMA.
0
10
20
30
40
50
Oct-13 Feb-14 Jun-14 Oct-14 Feb-15 Jun-15 Oct-15
Weekly Liquidity Daily Liquidity
Note: Daily and weekly liquidity includes all assets maturing overnight andshares by AAA MMFs, securities issued by highly rated sovereigns with amaturity of less than one year, % of total assets.Aggregation carried out usingindividual MMF data weighted by AuM.Sources: Fitch Ratings, ESMA.
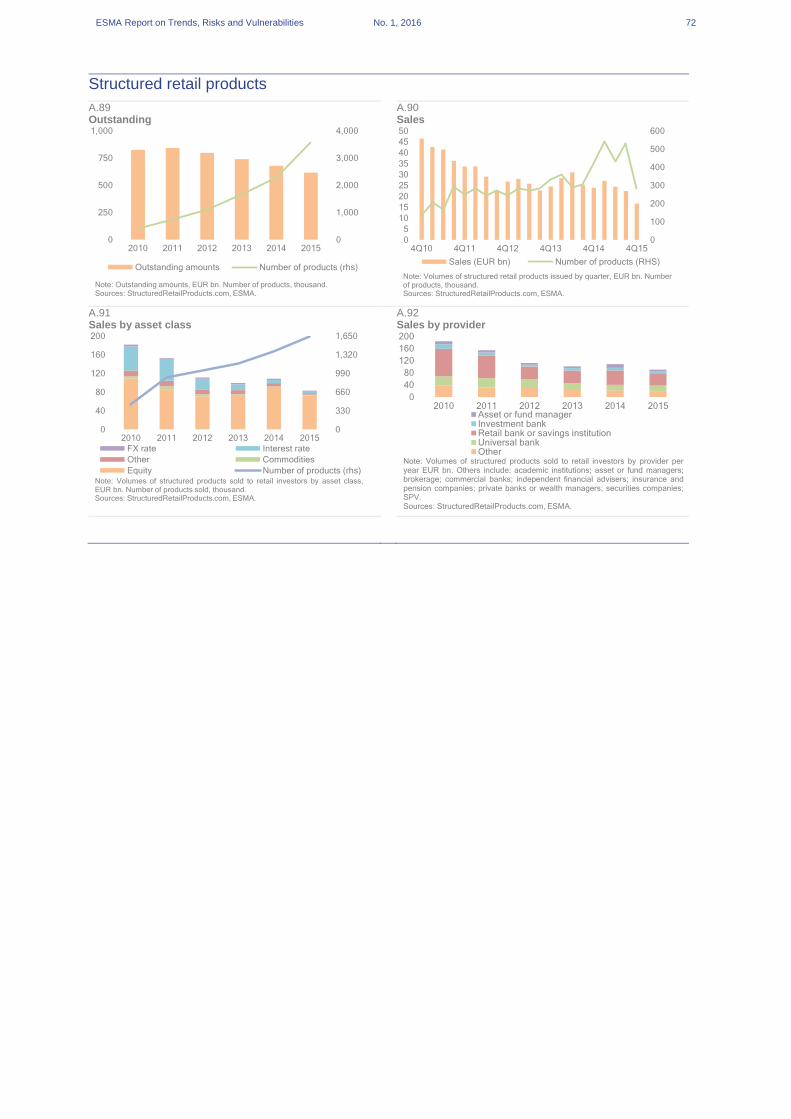
ESMA Report on Trends, Risks and Vulnerabilities No. 1, 2016 72
Structured retail products
A.89 A.90 Outstanding Sales
A.91 A.92 Sales by asset class Sales by provider
0
1,000
2,000
3,000
4,000
0
250
500
750
1,000
2010 2011 2012 2013 2014 2015
Outstanding amounts Number of products (rhs)
Note: Outstanding amounts, EUR bn. Number of products, thousand.Sources: StructuredRetailProducts.com, ESMA.
0
100
200
300
400
500
600
0
5
10
15
20
25
30
35
40
45
50
4Q10 4Q11 4Q12 4Q13 4Q14 4Q15
Sales (EUR bn) Number of products (RHS)
Note: Volumes of structured retail products issued by quarter, EUR bn. Numberof products, thousand.Sources: StructuredRetailProducts.com, ESMA.
0
330
660
990
1,320
1,650
0
40
80
120
160
200
2010 2011 2012 2013 2014 2015
Th
ou
sa
nd
s
FX rate Interest rate
Other Commodities
Equity Number of products (rhs)Note: Volumes of structured products sold to retail investors by asset class,EUR bn. Number of products sold, thousand.Sources: StructuredRetailProducts.com, ESMA.
0
40
80
120
160
200
2010 2011 2012 2013 2014 2015
Th
ou
sa
nd
s
Asset or fund managerInvestment bankRetail bank or savings institutionUniversal bankOther
Note: Volumes of structured products sold to retail investors by provider peryear EUR bn. Others include: academic institutions; asset or fund managers;brokerage; commercial banks; independent financial advisers; insurance andpension companies; private banks or wealth managers; securities companies;SPV.Sources: StructuredRetailProducts.com, ESMA.

ESMA Report on Trends, Risks and Vulnerabilities No. 1, 2016 73
Investors
Fund industry
A.93 A.94 Fund performance Fund volatility
A.95 A.96 Assets by market segment NAV by legal form
A.97 A.98 NAV by fund market segment Leverage by market segment
A.99 A.100 Fund flows by fund type Fund flows by regional investment focus
-2.5
-1.5
-0.5
0.5
1.5
2.5
Dec-13 Apr-14 Aug-14 Dec-14 Apr-15 Aug-15 Dec-15
Alternatives Equity BondCommodity Mixed assets Real estate
Note: EU domiciled investment funds' annual average monthly returns, asset weighted, %.Sources:Thomson Reuters Lipper, ESMA.
0
4
8
12
16
20
24
28
Dec-13 Apr-14 Aug-14 Dec-14 Apr-15 Aug-15 Dec-15
Alternatives Equity Bond
Commodity Mixed Real estateNote: Annualised 40D historical return volatility (%) of EU domiciled mutual funds.Sources: Thompson Reuter Lipper, ESMA.
0
2
4
6
8
10
12
0
1
2
3
4
Nov-13 Mar-14 Jul-14 Nov-14 Mar-15 Jul-15 Nov-15
Bond Equity HFMixed Real estate Total (rhs)
Note: AuM of EA funds by fund type, EUR tn. HF=Hedge funds.Sources: ECB, ESMA.
0
1
2
3
4
5
6
7
8
4Q10 4Q11 4Q12 4Q13 4Q14
Non-UCITS UCITS
Note: NAV of EU fund industry, EUR tn. Quarterly data.Sources: EFAMA, ESMA.Note:Sources:Note:Sources:
0
1
2
3
Oct-13 Feb-14 Jun-14 Oct-14 Feb-15 Jun-15 Oct-15
Bond Equity Mixed Real estate
Note: EA Investment funds’ NAV by fund type, EUR tn.Sources: ECB, ESMA.
1.0
1.1
1.2
1.3
Oct-13 Feb-14 Jun-14 Oct-14 Feb-15 Jun-15 Oct-15
Bond Equity Mixed Real estate
Note: EA Investment funds' leverage by fund type computed as the AuM/NAVratio.Sources: ECB, ESMA.
-40
0
40
80
120
160
Dec-13 Apr-14 Aug-14 Dec-14 Apr-15 Aug-15 Dec-15
Total EU Equity Bond Mixed MMFs
Note: EU domiciled funds' 2M cumulative net flows, EUR bn.Sources: Thomson Reuters Lipper, ESMA.
-200
200
600
1,000
1,400
1,800
2,200
Dec-13 Apr-14 Aug-14 Dec-14 Apr-15 Aug-15 Dec-15
Europe BF Europe EF
Emerging markets BF Emerging markets EF
North America BF North America EF
Note: Cumulative net flows into bond and equity funds (BF and EF) over time since2004 by regional investment focus, EUR bn.Sources: Thomson Reuters Lipper, ESMA.

ESMA Report on Trends, Risks and Vulnerabilities No. 1, 2016 74
A.101 A.102 Bond fund flows by regional investment focus Equity fund flows by regional investment focus
A.103 A.104 Net flows for bond funds Net asset valuation
A.105 A.106 Liquidity risk profile of EU BF. Cash as a percentage of assets in corporate BF portfolio
Money market funds
A.107 A.108 MMF performance MMF flows by domicile
-90
-60
-30
0
30
60
90
Dec-13 Apr-14 Aug-14 Dec-14 Apr-15 Aug-15 Dec-15
Western Europe North America Global Emerging markets
Note: 2M cumulative bond flows by regional investment focus, EUR bn.Sources: Thomson Reuters Lipper, ESMA.
-100
-50
0
50
100
Dec-13 Apr-14 Aug-14 Dec-14 Apr-15 Aug-15 Dec-15
Western Europe North America Global Emerging markets
Note: 2M cumulative equity flows by regional investment focus, EUR bn.Sources: Thomson Reuters Lipper, ESMA.
-12
-6
0
6
12
Dec-13 Apr-14 Aug-14 Dec-14 Apr-15 Aug-15 Dec-15
Corporate GovernmentHY Inflation-protectedTotal return EmergingOther assets
Note: Net flows for bond funds, EUR bn. Funds investing in corporate and government bonds that qualify for another category are only reported once (e.g. funds investing in emerging government bonds will be reported as emerging; funds investing in HY corporate bonds will be reported as HY). Sources: Thomson Reuters Lipper, ESMA.
0
3
6
9
12
-400
0
400
800
1200
10Q3 11Q3 12Q3 13Q3 14Q3 15Q3
AuM (rhs) Capital flows Valuation effect
Note: Net valuation effect related to the AuM of EA investment funds, computedas the intraperiod change of their AuM, net of flows received in the respectedperiod. Capital flows and valuation effects in EUR bn. AuM expressed in EUR tn.Sources: ECB, ESMA.
-5
20
45
70
3 4 5 6 7 8 9
Liq
uid
ity
Maturity
Corporate bond funds All bond funds (excl. gov.)
HY funds Government bond funds
Loan funds
Note: Fund type is reported according to their average liquidity ratio, as a percentage (Y-axis), the effective average maturity of their assets (X-axis) and their size. Each series is reported for 2 years, i.e. 2014 (mid tones) and 2015 (hue).
Sources: Thomson Reuter Lipper, ESMA.
0.0
1.0
2.0
3.0
4.0
5.0
Dec-12 Jun-13 Dec-13 Jun-14 Dec-14 Jun-15 Dec-15
4Y-AVG CashNote: Cash and derivatives in percentage of holdings (%). Derivative positionscan have a negative value.Sources: Thomson Reuters Lipper, ESMA.
-1.0
0.0
1.0
2.0
Dec-13 Apr-14 Aug-14 Dec-14 Apr-15 Aug-15 Dec-15
2nd/98th perc. Weighted average Median
Note: EU-domiciled MMF's annual average monthly returns, asset weighted, %.The graph shows the median and average asset weighted returns and thedifference between the returns corresponding to the 98th and the 2nd percentile(light blue corridor).Sources: Thomson Reuters Lipper, ESMA.
-100
-50
0
50
100
Dec-13 Apr-14 Aug-14 Dec-14 Apr-15 Aug-15 Dec-15
EU US
Note: MMF 2M cumulative net flows by domicile, EUR bn.Sources: Thomson Reuters Lipper, ESMA.

ESMA Report on Trends, Risks and Vulnerabilities No. 1, 2016 75
A.109 A.110 MMF flows by geographical focus Assets and leverage
Alternative funds
A.111 A.112 Hedge fund returns Hedge fund performance by strategy
A.113 A.114 Fund flows by domicile AuM by strategy
A.115 A.116 Assets and leverage HF interconnectedness
-120
-80
-40
0
40
80
Dec-13 Apr-14 Aug-14 Dec-14 Apr-15 Aug-15 Dec-15
Western Europe North America Global Emerging markets
Note: MMF 2M cumulative net flows by geographical focus, EUR bn.Sources: Thomson Reuters Lipper, ESMA.
1.00
1.01
1.02
1.03
1.04
0.0
0.3
0.6
0.9
1.2
10Q3 11Q3 12Q3 13Q3 14Q3 15Q3
AuM NAVLeverage (rhs) 5Y-AVG lev (rhs)
Note: NAV and AuM of EA MMFs, EUR tn. Leverage computed as theAuM/NAV ratio. 5Y-MA lev=five-year moving average for the leverage ratio.Sources: ECB, ESMA.
-10
-5
0
5
10
Dec-13 Apr-14 Aug-14 Dec-14 Apr-15 Aug-15 Dec-15
Corridor 2nd/98th perc. Corridor 1st/3rd quart.
Median
Note: EU domiciled hedge funds' monthly returns, %. The graph shows the returns'median, the difference between the returns corresponding to the 98th and 25thpercentiles (light blue corridor) and the difference between the returnscorresponding to the 1st and 3rd quartiles (dotted line corridor).Sources: TASS Lipper, Eurekahedge, BarclayHedge, HFR, ESMA.
-6
-4
-2
0
2
4
HF
Arb
CT
A
Dis
tre
ss
Eve
nt
FI
LS
Ma
cro
Mu
lti
RV
1Q15 2Q15 3Q15 4Q15Note: Growth in hedge fund performance indices by strategy: Hedge fund index,arbitrage, Commodity Trading Advisor, distressed debt, event driven, fixed income,long/short equity, macro, multi-strategy, relative value; %.Sources: Eurekahedge, ESMA.
-15
-10
-5
0
5
10
15
Dec-13 Jun-14 Dec-14 Jun-15 Dec-15
EU US
Note: Alternative mutual funds' 2M cumulative net flows by domicile, EUR bn. Dataon alternative mutual funds represents only a subset of the entire alternative fundindustry.Sources: Thomson Reuters Lipper, ESMA.
0
5
10
15
20
FH
F
CT
A
Dis
tress
EM
LS
LB
Eve
nt
FI
Ma
cro
Mu
lti
Oth
er
4Q14 1Q15 2Q15 3Q15
Note: Market share of hedge funds' AuM by strategy: Fund of hedge funds,Commodity Trading Advisor, distressed debt, emerging market, long/short equity,equity long bias, event driven, fixed income, macro, multi-strategy, other. Funds ofhedge funds are not included in the total. % of total.Sources:BarclayHedge, ESMA.
0.0
0.5
1.0
1.5
2.0
0
100
200
300
400
Nov-13 Mar-14 Jul-14 Nov-14 Mar-15 Jul-15 Nov-15
AuM NAVLeverage (rhs) 5Y-AVG lev (rhs)
Note: NAV and AuM of EA hedge funds, EUR bn. Leverage computed as theAuM/NAV ratio. 5Y-MA lev=five-year moving average for the leverage ratio.Sources: ECB, ESMA.
-0.02
-0.01
0
0.01
0.02
Nov-11 Nov-12 Nov-13 Nov-14 Nov-15
Destabiliser HF (coeff. +) Stabiliser HF (coeff. -)
Note: Systemic stress indicator based on products of fractions of regressions withpositive (negative) estimated coeffcient individual fund return's impact on averagereturn of sector significant at 99% level and respective average estimators.Coefficients stem from VAR models regressing individual fund returns on lags andgeneral financial market indices. Measures aggregated across individualregressions. Data until September 2015.Sources: Barclayhedge, Eurekahedge, TASS, HFR, ESMA.

ESMA Report on Trends, Risks and Vulnerabilities No. 1, 2016 76
Exchange-traded funds
A.117 A.118 ETF returns Volatility
A.119 A.120 NAV and number by domicile NAV by asset type
A.121 A.122 Tracking error Flows by domicile
Retail investors
A.123 A.124 Portfolio returns Investor sentiment
-6
-4
-2
0
2
4
6
Dec-13 Apr-14 Aug-14 Dec-14 Apr-15 Aug-15 Dec-15
2nd/98th perc. Weighted average Median
Note: EU domiciled ETFs' average yearly returns by month, asset weighted, %.The graph shows the median and average asset weighted returns and thedifference between the returns corresponding to the 98th and the 2nd percentile(light blue corridor).Sources: Thomson Reuters Lipper, ESMA.
0
6
12
18
24
Dec-13 Apr-14 Aug-14 Dec-14 Apr-15 Aug-15 Dec-15
ETF
Note: Annualised 40D historical return volatility (%) of EU domiciled ETF.Sources: Thomson Reuters Lipper, ESMA.
1,000
1,200
1,400
1,600
1,800
2,000
0.0
0.5
1.0
1.5
2.0
2.5
Dec-13 Jun-14 Dec-14 Jun-15 Dec-15
EU USNumber of EU ETFs (rhs) Number of US ETFs (rhs)
Note: NAV of ETFs, EUR tn, and number of ETFs.Sources: Thomson Reuters Lipper, ESMA.
0
100
200
300
400
500
Dec-13 Jun-14 Dec-14 Jun-15 Dec-15
Mixed Assets Alternatives Money Market Commodity
Other Bond Equity
Note: NAV of EU ETFs by asset type, EUR bn.Sources: Thomson Reuters Lipper, ESMA.
0.0
0.3
0.6
0.9
1.2
Dec-13 Apr-14 Aug-14 Dec-14 Apr-15 Aug-15 Dec-15
ETFs MFs index trackers UCITS
MFs index trackers Non-UCITS
Note: Tracking error defined as standard deviation of fund excess returns comparedto benchmark. The graph shows the tracking error for ETF and mutual funds bothUCITS and non-UCITS. Yearly standard deviation reported on monthly frequency.End of month data.Sources: Thomson Reuters Lipper, ESMA.
-20
0
20
40
Dec-13 Apr-14 Aug-14 Dec-14 Apr-15 Aug-15 Dec-15
EU US
Note: ETF not cumulative net flows by domicile, EUR bn.Sources: Thomson Reuters Lipper, ESMA.
0.0
0.2
0.4
0.6
0.8
1.0
Dec-13 Apr-14 Aug-14 Dec-14 Apr-15 Aug-15 Dec-15Average 5Y-MA
Note: Monthly return (%) for a representative portfolio for households. Assetweights, computed using ECB Financial Accounts by Institutional Sectors, are37% for collective investment schemes (of which 12% mutual funds and 25%insurance and pension funds), 31% for deposits, 22% for equity, 7% debtsecurities and 3% for other assets.Sources: Thomson Reuters Datastream, Thomson Reuters Lipper, ECB,ESMA.
-50
-25
0
25
50
Dec-10 Dec-11 Dec-12 Dec-13 Dec-14
EA institutional current EA private current
EA institutional future EA private future
Note: Sentix Sentiment Indicators for Euro Area private and institutional investorsfor a 10Y horizon. The zero benchmark marks a risk-neutral position. Monthlyfrequency.Sources: Thomson Reuters Datastream, ESMA.

ESMA Report on Trends, Risks and Vulnerabilities No. 1, 2016 77
A.125 A.126 Disposable income Asset growth
A.127 A.128 Financial assets and liabilities Growth rates in financial assets
A.129 A.130 Retail fund synthetic risk and reward indicator Share ownership by age and income
A.131 A.132 Financial numeracy Investment taxation
0.0
0.5
1.0
1.5
2.0
2.5
3.0
3.5
4.0
4.5
5.0
Jan-10 Oct-10 Jul-11 Apr-12 Jan-13 Oct-13 Jul-14
Average 5Y-MA
Note: Annualised growth rates of average gross disposable income in 16 EUcountries (BE, CZ, DK, DE, IE, ES, FR, IT, NL, AT, PL, PT, SI, FI, SE, UK), %.Sources: Eurostat, ESMA.
-4
-2
0
2
4
6
8
Jan-10 Oct-10 Jul-11 Apr-12 Jan-13 Oct-13 Jul-14
Financial assets 5Y-MA financial assets
Real assets 5Y-MA real assets
Note: Annualised growth rates of EA-18 households' real and financial assets, %.5Y-MA: five-year moving average of the growth rate.Sources: ECB, ESMA.
28
29
30
31
32
33
34
35
0
5
10
15
20
25
30
35
1Q13 2Q13 3Q13 4Q13 1Q14 2Q14 3Q14 4Q14 1Q15
Mill
ion
s
Assets Liabilities Liabilities/Assets ratioNote: EU households' financial assets and liabilities, excl. BG, CY; EUR tn (lhs).Assets/Liabilities ratio, % (rhs).Sources: ECB, ESMA.
-10-505
101520253035
Oct-13 Jan-14 Apr-14 Jul-14 Oct-14 Jan-15Deposits Debt securitiesShares Investment Fund sharesInsurance & Pension Funds Other assetsLoans
Note: Unweighted average annualised growth (%) in EU households' financialassets. Data from 25 EU countries excl. BG, CY, AT. Excluding DK, FI, GB,GR, HR, IE from loans; IE from investment funds; CZ, DK, FR, GR, LU, ROfrom other assets (derivatives and other accounts receivable/payable).Sources: ECB, ESMA.
1234567
Dec-13 Apr-14 Aug-14 Dec-14 Apr-15 Aug-15 Dec-15
Equity Bond
Alternative Commodity
Money market Real estate
Note:The calculated Synthetic Risk and Reward Indicator is based on ESMASRRI guidelines. It is computed via a simple 5 year annualised volatilitymeasure which is then translated into categories 1-7 (with 7 representinghigher levels of volatility).Sources:Thomson Reuters Lipper, ESMA.
0
20
40
60
Bottom 20% 20-40% 40-60% 60-80% 80-90% 90-100%
Top 25% Core 50% Bottom 25% Median
Note: Dispersion of the national percentages of households owning shares bytheir income group. Data for EA member states (excl. IE, EE) for 2008-2011, %.Bottom 25% represents the range of values from minimum to 1st percentile, Core50% from 1st percentile to 3rd percentile, and Top 25% from 3rd percentile tomaximum.Sources:ECB HFCS, ESMA.
0
20
40
60
80
50 60 70 80 90 100
Percentage of households holding debt
Note: X-axis: Numeracy = share of respondents with correct answers (threenumerical questions asked). Y-axis = EA households (excl. IE, EE) holding debtin 2008-2011, %.Sources: Special Eurobarometer 342 2011, ECB HFCS, ESMA.
0
20
40
60
80
100
0%
20%
40%
60%
80%
100%
00 01 02 03 04 05 06 07 08 09 10 11 12 13 14 15Average CIT over total Average PIT over totalAverage CIT+PIT Max CIT+PITMin CIT+PIT
Note: Unweighted average of personal income and corporate income taxes over 21 countries (AT, BE, CZ, DE, DK, EE, ES, FI, FR, GR, HU, IE, IT, LU, NL, PL, PT, SE, SI, SK, UK) plotted through the line chart (%). Composition of the average in personal income vs. corporate income taxes plotted on the column chart (%). Sources: OECD.

ESMA Report on Trends, Risks and Vulnerabilities No. 1, 2016 78
A.133 A.134 Complaints data by cause Complaints data by financial instrument
0%
20%
40%
60%
80%
100%
Jan-13 Jul-13 Jan-14 Jul-14 Jan-15
Unauthorised business Fees/chargesQuality/lack of information Investment adviceExecution of orders
Note: Complaints data by cause of complaint in % over the total. Data collectedfrom NCAs, firms and Ombudsman of 27 EU countries (excluding CZ).Sources: ESMA complaints data collection by EU NCAs.
0%
20%
40%
60%
80%
100%
Jan-13 Jul-13 Jan-14 Jul-14 Jan-15
Financial contracts for difference Options/futures/swaps
Mutual funds Structured securities
Bonds/debt securities Shares/stocks/equity
Note: Complaints data by financial instrument in % over the total. Data collectedfrom NCAs, firms and Ombudsman of 27 EU countries (excluding CZ).Sources: ESMA complaints data collection by EU NCAs.

ESMA Report on Trends, Risks and Vulnerabilities No. 1, 2016 79
Infrastructures and services
Trading venues
A.135 A.136 Equity trading turnover Equity trading by transaction type
Central counterparties
A.137 A.138 Value cleared Trade size
A.139 A.140 IRS CCP clearing Share of transactions cleared by CCPs
0
500
1,000
1,500
2,000
2,500
Dec-13 Apr-14 Aug-14 Dec-14 Apr-15 Aug-15 Dec-15Dark pools EOBOff-order book TRFAll trading 2Y-AVG
Note: Turnover on trading venues by category, EUR bn. 2Y-AVG = 2Y averageof all trading, EOB=Electronic Order Book, TRF=Trade Reporting Facilities.Sources: FESE, ESMA.
Electronic order book
63.2%
Off-order book6.2%
Trade reporting facilities28.1%
Dark pools2.5%
Note: Turnover in EUR as % of total. Data as of September 2015.Sources: FESE, ESMA.
0
150
300
450
2008 2009 2010 2011 2012 2013 2014
Cash Repo OTC ETD
Note: Volume of transactions cleared by reporting CCPs. Annual data, EUR tn,for Cash, Repos, non-OTC and OTC derivatives. LCH.Clearnet Ltd not includeddue to uneven reporting during the period.Sources: ECB, ESMA.
0
6,000
12,000
18,000
24,000
0
70
140
210
280
2008 2009 2010 2011 2012 2013 2014
ETD OTC Cash Repo(rhs)
Note: Average size of transactions cleared by reporting CCPs, for cash, repos,non-OTC and OTC derivatives. Annual data, EUR thousand. LCH. Clearnet Ltd.not included as there is uneven reporting during the period.Sources: ECB, ESMA.
40
50
60
70
80
90
100
Dec-13 Apr-14 Aug-14 Dec-14 Apr-15 Aug-15 Dec-15
Swap OIS FRA Basis Swaps
Note: OTC interest rate derivatives cleared by CCPs, % of total notionalamount.Sources: DTCC, ESMA.
EUREX49%
LCH. Clearnet
S.A.22%
ICE Clear Europe
18%
CCG8%
Others3%
Note: Share of volume of transactions cleared by reporting CCPs for Cash,Repos, non-OTC and OTC derivatives, 2014. LCH.Clearnet Ltd not included dueto uneven reporting during the period.Sources: ECB, ESMA.

ESMA Report on Trends, Risks and Vulnerabilities No. 1, 2016 80
Central securities depositories
A.141 A.142 Settlement activity Settlement fails
A.143 A.144 Securities held in CSD accounts Value of settled transactions
Credit rating agencies
A.145 A.146 Rating performance Rating accuracy
Financial benchmarks
A.147 A.148 Number of Euribor panel banks Dispersion in Euribor contributions
0
500
1,000
1,500
2,000
2,500
Jan-14 May-14 Sep-14 Jan-15 May-15 Sep-15
Corporate bonds Equities Government bonds
Note: Total value of settled transactions in the EU as reported by NCAs; dailyvalues in EUR bn. Free-of-payment transactions not considered.Sources: National Competent Authorities, ESMA.
0
1
2
3
4
5
6
Jan-14 May-14 Sep-14 Jan-15 May-15 Sep-15
Corporate bonds Equities Government bonds
Note: Share of failed settlement instructions in EU; % of value, 5D-MA. Free-of-payment transactions not considered.Sources: National Competent Authorities, ESMA.
0
10
20
30
40
50
2007 2008 2009 2010 2011 2012 2013 2014
Others Iberclear Monte Titoli Crest Clearstream Euroclear
Note: Value of securities held by EU CSDs in accounts; annual data in EUR tn.Sources: ECB, ESMA.
0
200
400
600
800
1,000
1,200
2008 2009 2010 2011 2012 2013 2014
Others Monte Titoli Iberclear Euroclear Crest Clearstream
Note: Value of settlement instructions processed by EU CSDs; EUR tn.Sources: ECB, ESMA.
0
0.2
0.4
0.6
0.8
1
1H10 1H11 1H12 1H13 1H14 1H15
Non-financials Financials Structured finance
Note: Cumulative accuracy profile (CAP) coefficients measure the accurancy ofratings. The coefficient is derived from average defaulter position (AP), thencomputed as follows: CAP = 2*AP-1. The closer the coefficient is to 1, the higherthe accuracy of the ratings (i.e. defaults occur among low credit ratings).Sources: CEREP, ESMA.
0.0
0.2
0.4
0.6
0.8
1.0
0.0 0.2 0.4 0.6 0.8 1.0
Financials Non-financials
Structured finance Random
Note: Cumulative accuracy profile (CAP) curves for the 3 largest credit ratingagencies. 2H10-1H15. The CAP curve plots the cumulative proportion of issuersby rating grade (starting with the lowest grade on the left) against the cumulativeproportion of defaulters by rating grade.Sources: CEREP, ESMA.
0
5
10
15
20
25
30
35
Jan-14 May-14 Sep-14 Jan-15 May-15 Sep-15 Jan-16
Note: Number of banks contributing to the Euribor panel; non-viability isassumed at 12 contributing banksSources: Euribor-EBF, ESMA.
0
0.2
0.4
0.6
0.8
Dec-13 Apr-14 Aug-14 Dec-14 Apr-15 Aug-15 Dec-15
Note: Normalised difference in percentage points between the highestcontribution submitted by panel banks and the corresponding Euribor rate. Thechart shows the maximum difference across the 8 Euribor tenors. The increasesince 2013 is linked to technical factors such as low Euribor rates. The spike inAugust 2014 reflects the fact that two panel banks submitted respectively aquote for the two-week tenor which was 7 times higher than Euribor and aquote for the 1M tenor which was 10 times higher than Euribor.Sources: Euribor-EBF, ESMA.

ESMA Report on Trends, Risks and Vulnerabilities No. 1, 2016 81
A.149 A.150 Euribor submission dispersion Euribor submission variation
-0.2
0.0
0.2
0.4
0.6
Dec-13 Apr-14 Aug-14 Dec-14 Apr-15 Aug-15 Dec-15
Top 15% Core 70%
Bottom 15% 3M Euribor
Raw 3M Euribor ECB refinancing rate
Note: Dispersion of 3M Euribor submissions, in %. The "Raw 3M Euribor" rateis calculated without trimming the top and bottom submissions of the panel forthe 3M Euribor.Sources: Euribor-EBF, ESMA.
-0.2
0.0
0.2
0.4
0.6
0.0
0.2
0.4
0.6
0.8
1.0
Dec-13 Apr-14 Aug-14 Dec-14 Apr-15 Aug-15 Dec-15
Rate increase Rate unchanged
Rate reduction ECB refinancing rate (rhs)
Three-month Euribor (rhs)
Note: Number of banks changing their three-month Euribor submission fromday to day, %.Sources: Euribor-EBF, ESMA.

ESMA Report on Trends, Risks and Vulnerabilities No. 1, 2016 82
List of abbreviations ABS Asset-Backed Securities
AuM Assets under Management
AVG Average
BF Bond fund
BPS Basis points
CAP Cumulative Accuracy Profile
CCP Central Counterparty
CDO Collateralised Debt Obligation
CDS Credit Default Swap
CRA Credit Rating Agency
DTCC Depository Trust & Clearing Corporation
EA Euro Area
EBA European Banking Authority
ECB European Central Bank
EF Equity fund
EFAMA European Fund and Asset Management Association
EIOPA European Insurance and Occupational Pensions Authority
EM Emerging market
EMIR European Market Infrastructure Regulation
EOB Electronic Order Book
EONIA Euro Overnight Index Average
ESMA European Securities and Markets Authority
ETF Exchange Traded Fund
EU European Union
FRA Forward Rate Agreement
IMF International Monetary Fund
IPO Initial Public Offering
IRS Interest Rate Swap
LTRO Long-Term Refinancing Operation
MA Moving Average
MBS Mortgage-Backed Securities
MMF Money Market Funds
MTN Medium Term Note
NAV Net Asset Value
NCA National Competent Authority
OIS Overnight Index Swap
OMT Outright Monetary Transactions
OTC Over the Counter
RMBS Residential Mortgage-Backed Securities
SCDS Sovereign Credit Default Swap
SF Structured Finance
UCITS Undertaking for Collective Investment in Transferable Securities
YTD Year to Date
Countries abbreviated according to ISO standards
Currencies abbreviated according to ISO standards
