trusting teachers’ judgments: a validity study of a ... · authors (corbett & wilson, 1991;...
TRANSCRIPT

American Educational Research JournalSpring 2001, Vol. 38, No. 1, pp. 73–95
Trusting Teachers’ Judgments:A Validity Study of a Curriculum-EmbeddedPerformance Assessment in Kindergarten to
Grade 3
Samuel J. MeiselsUniversity of MichiganDonna DiPrima Bickel
University of PittsburghJulie Nicholson, Yange Xue, and Sally Atkins-Burnett
University of Michigan
Teacher judgments of student learning are a key element in performanceassessment. This study examines aspects of the validity of teacher judg-ments that are based on the Work Sampling System (WSS), a curriculum-embedded, performance assessment for preschool (age 3) to Grade 5. Thepurpose of the study is to determine if teacher judgments about studentlearning in kindergarten to third grade are trustworthy if they are informedby a curriculum-embedded performance assessment. A cross-sectionalsample composed of 345 K-3 students enrolled in 17 classrooms in an ur-ban school system was studied. Analyses included correlations betweenWSS and an individually administered psychoeducational battery, four-step
SAMUEL J. MEISELS is Professor, School of Education, University of Michigan, AnnArbor, MI 48109-1259. E-mail: [email protected]. His areas of specialization areearly childhood education and assessment.
DONNA DIPRIMA BICKEL is Resident Fellow, Institute for Learning, University ofPittsburgh, Pittsburgh, PA 15260. Her areas of specialization are primary literacy andcontent-focused coaching.
JULIE NICHOLSON completed her doctorate at the University of Michigan and re-sides in Palo Alto, CA. Her areas of specialization are emergent literacy, use oftechnology in early childhood education and quantitative methodology.
YANGE XUE is a Doctoral Student at the University of Michigan, Ann Arbor, MI48109-1259. Her areas of specialization are early childhood education and quantita-tive methodology.
SALLY ATKINS-BURNETT is Senior Research Associate, University of Michigan, AnnArbor, MI 48109-1259. Her areas of specialization are early childhood special edu-cation and assessment.

hierarchical regressions to examine the variance in students’ spring outcomescores, and receiver-operating-characteristics (ROC) curves to compare theaccuracy of WSS in categorizing students in terms of the outcome. Resultsdemonstrate that WSS correlates well with a standardized, individually ad-ministered psychoeducational battery; that it is a reliable predictor ofachievement ratings in K-3; and that the data obtained from WSS havesignificant utility for discriminating accurately between children who are atrisk (e.g., Title I) and those who are not at risk. Further discussion concernsthe role of teacher judgment in assessing student learning and achievement.
Assessments that rely on teacher judgments of students’ academic perfor-mance are used widely in research and applied settings. In research
settings, they contribute to evaluations of intervention studies, classroomprocesses, and children’s intellectual, socioemotional, and behavioral devel-opment (Hoge, 1983). In applied settings, teachers rely at least as often ontheir own judgments as they do on more conventional standardized mea-sures in evaluating students’ achievements, planning instruction, and report-ing to parents (McTighe & Ferrara, 1998; Popham, 1996; Sharpley & Edgar,1986; Stiggins, 1997, 1998). Teachers’ judgments are also used for screeningand making diagnostic decisions about referrals and special placements forstudents (Hoge, 1984). District and state-level assessments rely increasinglyon teacher observation and judgment to evaluate students’ performances inwriting, science, and visual or performing arts (Baron & Wolf, 1996; Mills,1996; Stiggins, 1997).
Some researchers argue that teachers can be valid assessors of theirstudents (for a review of this issue, see Perry & Meisels, 1996). They believethat teachers are in the best position to evaluate their students’ intellectual,socioemotional, and behavioral accomplishments because they observe andinteract with students on a daily basis (Calfee & Hiebert, 1991; Hopkins,George, & Williams, 1985; Kenny & Chekaluk, 1993). Others express con-cerns about the trustworthiness and consistency (i.e., validity and reliability)of these assessments (Hoge & Coladarci, 1989). Specifically, do teachershave sufficient knowledge about the domains that are tested and the tasksthey are asked to judge? Also questioned are teachers’ abilities to discrimi-nate such constructs as achievement and motivation and such individualdifferences as low achievement and specific learning disabilities (Hoge &Butcher, 1984; Salvesen & Undheim, 1994). Other areas of concern are thesubjectivity inherent in teachers’ judgments (Silverstein, Brownlee, Legutki,& MacMillan, 1983) and the extent to which teachers’ expectations andbiases may influence student outcomes (Hoge, 1983; Hoge & Butcher, 1984;Sharpley & Edgar, 1986). Given these concerns, and their implications forstudents, it is reasonable to ask, “Can we trust teachers’ judgments of studentperformance?”
Meisels et al.
74

Curriculum-embedded performance assessments (often called “authen-tic assessments”) rely heavily on teacher judgment. They are defined asintegrated parts of the learning experience that differ from on-demand as-sessments, which are often external to the classroom. Curriculum-embeddedperformance assessments are integrated into the daily curriculum and in-structional activities of a classroom. They consist of “real instances of ex-tended criterion performances, rather than proxies or estimators of actuallearning goals” (Shepard, 1991, p. 21). In contrast, on-demand assessments,whether performance-based or not, are not necessarily drawn from the ac-tual repertoire of the classroom and do not always occur during the processof teaching and learning. For example, students perform at a certain placeand time and in a certain way.
The literature on performance assessment has been growing for morethan a decade (Baker, O’Neil, & Linn, 1993; Darling-Hammond & Ancess,1996; Frederiksen & Collins, 1989; Herman, Aschbacher, & Winters, 1992;Linn, 2000; Linn, Baker, & Dunbar, 1991; Meisels, Dorfman, & Steele, 1995;Resnick & Resnick, 1992; Wiggins, 1989; Wolf, Bixby, Glenn, & Gardner,1991). Researchers and practitioners have demonstrated a significant interestin this approach to evaluating student learning. Extensive empirical supportfor the accuracy of teachers’ judgments based on performance assessmentsis unavailable. However, evidence (derived largely from on-demand assess-ments) is accruing on the potential of performance assessments to improveteaching and learning (Borko, Flory, & Cumbo, 1993; Darling-Hammond,1994; Falk & Darling-Hammond, 1993; Gearhart, Herman, Baker, & Whit-taker, 1993; Khattri, Kane, & Reeve, 1995; Linn, 1993; Meisels, 1997; Meisels,Dorfman, & Steele, 1994; Smith et al., 1994; Taylor, 1994). Use of perfor-mance assessments in Vermont (Koretz, Stecher, Klein, & McCaffrey, 1994),Kentucky (Kentucky Institute for Education Research, 1995), and Maryland(Almasi, Afflerbach, Guthrie, & Schafer, 1995; Koretz, Mitchell, Barron, &Keith, 1996) resulted in positive changes in instruction. Other researchersalso reported that performance assessments led to better curricular integra-tion (Khattri et al., 1995), positive changes in instructional practices (Stecher& Mitchell, 1996), greater use of higher-order thinking skills in instruction(Koretz, Stecher, Klein, & McCaffrey, 1994), and more awareness of andemphasis on individual growth and development in classrooms (Asch-bacher, 1993).
Supporters view performance assessment as a potential remedy forsome of the frequently reported abuses of conventional, standardized,group-administered tests (Gardner, 1993; Wiggins, 1993). These and otherauthors (Corbett & Wilson, 1991; Sternberg, 1996; Sykes & Elmore, 1989)point out that norm-referenced, achievement tests can be used to establish asystem in which indicators of learning overwhelm attention to learning itself.Achievement tests, particularly when they are institutionalized in high-stakesdistrict or state tests, draw attention primarily to what is measured andneglect elements of the curriculum that are not measured. They encouragea standardized pedagogy for use with a nonstandard, diverse student popu-
Trusting Teachers’ Judgments
75

lation, offer few rewards for innovation or risk taking on the part of teachersor students, and distort the motivational climate for teaching and learning.
However, the promises of performance assessments have not alwaysbeen realized and have rarely been documented empirically. For example,Green (1998) questioned the gains reported on performance assessments bycertain states (e.g., Kentucky) and others (Murphy, Bergamini, & Rooney,1997) have suggested that performance assessments actually work against somereform goals, such as constructivist approaches to teaching and learning.
Critics (Mehrens, 1998) argue that performance assessment has nar-rowed the curriculum and decreased the effectiveness of instruction (Khattriet al., 1995; Murphy et al., 1997). Other commonly cited problems includeinadequate reliability (Linn, 1994; but see Moss, 1994, for a response to thiscriticism), limited generalizability across tasks (Shavelson, Baxter, & Pine,1992), the potential to widen achievement gaps (Linn et al., 1991), and thecost and extensive time required to train teachers to administer and scoreperformance assessments (Cizek, 1991; U.S. General Accounting Office,1993). More evidence is needed to verify the promises of curriculum-embedded performance assessments.
The present study examines the relationship of curriculum-embeddedperformance assessment to other key indicators of student achievement. Weinvestigate the validity of the Work Sampling System (WSS; Meisels, Jablon,Marsden, Dichtelmiller, & Dorfman, 1994), a performance assessment forpreschool (3-year-olds) to Grade 5, by determining whether teacher judg-ments about student learning are trustworthy when those judgments arebased on the WSS. Previous research on the WSS (Meisels, Liaw, Dorfman,& Nelson, 1995) was limited to a cohort of 100 kindergarten children whowere administered the field trial version of the assessment. Meisels et al.(1995) reported high internal reliability on the WSS checklists (Cronbachalphas ranging from .84 to .95) and moderate interrater reliability on the WSSsummary report (zero-order correlations between two external raters and 10teachers of .68 and .73, p < .001). Moderate to high correlations were alsoobtained between the fall WSS checklist and psychoeducational assessmentsgiven in the fall (r = .74) and spring (r = .66). Two-step hierarchical regressions demonstrated significant contributions of the fall WSS checklist to predic-tions of children’s performance in the spring, even when the potential effects ofgender, maturation (age), and initial ability (fall test scores) were controlled.
The cross-sectional, psychometric investigation presented here ex-tends the previous study and represents the first investigation ever con-ducted of a curriculum-embedded performance assessment in the earlyelementary grades. Many aspects of the validity of performance assess-ments, besides their relationship to external criteria, are important to con-sider (Baker et al., 1993; Frederiksen & Collins, 1989; Linn et al., 1991).However, a design that demonstrates the validity of curriculum-embeddedperformance assessment and the trustworthiness of teacher judgments iscrucial to show practitioners and policy makers the accuracy and practicalityof their use.
Meisels et al.
76

Sample, Methods, and Procedures
This report is part of a larger study of the WSS that collected data fromstudents, parents, and teachers, using multiple means of measurement. In-formation is presented here concerning the direct assessment of children.We focus primarily on validity evidence regarding the relationship of WSS toother achievement variables (for a discussion of additional aspects of validityrelated to performance assessment see Baker et al., 1993; Moss, 1992, 1996).Other studies presented additional validity evidence, including analyses ofconsequential aspects of validity based on extensive interviews with teachers(for a preliminary report, see Meisels, Bickel, Nicholson, Xue, & Atkins-Burnett, 1998) and on reactions of parents to the WSS (Meisels, Xue, Bickel,Nicholson, & Atkins-Burnett, in press).
Sample
The teachers (N = 17) in the WSS schools were all voluntary participants.Selection criteria for participation included (1) at least 2 years experienceusing WSS, (2) a rating within the highest quartile of teacher participants,based on a review conducted in the spring of 1996 by external examiners ofWSS portfolios, and (3) a determination by the research team that the teach-ers’ 1996–1997 WSS materials were completed competently. The criteriacontributed to our confidence in the fidelity of teachers’ implementation ofWSS and enabled us to focus on variability in children’s learning rather thanvariability of implementation. All of the teachers in the sample were female.Of the sample, 13% were African American and 77% were Caucasian. Nearlyone half (47%) had completed a Master’s degree and had more than 10 yearsof teaching experience.
The study presents cross-sectional data of students enrolled in K-3 infive Pittsburgh public schools (PPS). At the time of the study (1996-1997),WSS had been implemented in these schools for 3 years. The student studysample was composed of 345 children, all of whom were enrolled in WSSschools. Table 1 presents the demographic characteristics of these students.Most of them were African American (69.9%) and the majority of studentsreceived free or reduced lunch (79.4%). Gender was distributed fairly evenly(males = 48.7%) and only a small number of children were classified aschildren with special needs (7.8%).
Measures
Work Sampling System. WSS is a low-stakes, curriculum-embeddedperformance assessment. Its primary purpose is instructional assessment. Itis not designed to rank and compare students or to be used for high-stakesdecision-making. Rather, its value is linked to its impact on instruction. TheWSS clarifies what students are learning and mastering by providing infor-mation relevant to understanding students’ academic, personal and social,and other accomplishments. It guides instructional decision-making and pro-
Trusting Teachers’ Judgments
77

vides instructionally relevant information to teachers that can be used toenhance teaching and improve learning. Extensive professional develop-ment is available to prepare teachers to use the WSS. Many states and schooldistricts have adopted it for use in the early years of school.
The multidimensionality of the WSS is unique. It uses three forms ofdocumentation: checklists, portfolios, and summary reports (see Dichtel-miller, Jablon, Dorfman, Marsden, & Meisels, 1997; Meisels, 1996; 1997).Checklists for each grade (from preschool to Grade 5) list specific classroomactivities and learner-centered expectations that were derived from nationaland state curriculum standards. The checklists consist of items (K = 67, Grade1 = 74, Grades 2 and 3 = 75) that measure seven domains of development:personal and social (self-concept, self-control, approach to learning, inter-actions with others, conflict resolution); language and literacy (listening,speaking, literature and reading, writing, and spelling); mathematical think-ing (patterns, number concepts and operations, geometry and spatial rela-tions, measurement, and probability and statistics); scientific thinking(observing and investigating, questioning and predicting, explaining andforming conclusions); social studies (human similarities and differences, hu-man interdependence, rights and responsibilities, people and where theylive, and people and the past); the arts (expression and representation,artistic appreciation); and physical development (gross and fine motor,health and safety). For this study, only language and literacy and mathematical thinking ratings are reported. We chose these two domains because they areassessed most adequately on the outcome measure we selected; they are the
Table 1Work Sampling System Cross-Sectional Sample Characteristics
Demographicvariable
Kindergarten(N = 75)
First grade(N = 85)
Second grade(N = 91)
Third grade(N = 94)
Age range(months) 57–73 69–94 80–104 93–120
Ethnicity 67% AA (50) 60% AA (51) 62% AA (56) 89% AA (84)21% White (16) 35% White (30) 36% White (33) 10% White (9)1% Hispanic (1) 2% Asian (2) 1% Asian (1) 1% Other (1)7% Asian (5) 2% Other (2)4% Other (3)
Disability 3% LD (2) 1% LD (1) 3% LD (3) 5% LD (5)classification 1% MH (1) 4% MH (3) 7% MH (6) 1% MH (1)
2% OH (2) 1% BD (1)2% OH (2)
Lunch status 57% Free (43) 86% Free (73) 84% Free (76) 77% Free (72)3% Reduced (2) 2% Reduced (2) 3% Reduced (3) 3% Reduced (3)
37% Regular (28) 8% Regular (7) 12% Regular (11) 12% Regular (11)Sex 57% Male (43) 47% Male (40) 49% Male (45) 43% Male (40)
43% Female (32) 53% Female (45) 51% Female (46) 57% Female (54)
Note. Due to missing data, not all percentages total 100. AA = African American; LD = learningdisabled; MH = mentally handicapped; BD = behavior disordered; OH = other handicap.
Meisels et al.
78

academic areas of greatest interest to policy makers; and many school districtsimplement only these two domains plus personal and social development.
Every skill, behavior, or accomplishment included on the checklist ispresented in the form of a one-sentence performance indicator (e.g., “Fol-lows directions that involve a series of actions”) and is designed to helpteachers document each student’s performance. Accompanying each check-list are detailed developmental guidelines, which present the rationale foreach performance indicator and briefly outline reasonable expectations forchildren of that age. Examples show several ways children might demon-strate the skill or accomplishment represented by the indicator. The guide-lines promote consistency of interpretation and evaluation among differentteachers, children, and schools.
Portfolios illustrate students’ efforts, progress, and achievements in ahighly organized and structured way. WSS portfolios include two examplesof work (core items and individualized items) that exemplify how a childfunctions in specific areas of learning throughout the year in five domains:language and literacy, mathematical thinking, scientific thinking, social stud-ies, and the arts. Portfolio items are produced in the context of classroomactivities. They illustrate qualitative differences among students’ work andenable children to take an active role in evaluating their own work.
The summary report replaces conventional report cards as a means ofinforming parents and recording student progress for teachers and admin-istrators. The summary report ratings are based on information recorded onthe checklists, materials collected for the portfolio, and teachers’ judgmentsabout the child’s progress across all seven domains. Teachers do the reportsthree times per year, completing brief rating scales and writing a narrativeabout their judgments. The report is available in hard copy and electronicversions. It translates the information documented on the checklists andin the portfolios into easily understandable evaluations for students, fami-lies, administrators, and others. The report summarizes student performanceand progress and permits the instructional evidence to be aggregated andanalyzed. Examples of all WSS materials are available on-line at www.rebusinc.com.
Teachers rate students’ performance on each item of the WSS checklistthree times per year (fall, winter, and spring) and compare the ratings withnational standards for children of the same grade. They use a modifiedmastery scale: 1 = not yet, 2 = in process, or 3 = proficient. During the samethree periods, teachers also complete the hand-written or electronic sum-mary report. They summarize each child’s performance in the seven domainsand rate student achievement within a domain as 1 = as expected or 2 =needs development. Teachers rate students’ progress separately from per-formance on the summary report as 1 = as expected or 2 = other thanexpected (distinguished as below or above expectations) and compare itwith their past performance.
Subscale scores for the checklist were created by computing the meanscore for all items within a particular domain (i.e., language and literacy or
Trusting Teachers’ Judgments
79

mathematical thinking). Subscale scores for the summary report were cre-ated by computing a mean for a combination of three scores: students’checklist and portfolio performance ratings and ratings of student progress.When computing the subscale scores, missing data in the teachers’ WSSratings were addressed by using mean scores instead of summing teachers’ratings.
Woodcock-Johnson Psychoeducational Battery-Revised. The achieve-ment battery of the WJ-R (Woodcock & Johnson, 1989) is an individuallyadministered achievement test that was normed on a population of 6,359individuals chosen in a random stratified sample procedure. Eight subtestswere administered in this study: letter-word identification, passage compre-hension, dictation, writing sample, applied problems, calculation, science,and social studies (results of science and social studies are not described inthis study). We report several WJ-R cluster scores including broad reading(combining letter-word identification and passage comprehension), broadwritten language (dictation and writing samples), broad math (applied prob-lems and calculation), skills (letter-word identification, applied problems,and dictation), and language and literacy (standard scores in letter-wordidentification and dictation for kindergartners and broad reading and broadwritten language standard scores for first-graders through third-graders). AllWJ-R scores represent standard scores (vs. raw scores) and were computedon software supplied by the test manufacturer (Compuscore) using grade-level norms. The WJ-R introduces method variance into all analyses becauseit is a very different type of assessment than the WSS. However, it wasselected because no other performance assessment comparable to the WSSexists that could be used as an external criterion (completing two differentperformance assessments would be impractical in any event). The WJ-R iscomprehensive, well researched, and covers the two principal areas of aca-demic achievement that are the focus of this study. Moreover, as an indi-vidually administered assessment, the WJ-R is clinically more sensitive thanconventional group-administered tests.
Procedures and Analyses
The 17 study teachers implemented the WSS throughout the 1996–1997school year by completing checklists on three occasions (fall, winter, andspring). They continuously collected material for the portfolios and prepareda summary report for the fall, winter, and spring reporting periods. The WJ-Rwas administered in October/November and again in April/May. All exam-iners received training on the administration of the WJ-R prior to the falltesting period and there was a follow-up review of administration proce-dures before the spring testing dates. Examiners were blind to the study’spurposes.
Three analyses were conducted with the cross-sectional data usingteachers’ WSS ratings of student achievement and students’ WJ-R standardscores: (a) correlations compared students’ standard scores on the subtests of
Meisels et al.
80
the WJ-R and the WSS checklist and summary report ratings of studentachievement within the corresponding WSS domains, (b) four-step hierar-chical regressions examined the factors that accounted for the variance instudents’ spring WJ-R scores, and (c) Receiver-Operating-Characteristic(ROC) curves determined if a random pair of average and below-averagescores on the WJ-R would be ranked correctly in terms of performance onthe WSS. Descriptions of each of these analyses follow.
Evidence of concurrent aspects WSS’s validity was examined by com-puting correlations between WSS subscale scores and students’ WJ-R stan-dard subtest and broad scores to show the amount of shared variancebetween the two assessments. Correlations of .70–.75 are optimal becausethey indicate a substantial overlap between the two assessments, yet alsorecognize that each instrument contributes independently to the assessmentof students’ learning. If correlations are high (�.80), more than one half ofthe variance between the WSS and the WJ-R is shared and the predictor (inthis case, the WSS) does not add sufficient new information to justify its use.Conversely, low correlations (�.30) suggest very little overlap between theWSS and more conventional achievement tests, thus raising the question ofwhat exactly is measured by the predictor.
Four-step hierarchical regression analyses were used to determine if theWSS checklist and summary report ratings made a unique contribution to thechildren’s performance on the WJ-R over and above the effects of children’sgender, age, socioeconomic status (SES; as represented by free and reducedlunch vs. regular lunch status), ethnicity, and initial performance level on theWJ-R. The demographic variables (gender, age, SES, ethnicity) were enteredin the first step of the four-step model. The WSS checklist was entered in thesecond step and the summary report was added in the third. In the final step,children’s initial performance level (fall WJ-R standard scores) was entered.The increment in the variance explained was noted for each step in order toassess the contribution of the WSS and initial performance level above andbeyond the demographic factors.
ROC curve analysis was conducted in order to study the utility of usingthe WSS to classify students in need of supportive educational services (e.g.,Title I). ROC data enable investigators to examine whether two differentassessments will assign students to the same or different categories (ROCpercentages �.80 are considered excellent). To accomplish this, we estab-lished cutoffs for the WJ-R and performed a cost-matrix analysis to obtainoptimal cutoffs for the WSS. The WJ-R is commonly used in clinical appli-cations with children suspected of having learning disabilities or other prob-lems that might affect their academic success. The analysis enabled us todetermine the probability that the WSS ratings can be used accurately toassign students to a high-risk or low-risk group.
Missing Data
Sample sizes vary in the cross-sectional study, ranging from 75 to 94 studentsper grade. Several factors may explain the variance, including children
Trusting Teachers’ Judgments
81

Table 2Correlations of WJ-R Standard Scores Using Grade Norms With WSS
Checklist and Summary Report Ratings
WJ-R subtest/WSSdomain
Kindergarten First grade Second grade Third grade
Fall Spring Fall Spring Fall Spring Fall Spring
WJ-R Letter-WordKnowledge/WSSLanguage andLiteracy Checklist
.36 (.005)N = 66
.45N = 66
.65N = 73
.68N = 73
.61N = 78
.63N = 78
.78N = 74
.76N = 74
WJ-R Letter-WordKnowledge/WSSLanguage andLiteracy SummaryReport
.53N = 66
.56N = 66
.55N = 74
.68N = 74
.70N = 80
.72N = 80
.65N = 74
.45N = 74
WJ-R PassageComprehension/WSS Language andLiteracy Checklist
NA NA .30 (.01)N = 74
.63N = 74
.55N = 75
.60N = 75
.74N = 83
.71N = 83
WJ-R PassageComprehension/WSS Language andLiteracy SummaryReport
NA NA .32 (.005)N = 76
.70N = 76
.62N = 77
.74N = 77
.57N = 83
.40N = 83
WJ-R Dictation/WSSLanguage andLiteracy Checklist
.44N = 66
.47N = 66
.68N = 74
.68N = 74
.53N = 59
.48N = 59
.74N = 66
.72N = 66
WJ-R Dictation/WSSLanguage andLiteracy SummaryReport
.59N = 66
.62N = 66
.57N = 76
.58N = 76
.68N = 59
.69N = 59
.55N = 65
.47N = 65
WJ-R Writing/WSSLanguage andLiteracy Checklist
NA NA .49N = 67
.59N = 67
.59N = 66
.61N = 66
.55N = 71
.54N = 71
WJ-R Writing/WSSLanguage andLiteracy SummaryReport
NA NA .46N = 69
.67N = 69
.55N = 67
.66N = 67
.50N = 72
.42N = 72
WJ-R Broad Reading/WSS Language andLiteracy Checklist
NA NA .55N = 67
.73N = 67
.60N = 73
.62N = 73
.80N = 71
.79N = 71
WJ-R Broad Reading/WSS Language andLiteracy SummaryReport
NA NA .48N = 68
.74N = 68
.67N = 75
.74N = 75
.64N = 71
.45N = 71
WJ-R Broad Writing/WSS Language andLiteracy Checklist
NA NA .63N = 62
.68N = 62
.56N = 52
.57N = 52
.70N = 54
.70N = 54
WJ-R Broad Writing/WSS Language andLiteracy SummaryReport
NA NA .56N = 64
.67N = 64
.66N = 52
.73N = 52
.57N = 54
.53N = 54
(Continued)

whose families changed residences between fall and spring, incomplete WSSrecords (both fall and spring checklists and summary reports were requiredfor a child to be included in the analyses), and examiner variability in theadministration of the WJ-R. A few examiners did not obtain a ceiling score forall children administered the WJ-R. In order to standardize the administra-tion, the ceiling rule was lowered by one point and all test protocols wererescored and rechecked. This modification foreshortened the range of stu-dent responses, thus making the WJ-R results in this study a more conser-vative estimate of performance than if the standard six-item ceiling rule wasused. Students were dropped from the analyses when a ceiling rule of fivecould not be obtained from the rescoring.
Table 2 (Continued)
WJ-R subtest/WSSdomain
Kindergarten First grade Second grade Third grade
Fall Spring Fall Spring Fall Spring Fall Spring
WJ-R Language andLiteracy/WSSLanguage andLiteracy Checklist
.44N = 66
.50N = 66
.68N = 55
.79N = 55
.63N = 48
.60N = 48
.78N = 45
.82N = 45
WJ-R Language andLiteracy/WSSLanguage andLiteracy SummaryReport
.61N = 66
.65N = 66
.54N = 56
.73N = 56
.77N = 48
.74N = 48
.62N = 45
.53N = 45
WJ-R AppliedProblems/WSSMathematicalThinking Checklist
.52N = 66
.57N = 66
.44N = 79
.56N = 79
.40N = 78
.36 (.005)N = 78
.67N = 80
.65N = 80
WJ-R AppliedProblems/WSSMathematicalThinking SummaryReport
.59N = 66
.65N = 66
.52N = 79
.51N = 79
.46N = 80
.56N = 80
.54N = 79
.56N = 79
WJ-R Calculation/WSSMathematicalThinking Checklist
NA NA .50N = 80
.73N = 80
.59N = 83
.40N = 83
.66N = 80
.63N = 80
WJ-R Calculation/WSSMathematicalThinking SummaryReport
NA NA .57N = 80
.52N = 80
.58N = 85
.52N = 85
.48N = 80
.56N = 80
WJ-R Broad Math/WSS MathematicalThinking Checklist
NA NA .54N = 78
.71N = 78
.56N = 78
.39N = 78
.76N = 76
.72N = 76
WJ-R Broad Math/WSS MathematicalThinking SummaryReport
NA NA .64N = 78
.56N = 78
.57N = 80
.58N = 80
.58N = 75
.60N = 75
Note. All significance levels are based on two-tailed tests; p < .001 unless noted otherwise inparentheses. NA = not applicable; WJ-R = Woodcock-Johnson Psychoeducational Battery-Revised; WSS = Work Sampling System.
Trusting Teachers’ Judgments
83

In order to study the impact of the missing data on our conclusions, wecombined the missing data into two groups: (a) students whose WJ-R datawere excluded from analysis due to examiner variability (Group 1) and (b)students who moved and/or had missing WSS or WJ-R data (Group 2).Analyses were completed to determine if there were systematic differencesbetween Groups 1 and 2. The final total sample is described in Table 1.Among second and third-graders, boys were overrepresented in Group 2;otherwise, there were no gender differences between the groups. In a fewcases, the small number of children in Group 1 prevented the use of statis-tical procedures to compare this group with the larger sample. For all analy-ses, no systematic differences were found between the sample of childrenwhose data were dropped due to variability in test administration (Group 1)and the final total sample. Therefore, the relatively small numbers in Group1 and the lack of differences between Group 1 and the total sample suggestthat the study’s findings were not affected when we dropped some studentsdue to differences in WJ-R administration. No differences were found inkindergarten, first, or second grade between Group 2 (students who movedand/or had missing WSS data) and the final sample. However, for third-graders, Group 2 had lower WJ-R scores on all literacy subtests, and oncalculation and broad math. Except for third grade, where the final sampleperformed above Group 2, there are no effects on the findings due to themissing data.
Results
This study was designed to describe the cross-sectional academic achieve-ments of four grade-level samples of children throughout the course of oneschool year. Although comparisons are useful, it is important to recognizethat these four grade-level samples may differ from each other in systematicways that are not captured by our analyses (e.g., retention history, age ofentry into school, curriculum exposure).
Correlations Between WSS Ratings and WJ-R Standard Scores
Table 2 displays correlations for all WJ-R subtests and cluster scores with theWSS checklist and summary report ratings across the four grade levels. Thedata in Table 2 enable us to examine the concurrent aspects of the validityof the WSS, that is, how WSS teacher ratings correlate with students’ standardscores using grade norms on an individually administered standardizedachievement test. Over three fourths of the correlations listed in Table 2 arewithin the range of .50–.75. Further, 48 of the 52 correlations (92%) betweenthe WSS and the comprehensive scores of children’s achievement (broadreading, broad writing, language and literacy, and broad math) fall withinthis moderate to high range. Only four of the correlations fall below .50.Overall, the data in Table 2 present strong prima facie evidence for theconcurrent aspects of WSS’s validity.
Meisels et al.
84

Predictors of WJ-R Test Scores for Each of the Four Grade-Level Samples
Concurrent aspects of validity were also examined by four-step hierarchicalregression analyses. The regressions determined if the WSS ratings made aunique contribution to children’s performance on the WJ-R over and abovethe influence of demographic factors and children’s initial performance levelon the WJ-R. Tables 3 and 4 show the predictors of spring WJ-R language andliteracy and broad mathematics scores, respectively, for K-3. Results of thefour-step regressions indicate that significant associations between WSSspring ratings and WJ-R spring outcomes remained even after controlling forthe potential effects of age, SES, ethnicity, and students’ initial performancelevel on the WJ-R in literacy (K-2) and in math (K-1). Children’s performanceon standardized achievement tests generally improves over time. Therefore,we expected that as children progressed in grade, the fall to spring reliabilityof their WJ-R standard scores would increase significantly and a largeramount of the variance in students’ spring WJ-R standard scores would beexplained by their fall WJ-R standard scores (their “initial performancelevel”). As anticipated, the stability of the second and third-grade WJ-R stan-dard scores was so high that initial performance on the fall WJ-R explainedmost of the variance in the spring WJ-R scores.
When examined across grades, several patterns emerge in the regres-sion results. In the first step of the regressions, only the demographic vari-ables were entered. This model was significant only in kindergarten andsecond grade for language and literacy and in kindergarten for math. Thechecklist was significant at all grade levels for both math and literacy whenentered into the second step of the regressions with the demographic vari-ables; it explained more than one half of the variance in literacy scores inGrades 1 and 3. When the summary report was entered in the third step, boththe summary report and the checklist contributed significantly in explainingthe variance in the spring WJ-R literacy scores for K-2. In the third grade, thechecklist alone was a significant predictor of the language and literacy score.In math, the WSS variables (either checklist or summary report) were sig-nificant predictors in Step 3 of the regressions for K-3. In brief, these resultsprovide further support for the concurrent validity of the WSS, particularly inthe area of literacy.
ROC Curves
To determine if the WSS can identify children who are in need of Title Iprograms or other supportive services, and in order to test if children wereclassified similarly by the WSS and WJ-R, a cost-matrix analysis was con-ducted. Cost-matrix analysis is a component of logistic regression. It is astatistical method for evaluating a “cost,” weighting differential outcomes,and evaluating the weighted outcome distributions at a number of cutoffpoints. Cost-matrix analysis is particularly useful for comparing two psycho-metric instruments that have a predictor–outcome relationship (Meisels,
Trusting Teachers’ Judgments
85

Tab
le3
Pre
dic
tors
of
Stu
den
t’s
Sp
rin
gW
J-R
Lan
gu
age
and
Lit
erac
yS
core
s(K
-3)
Var
iab
les
ente
red
into
regr
essi
on
mo
del
Reg
ress
ion
coef
fici
ents
for
mo
del
1R
egre
ssio
nco
effi
cien
tsfo
rm
od
el2
Reg
ress
ion
coef
fici
ents
for
mo
del
3R
egre
ssio
nco
effi
cien
tsfo
rm
od
el4
K1
23
K1
23
K1
23
K1
23
Sex
ofst
uden
t(f
emal
e)−.1
59.1
71.2
43−.0
04−.2
05*
.018
.113
−.0
26−.1
56−.0
46.0
98−.0
23−.1
84−.1
05.0
44−.0
60St
uden
tag
e(m
onth
s).2
41*
−.0
00−.2
68*
−.1
81.1
05.0
92−.1
81−.1
28−.0
22.0
79−.1
65−.1
23−.1
27.0
53−.0
40−.0
02Eth
nic
ity(A
fric
anA
mer
ican
)−.2
07.0
17.1
86.0
22−.0
72−.0
08.2
40*
−.0
12−.1
02−.0
48.1
50−.0
20.0
32.0
23.0
08−.0
10So
cioec
onom
icst
atus
(fre
eor
reduce
dlu
nch
)−.4
10*
−.2
03−.3
44**
−.0
98−.3
40**
−.0
35−.2
62*
−.0
04−.3
06**
.009
−.1
56.0
01−.1
46.0
79−.0
19−.0
39W
SSch
eckl
ist
mea
nsc
ore
s(s
pring)
.413
**.8
00**
*.5
28**
*.8
12**
*.2
31*
.538
***
.245
*.8
66**
*.2
05*
.388
**−.0
07.1
11W
SSsu
mm
ary
report
mea
nsc
ore
s(s
pring)
.483
***
.378
**.4
87**
*−.0
75.2
62*
.308
*.1
58*
.034
WJ-
Rst
andar
dsc
ore
s(f
all)
.525
***
.309
*.7
99**
*.8
28**
*R
2.2
73.0
57.3
05.0
40.4
09.6
39.5
48.6
89.5
07.6
94.6
77.6
92.7
05.7
34.8
96.8
85R
2ch
ange
——
——
.136
.582
.243
.649
.158
.055
.129
.003
.138
.040
.219
.193
Not
e.W
J-R
=W
oodco
ck-Johnso
nPsy
choed
uca
tional
Bat
tery
-Rev
ised
;W
SS=
Work
Sam
plin
gSy
stem
.*p
�.0
5.**
p�
.01.
***p
�.0
01.

Tab
le4
Pre
dic
tors
of
Stu
den
ts’
Sp
rin
gW
J-R
Bro
adM
ath
emat
ics
Sco
res
(K-3
)
Var
iab
les
ente
red
into
regr
essi
on
mo
del
Reg
ress
ion
coef
fici
ents
for
mo
del
1R
egre
ssio
nco
effi
cien
tsfo
rm
od
el2
Reg
ress
ion
coef
fici
ents
for
mo
del
3R
egre
ssio
nco
effi
cien
tsfo
rm
od
el4
K1
23
K1
23
K1
23
K1
23
Sex
ofst
uden
t(f
emal
e)−.0
12.1
06.0
79.0
26.0
35.0
41.0
51−.0
20.0
76.0
00.0
35−.0
07.0
44.0
25.0
88.0
25St
uden
tag
e(m
onth
s).2
29.0
15−.1
39.0
61.1
12−.0
31−.1
12.0
91.0
22−.0
42−.1
37.0
91−.0
89−.0
32−.0
11.0
77Eth
nic
ity(A
fric
anA
mer
ican
)−.0
21.0
33−.0
89−.1
15−.0
63−.0
14−.1
00−.0
74−.1
24−.0
71−.1
53−.0
56−.0
37−.0
43−.0
80.0
13So
cioec
onom
icst
atus
(fre
eor
reduce
dlu
nch
)−.2
48**
−.2
79*
−.1
64−.0
93−.1
44−.1
52−.1
63.0
40−.1
01−.1
21−.0
65.0
36−.0
45−.1
02.0
10−.0
29W
SSch
eckl
ist
mea
nsc
ore
s(s
pring)
.509
**.7
05**
*.3
76**
*.7
25**
*.1
86.5
79**
*−.0
11.5
98**
*.1
71.4
35**
−.0
46.1
72W
SSsu
mm
ary
report
mea
nsc
ore
s(s
pring)
.531
***
.211
.591
***
.182
.254
*.0
70*
.155
*.0
96W
J-R
stan
dar
dsc
ore
s(f
all)
.494
***
.370
*.7
70**
*.6
95**
*R
2.1
37.0
83.0
64.0
23.3
63.5
56.2
05.5
30.4
87.5
75.3
91.5
47.6
09.6
46.7
39.7
89R
2ch
ange
——
——
.226
.473
.141
.507
.124
.019
.186
.017
.122
.071
.348
.242
Not
e.W
J-R
=W
oodco
ck-Johnso
nPsy
choed
uca
tional
Bat
tery
-Rev
ised
;W
SS=
Work
Sam
plin
gSy
stem
.*p
�.0
5.**
p�
.01.
***p
�.0
01.

Henderson, Liaw, Browning, & Ten Have, 1993). An optimal cutpoint isdefined statistically as the point at which the loss value is minimized. In otherwords, when used with a screening instrument, an optimal cutpoint willproduce a favorable ratio of overreferrals to underreferrals while maximizingcorrect identifications. Cost-matrix analysis, which is also called ROC curveanalysis (Hasselblad & Hedges, 1995; Sackett, Haynes, & Tugwell, 1985;Toteson & Begg, 1988), relies on the concepts of sensitivity (the proportionof at-risk children who are correctly identified) and specificity (the propor-tion of low-risk children who are correctly excluded from at-risk categories).
In this analysis, we used data from students who had spring WJ-R broadreading and broad math scores, as well as data from students who had WSSchecklist ratings in language and literacy and in mathematical thinking. Be-cause the WJ-R does not generate broad scores in reading and math inkindergarten, kindergartners were excluded from this analysis. The remain-ing sample included all the children in Grades 1-3 who had been adminis-tered both the WJ-R and the WSS (N = 237 for broad reading and N = 241 forbroad math). Children were considered at risk for academic difficulties iftheir score on the WJ-R was �1 SD below the mean (i.e., WJ-R standard score�85). Analyses were conducted separately for broad reading and broadmath. Children were not considered to be at risk if their scores were >85.Using this cutoff, 42.2% (100 of 237) and 23.2% (56 of 241) of the children inthis low-income, urban sample were at risk in reading and math, respec-tively. Using logistic regression cost matrices, optimal WSS cutoffs werederived for each domain with the dichotomous WJ-R categories as outcomes.The cutoff scores were a mean rating of 1.4 on the WSS Language and Literacychecklist and a mean score of 1.2 on the Mathematical Thinking checklist.
Figure 1 shows the area under the curve for the Language and Literacyand Mathematical Thinking checklists. The area under the ROC curve rep-resents the probability of a student performing poorly or well on both theWJ-R and the WSS. For language and literacy, the probability represented bythis area was 84%; for mathematical thinking, the probability was 80%. Thesefindings are favorable because they show that a randomly chosen student inacademic difficulty in either reading or math on the WSS has a much higherprobability of being ranked lower on the WJ-R than a randomly chosenstudent who is performing at or above average.
DiscussionThis study examined the accuracy of teachers’ judgments about studentachievement when they are based on evidence from a curriculum-embedded performance assessment. We examined psychometric aspects ofthe validity of the WSS. The results are encouraging and support teachers’use of the WSS to assess children’s achievement in the domains of literacyand mathematical thinking in kindergarten to Grade 3.
The validity of the WSS was examined by comparing the WSS checklistand summary report ratings with the WJ-R, a nationally normed, individuallyadministered, standardized assessment. Results of the correlational analyses
Meisels et al.
88

provided evidence for aspects of the validity of the WSS. The WSS demon-strates overlap with a standardized criterion measure and makes a uniquecontribution to the measurement of students’ achievement beyond that cap-tured by WJ-R test scores. The majority of the correlations between the WSSand the comprehensive scores of children’s achievement (broad reading,broad writing, language and literacy, and broad math) are similar to corre-lations between the WJ-R and other standardized tests. For example, theWJ-R manual reports correlations between the WJ-R and other reading mea-sures of .63–.86; the majority of correlations between the WJ-R comprehen-sive scores in literacy and the WSS range from .50 to .80. Correlationsbetween the WJ-R and other math measures range from .41 to .83; the rangefor the majority of correlations between the WSS and WJ-R broad math was.54 to .76 (Woodcock & Johnson, 1989).
Although most correlations reported were moderate to strong, a few ofthe correlations were <.50 in each of the grade levels. The lower correlationsin kindergarten and the fall of first grade can be understood by consideringthe contrast between the limited content represented on the WJ-R literacyitems compared with the full range of emergent and conventional literacyskills considered by WSS teachers as they rate young students’ literacyachievement. Cohort differences, particularly in first grade, also may havecontributed to this variability. As students make the transition to conven-tional literacy, which is the focus of the WJ-R test items, correlations gener-ally increase between the two measures. The lower correlations in Grade 3are seen only with the WSS summary report ratings and the WJ-R springscores. It is possible that teachers were influenced by factors other than theinformation normally considered when completing a summary report. For
Figure 1. Receiver-operating-characteristic (ROC) curves for languageand literacy and math.
Trusting Teachers’ Judgments
89

example, spring achievement score on the Illinois Test of Basic Skills, re-tention histories, or age-for-grade status may have strongly influenced teach-ers’ judgments about the performance of third-graders at the end of the year.Analysis of mean WSS scores in third grade indicates that teachers overes-timated student ability on the summary report compared with the WJ-R.Some teachers may have been trying, intentionally or not, to avoid retainingchildren—a high-stakes decision that was to be made by the district based onthird-grade performance. The WSS is not intended to be used for high-stakespurposes and may lose its effectiveness when so applied. Nevertheless, despitethe decrease in correlations at the end of third grade, the absolute correlationsin third grade are robust, especially between the checklist and the WJ-R.
Aspects of the validity of the WSS were also investigated through four-step hierarchical regressions. Results of these analyses were supportive ofthe WSS. WSS ratings were more significant predictors of students’ springWJ-R standard scores than any of the demographic variables. Further, forkindergarten through second grade, WSS literacy ratings continued to showstatistical significance in the regression models after controlling for the ef-fects of students’ initial performance level (fall standard scores). It is impor-tant to recognize that the increasing stability over time in students’ WJ-Rstandard scores proved to be a significant factor in our design for examiningthe validity of the WSS beyond second grade. Children’s standard scoresstabilize as they spend more time in school. By third grade, the majority ofthe variance in children’s spring standard scores was explained by theirinitial performance level. The fact that WSS ratings no longer emerged assignificant predictors for third-graders’ spring standard scores was not nec-essarily a statement about the validity of the WSS, but instead, reflected theincreasing stability of standardized assessments with students in Grade 3 andhigher. Overall, the regression results provide evidence that WSS ratingsdemonstrate strong evidence for concurrent aspects of validity, especiallyregarding students’ literacy achievement.
The information provided by the ROC curve enables us to go beyondcorrelations to investigate if students who score low or high on the WJ-R arealso rated low or high on the WSS. Correlations cannot fit individuals into abinary classification, that is, positive or negative, disabled or nondisabled, atrisk or not at risk. ROC analysis focuses on the probability of correctlyclassifying individuals, thereby providing information about the utility of thepredictions made from WSS to WJ-R scores.
The ROC curve has been utilized in epidemiological and clinical studies.The area under the ROC curve represents the probability that a random pairof normal and abnormal classifications will be ranked correctly (Hanley &McNeil, 1982). In this study, we used the ROC curve to identify students whowere above and below a standard score of 85 on the WJ-R for broad readingand math. Students in need of educational intervention (i.e., those in aca-demic difficulty) scored �1 SD below the mean on the WJ-R. Students withstandard scores >85 on the WJ-R were developing normally compared witha nationally representative sample.
Meisels et al.
90
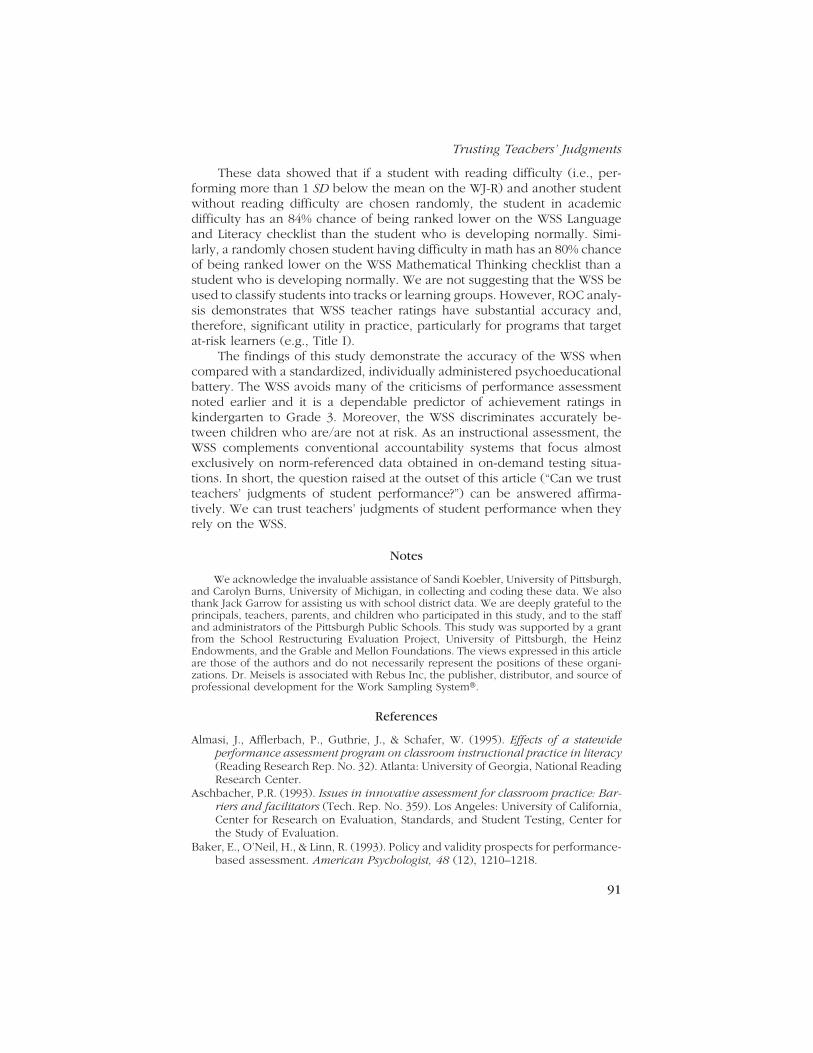
These data showed that if a student with reading difficulty (i.e., per-forming more than 1 SD below the mean on the WJ-R) and another studentwithout reading difficulty are chosen randomly, the student in academicdifficulty has an 84% chance of being ranked lower on the WSS Languageand Literacy checklist than the student who is developing normally. Simi-larly, a randomly chosen student having difficulty in math has an 80% chanceof being ranked lower on the WSS Mathematical Thinking checklist than astudent who is developing normally. We are not suggesting that the WSS beused to classify students into tracks or learning groups. However, ROC analy-sis demonstrates that WSS teacher ratings have substantial accuracy and,therefore, significant utility in practice, particularly for programs that targetat-risk learners (e.g., Title I).
The findings of this study demonstrate the accuracy of the WSS whencompared with a standardized, individually administered psychoeducationalbattery. The WSS avoids many of the criticisms of performance assessmentnoted earlier and it is a dependable predictor of achievement ratings inkindergarten to Grade 3. Moreover, the WSS discriminates accurately be-tween children who are/are not at risk. As an instructional assessment, theWSS complements conventional accountability systems that focus almostexclusively on norm-referenced data obtained in on-demand testing situa-tions. In short, the question raised at the outset of this article (“Can we trustteachers’ judgments of student performance?”) can be answered affirma-tively. We can trust teachers’ judgments of student performance when theyrely on the WSS.
Notes
We acknowledge the invaluable assistance of Sandi Koebler, University of Pittsburgh,and Carolyn Burns, University of Michigan, in collecting and coding these data. We alsothank Jack Garrow for assisting us with school district data. We are deeply grateful to theprincipals, teachers, parents, and children who participated in this study, and to the staffand administrators of the Pittsburgh Public Schools. This study was supported by a grantfrom the School Restructuring Evaluation Project, University of Pittsburgh, the HeinzEndowments, and the Grable and Mellon Foundations. The views expressed in this articleare those of the authors and do not necessarily represent the positions of these organi-zations. Dr. Meisels is associated with Rebus Inc, the publisher, distributor, and source ofprofessional development for the Work Sampling System�.
References
Almasi, J., Afflerbach, P., Guthrie, J., & Schafer, W. (1995). Effects of a statewideperformance assessment program on classroom instructional practice in literacy(Reading Research Rep. No. 32). Atlanta: University of Georgia, National ReadingResearch Center.
Aschbacher, P.R. (1993). Issues in innovative assessment for classroom practice: Bar-riers and facilitators (Tech. Rep. No. 359). Los Angeles: University of California,Center for Research on Evaluation, Standards, and Student Testing, Center forthe Study of Evaluation.
Baker, E., O’Neil, H., & Linn, R. (1993). Policy and validity prospects for performance-based assessment. American Psychologist, 48 (12), 1210–1218.
Trusting Teachers’ Judgments
91

Baron, J. B., & Wolf, D. P. (Eds.). (1996). Performance-based student assessment:Challenges and possibilities. Ninety-fifth yearbook of the National Society for theStudy of Education, Part I. Chicago: University of Chicago Press.
Borko, H., Flory, M., & Cumbo, K. (1993, October). Teachers’ ideas and practicesabout assessment and instruction. A case study of the effects of alternativeassessment in instruction, student learning, and accountability practice (CSETech. Rep. No. 366). Los Angeles: CRESST.
Calfee, R., & Hiebert, E. (1991). Teacher assessment of achievement. Advances inprogram evaluation (Vol. 1, pp. 103–131). Greenwich, CT: JAI Press.
Cizek, G. (1991). Innovation or enervation? Performance assessment in perspective.Phi Delta Kappan, 72 (9), 695–699.
Corbett, H. D., & Wilson, B. L. (1991). Testing, reform, and rebellion. Norwood, NJ:Ablex.
Darling-Hammond, L. (1994). Performance-based assessment and educational equity.Harvard Educational Review, 64 (1), 5–30.
Darling-Hammond, L., & Ancess, J. (1996). Authentic assessment and school devel-opment. In J. B. Baron & D. P. Wolf (Eds.), Performance-based student assess-ment: Challenges and possibilities. Ninety-fifth yearbook of the National Societyfor the Study of Education (Part 1, pp. 52–83). Chicago: University of ChicagoPress.
Dichtelmiller, M. L., Jablon, J. R., Dorfman, A. B., Marsden, D. B., & Meisels, S. J.(1997). Work Sampling in the classroom: A teacher’s manual. Ann Arbor, MI:Rebus.
Falk, B., & Darling-Hammond, L. (1993). The primary language record at P.S. 261:How assessment transforms teaching and learning. New York: National Centerfor Restructuring Education, Schools, and Teaching.
Frederiksen, J., & Collins, A. (1989). A systems approach to educational testing.Educational Researcher, 18 (9), 27–32.
Gardner, H. (1993). Assessment in context: The alternative to standardized testing. InH. Gardner (Ed.), Multiple intelligences: The theory in practice (pp. 161–183).New York: Basic Books.
Gearhart, M., Herman, J., Baker, E., & Whittaker, A. (1993). Whose work is it? Aquestion for the validity of large-scale portfolio assessment (CSE Tech. Rep. No.363). Los Angeles: CRESST.
Green, D. R. (1998). Consequential aspects of the validity of achievement tests: Apublisher’s point of view. Educational Measurement: Issues and Practice, 17(2), 16–34.
Hanley, J. A., & McNeil, B. J. (1982). The meaning and use of the area under a receiveroperating characteristic (ROC) curve. Diagnostic Radiology, 143 (1), 29–36.
Hasselblad, V., & Hedges, L. V. (1995). Meta-analysis of screening and diagnostictests. Psychological Bulletin, 117, 167–178.
Herman, J. L., Aschbacher, P. R., & Winters, L. (1992). A practical guide to alternativeassessment. Alexandria, VA: Association for Supervision and Curriculum Devel-opment.
Hoge, R. D. (1983). Psychometric properties of teacher-judgment measures of pupilaptitudes, classroom behaviors, and achievement levels. Journal of Special Edu-cation, 17, 401–429.
Hoge, R. D. (1984). The definition and measurement of teacher expectations: Prob-lems and prospects. Canadian Journal of Education, 9, 213–228.
Hoge, R. D., & Butcher, R. (1984). Analysis of teacher judgments of pupil achieve-ment levels. Journal of Educational Psychology, 76, 777–781.
Meisels et al.
92

Hoge, R. D., & Coladarci, T. (1989). Teacher-based judgments of academic achieve-ment: A review of the literature. Review of Educational Research, 59, 297–313.
Hopkins, K. D., George, C. A., & Williams, D. D. (1985). The concurrent validity ofstandardized achievement tests by content area using teachers’ ratings as criteria.Journal of Educational Measurement, 22, 177–182.
Kenny, D. T., & Chekaluk, E. (1993). Early reading performance: A comparison ofteacher-based and test-based assessments. Journal of Learning Disabilities, 26,227–236.
Kentucky Institute for Education Research. (1995). An independent evaluation of theKentucky Instructional Results Information System (KIRIS). Executive Summary.Frankfort, KY: Author.
Khattri, N., Kane, M., & Reeve, A. (1995). How performance assessments affectteaching and learning. Educational Leadership, 53 (3), 80–83.
Koretz, D., Mitchell, K., Barron, S., & Keith, S. (1996). Final report: Perceived effectsof the Maryland School Performance Assessment Program (Tech. Rep. No 409).Los Angeles: CRESST.
Koretz, D., Stecher, B., Klein, S., & McCaffrey, D. (1994). The evolution of a portfolioprogram: The impact and quality of the Vermont program in its second year(1992-1993) (CSE Tech. Rep. No. 385). Los Angeles: CRESST.
Linn, R. (1993). Educational assessment: Expanded expectations and challenges.Educational Evaluation and Policy Analysis, 15 (1), 1–16.
Linn, R. (1994). Performance assessment: Policy promises and technical measurementstandards. Educational Researcher, 23 (9), 4–14.
Linn, R. (2000). Assessments and accountability. Educational Researcher, 29 (2),4–15.
Linn, R., Baker, E., & Dunbar, S. (1991). Complex, performance-based assessment:Expectations and validation criteria. Educational Researcher, 20 (8), 15–21.
McTighe, J., & Ferrara, S. (1998). Assessing learning in the classroom. Washington,DC: National Education Association.
Mehrens, W. (1998). Consequences of assessment: What is the evidence? EducationalPolicy Analysis Archives, 6 (13) [On-line]. Available: http://olam.ed.asu.edu./epaa/v6n13.html
Meisels, S., Dorfman, A., & Steele, D. (1995). Equity and excellence in group-administered and performance-based assessments. In M. Nettles & A. Nettles(Eds.), Equity in educational assessment and testing (pp. 195–211). Boston:Kluwer.
Meisels, S. J. (1996). Performance in context: Assessing children’s achievement at theoutset of school. In A. J. Sameroff & M. M. Haith (Eds.), The five to seven yearshift: The age of reason and responsibility (pp. 407–431). Chicago: The Univer-sity of Chicago Press.
Meisels, S. J. (1997). Using Work Sampling in authentic assessments. EducationalLeadership, 54 (4), 60–65.
Meisels, S. J., Bickel, D. D., Nicholson, J., Xue, Y., & Atkins-Burnett, S. (1998).Pittsburgh Work Sampling achievement validation study. Ann Arbor: Universityof Michigan, School of Education.
Meisels, S. J., Henderson, L. W., Liaw, F., Browning, K., & Ten Have, T. (1993). Newevidence for the effectiveness of the Early Screening Inventory. Early ChildhoodResearch Quarterly, 8, 327–346.
Meisels, S. J. , Jablon, J., Marsden, D. B., Dichtelmiller, M. L., & Dorfman, A. (1994).The Work Sampling System. Ann Arbor, MI: Rebus.
Meisels, S. J., Liaw, F.-R., Dorfman, A., & Nelson, R. (1995). The Work Sampling
Trusting Teachers’ Judgments
93

System: Reliability and validity of a performance assessment for young children.Early Childhood Research Quarterly, 10 (3), 277–296.
Meisels, S. J., Xue, Y., Bickel, D. P., Nicholson, J., & Atkins-Burnett, S. (in press).Parental reactions to authentic performance assessment. Educational Assess-ment.
Mills, R. P. (1996). Statewide portfolio assessment: The Vermont experience. In J. B.Baron & D. P. Wolf (Eds.), Performance-based student assessment: Challengesand possibilities (Ninety-fifth yearbook of the National Society for the Study ofEducation, Part I, pp. 192–214). Chicago: University of Chicago Press.
Moss, P. (1992). Shifting conceptions of validity in educational measurement: Impli-cations for performance assessment. Review of Educational Research, 62 (3),229–258.
Moss, P. (1994). Can there be validity without reliability? Educational Researcher, 23(2), 5–12.
Moss, P. (1996). Enlarging the dialogue in educational measurement: Voices frominterpretive research traditions. Educational Researcher, 25 (1), 20–43.
Murphy, S., Bergamini, J., & Rooney, P. (1997). The impact of large-scale portfolioassessment programs on classroom practice: Case studies of the New StandardsField-Trial Portfolio. Educational Assessment, 4 (4), 297–333.
Perry, N. E., & Meisels, S. J. (1996). Teachers’ judgments of students’ academicperformance (Working Paper No. 96-08, National Center for Education Statis-tics). Washington, DC: U.S. Department of Education, OERI.
Popham, W. J. (1996). Classroom assessment: What teachers need to know. Needham,MA: Allyn & Bacon.
Resnick, L. B., & Resnick, D. P. (1992). Assessing the thinking curriculum: New toolsfor educational reform. In B. Gifford & M. C. O’Connor (Eds.), Cognitive ap-proaches to assessment (pp. 37–75). Boston: Kluwer-Nijhoff.
Salvesen, K. A., & Undheim, J. O. (1994). Screening for learning disabilities. Journalof Learning Disabilities, 27, 60–66.
Sackett, D. L., Haynes, R. B., & Tugwell, P. (1985). Clinical epidemiology: A basicscience for clinical medicine. Boston: Little, Brown.
Sharpley, C. F., & Edgar, E. (1986). Teachers’ ratings vs. standardized tests: An em-pirical investigation of agreement between two indices of achievement. Psychol-ogy in the Schools, 23, 106–111.
Shavelson, R. J., Baxter, G. P., & Pine, J. (1992). Performance assessments: Politicalrhetoric and measurement reality. Educational Researcher, 21, 22–27.
Shepard, L. A. (1991). Interview on assessment issues. Educational Researcher, 20,21–23; 27.
Silverstein, A. B., Brownlee, L., Legutki, G., & MacMillan, D. L. (1983). Convergentand discriminant validation of two methods of assessing three academic traits.Journal of Special Education, 17, 63–68.
Smith, M., Noble, A., Cabay, M., Heinecke, W., Junker, M., & Saffron, Y. (1994). Whathappens when the test mandate changes? Results of a multiple case study (CSETech. Rep. No. 380). Los Angeles: CRESST.
Stecher, B. M., & Mitchell, K. J. (1996). Portfolio-driven reform: Vermont teachers’understanding of mathematical problem solving and related changes in class-room practice (CSE Tech. Rep. No. 400). Los Angeles: CRESST.
Sternberg, R. J. (1996). Successful intelligence: How practical and creative intelli-gence determine success in life. New York: Simon & Schuster.
Stiggins, R. J. (1997). Student-centered classroom assessment (2nd ed.). Columbus,OH: Merrill.
Meisels et al.
94

Stiggins, R. J. (1998). Classroom assessment for student success. Washington, DC:National Education Association.
Sykes, G., & Elmore, R. (1989). Making schools manageable. In J. Hannaway & R.Crowson (Eds.), The politics of reforming school administration. Philadelphia:Falmer.
Taylor, C. (1994). Assessment for measurement or standards: The peril and promiseof large-scale assessment reform. American Educational Research Journal, 31(2), 231–262.
Toteson, A. N. A., & Begg, C. B. (1988). A general regression methodology for ROCcurve estimation. Medical Decision Making, 8, 204–215.
United States General Accounting Office. (1993). Student testing: Current extent andexpenditures, with cost estimates for a national examination (GAO/PEMD Pub-lication No. 93-8). Washington, DC: Author.
Wiggins, G. (1989). A true test: Toward more authentic and equitable assessment. PhiDelta Kappan, 70 (9), 703–713.
Wiggins, G. (1993). Assessing student performance: Exploring the purpose and limitsof testing. San Francisco: Jossey-Bass.
Wolf, D., Bixby, J., Glenn III, J., & Gardner, H. (1991). To use their minds well:Investigating new forms of student assessment. Review of Research in Educa-tion, 17, 31–74.
Woodcock, R. W., & Johnson, M. B. (1989). Woodcock-Johnson PsychoeducationalBattery-Revised. Allen, TX: DLM Teaching Resources.
Manuscript received December 14, 1999Revision received May 24, 2000
Accepted September 6, 2000
Trusting Teachers’ Judgments
95