trust performance report - sath
TRANSCRIPT
1
Trust Performance Report
Trust Board 27th July 2017

2
Mortality
Mortality
3
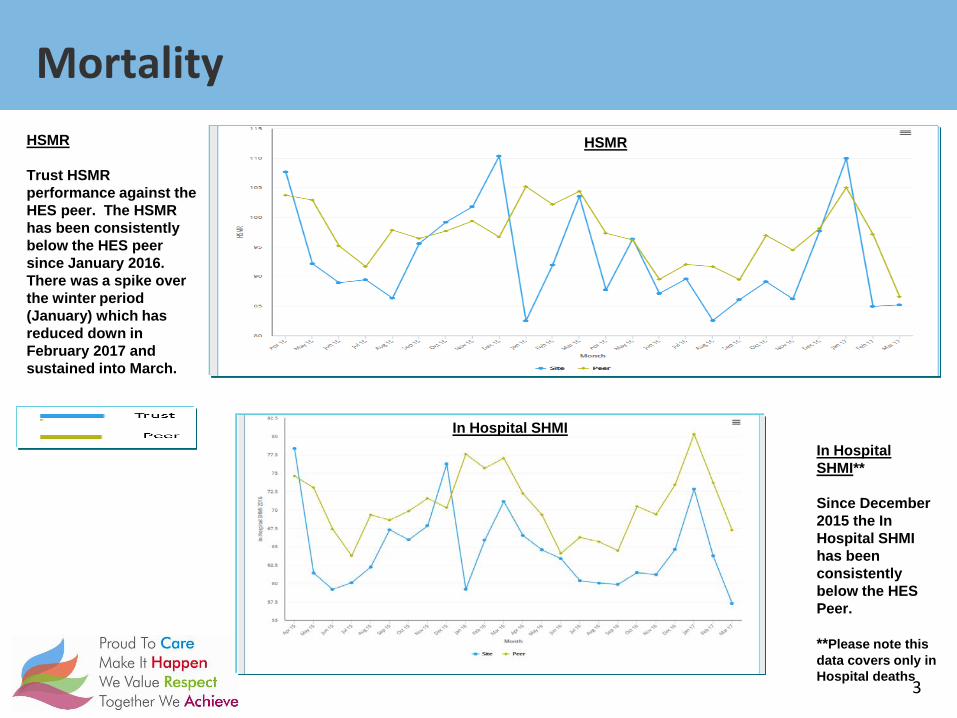
HSMR HSMR Trust HSMR performance against the HES peer. The HSMR has been consistently below the HES peer since January 2016. There was a spike over the winter period (January) which has reduced down in February 2017 and sustained into March.
In Hospital SHMI** Since December 2015 the In Hospital SHMI has been consistently below the HES Peer. **Please note this data covers only in Hospital deaths
HSMR
In Hospital SHMI

4
RTT
RTT 2017/2018 Trajectory
5
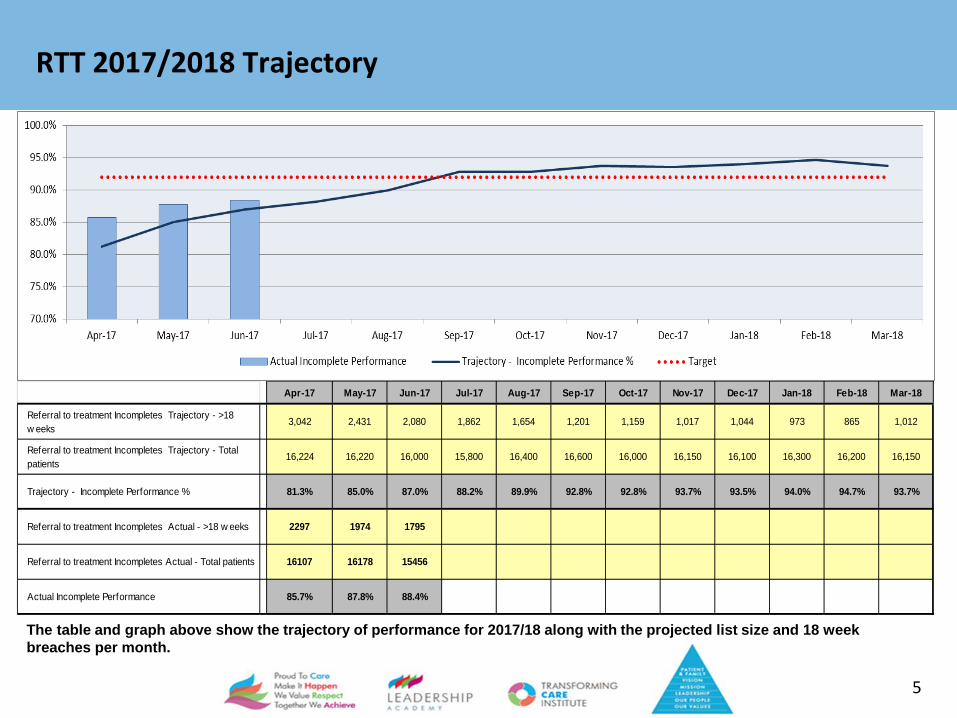
The table and graph above show the trajectory of performance for 2017/18 along with the projected list size and 18 week breaches per month.
Apr-17 May-17 Jun-17 Jul-17 Aug-17 Sep-17 Oct-17 Nov-17 Dec-17 Jan-18 Feb-18 Mar-18
Referral to treatment Incompletes Trajectory - >18 w eeks
3,042 2,431 2,080 1,862 1,654 1,201 1,159 1,017 1,044 973 865 1,012
Referral to treatment Incompletes Trajectory - Total patients
16,224 16,220 16,000 15,800 16,400 16,600 16,000 16,150 16,100 16,300 16,200 16,150
Trajectory - Incomplete Performance % 81.3% 85.0% 87.0% 88.2% 89.9% 92.8% 92.8% 93.7% 93.5% 94.0% 94.7% 93.7%
Referral to treatment Incompletes Actual - >18 w eeks 2297 1974 1795
Referral to treatment Incompletes Actual - Total patients 16107 16178 15456
Actual Incomplete Performance 85.7% 87.8% 88.4%
Speciality Performance Against Trajectory Combined
6
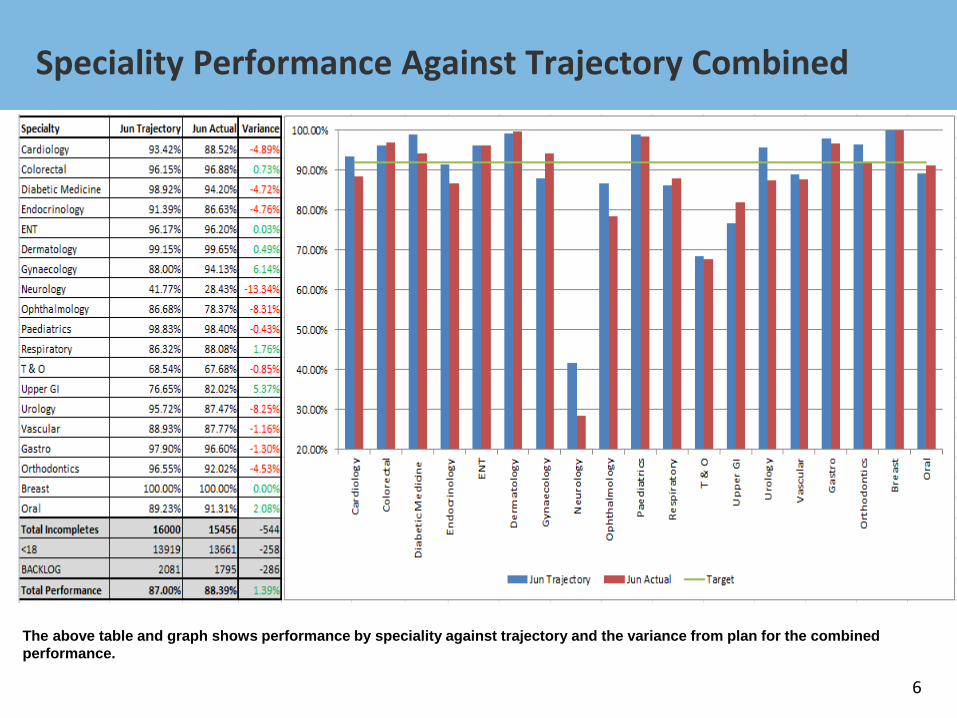
The above table and graph shows performance by speciality against trajectory and the variance from plan for the combined performance.
RTT - Ophthalmology
7
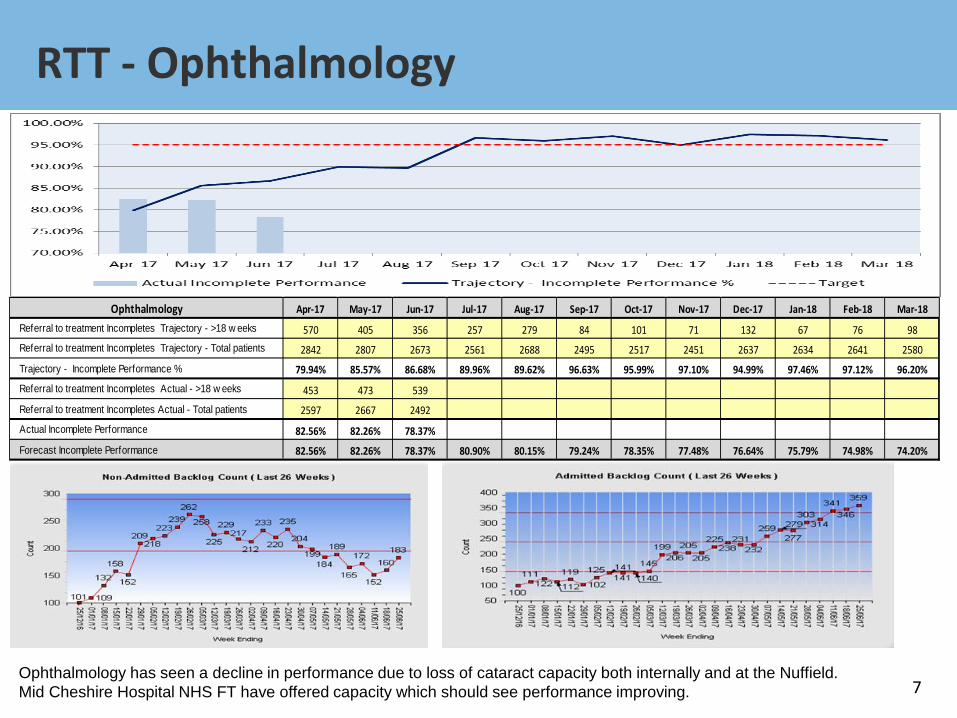
Ophthalmology Apr-17 May-17 Jun-17 Jul-17 Aug-17 Sep-17 Oct-17 Nov-17 Dec-17 Jan-18 Feb-18 Mar-18
Referral to treatment Incompletes Trajectory - >18 w eeks 570 405 356 257 279 84 101 71 132 67 76 98Referral to treatment Incompletes Trajectory - Total patients 2842 2807 2673 2561 2688 2495 2517 2451 2637 2634 2641 2580
Trajectory - Incomplete Performance % 79.94% 85.57% 86.68% 89.96% 89.62% 96.63% 95.99% 97.10% 94.99% 97.46% 97.12% 96.20%
Referral to treatment Incompletes Actual - >18 w eeks 453 473 539
Referral to treatment Incompletes Actual - Total patients 2597 2667 2492
Actual Incomplete Performance 82.56% 82.26% 78.37%
Forecast Incomplete Performance 82.56% 82.26% 78.37% 80.90% 80.15% 79.24% 78.35% 77.48% 76.64% 75.79% 74.98% 74.20%
Ophthalmology has seen a decline in performance due to loss of cataract capacity both internally and at the Nuffield. Mid Cheshire Hospital NHS FT have offered capacity which should see performance improving.
RTT – Trauma & Orthopaedic
8
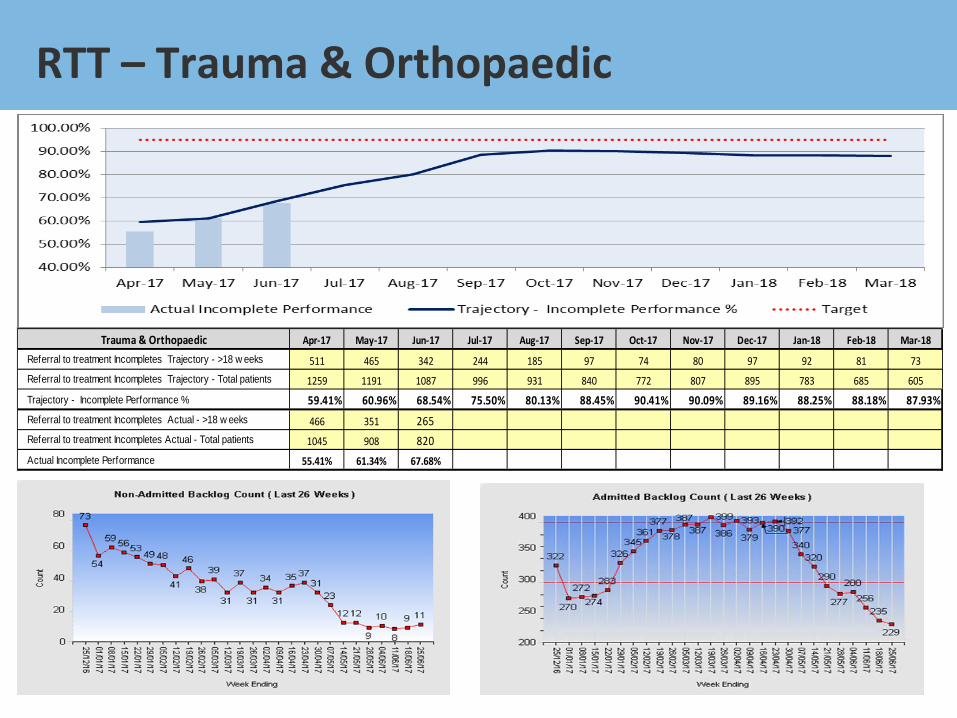
Trauma & Orthopaedic Apr-17 May-17 Jun-17 Jul-17 Aug-17 Sep-17 Oct-17 Nov-17 Dec-17 Jan-18 Feb-18 Mar-18
Referral to treatment Incompletes Trajectory - >18 w eeks 511 465 342 244 185 97 74 80 97 92 81 73Referral to treatment Incompletes Trajectory - Total patients 1259 1191 1087 996 931 840 772 807 895 783 685 605
Trajectory - Incomplete Performance % 59.41% 60.96% 68.54% 75.50% 80.13% 88.45% 90.41% 90.09% 89.16% 88.25% 88.18% 87.93%Referral to treatment Incompletes Actual - >18 w eeks 466 351 265Referral to treatment Incompletes Actual - Total patients 1045 908 820Actual Incomplete Performance 55.41% 61.34% 67.68%
July Projected RTT Performance
9
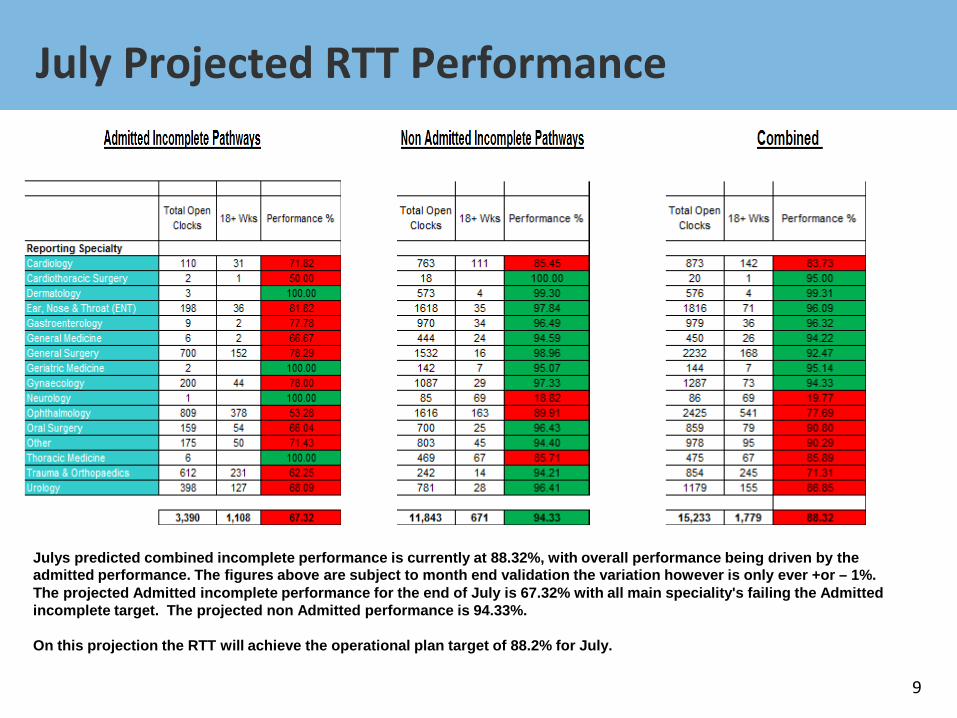
Julys predicted combined incomplete performance is currently at 88.32%, with overall performance being driven by the admitted performance. The figures above are subject to month end validation the variation however is only ever +or – 1%. The projected Admitted incomplete performance for the end of July is 67.32% with all main speciality's failing the Admitted incomplete target. The projected non Admitted performance is 94.33%. On this projection the RTT will achieve the operational plan target of 88.2% for July.

Urgent Care Update
10
A&E 2017-2018 Trust Trajectory
11
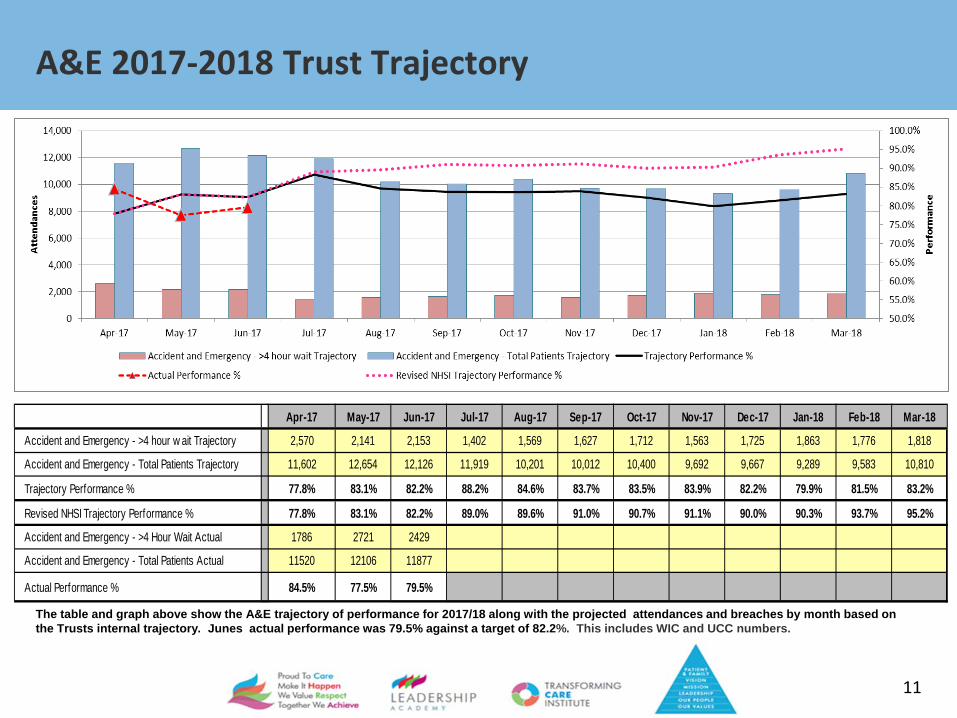
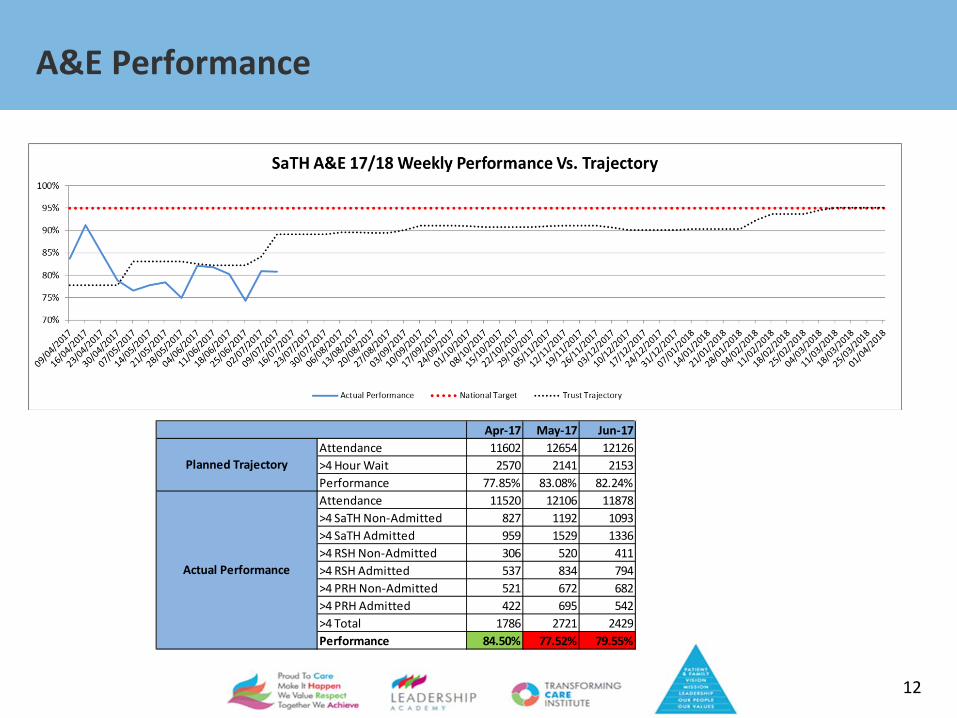
The table and graph above show the A&E trajectory of performance for 2017/18 along with the projected attendances and breaches by month based on the Trusts internal trajectory. Junes actual performance was 79.5% against a target of 82.2%. This includes WIC and UCC numbers.
Apr-17 May-17 Jun-17 Jul-17 Aug-17 Sep-17 Oct-17 Nov-17 Dec-17 Jan-18 Feb-18 Mar-18
Accident and Emergency - >4 hour w ait Trajectory 2,570 2,141 2,153 1,402 1,569 1,627 1,712 1,563 1,725 1,863 1,776 1,818
Accident and Emergency - Total Patients Trajectory 11,602 12,654 12,126 11,919 10,201 10,012 10,400 9,692 9,667 9,289 9,583 10,810
Trajectory Performance % 77.8% 83.1% 82.2% 88.2% 84.6% 83.7% 83.5% 83.9% 82.2% 79.9% 81.5% 83.2%
Revised NHSI Trajectory Performance % 77.8% 83.1% 82.2% 89.0% 89.6% 91.0% 90.7% 91.1% 90.0% 90.3% 93.7% 95.2%
Accident and Emergency - >4 Hour Wait Actual 1786 2721 2429
Accident and Emergency - Total Patients Actual 11520 12106 11877
Actual Performance % 84.5% 77.5% 79.5%
A&E Performance
12
Apr-17 May-17 Jun-17Attendance 11602 12654 12126>4 Hour Wait 2570 2141 2153Performance 77.85% 83.08% 82.24%Attendance 11520 12106 11878>4 SaTH Non-Admitted 827 1192 1093>4 SaTH Admitted 959 1529 1336>4 RSH Non-Admitted 306 520 411>4 RSH Admitted 537 834 794>4 PRH Non-Admitted 521 672 682>4 PRH Admitted 422 695 542>4 Total 1786 2721 2429Performance 84.50% 77.52% 79.55%
Actual Performance
Planned Trajectory
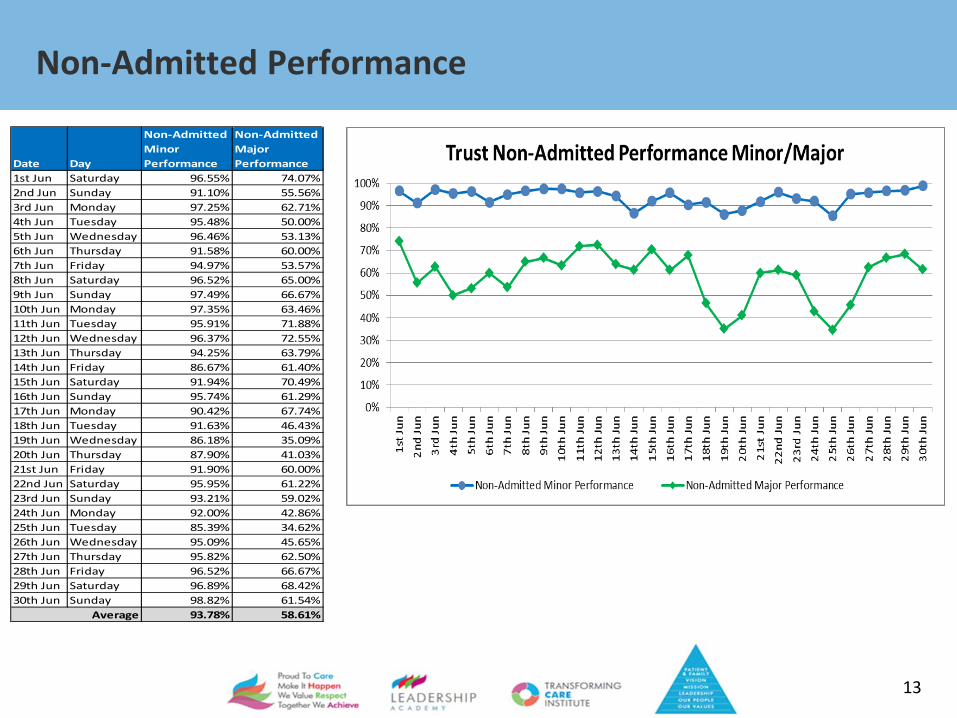
Non-Admitted Performance
13
Date Day
Non-Admitted Minor Performance
Non-Admitted Major Performance
1st Jun Saturday 96.55% 74.07%2nd Jun Sunday 91.10% 55.56%3rd Jun Monday 97.25% 62.71%4th Jun Tuesday 95.48% 50.00%5th Jun Wednesday 96.46% 53.13%6th Jun Thursday 91.58% 60.00%7th Jun Friday 94.97% 53.57%8th Jun Saturday 96.52% 65.00%9th Jun Sunday 97.49% 66.67%10th Jun Monday 97.35% 63.46%11th Jun Tuesday 95.91% 71.88%12th Jun Wednesday 96.37% 72.55%13th Jun Thursday 94.25% 63.79%14th Jun Friday 86.67% 61.40%15th Jun Saturday 91.94% 70.49%16th Jun Sunday 95.74% 61.29%17th Jun Monday 90.42% 67.74%18th Jun Tuesday 91.63% 46.43%19th Jun Wednesday 86.18% 35.09%20th Jun Thursday 87.90% 41.03%21st Jun Friday 91.90% 60.00%22nd Jun Saturday 95.95% 61.22%23rd Jun Sunday 93.21% 59.02%24th Jun Monday 92.00% 42.86%25th Jun Tuesday 85.39% 34.62%26th Jun Wednesday 95.09% 45.65%27th Jun Thursday 95.82% 62.50%28th Jun Friday 96.52% 66.67%29th Jun Saturday 96.89% 68.42%30th Jun Sunday 98.82% 61.54%
93.78% 58.61%Average
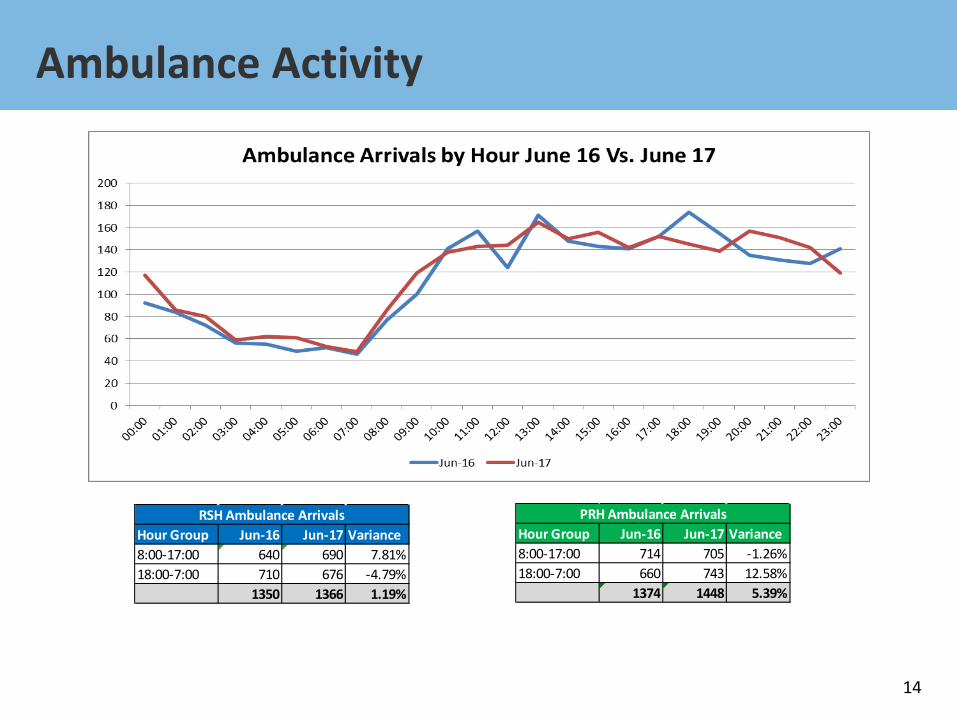
Ambulance Activity
14
Hour Group Jun-16 Jun-17 Variance8:00-17:00 640 690 7.81%18:00-7:00 710 676 -4.79%
1350 1366 1.19%
RSH Ambulance ArrivalsHour Group Jun-16 Jun-17 Variance8:00-17:00 714 705 -1.26%18:00-7:00 660 743 12.58%
1374 1448 5.39%
PRH Ambulance Arrivals

A&E Type 1 Attendance Q1 Comparison
15
April May June Total April May June Total April May June Total16/17 Q1 9737 10642 10197 30576 16/17 Q1 4935 5275 5131 15341 16/17 Q1 4802 5367 5066 1523517/18 Q1 9943 10732 10557 31232 17/18 Q1 4982 5474 5470 15926 17/18 Q1 4961 5258 5087 15306% Variance 2.12% 0.85% 3.53% 2.15% % Variance 0.95% 3.77% 6.61% 3.81% % Variance 3.31% -2.03% 0.41% 0.47%No. Variance 206 90 360 656 No. Variance 47 199 339 585 No. Variance 159 -109 21 71
RSH Type 1 Q1 ComparisonTrust Type 1 Q1 Comparison PRH Type 1 Q1 Comparison
9200
9400
9600
9800
10000
10200
10400
10600
10800
11000
April May June
Trust Type 1 Q1 Comparison
16/17 Q1 17/18 Q1
46004700480049005000510052005300540055005600
April May June
PRH Type 1 Q1 Comparison
16/17 Q1 17/18 Q1
45004600470048004900500051005200530054005500
April May June
RSH Type 1 Q1 Comparison
16/17 Q1 17/18 Q1
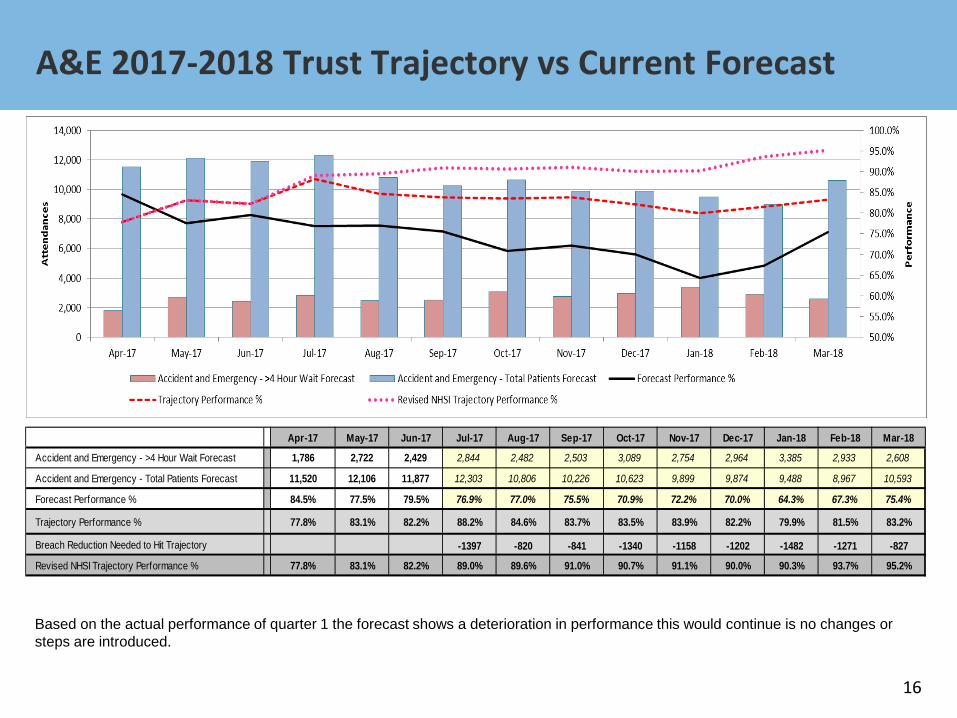
A&E 2017-2018 Trust Trajectory vs Current Forecast
16
Based on the actual performance of quarter 1 the forecast shows a deterioration in performance this would continue is no changes or steps are introduced.
Apr-17 May-17 Jun-17 Jul-17 Aug-17 Sep-17 Oct-17 Nov-17 Dec-17 Jan-18 Feb-18 Mar-18
Accident and Emergency - >4 Hour Wait Forecast 1,786 2,722 2,429 2,844 2,482 2,503 3,089 2,754 2,964 3,385 2,933 2,608
Accident and Emergency - Total Patients Forecast 11,520 12,106 11,877 12,303 10,806 10,226 10,623 9,899 9,874 9,488 8,967 10,593
Forecast Performance % 84.5% 77.5% 79.5% 76.9% 77.0% 75.5% 70.9% 72.2% 70.0% 64.3% 67.3% 75.4%
Trajectory Performance % 77.8% 83.1% 82.2% 88.2% 84.6% 83.7% 83.5% 83.9% 82.2% 79.9% 81.5% 83.2%
Breach Reduction Needed to Hit Trajectory -1397 -820 -841 -1340 -1158 -1202 -1482 -1271 -827
Revised NHSI Trajectory Performance % 77.8% 83.1% 82.2% 89.0% 89.6% 91.0% 90.7% 91.1% 90.0% 90.3% 93.7% 95.2%
Explanation of June’s Performance
17
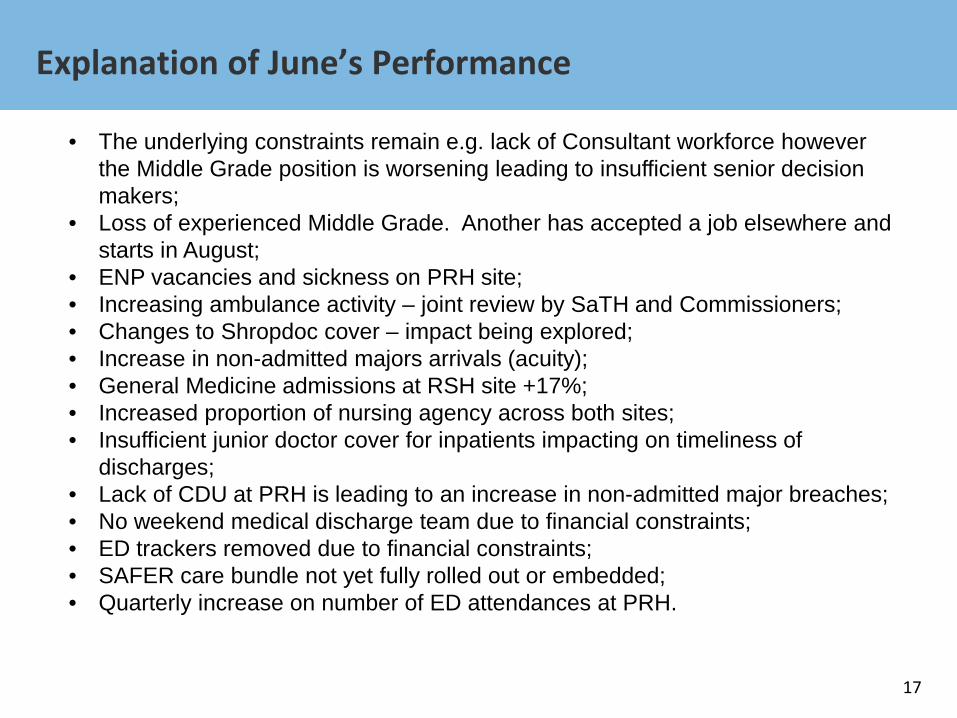
• The underlying constraints remain e.g. lack of Consultant workforce however the Middle Grade position is worsening leading to insufficient senior decision makers;
• Loss of experienced Middle Grade. Another has accepted a job elsewhere and starts in August;
• ENP vacancies and sickness on PRH site; • Increasing ambulance activity – joint review by SaTH and Commissioners; • Changes to Shropdoc cover – impact being explored; • Increase in non-admitted majors arrivals (acuity); • General Medicine admissions at RSH site +17%; • Increased proportion of nursing agency across both sites; • Insufficient junior doctor cover for inpatients impacting on timeliness of
discharges; • Lack of CDU at PRH is leading to an increase in non-admitted major breaches; • No weekend medical discharge team due to financial constraints; • ED trackers removed due to financial constraints; • SAFER care bundle not yet fully rolled out or embedded; • Quarterly increase on number of ED attendances at PRH.
Delivery of Improvement
18
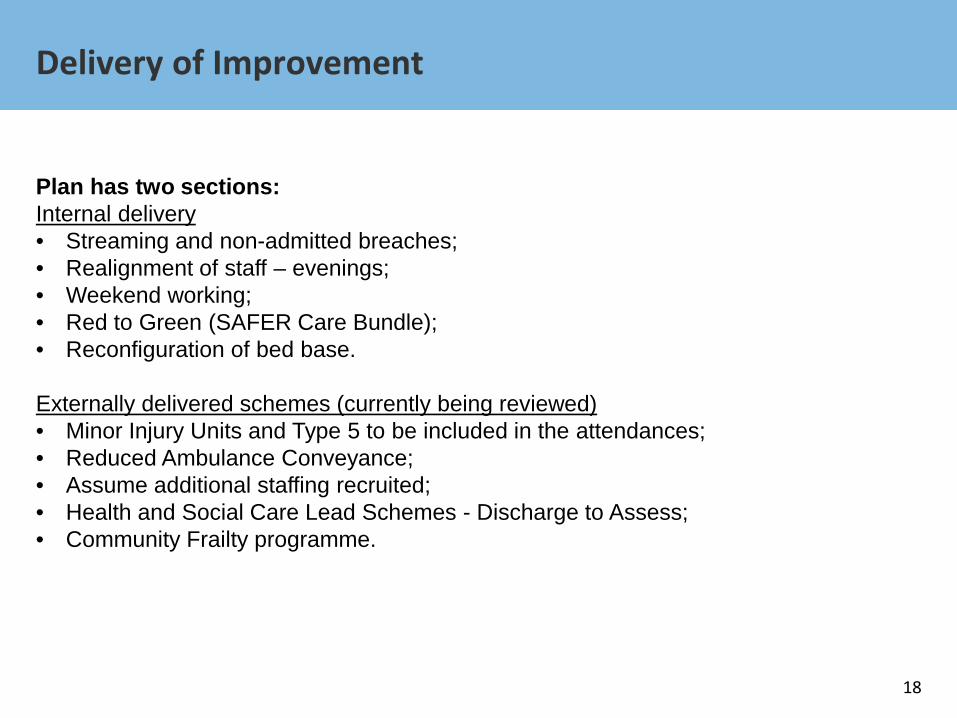
Plan has two sections: Internal delivery • Streaming and non-admitted breaches; • Realignment of staff – evenings; • Weekend working; • Red to Green (SAFER Care Bundle); • Reconfiguration of bed base.
Externally delivered schemes (currently being reviewed) • Minor Injury Units and Type 5 to be included in the attendances; • Reduced Ambulance Conveyance; • Assume additional staffing recruited; • Health and Social Care Lead Schemes - Discharge to Assess; • Community Frailty programme.
Delivery of Improvement
19
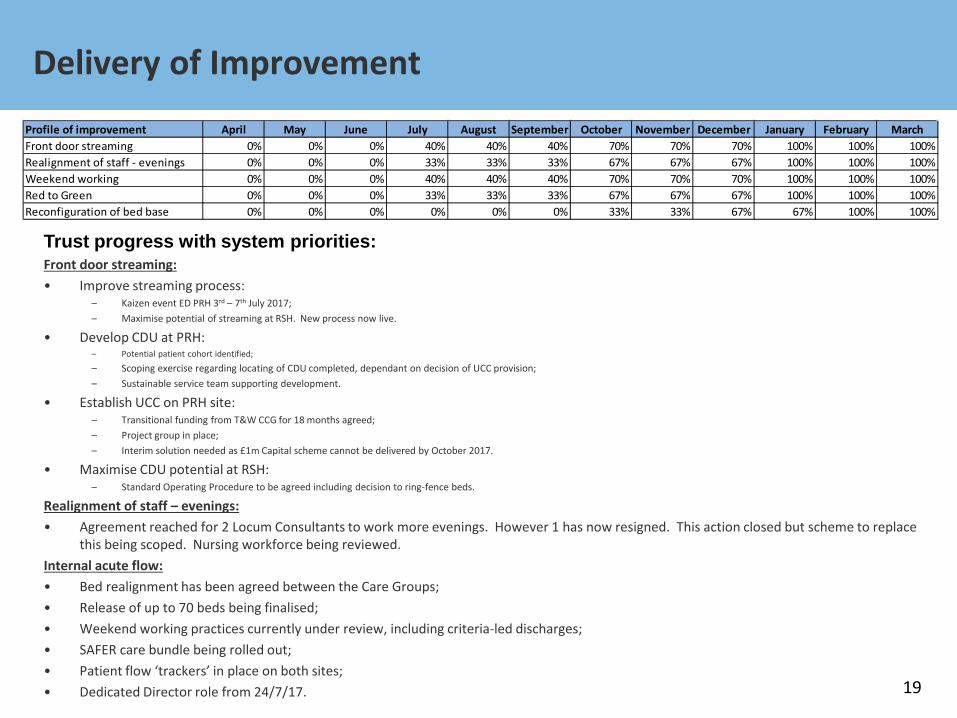
Profile of improvement April May June July August September October November December January February MarchFront door streaming 0% 0% 0% 40% 40% 40% 70% 70% 70% 100% 100% 100%Realignment of staff - evenings 0% 0% 0% 33% 33% 33% 67% 67% 67% 100% 100% 100%Weekend working 0% 0% 0% 40% 40% 40% 70% 70% 70% 100% 100% 100%Red to Green 0% 0% 0% 33% 33% 33% 67% 67% 67% 100% 100% 100%Reconfiguration of bed base 0% 0% 0% 0% 0% 0% 33% 33% 67% 67% 100% 100%
Trust progress with system priorities: Front door streaming: • Improve streaming process:
– Kaizen event ED PRH 3rd – 7th July 2017; – Maximise potential of streaming at RSH. New process now live.
• Develop CDU at PRH: – Potential patient cohort identified;
– Scoping exercise regarding locating of CDU completed, dependant on decision of UCC provision; – Sustainable service team supporting development.
• Establish UCC on PRH site: – Transitional funding from T&W CCG for 18 months agreed; – Project group in place; – Interim solution needed as £1m Capital scheme cannot be delivered by October 2017.
• Maximise CDU potential at RSH: – Standard Operating Procedure to be agreed including decision to ring-fence beds.
Realignment of staff – evenings: • Agreement reached for 2 Locum Consultants to work more evenings. However 1 has now resigned. This action closed but scheme to replace
this being scoped. Nursing workforce being reviewed. Internal acute flow: • Bed realignment has been agreed between the Care Groups; • Release of up to 70 beds being finalised; • Weekend working practices currently under review, including criteria-led discharges; • SAFER care bundle being rolled out; • Patient flow ‘trackers’ in place on both sites; • Dedicated Director role from 24/7/17.
Recurring Impact
20
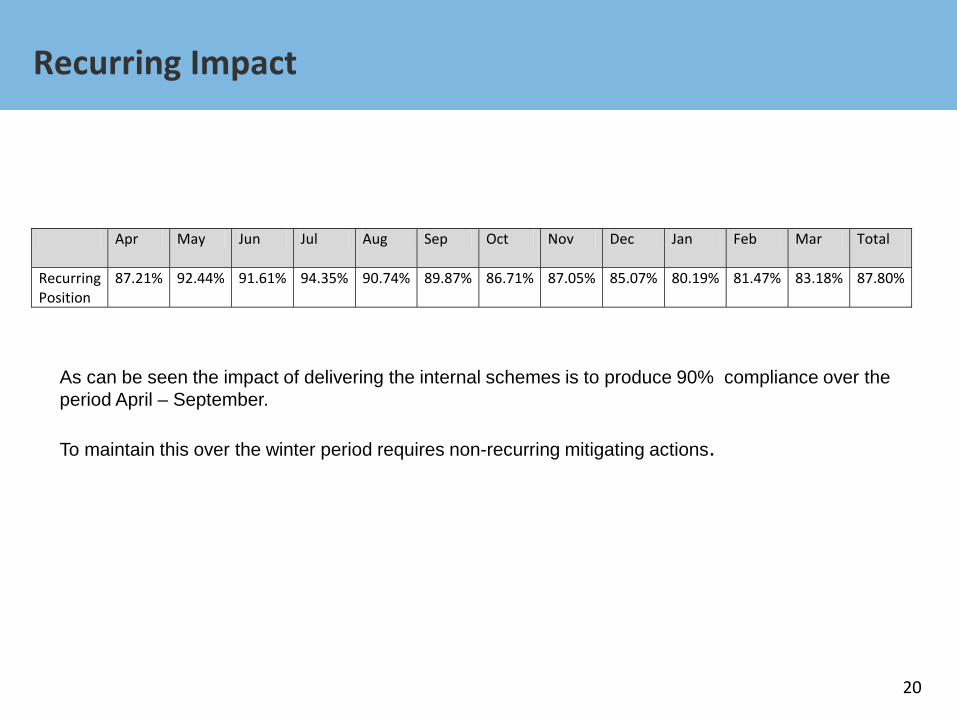
Apr May Jun Jul Aug Sep Oct Nov Dec Jan Feb Mar Total
Recurring Position
87.21% 92.44% 91.61% 94.35% 90.74% 89.87% 86.71% 87.05% 85.07% 80.19% 81.47% 83.18% 87.80%
As can be seen the impact of delivering the internal schemes is to produce 90% compliance over the period April – September. To maintain this over the winter period requires non-recurring mitigating actions.
21
Cancer and Diagnostics
Cancer 2017/2018 Trajectory
22
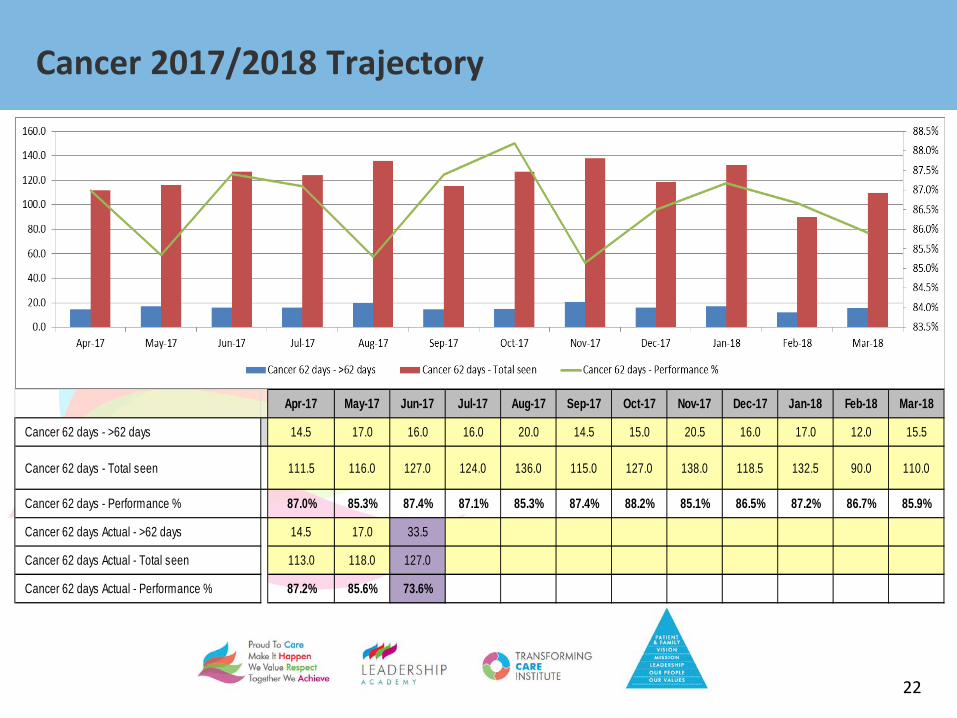
Apr-17 May-17 Jun-17 Jul-17 Aug-17 Sep-17 Oct-17 Nov-17 Dec-17 Jan-18 Feb-18 Mar-18
Cancer 62 days - >62 days 14.5 17.0 16.0 16.0 20.0 14.5 15.0 20.5 16.0 17.0 12.0 15.5
Cancer 62 days - Total seen 111.5 116.0 127.0 124.0 136.0 115.0 127.0 138.0 118.5 132.5 90.0 110.0
Cancer 62 days - Performance % 87.0% 85.3% 87.4% 87.1% 85.3% 87.4% 88.2% 85.1% 86.5% 87.2% 86.7% 85.9%
Cancer 62 days Actual - >62 days 14.5 17.0 33.5
Cancer 62 days Actual - Total seen 113.0 118.0 127.0
Cancer 62 days Actual - Performance % 87.2% 85.6% 73.6%
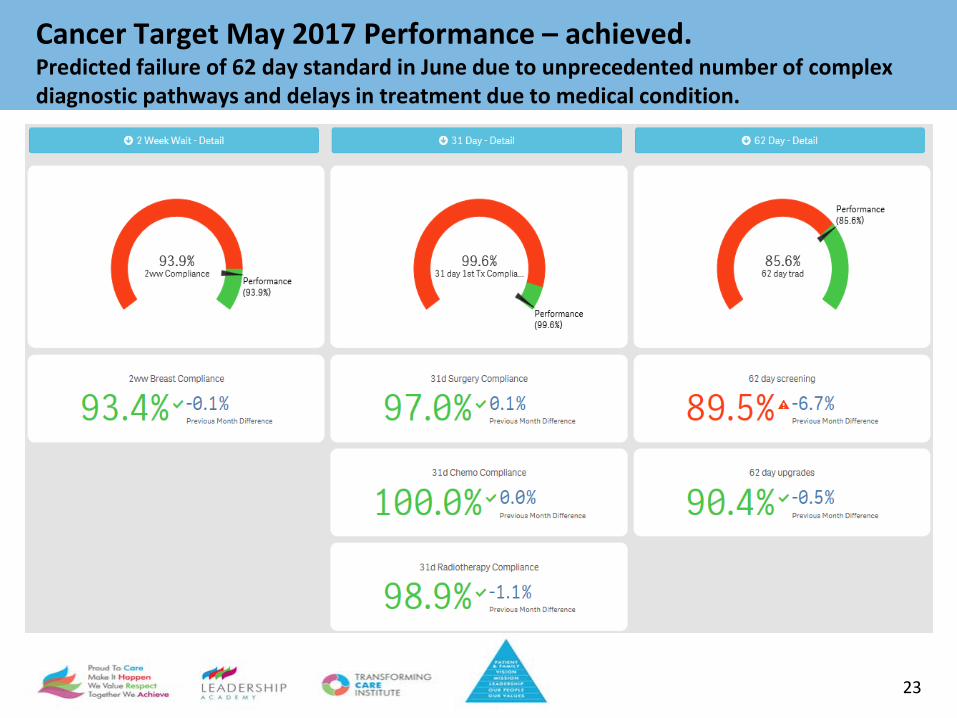
Cancer Target May 2017 Performance – achieved. Predicted failure of 62 day standard in June due to unprecedented number of complex diagnostic pathways and delays in treatment due to medical condition.
23
Diagnostic Waiting Times –June 2017
24
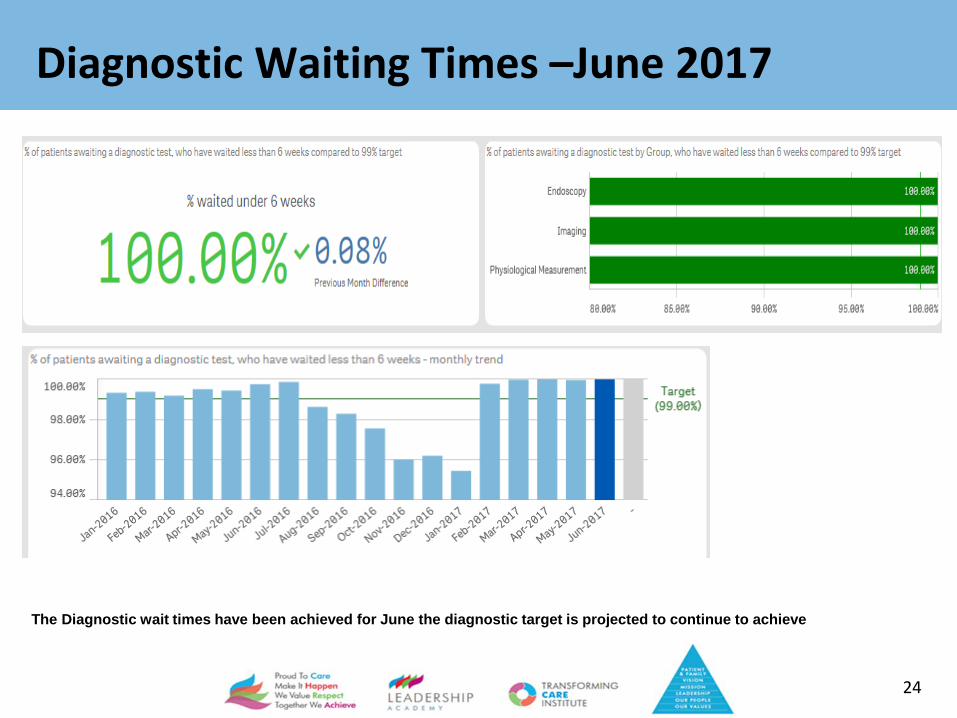
The Diagnostic wait times have been achieved for June the diagnostic target is projected to continue to achieve
25
Workforce
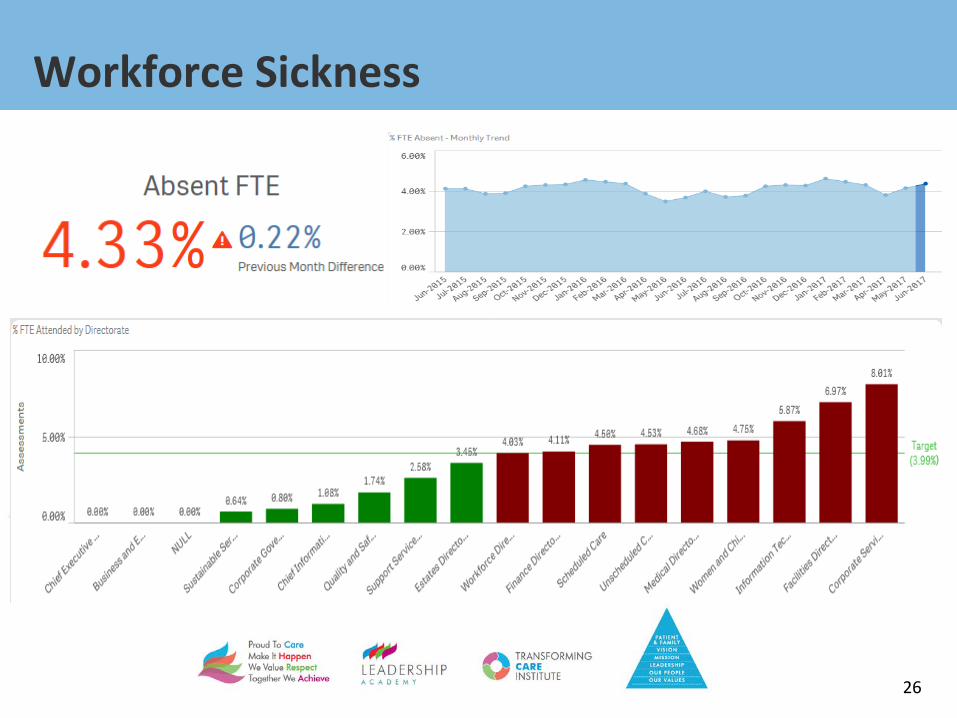
Workforce Sickness
26

Workforce – Training and Appraisals June 2017
27

Appraisal
28

Staff Turn Over May 2017 – exc. Junior Doctors
29
30
Quality
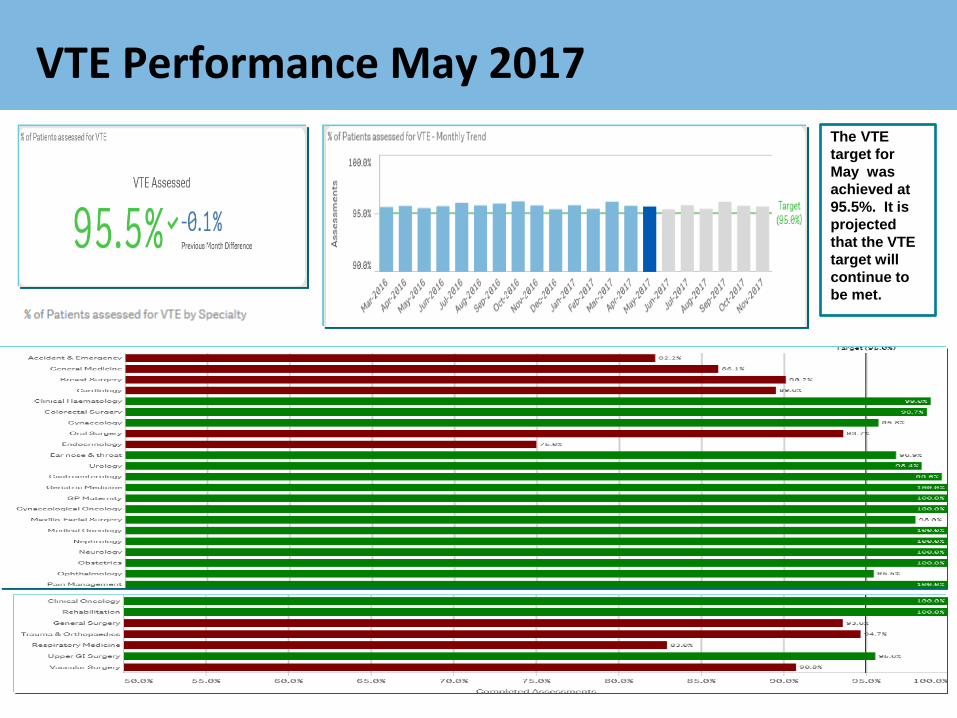
VTE Performance May 2017
31
The VTE target for May was achieved at 95.5%. It is projected that the VTE target will continue to be met.

Quality and Safety
32

Quality and Safety
33
Quality and Safety
34
In Quarter one we have been compliant with most of the quality measures that we measure against. Exceptions are: C Diff: We have seen two more C Diff cases (8) than the maximum for the quarter we set as an internal target (6) although the incidence rate is reducing month by month. We fully investigate every case and the CCGs consider the findings of each as to whether they feel it is attributable to our care. We continue to promote antibiotic guardianship across the Trust. Avoidable pressure ulcers: We have recorded three grade two and one grade three avoidable pressure ulcers in the quarter – all have been investigated and action plans developed and monitored. MSA Breaches: We continue to record patients who are fit to leave our ITU areas but are delayed in doing so due to the unavailability of beds on the general wards. These patients are recorded as mixed sex breaches. We will always try to move patients as soon as possible to ensure that their privacy and dignity is maintained.
Finance Update
35

The position at Month 3
36
Financial Plan YTD Plan YTD Actual Variance£000s £000s £000s £000s
Income 348,380 86,744 86,591 (153)
Pay (241,070) (59,710) (60,706) (996)
Non-Pay and Reserves (108,172) (27,313) (27,142) 171
Total expenditure (349,242) (87,023) (87,848) (825)EBITDA (862) (279) (1,257) (978)Finance Costs (14,516) (3,606) (3,540) 66
Surplus/(deficit) before Phased Spend and STF (15,378) (3,885) (4,797) (912)STF 9,315 1,397 1,188 (209)
Surplus/(deficit) before Phased Spend (6,063) (2,488) (3,609) (1,121)Corrective Actions for STF 0 0 932 932
Phased spend adjustment - (35) (35) 0
Plan as described in NHSI Financial Template (6,063) (2,523) (2,712) (189)
Tier 5 Agency WTE Usage
37
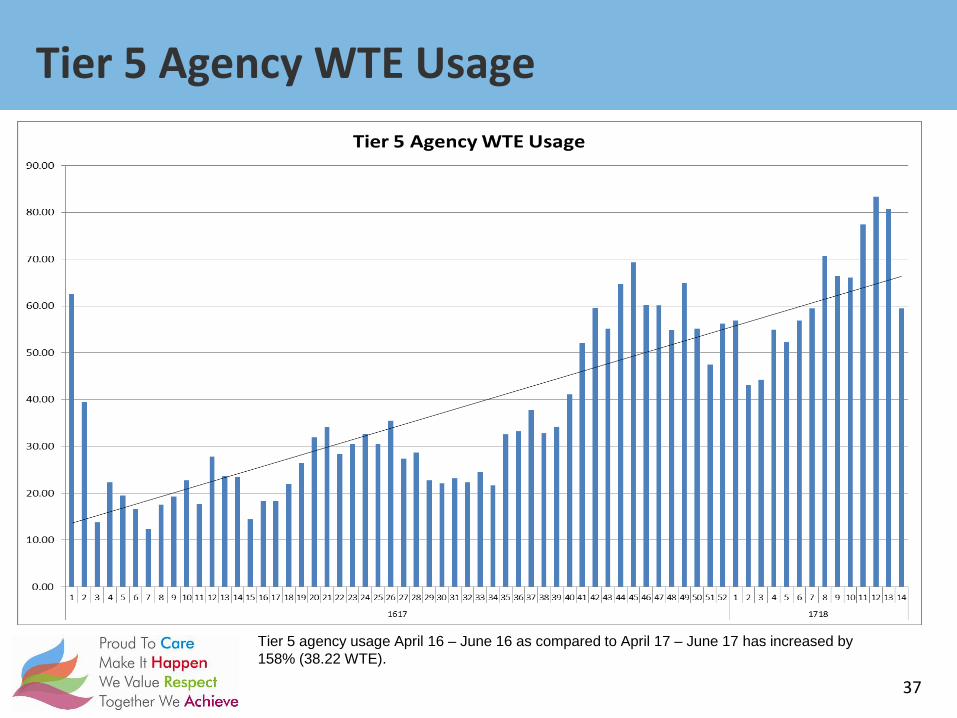
Tier 5 agency usage April 16 – June 16 as compared to April 17 – June 17 has increased by 158% (38.22 WTE).
Delivery of the Agency Ceiling
38
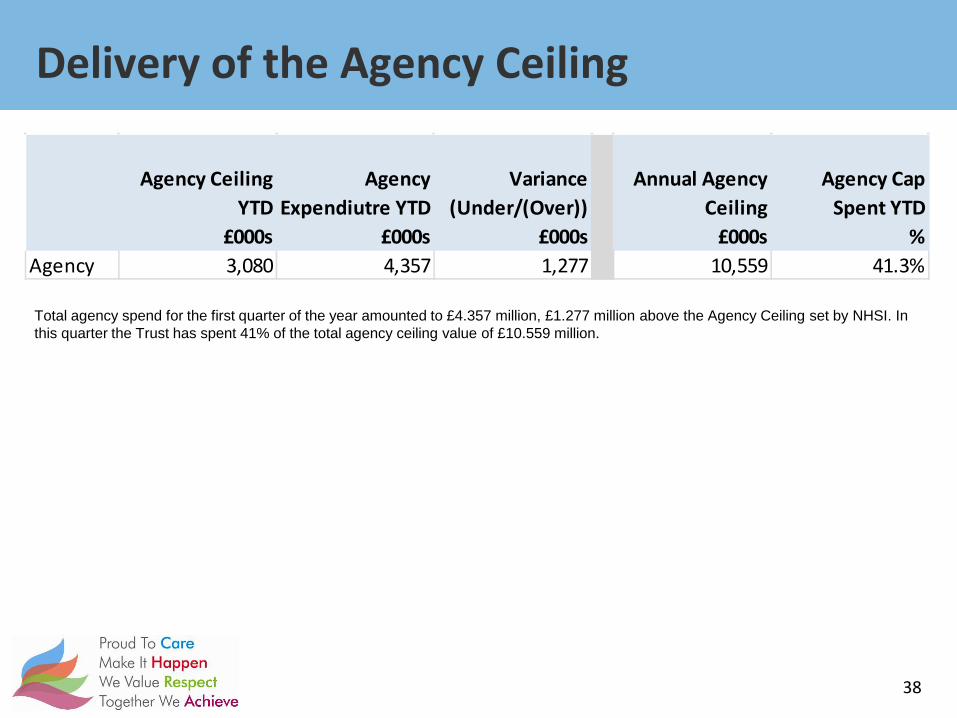
Total agency spend for the first quarter of the year amounted to £4.357 million, £1.277 million above the Agency Ceiling set by NHSI. In this quarter the Trust has spent 41% of the total agency ceiling value of £10.559 million.
Agency Ceiling YTD
Agency Expendiutre YTD
Variance (Under/(Over))
Annual Agency Ceiling
Agency Cap Spent YTD
£000s £000s £000s £000s %Agency 3,080 4,357 1,277 10,559 41.3%

Forecast Outturn
39
Given the overspend that exists to date, the expected position at the end of the 2017/18 financial year is a £13.528 million deficit, assuming the current trends continue and no corrective action is taken. This takes us to £7.465 million above the agreed control total with NHSI.
April May June July August SeptembeOctober Novembe DecemberJanuary February March Total
Income 26727 30218 30834 29626 29555 30127 31161 31343 28773 30988 29440 31316 360108Pay -19810 -20516 -20380 -20303 -20272 -20464 -20396 -20575 -20840 -20944 -20778 -20723 -246000Non-Pay -8588 -9661 -8893 -9388 -9175 -9681 -9951 -9638 -9453 -9628 -9639 -9778 -113476Total Expenditure -28398 -30177 -29273 -29691 -29448 -30146 -30347 -30213 -30293 -30572 -30417 -30501 -359476EBITDA -1671 41 1561 -65 107 -19 814 1130 -1520 416 -977 815 632Finance Costs -1151 -1194 -1195 -1180 -1180 -1180 -1180 -1180 -1180 -1180 -1180 -1180 -14160Surplus / (deficit) -2822 -1153 366 -1245 -1073 -1199 -366 -50 -2700 -764 -2157 -365 -13528Cumulative -2822 -3975 -3609 -4854 -5926 -7125 -7492 -7542 -10242 -11006 -13163 -13528
40
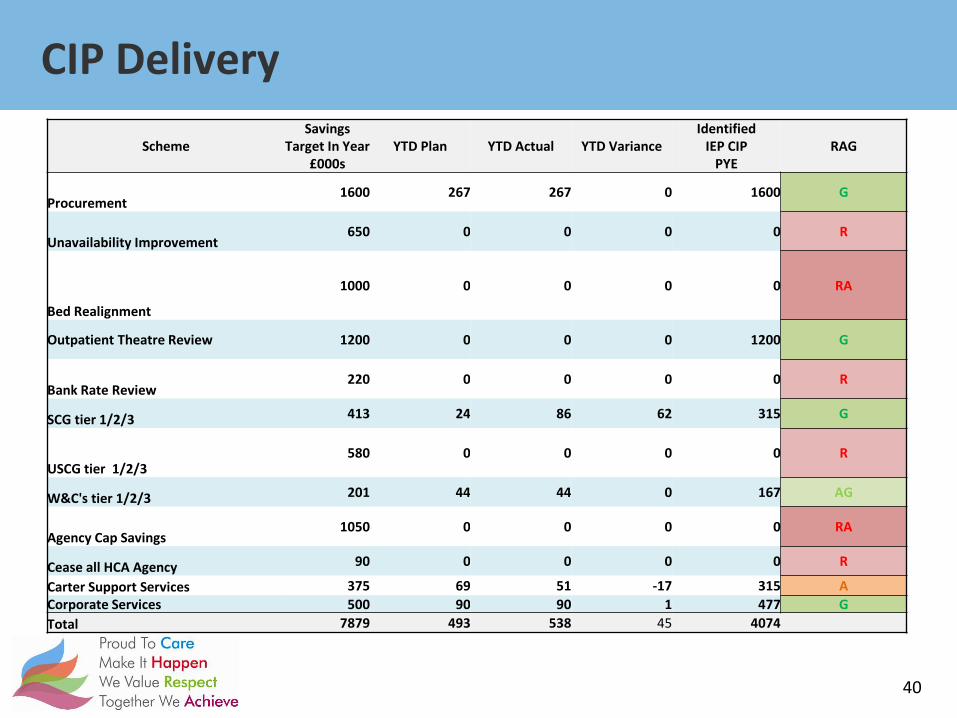
CIP Delivery
Scheme Savings
Target In Year £000s
YTD Plan YTD Actual YTD Variance Identified
IEP CIP PYE
RAG
Procurement 1600 267 267 0 1600 G
Unavailability Improvement 650 0 0 0 0 R
Bed Realignment
1000 0 0 0 0 RA
Outpatient Theatre Review 1200 0 0 0 1200 G
Bank Rate Review 220 0 0 0 0 R
SCG tier 1/2/3 413 24 86 62 315 G
USCG tier 1/2/3 580 0 0 0 0 R
W&C's tier 1/2/3 201 44 44 0 167 AG
Agency Cap Savings 1050 0 0 0 0 RA
Cease all HCA Agency 90 0 0 0 0 R
Carter Support Services 375 69 51 -17 315 A Corporate Services 500 90 90 1 477 G Total 7879 493 538 45 4074
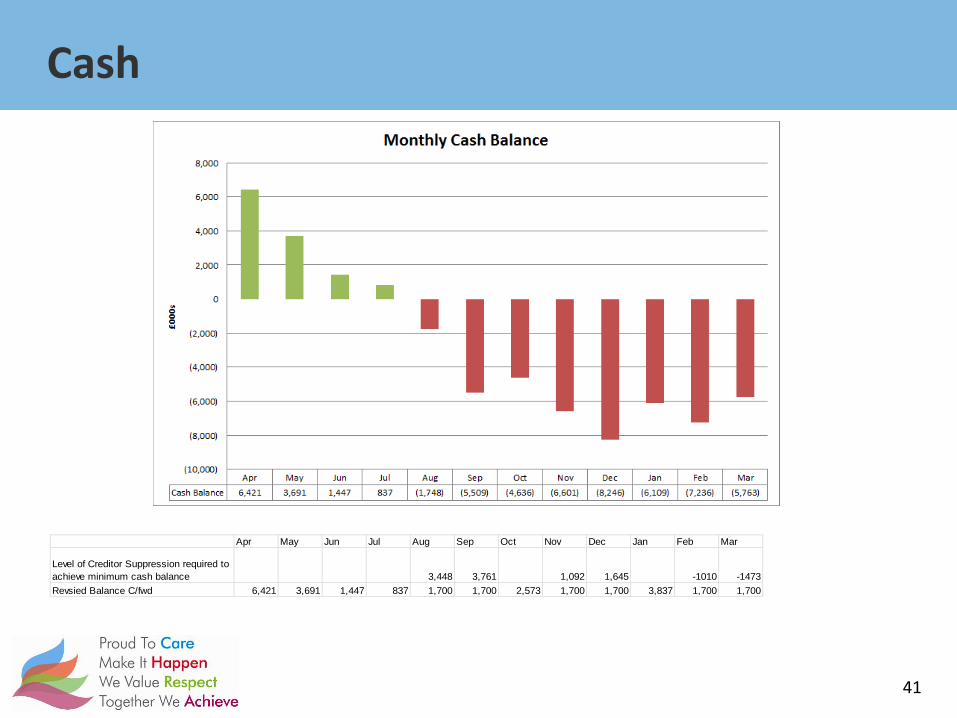
Cash
41
Apr May Jun Jul Aug Sep Oct Nov Dec Jan Feb Mar
Level of Creditor Suppression required to achieve minimum cash balance 3,448 3,761 1,092 1,645 -1010 -1473Revsied Balance C/fwd 6,421 3,691 1,447 837 1,700 1,700 2,573 1,700 1,700 3,837 1,700 1,700
Recommendation
DECISION
NOTE
(select)
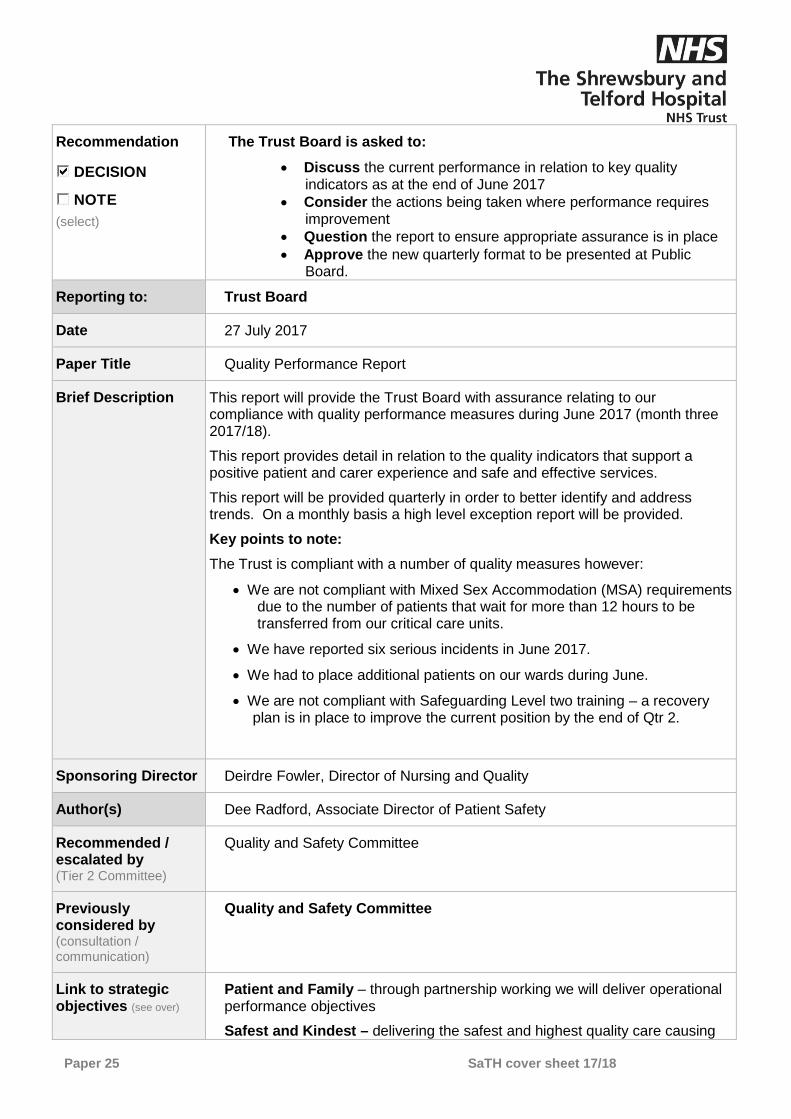
The Trust Board is asked to:
• Discuss the current performance in relation to key quality indicators as at the end of June 2017
• Consider the actions being taken where performance requires improvement
• Question the report to ensure appropriate assurance is in place • Approve the new quarterly format to be presented at Public
Board. Reporting to: Trust Board
Date 27 July 2017
Paper Title Quality Performance Report
Brief Description This report will provide the Trust Board with assurance relating to our compliance with quality performance measures during June 2017 (month three 2017/18).
This report provides detail in relation to the quality indicators that support a positive patient and carer experience and safe and effective services.
This report will be provided quarterly in order to better identify and address trends. On a monthly basis a high level exception report will be provided.
Key points to note: The Trust is compliant with a number of quality measures however:
• We are not compliant with Mixed Sex Accommodation (MSA) requirements due to the number of patients that wait for more than 12 hours to be transferred from our critical care units.
• We have reported six serious incidents in June 2017.
• We had to place additional patients on our wards during June.
• We are not compliant with Safeguarding Level two training – a recovery plan is in place to improve the current position by the end of Qtr 2.
Sponsoring Director Deirdre Fowler, Director of Nursing and Quality
Author(s) Dee Radford, Associate Director of Patient Safety
Recommended / escalated by (Tier 2 Committee)
Quality and Safety Committee
Previously considered by (consultation / communication)
Quality and Safety Committee
Link to strategic objectives (see over)
Patient and Family – through partnership working we will deliver operational performance objectives
Safest and Kindest – delivering the safest and highest quality care causing
Paper 25 SaTH cover sheet 17/18

zero harm
Link to Board Assurance Framework (see over)
RR561
RR951
RR1185
Equality Impact Assessment (select one)
Stage 1 only (no negative impacts identified) Stage 2 recommended (negative impacts identified)
negative impacts have been mitigated negative impacts balanced against overall positive impacts
Freedom of Information Act (2000) status (select one)
This document is for full publication This document includes FOIA exempt information This whole document is exempt under the FOIA
Quarterly Quality Governance Report Qtr One 2017-2018 Page 1 of 33
Quarterly Quality Governance
Report
Quarter One 2017-2018 April – June 2017
Quarterly Quality Governance Report Qtr One 2017-2018 Page 2 of 33
This report covers our performance against contractual and regulatory metrics related to quality and safety during the month of June 2017 (Month three for 2017/2018) and also for the first quarter of the year as a whole. The report will provide assurance to the Quality and Safety Committee that we are compliant with key performance measures and where we are not, recovery plans are in place to improve our current position. The report will be submitted to the Quality and Safety Committee as a standalone document and will then be presented to Trust Board as part of the Integrated Performance Paper for consideration and triangulation with performance and workforce indicators. The report will be submitted to our commissioners (Shropshire Clinical Commissioning Group and Telford and Wrekin Clinical Commissioning Group)
to provide assurance to them that we are fulfilling our contractual requirements as required in the Quality Schedule of our 2017-2018 contracts.
Introduction
Quarterly Quality Governance Report Qtr One 2017-2018 Page 3 of 33
Section Content Page
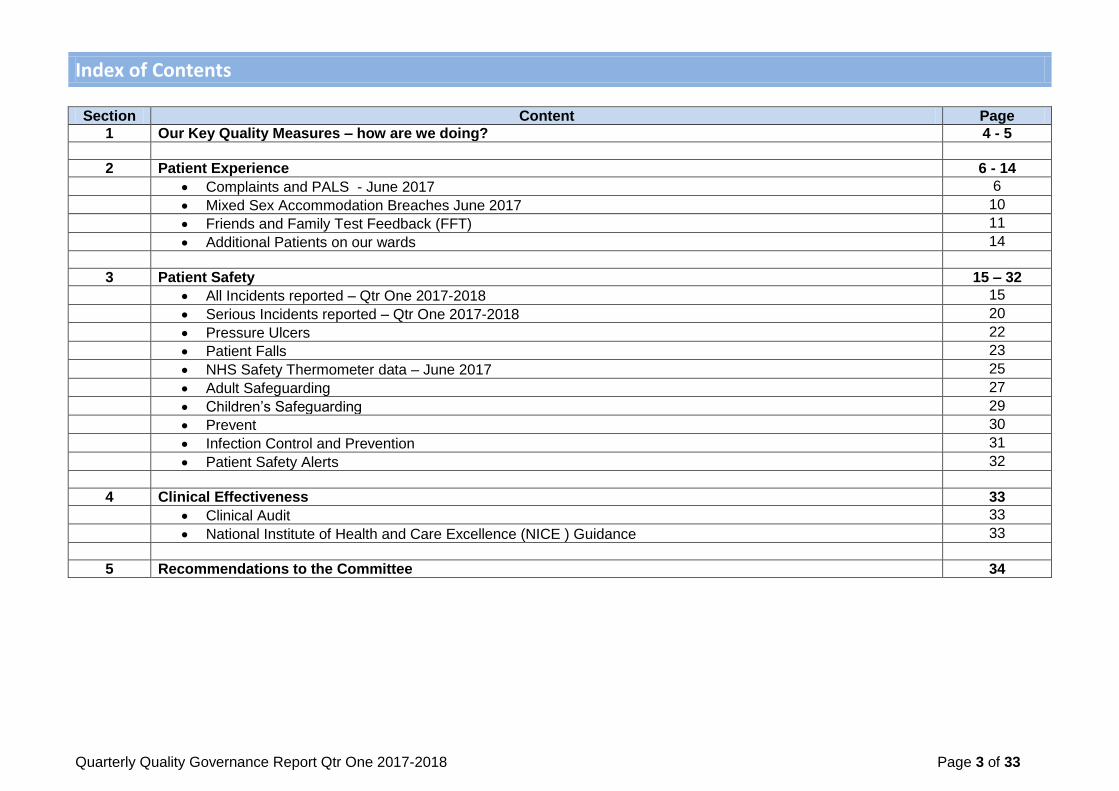
1 Our Key Quality Measures – how are we doing? 4 - 5
2 Patient Experience 6 - 14
Complaints and PALS - June 2017 6
Mixed Sex Accommodation Breaches June 2017 10
Friends and Family Test Feedback (FFT) 11
Additional Patients on our wards 14
3 Patient Safety 15 – 32
All Incidents reported – Qtr One 2017-2018 15
Serious Incidents reported – Qtr One 2017-2018 20
Pressure Ulcers 22
Patient Falls 23
NHS Safety Thermometer data – June 2017 25
Adult Safeguarding 27
Children‟s Safeguarding 29
Prevent 30
Infection Control and Prevention 31
Patient Safety Alerts 32
4 Clinical Effectiveness 33
Clinical Audit 33
National Institute of Health and Care Excellence (NICE ) Guidance 33
5 Recommendations to the Committee 34
Index of Contents
Quarterly Quality Governance Report Qtr One 2017-2018 Page 4 of 33
Measure Year end
16/17
Jul 16
Aug 16
Sept 16
Oct 16
Nov 16
Dec 16
Jan 17
Feb 17
Mar 17
April 17
May 17
June 17
Year to date
2017/18
Monthly Target
2017/18
Annual Target
2017/18
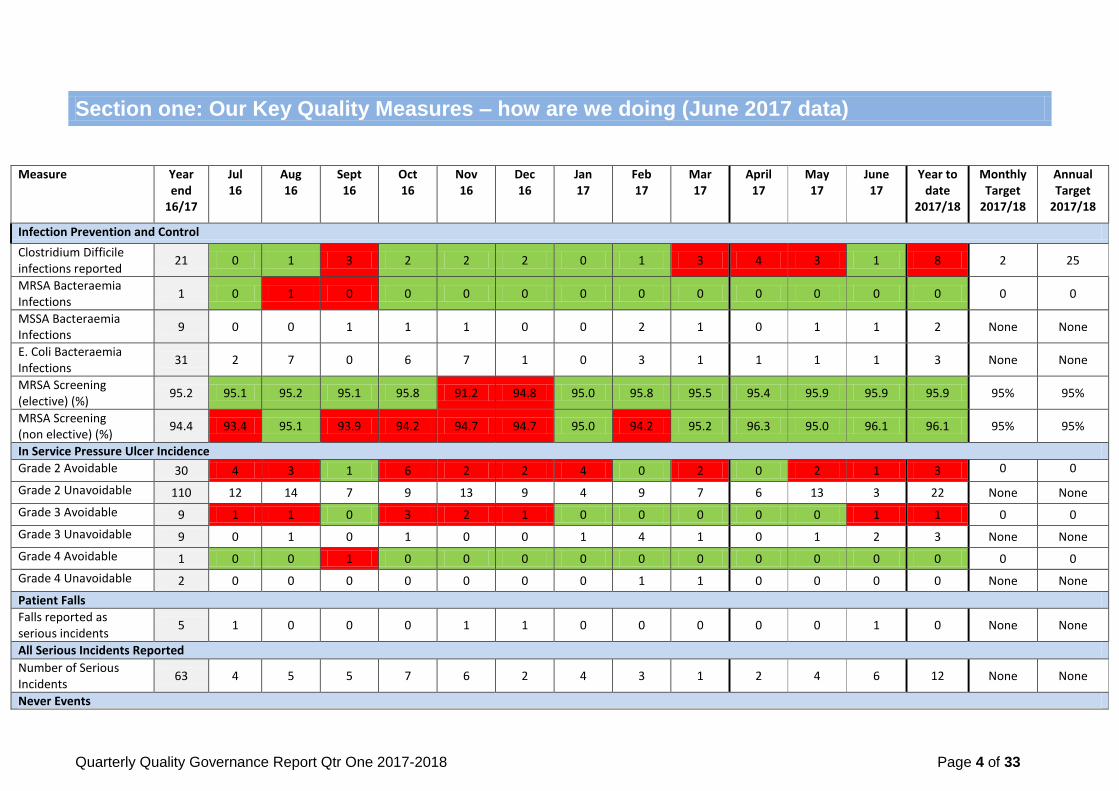
Infection Prevention and Control
Clostridium Difficile infections reported
21 0 1 3 2 2 2 0 1 3 4 3 1 8 2 25
MRSA Bacteraemia Infections
1 0 1 0 0 0 0 0 0 0 0 0 0 0 0 0
MSSA Bacteraemia Infections
9 0 0 1 1 1 0 0 2 1 0 1 1 2 None None
E. Coli Bacteraemia Infections
31 2 7 0 6 7 1 0 3 1 1 1 1 3 None None
MRSA Screening (elective) (%)
95.2 95.1 95.2 95.1 95.8 91.2 94.8 95.0 95.8 95.5 95.4 95.9 95.9 95.9 95% 95%
MRSA Screening (non elective) (%)
94.4 93.4 95.1 93.9 94.2 94.7 94.7 95.0 94.2 95.2 96.3 95.0 96.1 96.1 95% 95%
In Service Pressure Ulcer Incidence
Grade 2 Avoidable 30 4 3 1 6 2 2 4 0 2 0 2 1 3 0 0
Grade 2 Unavoidable 110 12 14 7 9 13 9 4 9 7 6 13 3 22 None None
Grade 3 Avoidable 9 1 1 0 3 2 1 0 0 0 0 0 1 1 0 0
Grade 3 Unavoidable 9 0 1 0 1 0 0 1 4 1 0 1 2 3 None None
Grade 4 Avoidable 1 0 0 1 0 0 0 0 0 0 0 0 0 0 0 0
Grade 4 Unavoidable 2 0 0 0 0 0 0 0 1 1 0 0 0 0 None None
Patient Falls
Falls reported as serious incidents
5 1 0 0 0 1 1 0 0 0 0 0 1 0 None None
All Serious Incidents Reported
Number of Serious Incidents
63 4 5 5 7 6 2 4 3 1 2 4 6 12 None None
Never Events
Section one: Our Key Quality Measures – how are we doing (June 2017 data)
Quarterly Quality Governance Report Qtr One 2017-2018 Page 5 of 33
Measure Year end
16/17
Jul 16
Aug 16
Sept 16
Oct 16
Nov 16
Dec 16
Jan 17
Feb 17
Mar 17
April 17
May 17
June 17
Year to date
2017/18
Monthly Target
2017/18
Annual Target
2017/18
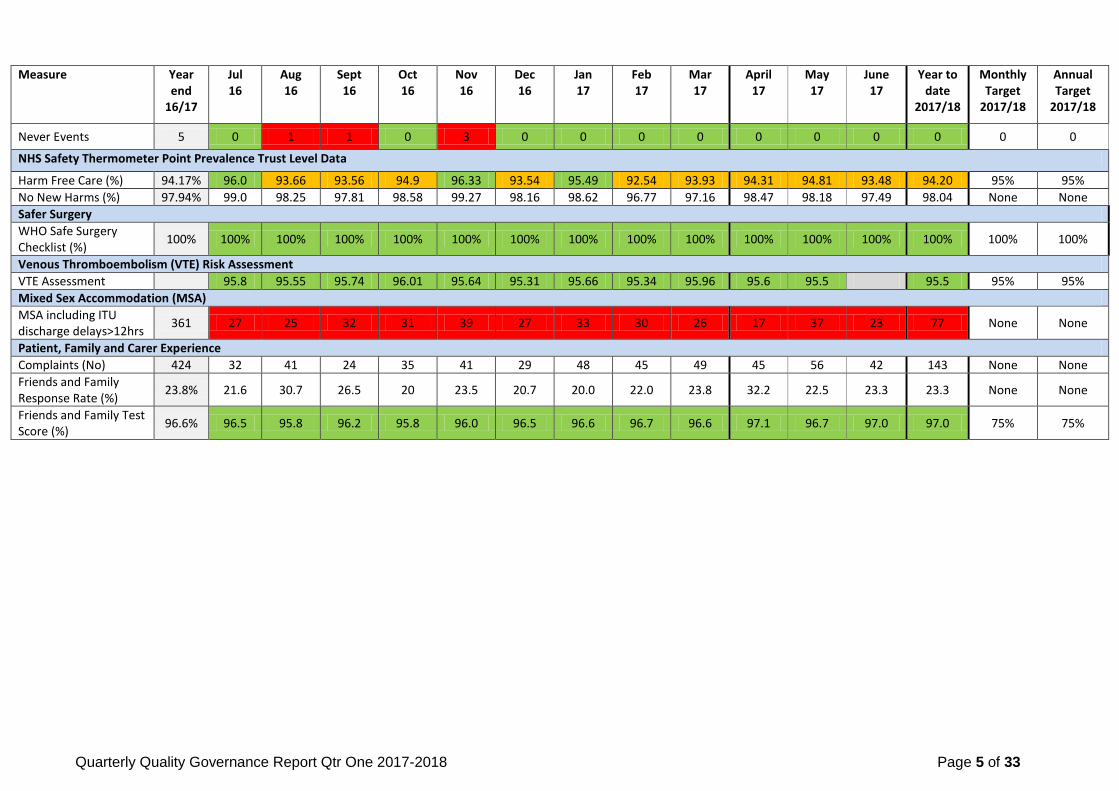
Never Events 5 0 1 1 0 3 0 0 0 0 0 0 0 0 0 0
NHS Safety Thermometer Point Prevalence Trust Level Data
Harm Free Care (%) 94.17% 96.0 93.66 93.56 94.9 96.33 93.54 95.49 92.54 93.93 94.31 94.81 93.48 94.20 95% 95%
No New Harms (%) 97.94% 99.0 98.25 97.81 98.58 99.27 98.16 98.62 96.77 97.16 98.47 98.18 97.49 98.04 None None
Safer Surgery
WHO Safe Surgery Checklist (%)
100% 100% 100% 100% 100% 100% 100% 100% 100% 100% 100% 100% 100% 100% 100% 100%
Venous Thromboembolism (VTE) Risk Assessment
VTE Assessment 95.8 95.55 95.74 96.01 95.64 95.31 95.66 95.34 95.96 95.6 95.5 95.5 95% 95%
Mixed Sex Accommodation (MSA)
MSA including ITU discharge delays>12hrs
361 27 25 32 31 39 27 33 30 26 17 37 23 77 None None
Patient, Family and Carer Experience
Complaints (No) 424 32 41 24 35 41 29 48 45 49 45 56 42 143 None None
Friends and Family Response Rate (%)
23.8% 21.6 30.7 26.5 20 23.5 20.7 20.0 22.0 23.8 32.2 22.5 23.3 23.3 None None
Friends and Family Test Score (%)
96.6% 96.5 95.8 96.2 95.8 96.0 96.5 96.6 96.7 96.6 97.1 96.7 97.0 97.0 75% 75%
Quarterly Quality Governance Report Qtr One 2017-2018 Page 6 of 33
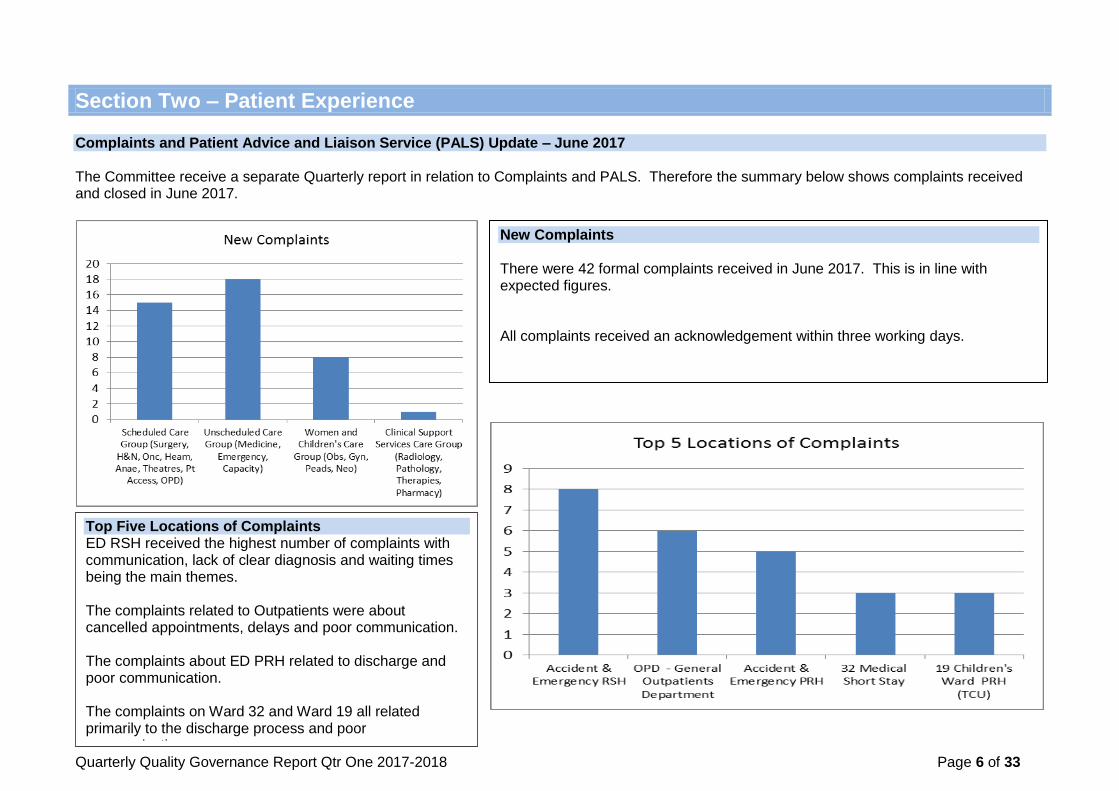
Section Two – Patient Experience Complaints and Patient Advice and Liaison Service (PALS) Update – June 2017 The Committee receive a separate Quarterly report in relation to Complaints and PALS. Therefore the summary below shows complaints received and closed in June 2017.
New Complaints There were 42 formal complaints received in June 2017. This is in line with expected figures. All complaints received an acknowledgement within three working days.
Top Five Locations of Complaints ED RSH received the highest number of complaints with communication, lack of clear diagnosis and waiting times being the main themes. The complaints related to Outpatients were about cancelled appointments, delays and poor communication. The complaints about ED PRH related to discharge and poor communication. The complaints on Ward 32 and Ward 19 all related primarily to the discharge process and poor communication.
Quarterly Quality Governance Report Qtr One 2017-2018 Page 7 of 33
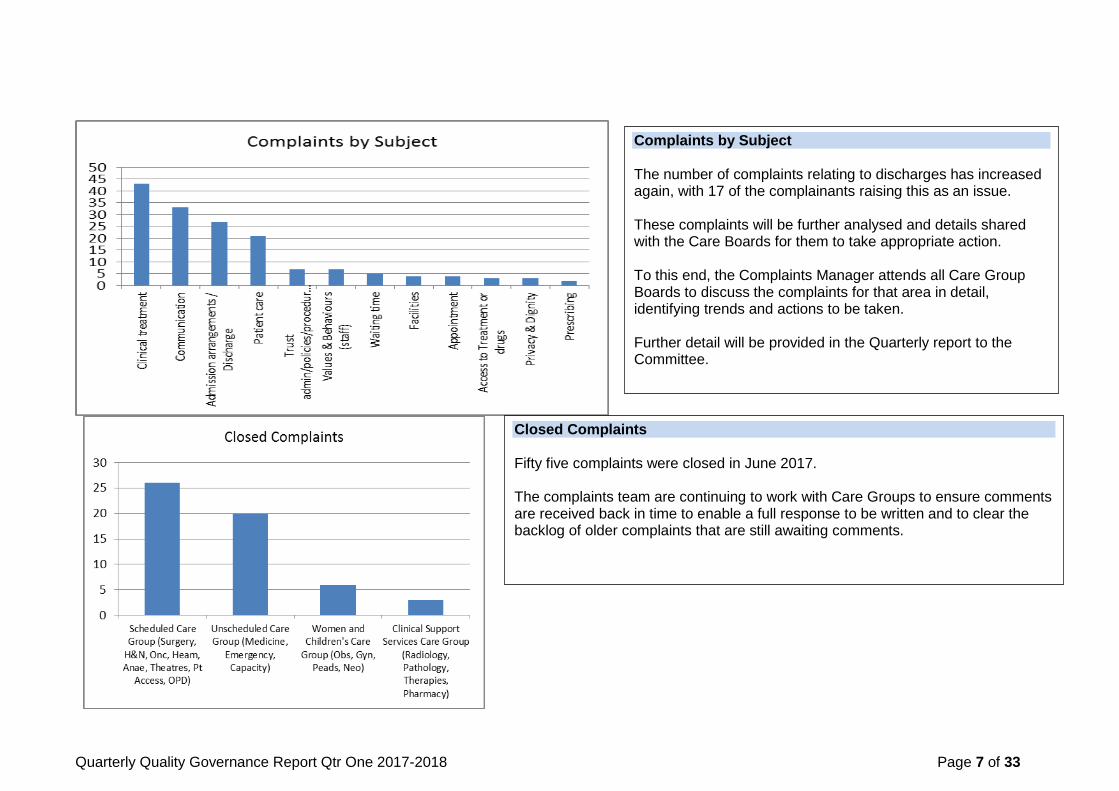
Complaints by Subject The number of complaints relating to discharges has increased again, with 17 of the complainants raising this as an issue. These complaints will be further analysed and details shared with the Care Boards for them to take appropriate action. To this end, the Complaints Manager attends all Care Group Boards to discuss the complaints for that area in detail, identifying trends and actions to be taken. Further detail will be provided in the Quarterly report to the Committee.
Closed Complaints Fifty five complaints were closed in June 2017. The complaints team are continuing to work with Care Groups to ensure comments are received back in time to enable a full response to be written and to clear the backlog of older complaints that are still awaiting comments.

Quarterly Quality Governance Report Qtr One 2017-2018 Page 8 of 33
Complaints closed within agreed timescale The number of complaints closed within timescale continues to increase. There are a number of complaints still open and within time from April and May, so these figures may change.
Reopened Complaints Five complaints were reopened in June 2017. The graph on the left shows the percentage of complaints that are reopened by month received. Although figures are likely to increase for more recent months, the downward trend indicates that the responses are now more adequately addressing the patients‟ concerns.
Quarterly Quality Governance Report Qtr One 2017-2018 Page 9 of 33
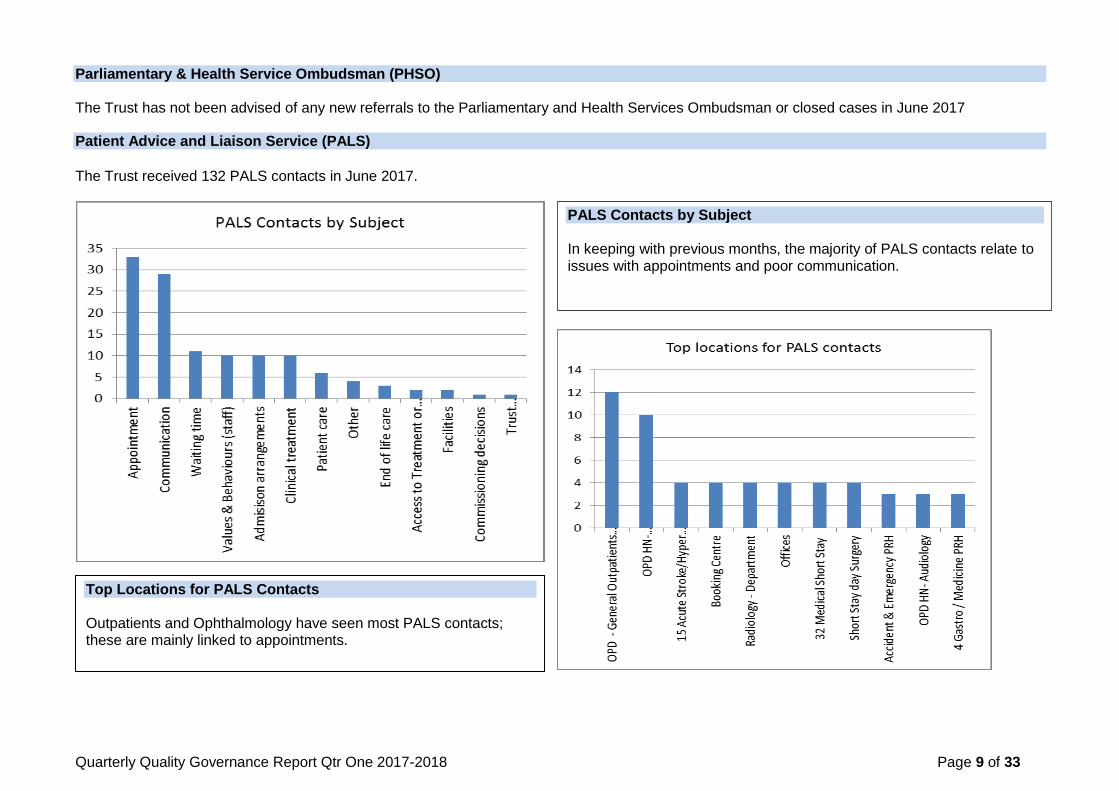
Parliamentary & Health Service Ombudsman (PHSO) The Trust has not been advised of any new referrals to the Parliamentary and Health Services Ombudsman or closed cases in June 2017 Patient Advice and Liaison Service (PALS)
The Trust received 132 PALS contacts in June 2017.
PALS Contacts by Subject In keeping with previous months, the majority of PALS contacts relate to issues with appointments and poor communication.
Top Locations for PALS Contacts Outpatients and Ophthalmology have seen most PALS contacts; these are mainly linked to appointments.
Quarterly Quality Governance Report Qtr One 2017-2018 Page 10 of 33
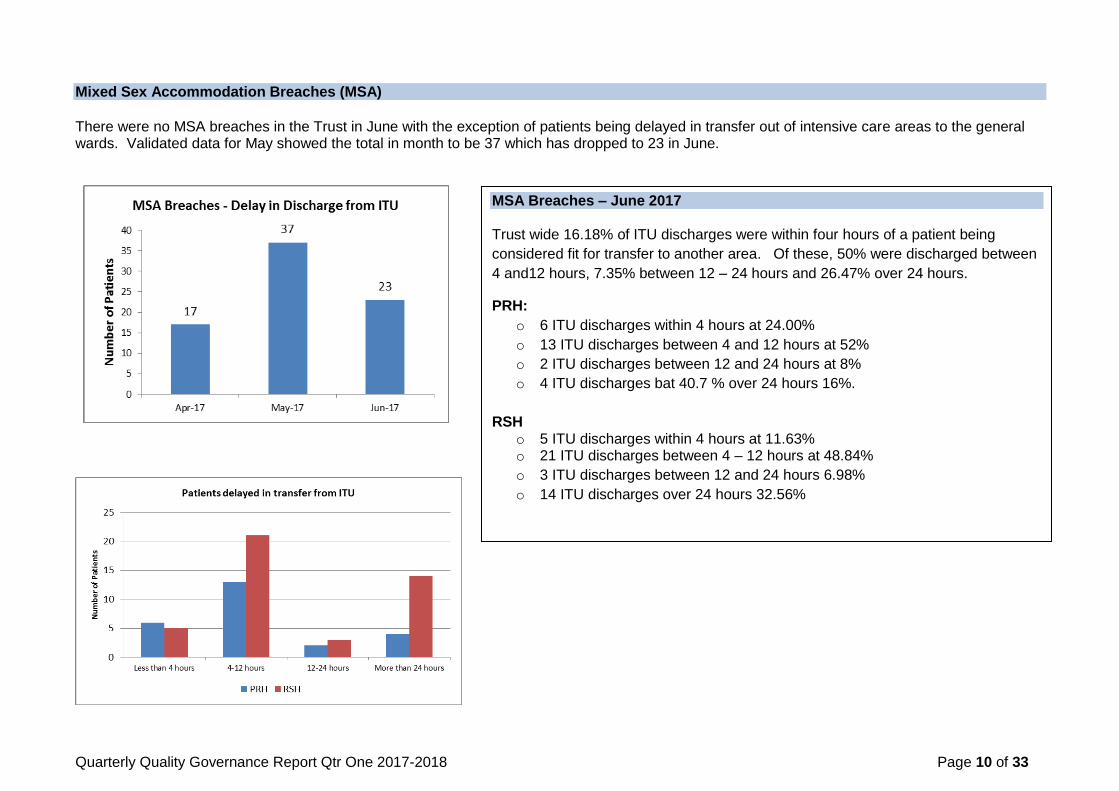
Mixed Sex Accommodation Breaches (MSA) There were no MSA breaches in the Trust in June with the exception of patients being delayed in transfer out of intensive care areas to the general wards. Validated data for May showed the total in month to be 37 which has dropped to 23 in June.
MSA Breaches – June 2017 Trust wide 16.18% of ITU discharges were within four hours of a patient being
considered fit for transfer to another area. Of these, 50% were discharged between
4 and12 hours, 7.35% between 12 – 24 hours and 26.47% over 24 hours.
PRH:
o 6 ITU discharges within 4 hours at 24.00%
o 13 ITU discharges between 4 and 12 hours at 52%
o 2 ITU discharges between 12 and 24 hours at 8%
o 4 ITU discharges bat 40.7 % over 24 hours 16%.
RSH o 5 ITU discharges within 4 hours at 11.63% o 21 ITU discharges between 4 – 12 hours at 48.84%
o 3 ITU discharges between 12 and 24 hours 6.98%
o 14 ITU discharges over 24 hours 32.56%

Quarterly Quality Governance Report Qtr One 2017-2018 Page 11 of 33
Friends and Family Test Feedback (FFT) The overall percentage of patients who would recommend the ward they were treated on to friends and family, if they needed similar care and treatment, was 97%. This was an increase on May‟s results. Individually, Maternity, A&E and Outpatients all saw improvements, however inpatients did see a slight decrease compared to the previous month.
The overall response rate was 23.3% which was an improvement compared to May results. Individually, inpatients did increase on their responses; however maternity birth and A&E decreased slightly. A new patient experience apprentice has been appointed which we hope will have further a positive impact going forward.
Inpatient Summary
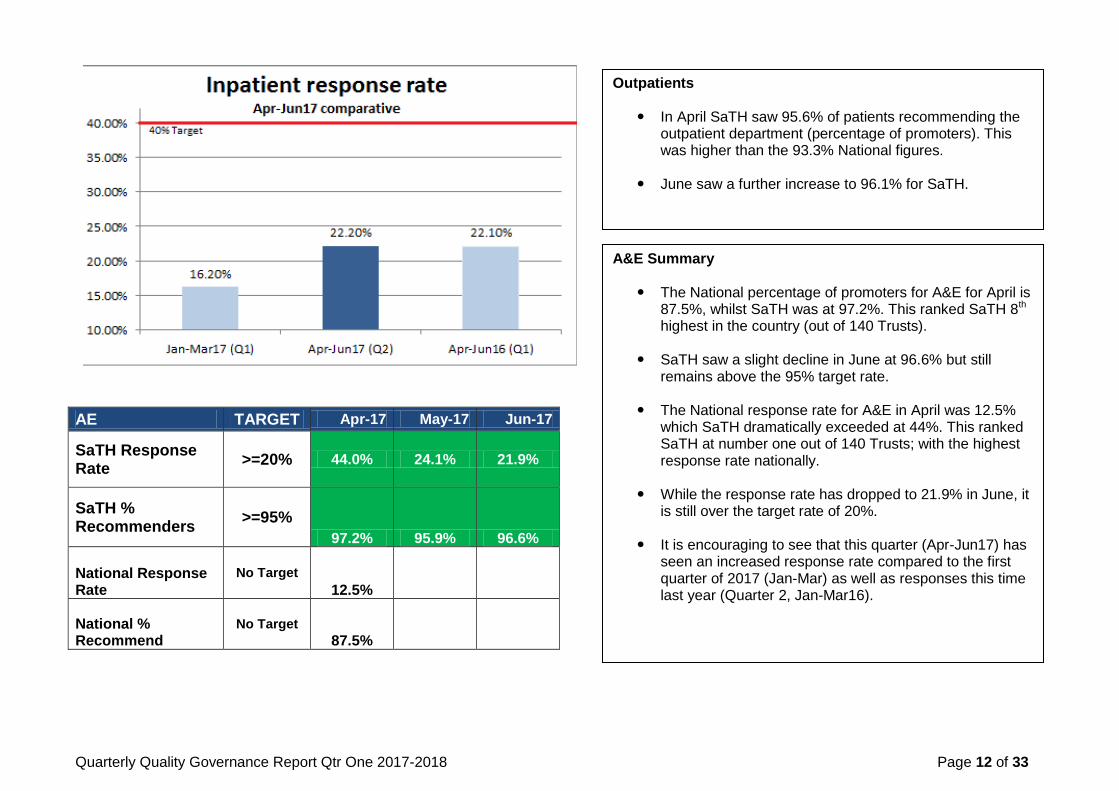
The most recent National figures available are for April 17. These show the percentage of promoters at 95.8%. SaTH is therefore exceeding this as we reach 98% for inpatients in Apr17. Inpatients remain consistently high at 97.9% for June17.
The majority of inpatient areas are achieving the Trust target of 95% for patients who would recommend the ward (percentage of promoters).
The National response rate for inpatient in April
17 is 25.3% which is higher than SaTH at 21%. We have however increased locally to 24.5% in June 17.
Even with this increase, we still remain nearly 16% under the SaTH target response rate of 40%.
It is encouraging to see that this quarter (Apr-
Jun17) has seen an increased response rate compared to the first quarter of 2017 (Jan-Mar) as well as responses this time last year (Quarter 2, Jan-Mar16).
Maternity Nationally the percentage of promoters for Maternity in April was 96.4%. SaTH reached 100% in April and more recently 98.8% in June. The response rate for Maternity only includes „birth‟ and the National rate in April was 23.9%. SaTH reached 13% in April but has dropped to 7.3% in June
Quarterly Quality Governance Report Qtr One 2017-2018 Page 12 of 33
AE TARGET Apr-17 May-17 Jun-17
SaTH Response Rate
>=20% 44.0% 24.1% 21.9%
SaTH % Recommenders
>=95%
97.2% 95.9% 96.6%
National Response Rate
No Target
12.5%
National % Recommend
No Target
87.5%
Outpatients
In April SaTH saw 95.6% of patients recommending the outpatient department (percentage of promoters). This was higher than the 93.3% National figures.
June saw a further increase to 96.1% for SaTH.
A&E Summary
The National percentage of promoters for A&E for April is 87.5%, whilst SaTH was at 97.2%. This ranked SaTH 8th highest in the country (out of 140 Trusts).
SaTH saw a slight decline in June at 96.6% but still remains above the 95% target rate.
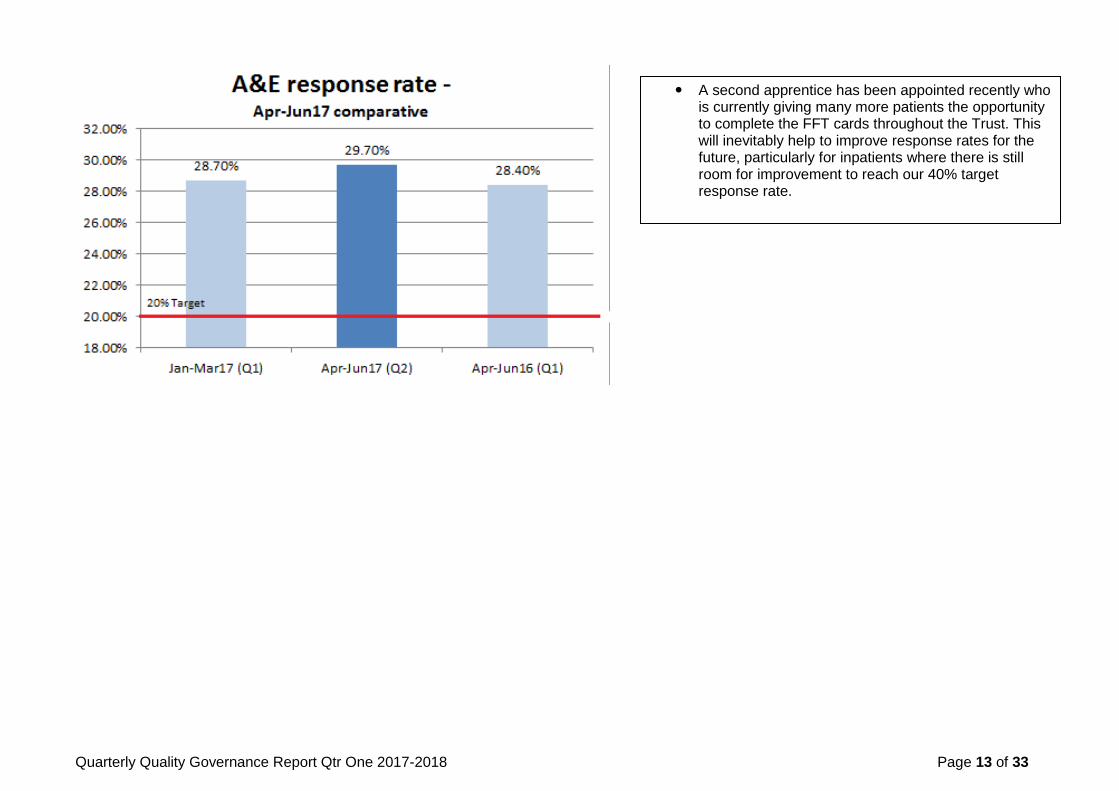
The National response rate for A&E in April was 12.5%
which SaTH dramatically exceeded at 44%. This ranked SaTH at number one out of 140 Trusts; with the highest response rate nationally.
While the response rate has dropped to 21.9% in June, it
is still over the target rate of 20%.
It is encouraging to see that this quarter (Apr-Jun17) has seen an increased response rate compared to the first quarter of 2017 (Jan-Mar) as well as responses this time last year (Quarter 2, Jan-Mar16).
Quarterly Quality Governance Report Qtr One 2017-2018 Page 13 of 33
A second apprentice has been appointed recently who is currently giving many more patients the opportunity to complete the FFT cards throughout the Trust. This will inevitably help to improve response rates for the future, particularly for inpatients where there is still room for improvement to reach our 40% target response rate.
Quarterly Quality Governance Report Qtr One 2017-2018 Page 14 of 33
Additional Patients on our wards
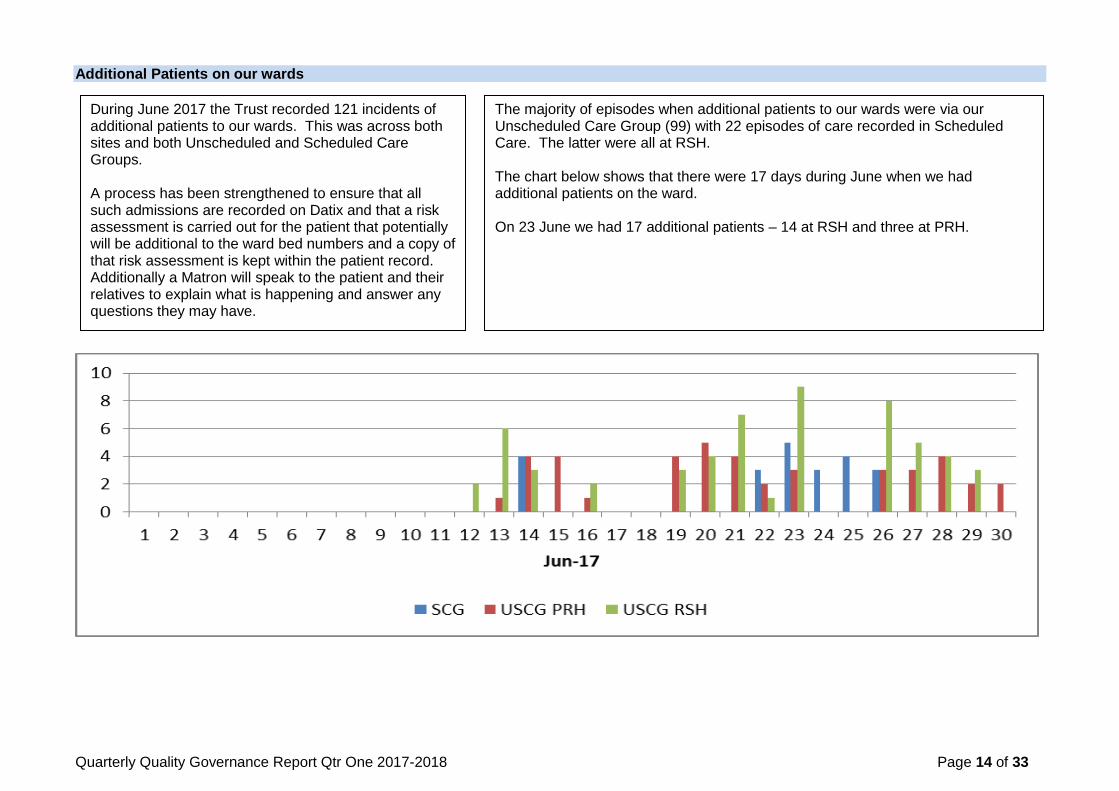
During June 2017 the Trust recorded 121 incidents of additional patients to our wards. This was across both sites and both Unscheduled and Scheduled Care Groups. A process has been strengthened to ensure that all such admissions are recorded on Datix and that a risk assessment is carried out for the patient that potentially will be additional to the ward bed numbers and a copy of that risk assessment is kept within the patient record. Additionally a Matron will speak to the patient and their relatives to explain what is happening and answer any questions they may have.
The majority of episodes when additional patients to our wards were via our Unscheduled Care Group (99) with 22 episodes of care recorded in Scheduled Care. The latter were all at RSH. The chart below shows that there were 17 days during June when we had additional patients on the ward. On 23 June we had 17 additional patients – 14 at RSH and three at PRH.

Quarterly Quality Governance Report Qtr One 2017-2018 Page 15 of 33
All Patient Safety Incidents
Section Three – Patient Safety
Patient Safety Incidents A total of 3002 patient safety incidents were reported in Qtr 1 2017-2018 across the Trust. This compares to 3120 in the same quarter of 2016-2017. It is a slight decrease from the 3017 reported in Qtr 4 of 2017-2018. Top Five Reporting Categories/Top Ten Areas It should be noted that of the 555 pressure ulcers reported, 364 were present on admission, meaning that 191 potential pressure ulcers were reported as having occurred in our care. Following review and validation by the ward managers and, if required, the Tissue Viability Team, this number will reduce.

Quarterly Quality Governance Report Qtr One 2017-2018 Page 16 of 33
The table below shows the detail relating to the status of the incidents that have been reported in the Quarter. The Trust Incident Reporting Policy requires managers to whom the incidents have been reported (the handler of the incident) to review and close the incident within specified timescales depending on the severity of the harm that may have occurred. Final approval is a process by which the relevant member of the Patient Safety Team reviews the actions and ensures that the Datix record is correct. All Patient Safety Incidents by Care Group and Approval status as at 07 July 2017
In holding
area, awaiting review
Being reviewed
Awaiting final
approval
Being approved
Final approval
Total
Ambulance/ Patient first 0 1 2 0 0 3
Corporate Governance Directorate (Legal, Security, H&S, Assurance, Gov, R&D) 2 0 0 0 0 2
Workforce Directorate (HR, Med Education) 0 0 1 0 0 1
Quality & Safety Directorate (Pat Safety, Pat Services, Infection Control) 2 0 0 0 0 3
Resources Directorate (Estates, Facilities, Finance, IT,) 3 2 3 1 2 11
Scheduled Care Group (Surgery, H&N, Onc, Haem, Anae, Theatres, Pt Access, OPD) 174 99 440 4 241 963
Clinical Support Services Care Group (Radiology, Pathology, Therapies, Pharmacy) 25 18 49 0 21 113
Test CG do not use 1 1 0 0 0 2
Unscheduled Care Group (Medicine, Emergency, Capacity) 214 99 522 9 609 1455
Women and Children's Care Group (Obs, Gyn, Paeds, Neo) 233 40 94 0 80 449
Totals: 654 260 1111 14 953 3002
From September 2017 we will be implementing a process by which all moderate harm and above RCA will be reviewed by a panel on a weekly basis. Additionally, we will be uploading data to NRLS on a fortnightly basis which will ensure that incidents are validated promptly by the Patient Safety Team and managers supported to close incidents in a timely manner.
Quarterly Quality Governance Report Qtr One 2017-2018 Page 17 of 33
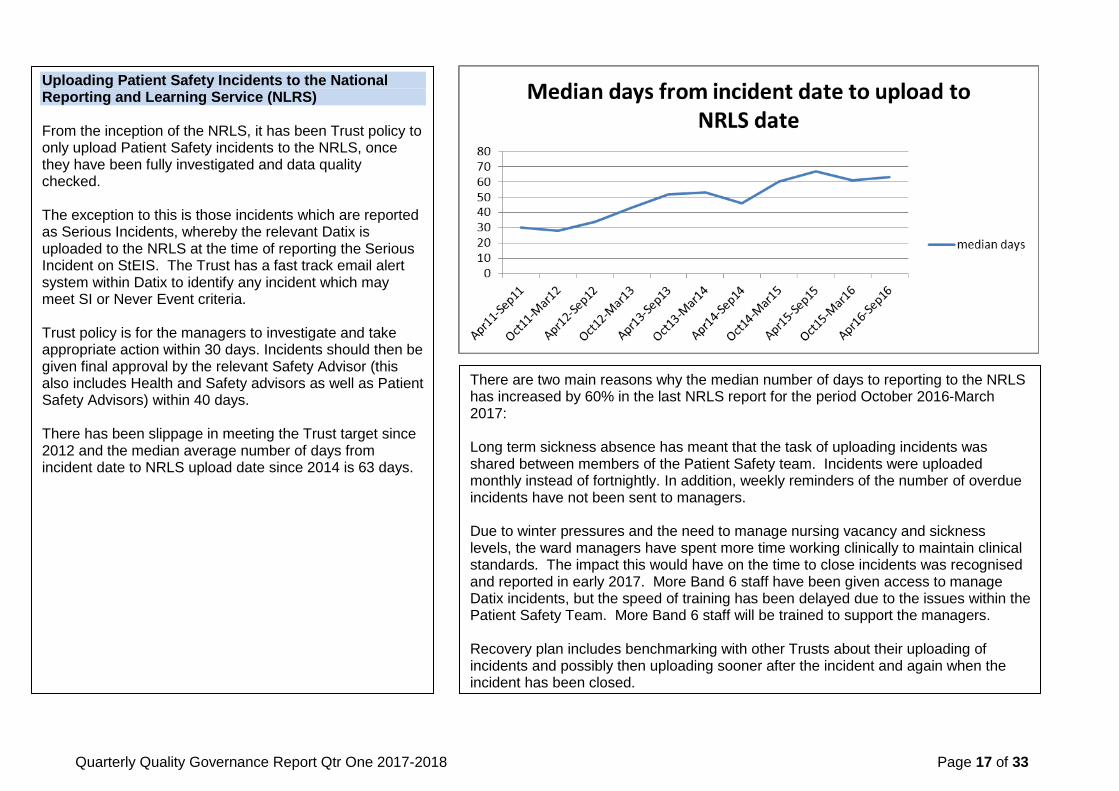
Uploading Patient Safety Incidents to the National Reporting and Learning Service (NLRS) From the inception of the NRLS, it has been Trust policy to only upload Patient Safety incidents to the NRLS, once they have been fully investigated and data quality checked. The exception to this is those incidents which are reported as Serious Incidents, whereby the relevant Datix is uploaded to the NRLS at the time of reporting the Serious Incident on StEIS. The Trust has a fast track email alert system within Datix to identify any incident which may meet SI or Never Event criteria. Trust policy is for the managers to investigate and take appropriate action within 30 days. Incidents should then be given final approval by the relevant Safety Advisor (this also includes Health and Safety advisors as well as Patient Safety Advisors) within 40 days. There has been slippage in meeting the Trust target since 2012 and the median average number of days from incident date to NRLS upload date since 2014 is 63 days.
There are two main reasons why the median number of days to reporting to the NRLS has increased by 60% in the last NRLS report for the period October 2016-March 2017: Long term sickness absence has meant that the task of uploading incidents was shared between members of the Patient Safety team. Incidents were uploaded monthly instead of fortnightly. In addition, weekly reminders of the number of overdue incidents have not been sent to managers.
Due to winter pressures and the need to manage nursing vacancy and sickness levels, the ward managers have spent more time working clinically to maintain clinical standards. The impact this would have on the time to close incidents was recognised and reported in early 2017. More Band 6 staff have been given access to manage Datix incidents, but the speed of training has been delayed due to the issues within the Patient Safety Team. More Band 6 staff will be trained to support the managers. Recovery plan includes benchmarking with other Trusts about their uploading of incidents and possibly then uploading sooner after the incident and again when the incident has been closed.

Quarterly Quality Governance Report Qtr One 2017-2018 Page 18 of 33
Quarterly Quality Governance Report Qtr One 2017-2018 Page 19 of 33
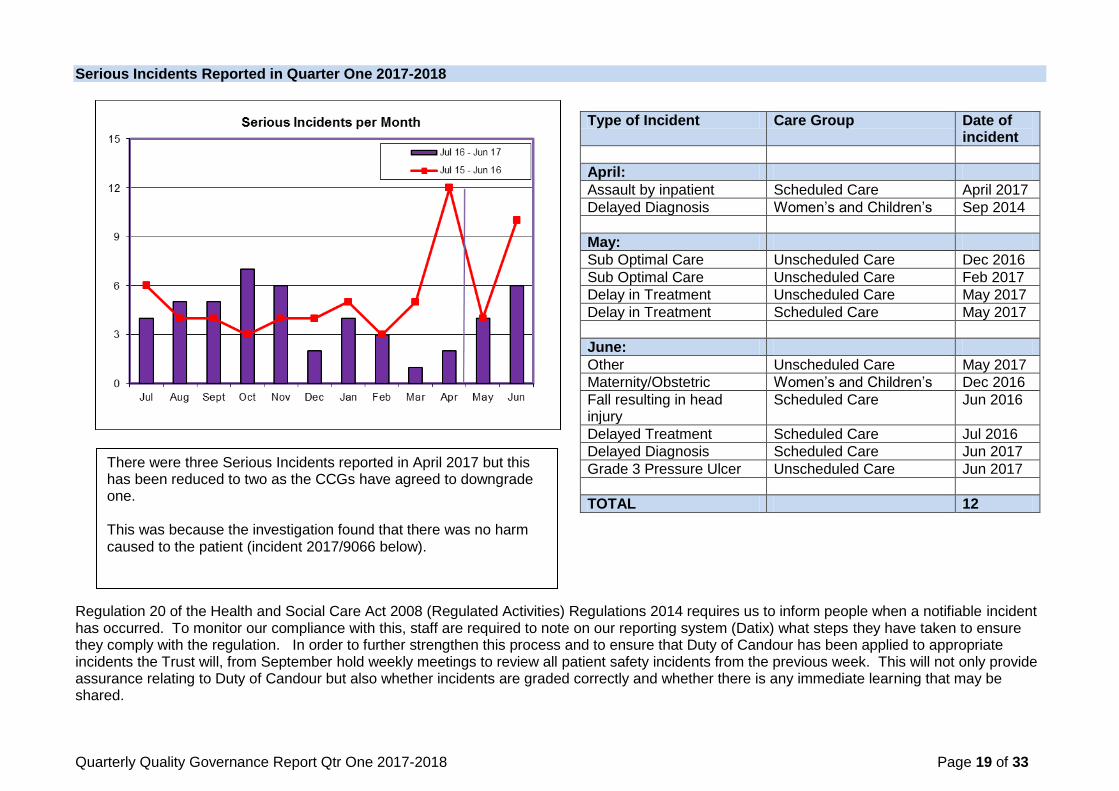
Serious Incidents Reported in Quarter One 2017-2018
Regulation 20 of the Health and Social Care Act 2008 (Regulated Activities) Regulations 2014 requires us to inform people when a notifiable incident has occurred. To monitor our compliance with this, staff are required to note on our reporting system (Datix) what steps they have taken to ensure they comply with the regulation. In order to further strengthen this process and to ensure that Duty of Candour has been applied to appropriate incidents the Trust will, from September hold weekly meetings to review all patient safety incidents from the previous week. This will not only provide assurance relating to Duty of Candour but also whether incidents are graded correctly and whether there is any immediate learning that may be shared.
Type of Incident Care Group Date of incident
April:
Assault by inpatient Scheduled Care April 2017
Delayed Diagnosis Women‟s and Children‟s Sep 2014
May:
Sub Optimal Care Unscheduled Care Dec 2016
Sub Optimal Care Unscheduled Care Feb 2017
Delay in Treatment Unscheduled Care May 2017
Delay in Treatment Scheduled Care May 2017
June:
Other Unscheduled Care May 2017
Maternity/Obstetric Women‟s and Children‟s Dec 2016
Fall resulting in head injury
Scheduled Care Jun 2016
Delayed Treatment Scheduled Care Jul 2016
Delayed Diagnosis Scheduled Care Jun 2017
Grade 3 Pressure Ulcer Unscheduled Care Jun 2017
TOTAL 12
There were three Serious Incidents reported in April 2017 but this has been reduced to two as the CCGs have agreed to downgrade one. This was because the investigation found that there was no harm caused to the patient (incident 2017/9066 below).
Quarterly Quality Governance Report Qtr One 2017-2018 Page 20 of 33
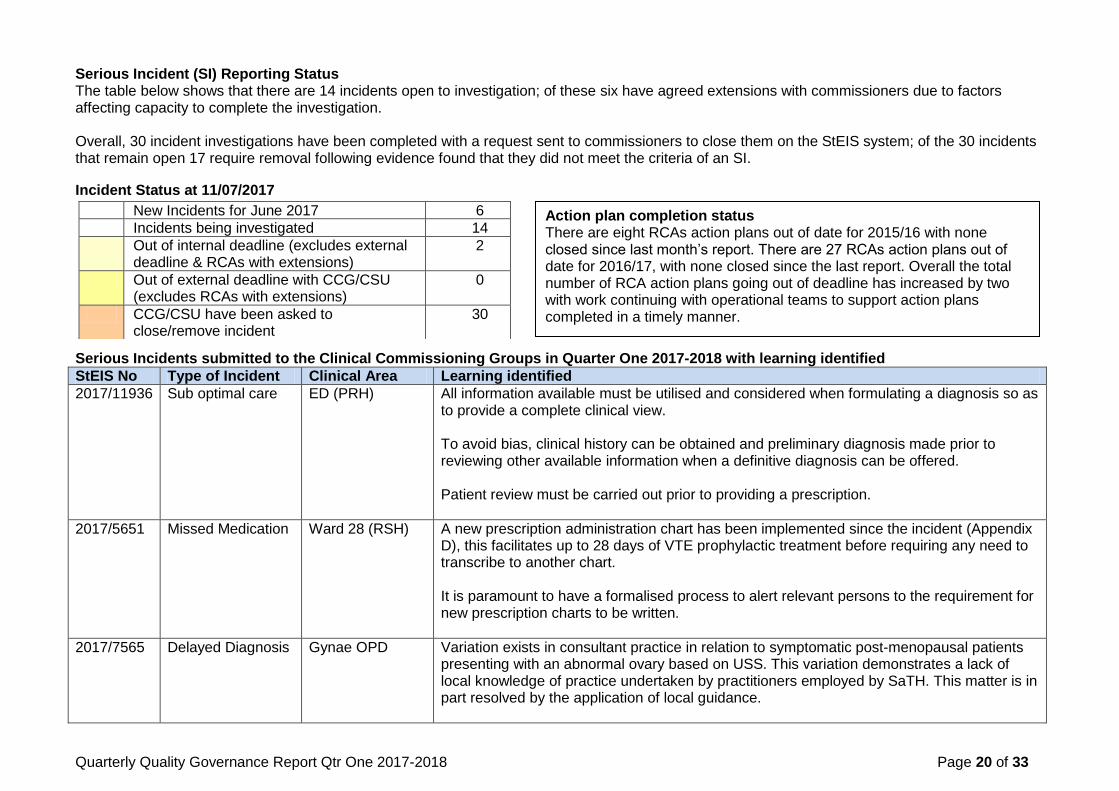
Serious Incident (SI) Reporting Status The table below shows that there are 14 incidents open to investigation; of these six have agreed extensions with commissioners due to factors affecting capacity to complete the investigation. Overall, 30 incident investigations have been completed with a request sent to commissioners to close them on the StEIS system; of the 30 incidents that remain open 17 require removal following evidence found that they did not meet the criteria of an SI.
Incident Status at 11/07/2017
Serious Incidents submitted to the Clinical Commissioning Groups in Quarter One 2017-2018 with learning identified
StEIS No Type of Incident Clinical Area Learning identified
2017/11936 Sub optimal care ED (PRH) All information available must be utilised and considered when formulating a diagnosis so as to provide a complete clinical view. To avoid bias, clinical history can be obtained and preliminary diagnosis made prior to reviewing other available information when a definitive diagnosis can be offered. Patient review must be carried out prior to providing a prescription.
2017/5651 Missed Medication Ward 28 (RSH) A new prescription administration chart has been implemented since the incident (Appendix D), this facilitates up to 28 days of VTE prophylactic treatment before requiring any need to transcribe to another chart. It is paramount to have a formalised process to alert relevant persons to the requirement for new prescription charts to be written.
2017/7565 Delayed Diagnosis Gynae OPD Variation exists in consultant practice in relation to symptomatic post-menopausal patients presenting with an abnormal ovary based on USS. This variation demonstrates a lack of local knowledge of practice undertaken by practitioners employed by SaTH. This matter is in part resolved by the application of local guidance.
New Incidents for June 2017 6
Incidents being investigated 14
Out of internal deadline (excludes external deadline & RCAs with extensions)
2
Out of external deadline with CCG/CSU (excludes RCAs with extensions)
0
CCG/CSU have been asked to close/remove incident
30
Action plan completion status There are eight RCAs action plans out of date for 2015/16 with none closed since last month‟s report. There are 27 RCAs action plans out of date for 2016/17, with none closed since the last report. Overall the total number of RCA action plans going out of deadline has increased by two with work continuing with operational teams to support action plans completed in a timely manner.
Quarterly Quality Governance Report Qtr One 2017-2018 Page 21 of 33
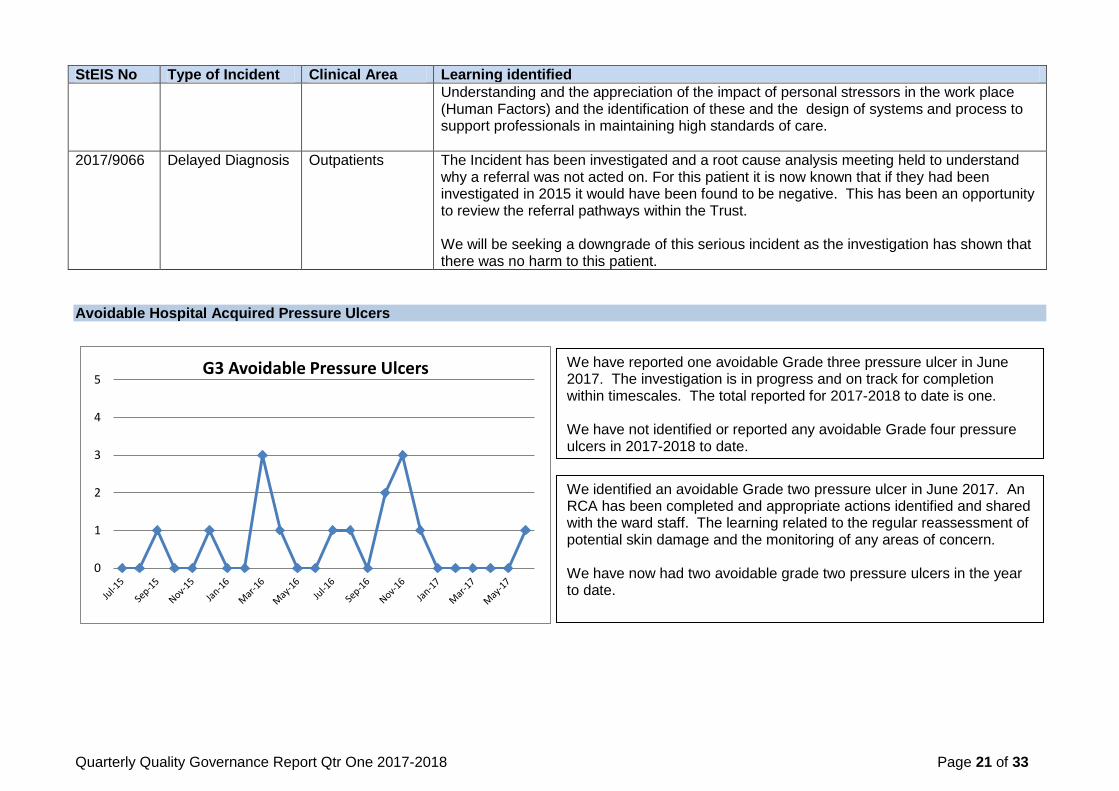
StEIS No Type of Incident Clinical Area Learning identified
Understanding and the appreciation of the impact of personal stressors in the work place (Human Factors) and the identification of these and the design of systems and process to support professionals in maintaining high standards of care.
2017/9066 Delayed Diagnosis Outpatients The Incident has been investigated and a root cause analysis meeting held to understand why a referral was not acted on. For this patient it is now known that if they had been investigated in 2015 it would have been found to be negative. This has been an opportunity to review the referral pathways within the Trust. We will be seeking a downgrade of this serious incident as the investigation has shown that there was no harm to this patient.
Avoidable Hospital Acquired Pressure Ulcers
0
1
2
3
4
5G3 Avoidable Pressure Ulcers
We have reported one avoidable Grade three pressure ulcer in June 2017. The investigation is in progress and on track for completion within timescales. The total reported for 2017-2018 to date is one. We have not identified or reported any avoidable Grade four pressure ulcers in 2017-2018 to date.
We identified an avoidable Grade two pressure ulcer in June 2017. An RCA has been completed and appropriate actions identified and shared with the ward staff. The learning related to the regular reassessment of potential skin damage and the monitoring of any areas of concern. We have now had two avoidable grade two pressure ulcers in the year to date.
Quarterly Quality Governance Report Qtr One 2017-2018 Page 22 of 33
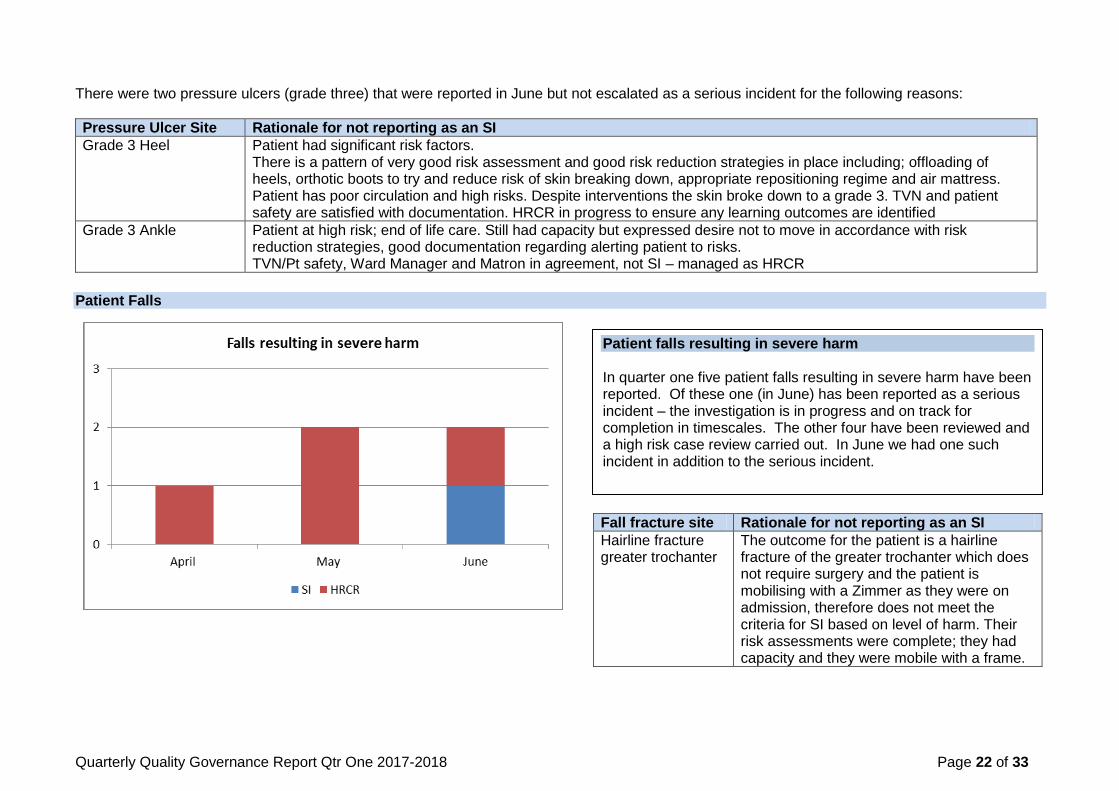
There were two pressure ulcers (grade three) that were reported in June but not escalated as a serious incident for the following reasons:
Pressure Ulcer Site Rationale for not reporting as an SI
Grade 3 Heel
Patient had significant risk factors. There is a pattern of very good risk assessment and good risk reduction strategies in place including; offloading of heels, orthotic boots to try and reduce risk of skin breaking down, appropriate repositioning regime and air mattress. Patient has poor circulation and high risks. Despite interventions the skin broke down to a grade 3. TVN and patient safety are satisfied with documentation. HRCR in progress to ensure any learning outcomes are identified
Grade 3 Ankle Patient at high risk; end of life care. Still had capacity but expressed desire not to move in accordance with risk reduction strategies, good documentation regarding alerting patient to risks. TVN/Pt safety, Ward Manager and Matron in agreement, not SI – managed as HRCR
Patient Falls
Fall fracture site Rationale for not reporting as an SI
Hairline fracture greater trochanter
The outcome for the patient is a hairline fracture of the greater trochanter which does not require surgery and the patient is mobilising with a Zimmer as they were on admission, therefore does not meet the criteria for SI based on level of harm. Their risk assessments were complete; they had capacity and they were mobile with a frame.
Patient falls resulting in severe harm In quarter one five patient falls resulting in severe harm have been reported. Of these one (in June) has been reported as a serious incident – the investigation is in progress and on track for completion in timescales. The other four have been reviewed and a high risk case review carried out. In June we had one such incident in addition to the serious incident.
Quarterly Quality Governance Report Qtr One 2017-2018 Page 23 of 33
0
20
40
60
80
100
120
140
160
April May June July Aug Sept Oct Nov Dec Jan Feb Mar
Falls per Month2017/18 2016/17
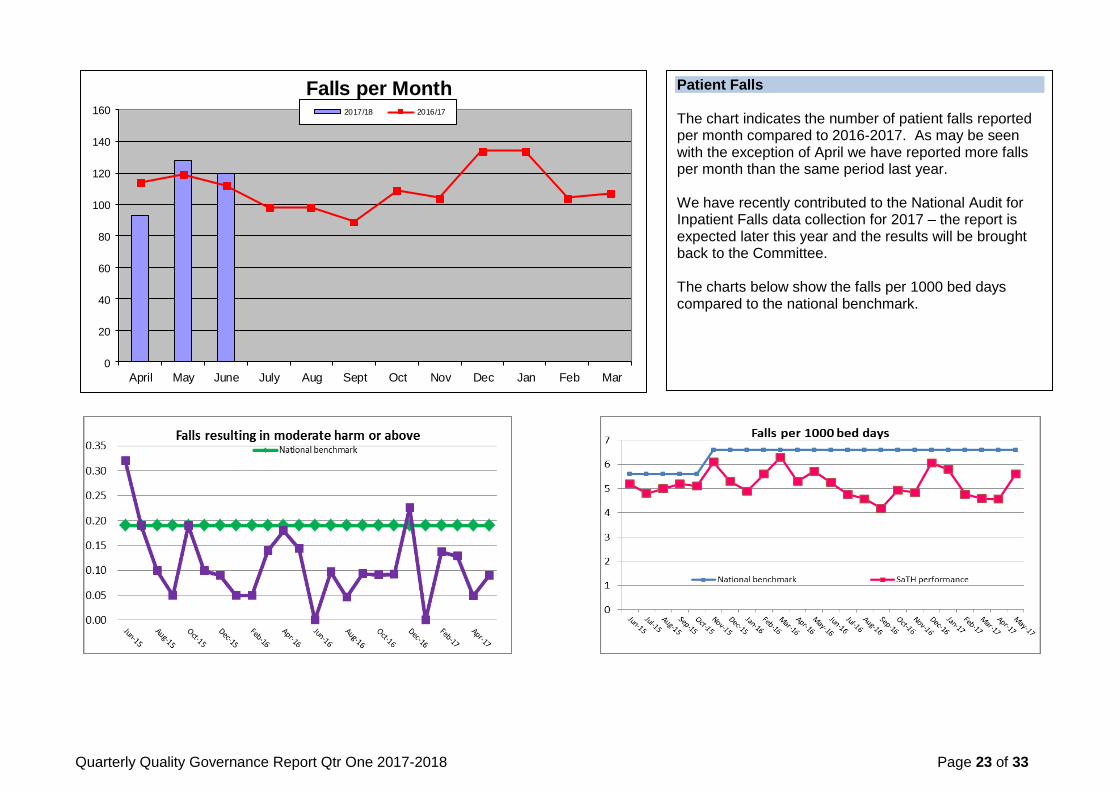
Patient Falls The chart indicates the number of patient falls reported per month compared to 2016-2017. As may be seen with the exception of April we have reported more falls per month than the same period last year. We have recently contributed to the National Audit for Inpatient Falls data collection for 2017 – the report is expected later this year and the results will be brought back to the Committee. The charts below show the falls per 1000 bed days compared to the national benchmark.
Quarterly Quality Governance Report Qtr One 2017-2018 Page 24 of 33
NHS Safety Thermometer
88
90
92
94
96
98
100
Jul-16 Aug-16 Sep-16 Oct-16 Nov-16 Dec-16 Jan-17 Feb-17 Mar-17 Apr-17 May-17 Jun-17
Harm Free Care (%) No New Harms (%) Target for HFC
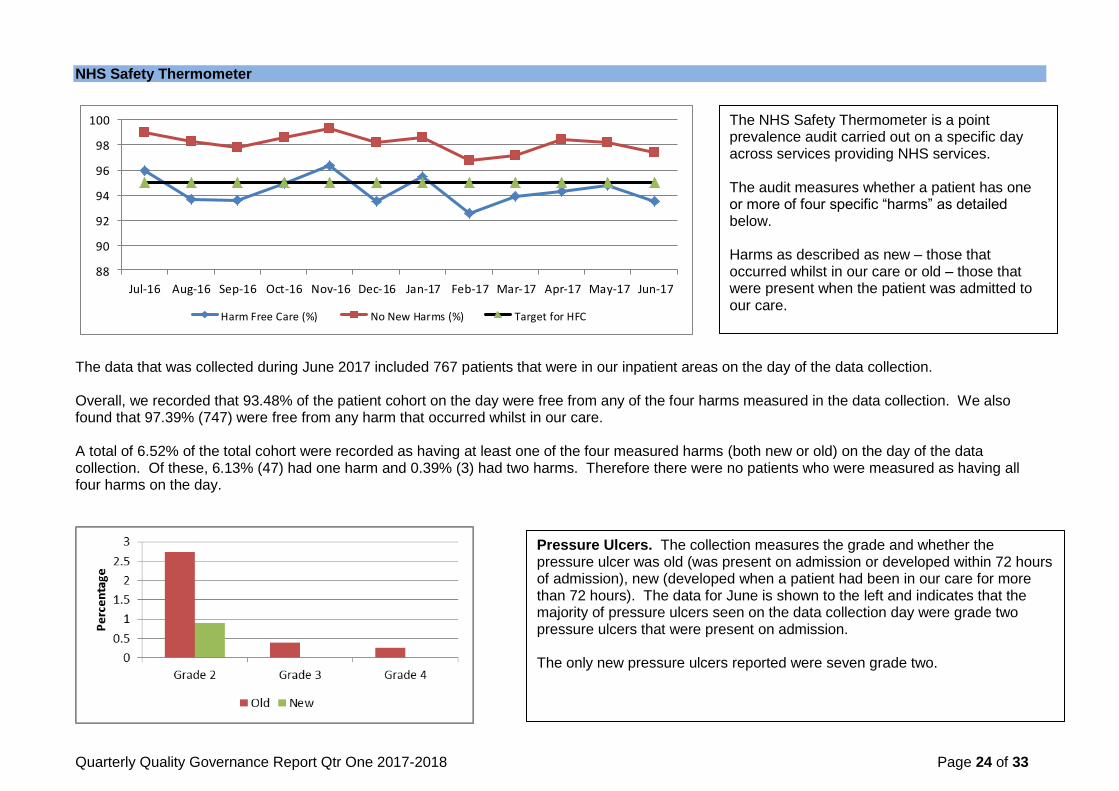
The data that was collected during June 2017 included 767 patients that were in our inpatient areas on the day of the data collection. Overall, we recorded that 93.48% of the patient cohort on the day were free from any of the four harms measured in the data collection. We also found that 97.39% (747) were free from any harm that occurred whilst in our care. A total of 6.52% of the total cohort were recorded as having at least one of the four measured harms (both new or old) on the day of the data collection. Of these, 6.13% (47) had one harm and 0.39% (3) had two harms. Therefore there were no patients who were measured as having all four harms on the day.
The NHS Safety Thermometer is a point prevalence audit carried out on a specific day across services providing NHS services. The audit measures whether a patient has one or more of four specific “harms” as detailed below. Harms as described as new – those that occurred whilst in our care or old – those that were present when the patient was admitted to our care.
Pressure Ulcers. The collection measures the grade and whether the pressure ulcer was old (was present on admission or developed within 72 hours of admission), new (developed when a patient had been in our care for more than 72 hours). The data for June is shown to the left and indicates that the majority of pressure ulcers seen on the data collection day were grade two pressure ulcers that were present on admission. The only new pressure ulcers reported were seven grade two.

Quarterly Quality Governance Report Qtr One 2017-2018 Page 25 of 33
Venous Thromboembolism (VTE)
Catheters and Urinary Tract Infections (UTI)
All Present for less than 28 days
Present for more than 28 days
Catheters 16.95 12.91 4.04
Old New
UTI 4.56 2.87 1.69
Catheter and UTI 1.04 0.65 0.39
Patient Falls In June we recorded an increase in the total number of patient falls recorded on the data collection day. For the purposes of this audit, a fall is recorded if it occurred within 72 hours of the data collection day. A total of 20 patient falls were recorded affecting 2.61% of the total cohort. Of these the majority (19) were reported as resulting in no harm to the patient and one resulted in low harm (defined as the patient required first aid, minor treatment, extra observation or medication).
Catheters and UTI A total of 130 patients were recorded as having a urinary catheter in situ on the data collection day, 99 of which had been in situ for less than 28 days. Of these, three patients were recorded as having a new UTI as well as a catheter.
The data collection records the percentage of patients that have been assessed for risk of VTE (87.48%), the number on prophylaxis (72.88%) and the number that have old and new VTE of some description. In June we recorded an increase in the number of VTE (78 patients) the majority of which (67) were old. Eleven patients were recorded as developing VTE whilst in our care.
Quarterly Quality Governance Report Qtr One 2017-2018 Page 26 of 33
Safeguarding Safeguarding Vulnerable Adults
Types of Harm
April May June
Psychological Harm 1
1
Neglect/Omission of Care 3 7 6
Financial 2 Self Neglect 1 1
Physical Harm 1
1
Domestic Abuse
3 1
Total 8 11 9
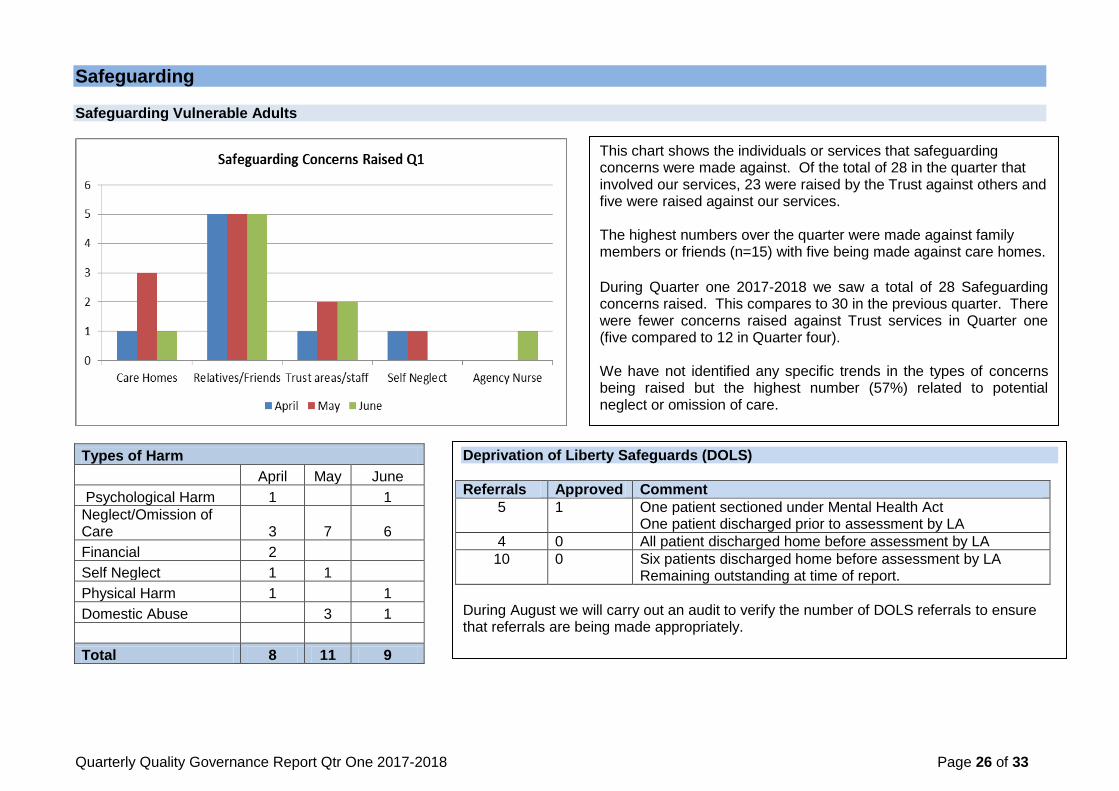
This chart shows the individuals or services that safeguarding concerns were made against. Of the total of 28 in the quarter that involved our services, 23 were raised by the Trust against others and five were raised against our services. The highest numbers over the quarter were made against family members or friends (n=15) with five being made against care homes.
During Quarter one 2017-2018 we saw a total of 28 Safeguarding concerns raised. This compares to 30 in the previous quarter. There were fewer concerns raised against Trust services in Quarter one (five compared to 12 in Quarter four). We have not identified any specific trends in the types of concerns being raised but the highest number (57%) related to potential neglect or omission of care.
Deprivation of Liberty Safeguards (DOLS)
Referrals Approved Comment
5 1 One patient sectioned under Mental Health Act One patient discharged prior to assessment by LA
4 0 All patient discharged home before assessment by LA
10 0 Six patients discharged home before assessment by LA Remaining outstanding at time of report.
During August we will carry out an audit to verify the number of DOLS referrals to ensure that referrals are being made appropriately.
Quarterly Quality Governance Report Qtr One 2017-2018 Page 27 of 33
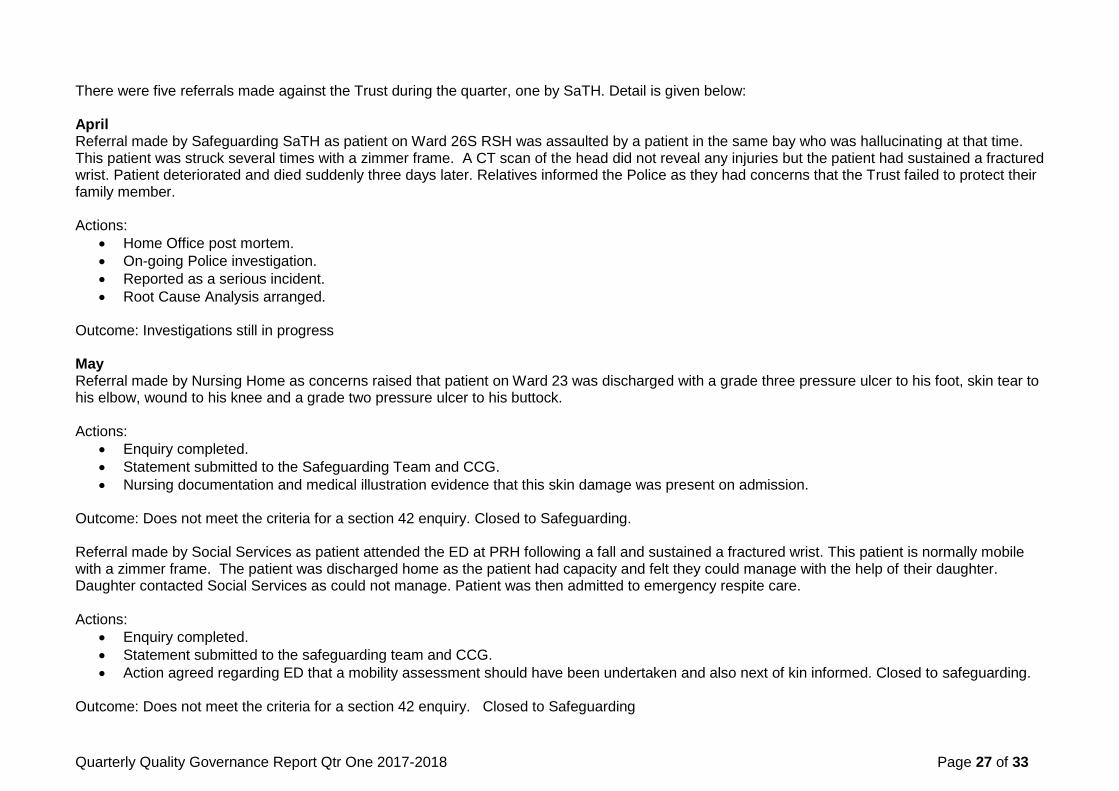
There were five referrals made against the Trust during the quarter, one by SaTH. Detail is given below: April Referral made by Safeguarding SaTH as patient on Ward 26S RSH was assaulted by a patient in the same bay who was hallucinating at that time. This patient was struck several times with a zimmer frame. A CT scan of the head did not reveal any injuries but the patient had sustained a fractured wrist. Patient deteriorated and died suddenly three days later. Relatives informed the Police as they had concerns that the Trust failed to protect their family member. Actions:
Home Office post mortem.
On-going Police investigation.
Reported as a serious incident.
Root Cause Analysis arranged. Outcome: Investigations still in progress May Referral made by Nursing Home as concerns raised that patient on Ward 23 was discharged with a grade three pressure ulcer to his foot, skin tear to his elbow, wound to his knee and a grade two pressure ulcer to his buttock. Actions:
Enquiry completed.
Statement submitted to the Safeguarding Team and CCG.
Nursing documentation and medical illustration evidence that this skin damage was present on admission. Outcome: Does not meet the criteria for a section 42 enquiry. Closed to Safeguarding. Referral made by Social Services as patient attended the ED at PRH following a fall and sustained a fractured wrist. This patient is normally mobile with a zimmer frame. The patient was discharged home as the patient had capacity and felt they could manage with the help of their daughter. Daughter contacted Social Services as could not manage. Patient was then admitted to emergency respite care. Actions:
Enquiry completed.
Statement submitted to the safeguarding team and CCG.
Action agreed regarding ED that a mobility assessment should have been undertaken and also next of kin informed. Closed to safeguarding. Outcome: Does not meet the criteria for a section 42 enquiry. Closed to Safeguarding

Quarterly Quality Governance Report Qtr One 2017-2018 Page 28 of 33
June Referral made by Residential Home as patient was discharged from Ward 10 without requesting District Nurses to resume administration of her insulin. Actions:
Enquiry completed.
Statement submitted to the safeguarding team and CCG.
The Ward Manager has shared this concern with the nursing staff. She has reinforced to her staff that Residential Homes do not have registered nurses and would require District Nurse input.
Outcome: Does not meet the criteria for a section 42 enquiry. Closed to Safeguarding. Referral made by care agency as patient has raised concerns regarding care and a member of staff‟s attitude on Ward 32. Care agency also raised concerns that patient was not discharged at the time requested by the care agency; they have also raised concerns that the patient was not medically fit to be discharged. The care agency has also stated that patient was not provided with food and drink whilst in hospital and refused a commode. The care agency has now submitted a formal complaint with the above concerns. Actions:
Closed to safeguarding as now being investigated through the formal complaints process. Outcome: Does not meet the criteria for a section 42 enquiry. Safeguarding Children During Quarter One 2017-2018 there were eight Safeguarding Children alerts involving the Trust. All were raised by Trust staff and none were made against the Trust services. There are currently no Serious Case Reviews (SCR) in progress although there are two cases that are being considered for review by the local authority in Telford and Wrekin. The CQC carried out a joint inspection of Looked After Children (LAC) services across Telford and Wrekin following which a joint action plan was written. The Trust has some specific actions which are in progress and will be reviewed by the CCG in July.
Quarterly Quality Governance Report Qtr One 2017-2018 Page 29 of 33
Prevent Prevent is part of the Government counter-terrorism strategy CONTEST and aims to reduce the threat to the UK from terrorism by stopping people becoming terrorists or supporting terrorism. Prevent focuses on all forms of terrorism and operates in a „pre-criminal‟ space‟. The Prevent strategy is focused on providing support and re-direction to individuals at risk of, or in the process of being groomed /radicalised into terrorist activity before any crime is committed. Radicalisation is comparable to other forms of exploitation; it is a safeguarding issue that staff working in the health sector must be aware of. The Prevent Duty 2015 requires all specified authorities including NHS Trusts and Foundation Trusts to ensure that there are mechanisms in place for understanding the risk of radicalisation. Furthermore, they must ensure that health staff understand the risk of radicalisation and how to seek appropriate advice and support. Healthcare staff will meet, and treat people who may be vulnerable to being drawn into terrorism. The health sector needs to ensure that healthcare workers are able to identify early signs of an individual being drawn into radicalisation. Staff must be able to recognise key signs of radicalisation and be confident in referring individuals to their organisational safeguarding lead or the police thus enabling them to receive the support and intervention they require. The Home Office have, this month, updated their training guidance for Prevent: There are two levels of training:
o Basic Awareness Training – we provide this to all staff on Corporate Induction and then through Safeguarding Updates. o Workshop to Raise Awareness of Prevent (WRAP) – required by specific staff and provided through face to face training by facilitators who
have been provided with a Home Office reference number (currently four in the Trust). We are in the process of identifying all staff in the specific group for WRAP training but have put into place sessions to raise awareness across the Trust of the signs that someone may be at risk of radicalisation. NHS England require that 85% of relevant staff have received WRAP training by March 2018 against which requirement we are developing our recovery plan. Safeguarding Training We are not compliant with training requirements in Qtr one 2017-2018 relating to Level two safeguarding training for both adults and children. Recovery plans are in place including additional training sessions for staff and the provision of e learning for level two Children‟s safeguarding. At present Children‟s Level Two Safeguarding is 41% against and 85% target (data cleansing is in progress) and Adults Level Two is 57% against an 85% target.
Quarterly Quality Governance Report Qtr One 2017-2018 Page 30 of 33
Infection Prevention and Control
0
1
2
3
4
5
Apr May June Jul Aug Sep Oct Nov Dec Jan Feb Mar
C diff reported/month
Reported Target/mth
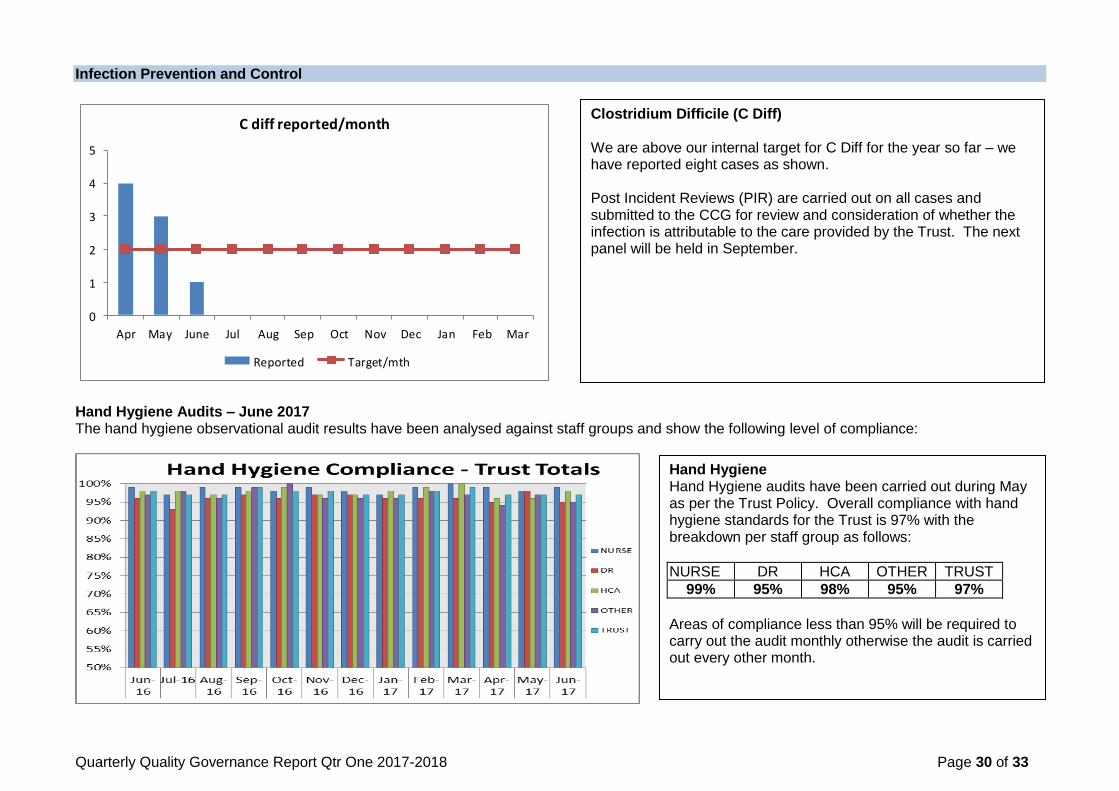
Hand Hygiene Audits – June 2017 The hand hygiene observational audit results have been analysed against staff groups and show the following level of compliance:
Clostridium Difficile (C Diff) We are above our internal target for C Diff for the year so far – we have reported eight cases as shown. Post Incident Reviews (PIR) are carried out on all cases and submitted to the CCG for review and consideration of whether the infection is attributable to the care provided by the Trust. The next panel will be held in September.
Hand Hygiene Hand Hygiene audits have been carried out during May as per the Trust Policy. Overall compliance with hand hygiene standards for the Trust is 97% with the breakdown per staff group as follows:
NURSE DR HCA OTHER TRUST
99% 95% 98% 95% 97%
Areas of compliance less than 95% will be required to carry out the audit monthly otherwise the audit is carried out every other month.
Quarterly Quality Governance Report Qtr One 2017-2018 Page 31 of 33
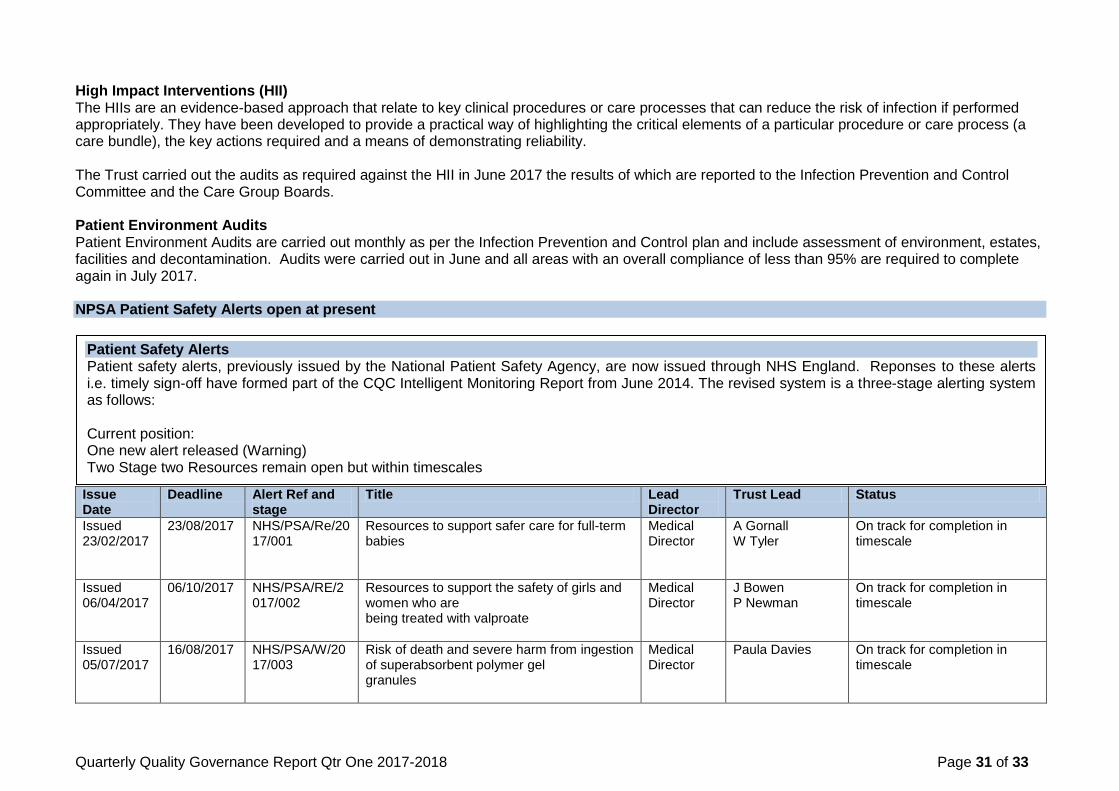
High Impact Interventions (HII) The HIIs are an evidence-based approach that relate to key clinical procedures or care processes that can reduce the risk of infection if performed appropriately. They have been developed to provide a practical way of highlighting the critical elements of a particular procedure or care process (a care bundle), the key actions required and a means of demonstrating reliability. The Trust carried out the audits as required against the HII in June 2017 the results of which are reported to the Infection Prevention and Control Committee and the Care Group Boards. Patient Environment Audits Patient Environment Audits are carried out monthly as per the Infection Prevention and Control plan and include assessment of environment, estates, facilities and decontamination. Audits were carried out in June and all areas with an overall compliance of less than 95% are required to complete again in July 2017. NPSA Patient Safety Alerts open at present Issue Date
Deadline Alert Ref and stage
Title Lead Director
Trust Lead Status
Issued 23/02/2017
23/08/2017
NHS/PSA/Re/2017/001
Resources to support safer care for full-term babies
Medical Director
A Gornall W Tyler
On track for completion in timescale
Issued 06/04/2017
06/10/2017
NHS/PSA/RE/2017/002
Resources to support the safety of girls and women who are being treated with valproate
Medical Director
J Bowen P Newman
On track for completion in timescale
Issued 05/07/2017
16/08/2017 NHS/PSA/W/2017/003
Risk of death and severe harm from ingestion of superabsorbent polymer gel granules
Medical Director
Paula Davies On track for completion in timescale
Patient Safety Alerts Patient safety alerts, previously issued by the National Patient Safety Agency, are now issued through NHS England. Reponses to these alerts i.e. timely sign-off have formed part of the CQC Intelligent Monitoring Report from June 2014. The revised system is a three-stage alerting system as follows: Current position: One new alert released (Warning) Two Stage two Resources remain open but within timescales
Quarterly Quality Governance Report Qtr One 2017-2018 Page 32 of 33
Performance against Clinical Audit Forward Plan 2017/18
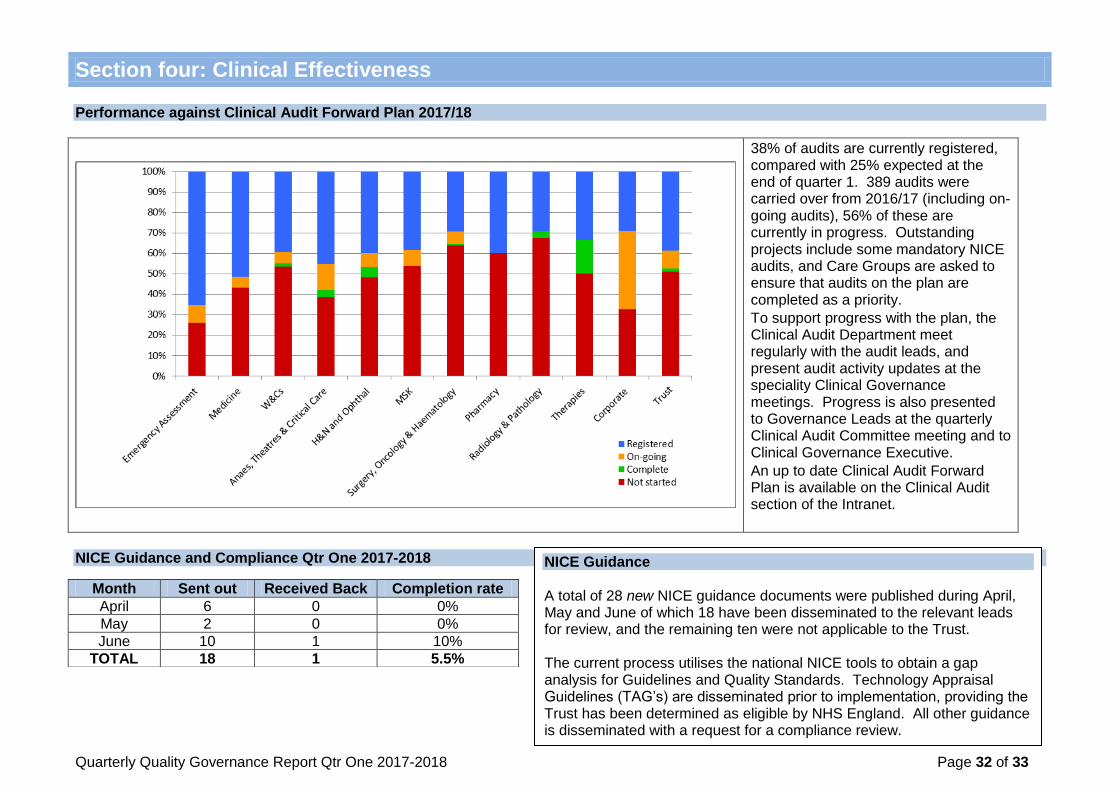
38% of audits are currently registered, compared with 25% expected at the end of quarter 1. 389 audits were carried over from 2016/17 (including on-going audits), 56% of these are currently in progress. Outstanding projects include some mandatory NICE audits, and Care Groups are asked to ensure that audits on the plan are completed as a priority.
To support progress with the plan, the Clinical Audit Department meet regularly with the audit leads, and present audit activity updates at the speciality Clinical Governance meetings. Progress is also presented to Governance Leads at the quarterly Clinical Audit Committee meeting and to Clinical Governance Executive.
An up to date Clinical Audit Forward Plan is available on the Clinical Audit section of the Intranet.
NICE Guidance and Compliance Qtr One 2017-2018
Section four: Clinical Effectiveness
Month Sent out Received Back Completion rate
April 6 0 0%
May 2 0 0%
June 10 1 10%
TOTAL 18 1 5.5%
NICE Guidance A total of 28 new NICE guidance documents were published during April, May and June of which 18 have been disseminated to the relevant leads for review, and the remaining ten were not applicable to the Trust. The current process utilises the national NICE tools to obtain a gap analysis for Guidelines and Quality Standards. Technology Appraisal Guidelines (TAG‟s) are disseminated prior to implementation, providing the Trust has been determined as eligible by NHS England. All other guidance is disseminated with a request for a compliance review.
Quarterly Quality Governance Report Qtr One 2017-2018 Page 33 of 33
The Quality and Safety Committee is asked to:
Discuss the current performance in relation to key quality indicators as at the end of June 2017
Consider the actions being taken where performance requires improvement
Question the report to ensure appropriate assurance is in place
Section five: Recommendations for the Committee

SUSTAINABILITY COMMITTEE – 25th JULY 2017
FINANCE REPORT – MONTH 03
1. Income & Expenditure position
The financial position of the Trust at the end of month 3 is presented in the table below:
At the end of month 3 the Trust had planned to deliver an in year deficit before phased spend and STF of £3.885 million and actually recorded a deficit of £4.797 million, £0.912 million worse than plan.
2. Forecast Outturn Given the overspend that exists to date, the expected position at the end of the 2017/18 financial year is a £13.528 million deficit, assuming the current trends continue and no corrective action is taken. This takes us to £7.465 million above the agreed control total with NHSI.
Paper 8
1
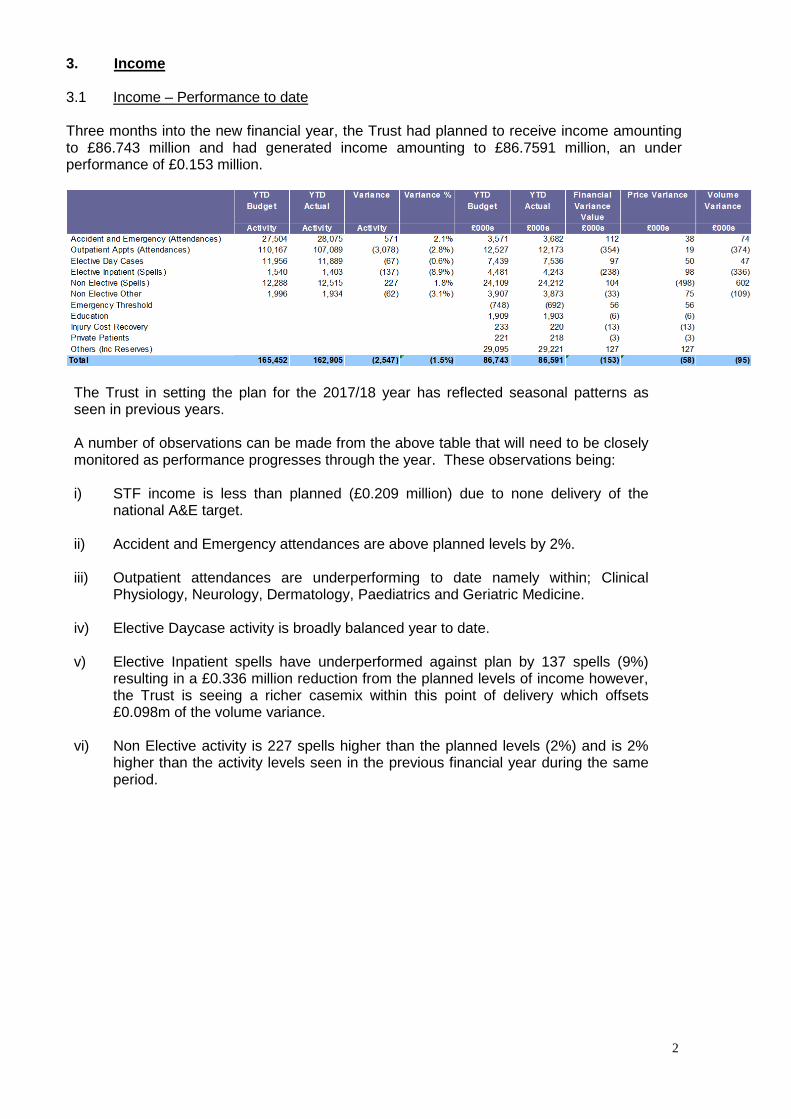
3. Income 3.1 Income – Performance to date Three months into the new financial year, the Trust had planned to receive income amounting to £86.743 million and had generated income amounting to £86.7591 million, an under performance of £0.153 million.
The Trust in setting the plan for the 2017/18 year has reflected seasonal patterns as seen in previous years. A number of observations can be made from the above table that will need to be closely monitored as performance progresses through the year. These observations being: i) STF income is less than planned (£0.209 million) due to none delivery of the
national A&E target.
ii) Accident and Emergency attendances are above planned levels by 2%.
iii) Outpatient attendances are underperforming to date namely within; Clinical Physiology, Neurology, Dermatology, Paediatrics and Geriatric Medicine.
iv) Elective Daycase activity is broadly balanced year to date.
v) Elective Inpatient spells have underperformed against plan by 137 spells (9%)
resulting in a £0.336 million reduction from the planned levels of income however, the Trust is seeing a richer casemix within this point of delivery which offsets £0.098m of the volume variance.
vi) Non Elective activity is 227 spells higher than the planned levels (2%) and is 2%
higher than the activity levels seen in the previous financial year during the same period.
2

PlanApr May Jun Average
Per Month Apr-Jun
Jul Aug Sep Average Per Month
Jul-Sep
Oct Nov Dec Average Per Month
Oct-Dec
Jan Feb Mar Average Jan-Mar
Annual
A&E 8,867 9,676 9,532 9,358 9,682 9,104 9,190 9,325 9,427 8,840 8,852 9,039 8,764 8,316 9,551 8,877 109,229Outpatient Attendances 31,303 37,858 37,928 35,696 35,718 36,418 37,725 36,620 39,574 40,721 30,831 37,042 40,339 35,807 36,935 37,694 444,234Elective Daycases 3,761 4,161 3,967 3,963 4,048 3,868 3,885 3,934 4,160 4,018 3,406 3,861 3,934 3,838 4,184 3,985 46,957Elective Inpatient Spells 397 484 522 468 533 512 490 512 560 561 464 528 454 468 476 466 6,059Emergency Spells 4,013 4,267 4,235 4,172 4,062 4,038 4,254 4,118 4,138 4,219 4,436 4,264 4,346 4,107 4,534 4,329 50,423Maternity/Non Elective Other Spells 612 649 673 645 716 662 676 685 745 697 638 694 634 633 693 653 8,090
9lective 5ay /ase
Apr May Jun Average Per Month
Apr-Jun
Jul Aug Sep Average Per Month
Jul-Sep
Oct Nov Dec Average Per Month
Oct-Dec
Jan Feb Mar Average Jan-Mar
Annual
17/18 Plan 3,392 4,079 4,146 3,872 4,048 3,868 3,885 3,934 4,160 4,018 3,406 3,861 3,934 3,838 4,184 3,985 46,957Actual 3,761 4,161 3,967 3,963 0 0 0 11,889
Variance 369 82 (179) 91 (3,934) (3,861) (3,985)16/17 3,814 3,577 3,874 3,755 3,811 3,919 3,895 3,875 3,751 3,895 3,576 3,741 3,742 3,695 4,436 3,987 45,98515/16 3,479 3,354 3,584 3,472 3,869 3,336 3,625 3,610 3,658 3,618 3,585 3,620 3,512 3,513 3,658 3,561 42,791
14/15 3,391 3,370 3,488 3,416 3,640 3,337 3,526 3,501 3,498 3,311 3,146 3,318 3,137 3,051 3,732 3,307 40,627
9lective Inpatient
Apr May Jun Average Per Month
Apr-Jun
Jul Aug Sep Average Per Month
Jul-Sep
Oct Nov Dec Average Per Month
Oct-Dec
Jan Feb Mar Average Jan-Mar
Annual
17/18 Plan 446 549 545 513 533 512 490 512 560 561 464 528 454 468 476 466 6,059Actual 397 484 522 468 0 0 0 1,403
Variance (49) (65) (23) (46) (512) (528) (466)16/17 490 493 558 3,755 525 484 505 3,875 498 551 489 3,741 390 424 556 3,987 5,96315/16 551 528 564 548 605 571 536 571 601 526 509 545 524 481 497 501 6,493
14/15 581 616 590 596 646 575 571 597 609 603 502 571 465 515 531 504 6,804
bon 9lective
Apr May Jun Average Per Month
Apr-Jun
Jul Aug Sep Average Per Month
Jul-Sep
Oct Nov Dec Average Per Month
Oct-Dec
Jan Feb Mar Average Jan-Mar
Annual
17/18 Plan 4,094 4,036 4,158 4,096 4,062 4,038 4,254 4,118 4,138 4,219 4,436 4,264 4,346 4,107 4,534 4,329 50,423Actual 4,013 4,267 4,235 4,172 0 0 0 12,515
Variance (81) 231 77 76 (4,118) (4,264) (4,329)16/17 3,993 4,125 4,158 3,755 4,159 3,974 4,099 3,875 4,057 4,207 4,310 3,741 4,149 3,860 4,528 3,987 49,61915/16 3,931 3,998 3,957 3,962 4,091 3,751 3,980 3,941 4,300 4,302 4,368 4,323 4,182 4,081 4,288 4,184 49,229
14/15 3,947 4,091 3,879 3,972 4,093 3,545 3,792 3,810 4,024 3,871 4,202 4,032 3,891 3,656 4,160 3,902 47,151
aaternity/bon 9lective hther
Apr May Jun Average Per Month
Apr-Jun
Jul Aug Sep Average Per Month
Jul-Sep
Oct Nov Dec Average Per Month
Oct-Dec
Jan Feb Mar Average Jan-Mar
Annual
17/18 Plan 621 711 665 665 716 662 676 685 745 697 638 694 634 633 693 653 8,090Actual 612 649 673 645 0 0 0 1,934
Variance (9) (62) 8 (21) (685) (694) (653)16/17 606 697 631 3,755 666 646 677 3,875 712 689 648 3,741 669 647 675 3,987 7,96315/16 631 629 597 619 663 625 657 648 714 632 608 651 650 659 633 647 7,698
14/15 593 601 601 598 613 605 671 630 624 561 604 596 570 493 607 557 7,143
hutpatients
Apr May Jun Average Per Month
Apr-Jun
Jul Aug Sep Average Per Month
Jul-Sep
Oct Nov Dec Average Per Month
Oct-Dec
Jan Feb Mar Average Jan-Mar
Annual
17/18 Plan 31,702 39,279 39,186 36,722 35,718 36,418 37,725 36,620 39,574 40,721 30,831 37,042 40,339 35,807 36,935 37,694 444,234Actual 31,303 37,858 37,928 35,696 0 0 0 107,089
Variance (399) (1,421) (1,258) (1,026) (36,620) (37,042) (37,694)16/17 35,444 35,987 37,404 3,755 34,449 37,056 38,043 3,875 36,417 39,050 31,059 3,741 37,037 34,626 39,227 3,987 435,79915/16 33,528 31,339 37,702 34,190 35,376 31,977 36,501 34,618 35,680 36,293 32,299 34,757 33,557 33,831 34,304 33,897 412,387
14/15 32,708 32,634 35,016 33,453 36,839 30,320 35,548 34,236 35,814 33,549 30,576 33,313 32,859 30,892 35,051 32,934 401,806
A&9
Apr May Jun Average Per Month
Apr-Jun
Jul Aug Sep Average Per Month
Jul-Sep
Oct Nov Dec Average Per Month
Oct-Dec
Jan Feb Mar Average Jan-Mar
Annual
17/18 Plan 8,665 9,553 9,286 9,168 9,682 9,104 9,190 9,325 9,427 8,840 8,852 9,039 8,764 8,316 9,551 8,877 109,229Actual 8,867 9,676 9,532 9,358 0 0 0 28,075
Variance 202 123 246 190 (9,325) (9,039) (8,877)16/17 8,703 9,523 9,143 3,755 9,729 9,058 9,025 3,875 9,352 8,724 8,616 3,741 8,357 7,995 9,282 3,987 107,50715/16 9,410 9,268 9,339 9,339 9,253 9,094 8,731 9,026 8,892 8,616 8,397 8,635 8,828 8,652 9,466 8,982 107,946
14/15 9,246 9,642 9,779 9,556 9,983 9,069 9,217 9,423 9,157 8,714 8,822 8,898 8,277 7,856 9,598 8,577 109,360
Actual
4. Expenditure 4.1 Pay To date the pay spend amounted to £59.710 million against a plan of £60.706 million resulting in an overspend of £0.996 million. This is made up of the following:
3
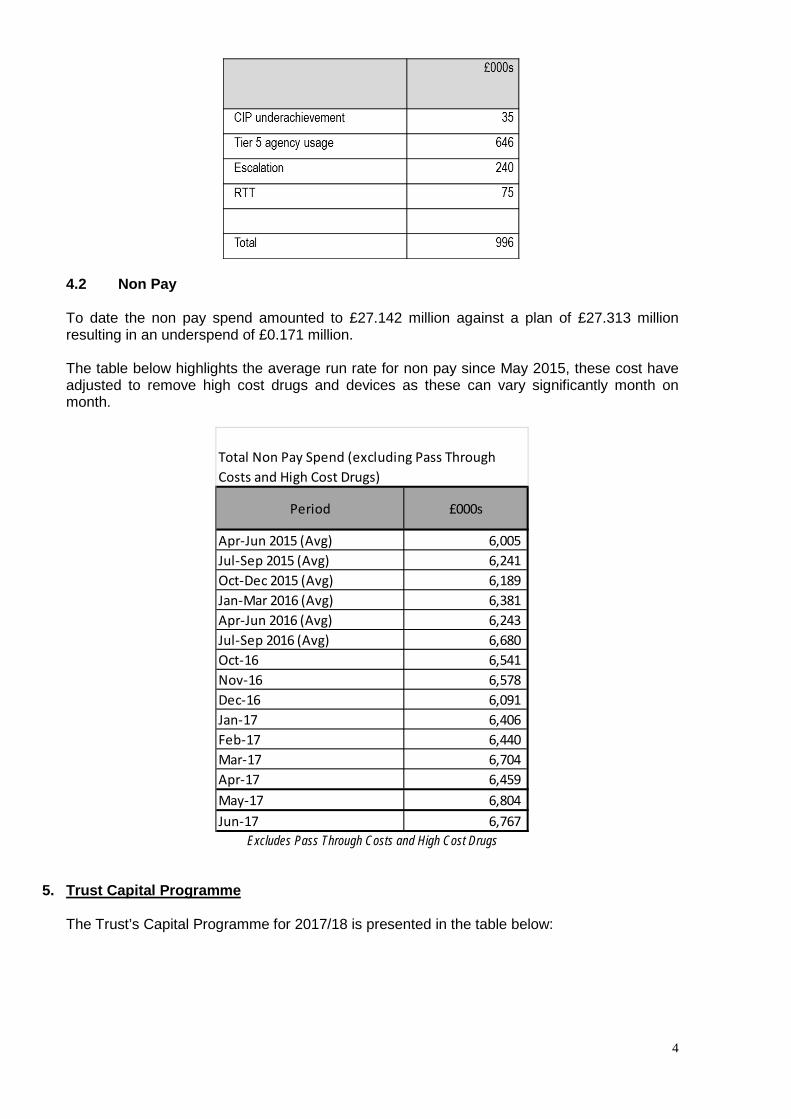
4.2 Non Pay To date the non pay spend amounted to £27.142 million against a plan of £27.313 million resulting in an underspend of £0.171 million. The table below highlights the average run rate for non pay since May 2015, these cost have adjusted to remove high cost drugs and devices as these can vary significantly month on month.
Period £000s
Apr-Jun 2015 (Avg) 6,005 Jul-Sep 2015 (Avg) 6,241 Oct-Dec 2015 (Avg) 6,189 Jan-Mar 2016 (Avg) 6,381 Apr-Jun 2016 (Avg) 6,243 Jul-Sep 2016 (Avg) 6,680 Oct-16 6,541 Nov-16 6,578 Dec-16 6,091 Jan-17 6,406 Feb-17 6,440 Mar-17 6,704 Apr-17 6,459 May-17 6,804 Jun-17 6,767
Total Non Pay Spend (excluding Pass Through Costs and High Cost Drugs)
Excludes Pass Through Costs and High Cost Drugs
5. Trust Capital Programme The Trust’s Capital Programme for 2017/18 is presented in the table below:
4

The Shrewsbury and Telford Hospital bHS Trust
2017/18 /apital Programme Update as at aonth 03 (June 2017)
Scheme2017/18 /apital
Budget2017/18 Spend to
date
9xpenditure committed -
ordered
Total expenditure/ committed to
date
9xpenditure committed - to be
ordered Scheme yet to be identified
Forecast hutturn
Variance under/ (over) spend
£000’s £000’s £000’s £000’s £000’s £000’s £000’s £000’s
hutstanding /ommitments from 2016/17 200 -10 81 71 118 11 200 0
Pre-/ommitted Schemes
MRI Scanners x 3 Enabling Works not completed 16.17 1,501 2 897 898 603 0 1,501 0
Ophthalmology move into Copthorne Building - not completed 16.17 373 489 172 660 0 0 660 -287
Ophthalmology move into Copthorne Building - (F&E agreed by CPG) 65 5 57 62 3 0 65 0
Medicines Stock Management (agreed at Sustainability Cttee Feb 17) 305 0 0 0 305 0 305 0
Additional Car Parking Spaces (agreed at Feb CPG) 50 0 0 0 50 0 50 0
E-Rostering Software Implementation - I-pads 50 0 0 0 50 0 50 0
In House costs of delivery of schemes 820 161 490 651 169 0 820 0
Replacement Linac (condition of Lingen Davies Grant) 366 0 0 0 366 0 366 0
RSH MLU/PAU - P2 FCHS 100 0 0 0 100 0 100 0
PRH IT Computer Room Infrastructure 450 0 0 0 450 0 450 0
Contingency Fund - Estates 130 0 99 99 0 32 130 0
Contingency Fund - Medical Equipment 130 0 0 0 0 130 130 0
Contingency Fund - IT Equipment 130 8 0 8 0 122 130 0
Contingency Fund - Non-Patient Connected Equipment Replacement 35 0 0 0 0 35 35 0
Contingency Fund - VitalPac/PSAG 25 0 0 0 0 25 25 0
Contingency Fund - Support Services Care Group Equipment 100 0 0 0 0 100 100 0
Contingency Fund - Facilities Equipment 25 0 0 0 0 25 25 0
Contingency Fund - Patient Environment (inc Furniture) 25 0 0 0 0 25 25 0
Total 5elegated /ontingency Funds 600 8 99 106 0 494 600 0
Capitalisation of Expenditure 1,200 291 843 1,134 66 0 1,200 0
Corporate Contingency (In Year Allocations) 1,000 0 0 0 0 1,000 1,000 0
9states Risks Rated Priority 1
Ward Block calorifers 150 0 20 20 130 0 150 0
Continuation of fire safety strategy 400 3 5 8 392 0 400 0
Subway duct - Phase 2 730 0 0 0 730 0 730 0
RSH ward block lifts 190 0 0 0 190 0 190 0
Total /apital Schemes 8,550 948 2,664 3,611 3,722 1,505 8,837 -287
Overcommitted/Unallocated -100 0 0 0 0 -100 -100 0
Total 8,450 948 2,664 3,611 3,722 1,405 8,737 -287 The Capital Resource Limit (CRL) for 2017/18 has been set at the historic amount of £8.450 million in respect of Internally Generated CRL. At Month 03, £0.948 million of the Capital Programme has been expensed, with £2.664million committed but not yet expensed. A further £3.722 million has been allocated to schemes but not yet ordered. £1.405 million has yet to be committed to individual schemes (mainly held in Contingency Funds) - however there is an overcommitment relating to Ophthalmology Services into Copthorne Building (Phase1) of £0.287 million which reduces the uncommitted allocation to £1.116 million.
6. Trust cash position In order to manage the Trust’s cash resources, consideration needs to be given to the anticipated forecast outturn position and the impact of the forecast outturn position with regard to the receipt of Sustainability and Transformation Funding (STF). The Trust’s cash position for 2017/18 is based on the Trust’s projected deficit £13.528 million. It assumes the Trust will receive STF support. The timing of receipt of STF funding is not yet known. The Trust has the ability to drawdown loan in lieu of this funding until the income is received and therefore the below table assumes receipt of STF income or loan ‘in lieu’ of this funding. In line with the Trust’s Standing Financial Instructions, under which the Finance Director has delegated authority for loans and overdrafts and in line with the Resolution passed at March’s Trust Board, the Trust accessed £2.329 million Uncommitted Single Currency Interim Revenue Support in June in lieu of receipt of STF funding. This will be repaid on receipt of STF income.
5

The cashflow assumes access to loan to support I&E deficit to the value of the agreed control total and drawdown in line with the original plan. As can be seen the Trust will begin to experience severe cashflow problems from August onwards. The Trust is already challenged in meeting agreed payment terms and unless expenditure is tightly controlled, the level of creditor suppression will have to increase to cover the cash shortfall caused by increased deficit.
6
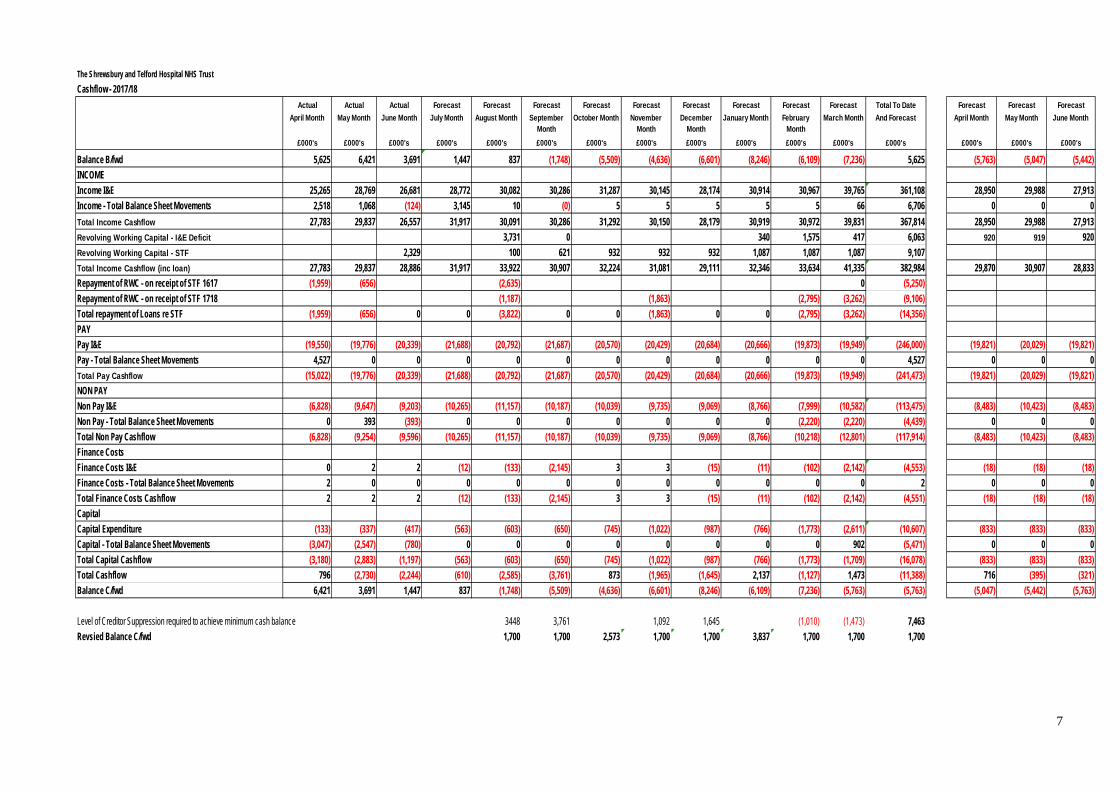
The Shrewsbury and Telford Hospital NHS TrustCashflow - 2017/18
Actual Actual Actual Forecast Forecast Forecast Forecast Forecast Forecast Forecast Forecast Forecast Total To Date Forecast Forecast ForecastApril Month May Month June Month July Month August Month September
MonthOctober Month November
MonthDecember
MonthJanuary Month February
MonthMarch Month And Forecast April Month May Month June Month
£000's £000's £000's £000's £000's £000's £000's £000's £000's £000's £000's £000's £000's £000's £000's £000's
Balance B/fwd 5,625 6,421 3,691 1,447 837 (1,748) (5,509) (4,636) (6,601) (8,246) (6,109) (7,236) 5,625 (5,763) (5,047) (5,442)INCOMEIncome I&E 25,265 28,769 26,681 28,772 30,082 30,286 31,287 30,145 28,174 30,914 30,967 39,765 361,108 28,950 29,988 27,913Income - Total Balance Sheet Movements 2,518 1,068 (124) 3,145 10 (0) 5 5 5 5 5 66 6,706 0 0 0Total Income Cashflow 27,783 29,837 26,557 31,917 30,091 30,286 31,292 30,150 28,179 30,919 30,972 39,831 367,814 28,950 29,988 27,913Revolving Working Capital - I&E Deficit 3,731 0 340 1,575 417 6,063 920 919 920Revolving Working Capital - STF 2,329 100 621 932 932 932 1,087 1,087 1,087 9,107Total Income Cashflow (inc loan) 27,783 29,837 28,886 31,917 33,922 30,907 32,224 31,081 29,111 32,346 33,634 41,335 382,984 29,870 30,907 28,833Repayment of RWC - on receipt of STF 1617 (1,959) (656) (2,635) 0 (5,250)Repayment of RWC - on receipt of STF 1718 (1,187) (1,863) (2,795) (3,262) (9,106)Total repayment of Loans re STF (1,959) (656) 0 0 (3,822) 0 0 (1,863) 0 0 (2,795) (3,262) (14,356)PAYPay I&E (19,550) (19,776) (20,339) (21,688) (20,792) (21,687) (20,570) (20,429) (20,684) (20,666) (19,873) (19,949) (246,000) (19,821) (20,029) (19,821)Pay - Total Balance Sheet Movements 4,527 0 0 0 0 0 0 0 0 0 0 0 4,527 0 0 0Total Pay Cashflow (15,022) (19,776) (20,339) (21,688) (20,792) (21,687) (20,570) (20,429) (20,684) (20,666) (19,873) (19,949) (241,473) (19,821) (20,029) (19,821)NON PAYNon Pay I&E (6,828) (9,647) (9,203) (10,265) (11,157) (10,187) (10,039) (9,735) (9,069) (8,766) (7,999) (10,582) (113,475) (8,483) (10,423) (8,483)Non Pay - Total Balance Sheet Movements 0 393 (393) 0 0 0 0 0 0 0 (2,220) (2,220) (4,439) 0 0 0Total Non Pay Cashflow (6,828) (9,254) (9,596) (10,265) (11,157) (10,187) (10,039) (9,735) (9,069) (8,766) (10,218) (12,801) (117,914) (8,483) (10,423) (8,483)Finance CostsFinance Costs I&E 0 2 2 (12) (133) (2,145) 3 3 (15) (11) (102) (2,142) (4,553) (18) (18) (18)Finance Costs - Total Balance Sheet Movements 2 0 0 0 0 0 0 0 0 0 0 0 2 0 0 0Total Finance Costs Cashflow 2 2 2 (12) (133) (2,145) 3 3 (15) (11) (102) (2,142) (4,551) (18) (18) (18)CapitalCapital Expenditure (133) (337) (417) (563) (603) (650) (745) (1,022) (987) (766) (1,773) (2,611) (10,607) (833) (833) (833)Capital - Total Balance Sheet Movements (3,047) (2,547) (780) 0 0 0 0 0 0 0 0 902 (5,471) 0 0 0Total Capital Cashflow (3,180) (2,883) (1,197) (563) (603) (650) (745) (1,022) (987) (766) (1,773) (1,709) (16,078) (833) (833) (833)Total Cashflow 796 (2,730) (2,244) (610) (2,585) (3,761) 873 (1,965) (1,645) 2,137 (1,127) 1,473 (11,388) 716 (395) (321)Balance C/fwd 6,421 3,691 1,447 837 (1,748) (5,509) (4,636) (6,601) (8,246) (6,109) (7,236) (5,763) (5,763) (5,047) (5,442) (5,763)
Level of Creditor Suppression required to achieve minimum cash balance 3448 3,761 1,092 1,645 (1,010) (1,473) 7,463Revsied Balance C/fwd 1,700 1,700 2,573 1,700 1,700 3,837 1,700 1,700 1,700
7
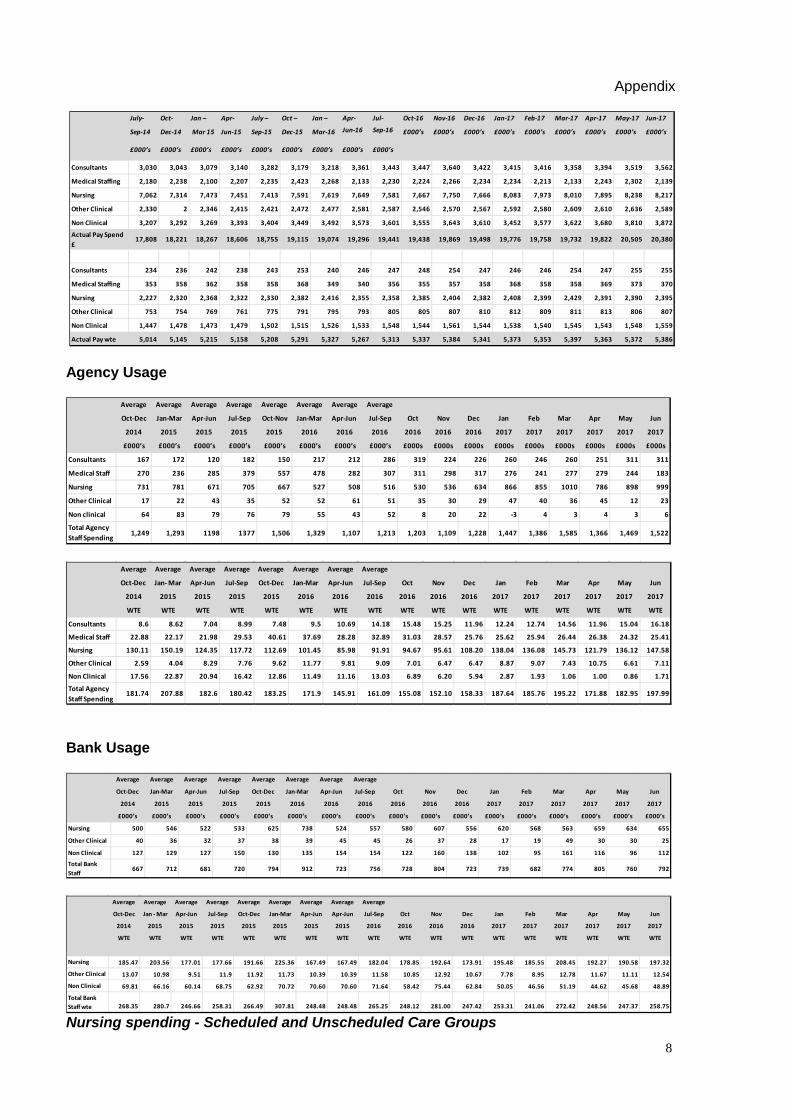
Appendix
July- Oct- Jan – Apr- July – Oct – Jan – Apr- Jul- Oct-16 Nov-16 Dec-16 Jan-17 Feb-17 Mar-17 Apr-17 May-17 Jun-17
Sep-14 Dec-14 Mar 15 Jun-15 Sep-15 Dec-15 Mar-16 Jun-16 Sep-16 £000’s £000’s £000’s £000’s £000’s £000’s £000’s £000’s £000’s
£000’s £000’s £000’s £000’s £000’s £000’s £000’s £000’s £000’s
/onsultants 3,030 3,043 3,079 3,140 3,282 3,179 3,218 3,361 3,443 3,447 3,640 3,422 3,415 3,416 3,358 3,394 3,519 3,562
aedical Staffing 2,180 2,238 2,100 2,207 2,235 2,423 2,268 2,133 2,230 2,224 2,266 2,234 2,234 2,213 2,133 2,243 2,302 2,139
bursing 7,062 7,314 7,473 7,451 7,413 7,591 7,619 7,649 7,581 7,667 7,750 7,666 8,083 7,973 8,010 7,895 8,238 8,217
hther /linical 2,330 2 2,346 2,415 2,421 2,472 2,477 2,581 2,587 2,546 2,570 2,567 2,592 2,580 2,609 2,610 2,636 2,589
bon /linical 3,207 3,292 3,269 3,393 3,404 3,449 3,492 3,573 3,601 3,555 3,643 3,610 3,452 3,577 3,622 3,680 3,810 3,872
Actual Pay Spend £
17,808 18,221 18,267 18,606 18,755 19,115 19,074 19,296 19,441 19,438 19,869 19,498 19,776 19,758 19,732 19,822 20,505 20,380
/onsultants 234 236 242 238 243 253 240 246 247 248 254 247 246 246 254 247 255 255
aedical Staffing 353 358 362 358 358 368 349 340 356 355 357 358 368 358 358 369 373 370
bursing 2,227 2,320 2,368 2,322 2,330 2,382 2,416 2,355 2,358 2,385 2,404 2,382 2,408 2,399 2,429 2,391 2,390 2,395
hther /linical 753 754 769 761 775 791 795 793 805 805 807 810 812 809 811 813 806 807
bon /linical 1,447 1,478 1,473 1,479 1,502 1,515 1,526 1,533 1,548 1,544 1,561 1,544 1,538 1,540 1,545 1,543 1,548 1,559
Actual Pay wte 5,014 5,145 5,215 5,158 5,208 5,291 5,327 5,267 5,313 5,337 5,384 5,341 5,373 5,353 5,397 5,363 5,372 5,386
Agency Usage
Average Average Average Average Average Average Average Average
hct-5ec Jan-aar Apr-Jun Jul-Sep hct-bov Jan-aar Apr-Jun Jul-Sep hct bov 5ec Jan Feb aar Apr aay Jun
2014 2015 2015 2015 2015 2016 2016 2016 2016 2016 2016 2017 2017 2017 2017 2017 2017
£000’s £000’s £000’s £000’s £000’s £000’s £000’s £000’s £000s £000s £000s £000s £000s £000s £000s £000s £000s
/onsultants 167 172 120 182 150 217 212 286 319 224 226 260 246 260 251 311 311
aedical Staff 270 236 285 379 557 478 282 307 311 298 317 276 241 277 279 244 183
bursing 731 781 671 705 667 527 508 516 530 536 634 866 855 1010 786 898 999
hther /linical 17 22 43 35 52 52 61 51 35 30 29 47 40 36 45 12 23
bon clinical 64 83 79 76 79 55 43 52 8 20 22 -3 4 3 4 3 6
Total Agency Staff Spending
1,249 1,293 1198 1377 1,506 1,329 1,107 1,213 1,203 1,109 1,228 1,447 1,386 1,585 1,366 1,469 1,522
Average Average Average Average Average Average Average Average
hct-5ec Jan- aar Apr-Jun Jul-Sep hct-5ec Jan-aar Apr-Jun Jul-Sep hct bov 5ec Jan Feb aar Apr aay Jun
2014 2015 2015 2015 2015 2016 2016 2016 2016 2016 2016 2017 2017 2017 2017 2017 2017
WT9 WT9 WT9 WT9 WT9 WT9 WT9 WT9 WT9 WT9 WT9 WT9 WT9 WT9 WT9 WT9 WT9
/onsultants 8.6 8.62 7.04 8.99 7.48 9.5 10.69 14.18 15.48 15.25 11.96 12.24 12.74 14.56 11.96 15.04 16.18
aedical Staff 22.88 22.17 21.98 29.53 40.61 37.69 28.28 32.89 31.03 28.57 25.76 25.62 25.94 26.44 26.38 24.32 25.41
bursing 130.11 150.19 124.35 117.72 112.69 101.45 85.98 91.91 94.67 95.61 108.20 138.04 136.08 145.73 121.79 136.12 147.58
hther /linical 2.59 4.04 8.29 7.76 9.62 11.77 9.81 9.09 7.01 6.47 6.47 8.87 9.07 7.43 10.75 6.61 7.11
bon /linical 17.56 22.87 20.94 16.42 12.86 11.49 11.16 13.03 6.89 6.20 5.94 2.87 1.93 1.06 1.00 0.86 1.71
Total Agency Staff Spending
181.74 207.88 182.6 180.42 183.25 171.9 145.91 161.09 155.08 152.10 158.33 187.64 185.76 195.22 171.88 182.95 197.99 Bank Usage
Average Average Average Average Average Average Average Average
hct-5ec Jan-aar Apr-Jun Jul-Sep hct-5ec Jan-aar Apr-Jun Jul-Sep hct bov 5ec Jan Feb aar Apr aay Jun
2014 2015 2015 2015 2015 2016 2016 2016 2016 2016 2016 2017 2017 2017 2017 2017 2017
£000’s £000’s £000’s £000’s £000’s £000’s £000’s £000’s £000’s £000’s £000’s £000’s £000’s £000’s £000’s £000’s £000’s
bursing 500 546 522 533 625 738 524 557 580 607 556 620 568 563 659 634 655
hther /linical 40 36 32 37 38 39 45 45 26 37 28 17 19 49 30 30 25
bon /linical 127 129 127 150 130 135 154 154 122 160 138 102 95 161 116 96 112
Total Bank Staff
667 712 681 720 794 912 723 756 728 804 723 739 682 774 805 760 792
Average Average Average Average Average Average Average Average Average
hct-5ec Jan - aar Apr-Jun Jul-Sep hct-5ec Jan-aar Apr-Jun Apr-Jun Jul-Sep hct bov 5ec Jan Feb aar Apr aay Jun
2014 2015 2015 2015 2015 2015 2015 2015 2016 2016 2016 2016 2017 2017 2017 2017 2017 2017
WT9 WT9 WT9 WT9 WT9 WT9 WT9 WT9 WT9 WT9 WT9 WT9 WT9 WT9 WT9 WT9 WT9 WT9
bursing 185.47 203.56 177.01 177.66 191.66 225.36 167.49 167.49 182.04 178.85 192.64 173.91 195.48 185.55 208.45 192.27 190.58 197.32
hther /linical 13.07 10.98 9.51 11.9 11.92 11.73 10.39 10.39 11.58 10.85 12.92 10.67 7.78 8.95 12.78 11.67 11.11 12.54
bon /linical 69.81 66.16 60.14 68.75 62.92 70.72 70.60 70.60 71.64 58.42 75.44 62.84 50.05 46.56 51.19 44.62 45.68 48.89
Total Bank Staff wte 268.35 280.7 246.66 258.31 266.49 307.81 248.48 248.48 265.25 248.12 281.00 247.42 253.31 241.06 272.42 248.56 247.37 258.75 Nursing spending - Scheduled and Unscheduled Care Groups
8

Unqualified
Qualified
9
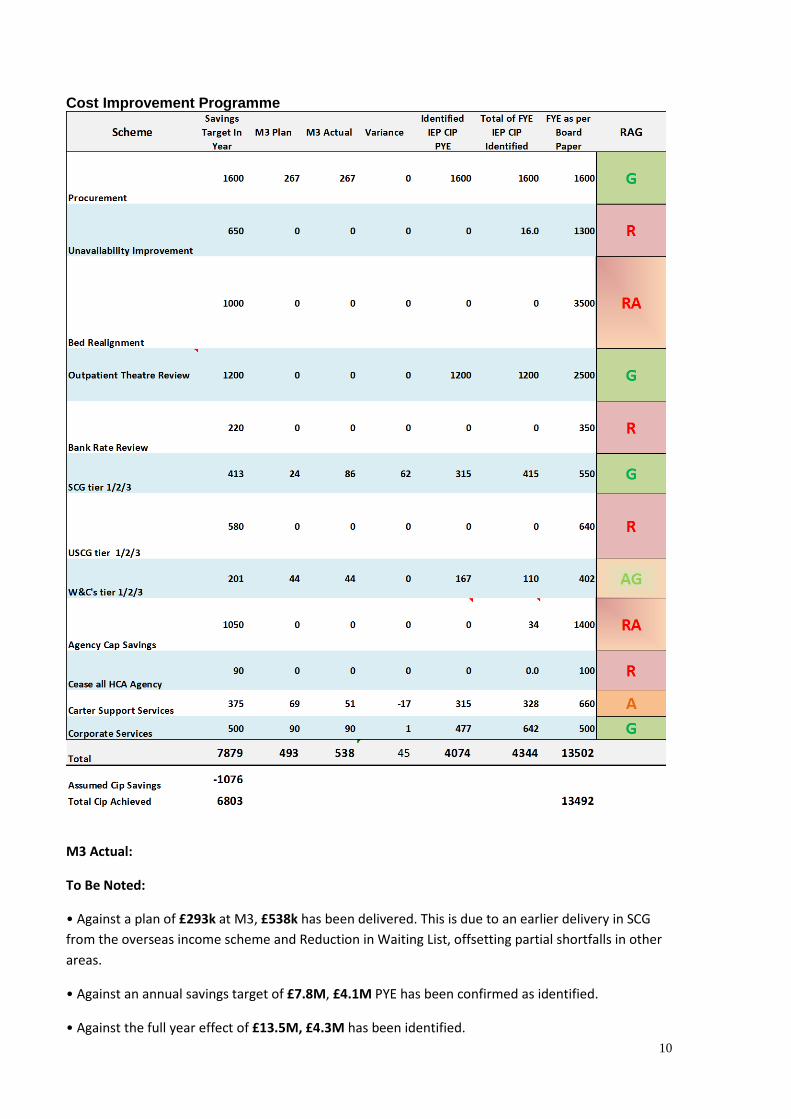
Cost Improvement Programme
a3 Actual:
To Be boted:
• Against a plan of £293k at M3, £538k has been delivered. This is due to an earlier delivery in SCG from the overseas income scheme and Reduction in Waiting List, offsetting partial shortfalls in other areas.
• Against an annual savings target of £7.8a, £4.1a PYE has been confirmed as identified.
• Against the full year effect of £13.5a, £4.3a has been identified. 10
Concerns: It is to be noted, that albeit a plan of £4.1M being identified, this is underpinned by the successful delivery of the operating plan. Long term, adverse variances will be seen within the CIP schemes if the Trust is unable to improve its deficit position against the Operating plan. For further over spends reduce the delivery of the CIP savings.
Further Review:
• There is a shortfall across a number of key areas, with improved review required from the pay schemes which have yet to forecast potential savings.
• USCG has embarked on a prioritisation process to identify schemes, as yet these remain to be determined and there are concerns over the QIA.
• Support Services, W&Cs have identified a number of schemes, albeit they still fall short of their annual target. Potential opportunities being developed as pipeline may offset some of this shortfall.
• SCG has identified schemes and has developed plans to support these.
• Corporate Services have identified a plan with a FYE of £642k against £500k. There has been some minor slippage in month due to processing issues around invoicing.
• Procurement has developed a plan which demonstrates £1.6M PYE can be achieved however £600k is at risk if the non-pay spend position does not improve.
Action Required:
Trust wide support to engage Project Leads to support CIP delivery through documented governance and assurance
• In summary, it is evident that where schemes have failed to describe the approach to be taken within a PID, supported by fully developed robust plans, QIAs do not demonstrate outputs correctly. Thus the financial assurance around output and delivery is low.
Red: (R/RA) requires more detailed supporting Monthly Financial Trajectory, Project Plans, PIDs, QIA’s.
Amber: (A/AR) Plans, QIAs, PIDS and financial plans are in place, whilst requiring further review to embed.
Green: (G) Assurance can be given that supporting documents are completed with plans delivering savings.
11
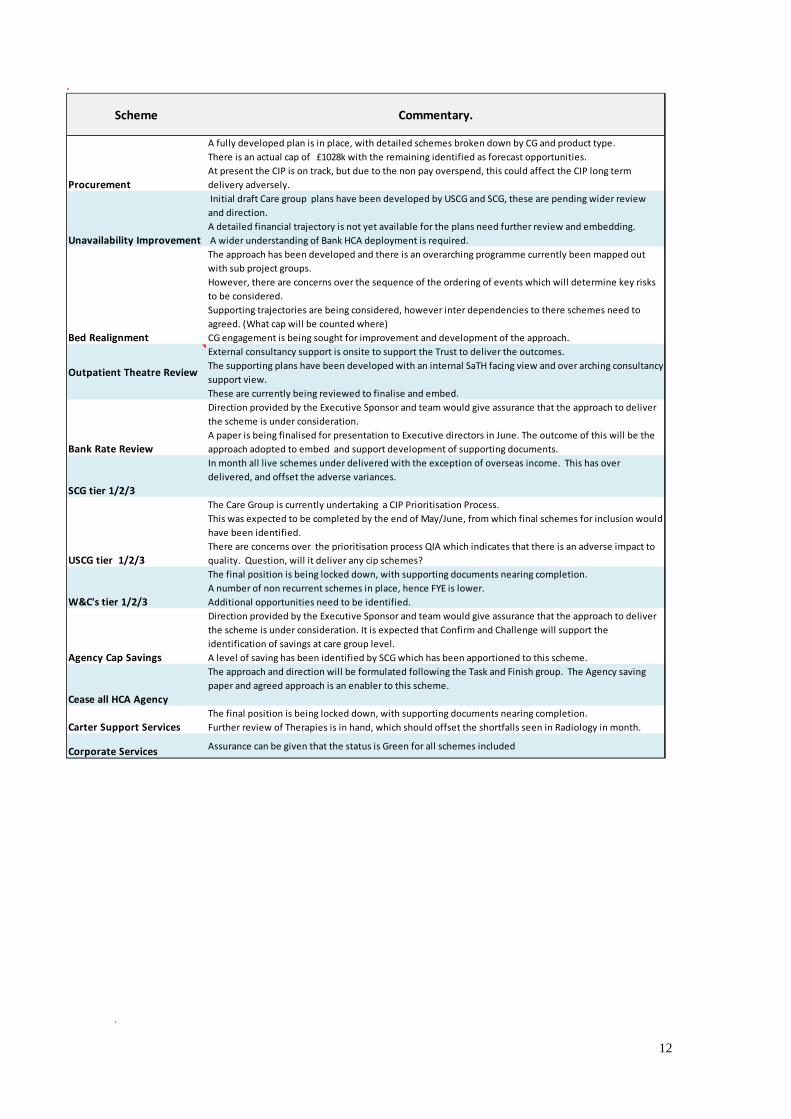
.
Scheme /ommentary.
Procurement
A fully developed plan is in place, with detailed schemes broken down by CG and product type. There is an actual cap of £1028k with the remaining identified as forecast opportunities. At present the CIP is on track, but due to the non pay overspend, this could affect the CIP long term delivery adversely.
Unavailability Improvement
Initial draft Care group plans have been developed by USCG and SCG, these are pending wider review and direction. A detailed financial trajectory is not yet available for the plans need further review and embedding. A wider understanding of Bank HCA deployment is required.
Bed Realignment
The approach has been developed and there is an overarching programme currently been mapped out with sub project groups. However, there are concerns over the sequence of the ordering of events which will determine key risks to be considered. Supporting trajectories are being considered, however inter dependencies to there schemes need to agreed. (What cap will be counted where)CG engagement is being sought for improvement and development of the approach.
hutpatient Theatre Review
External consultancy support is onsite to support the Trust to deliver the outcomes. The supporting plans have been developed with an internal SaTH facing view and over arching consultancy support view. These are currently being reviewed to finalise and embed.
Bank Rate Review
Direction provided by the Executive Sponsor and team would give assurance that the approach to deliver the scheme is under consideration. A paper is being finalised for presentation to Executive directors in June. The outcome of this will be the approach adopted to embed and support development of supporting documents.
S/G tier 1/2/3
In month all live schemes under delivered with the exception of overseas income. This has over delivered, and offset the adverse variances.
US/G tier 1/2/3
The Care Group is currently undertaking a CIP Prioritisation Process.This was expected to be completed by the end of May/June, from which final schemes for inclusion would have been identified.There are concerns over the prioritisation process QIA which indicates that there is an adverse impact to quality. Question, will it deliver any cip schemes?
W&/'s tier 1/2/3
The final position is being locked down, with supporting documents nearing completion. A number of non recurrent schemes in place, hence FYE is lower. Additional opportunities need to be identified.
Agency /ap Savings
Direction provided by the Executive Sponsor and team would give assurance that the approach to deliver the scheme is under consideration. It is expected that Confirm and Challenge will support the identification of savings at care group level. A level of saving has been identified by SCG which has been apportioned to this scheme.
/ease all H/A Agency
The approach and direction will be formulated following the Task and Finish group. The Agency saving paper and agreed approach is an enabler to this scheme.
/arter Support ServicesThe final position is being locked down, with supporting documents nearing completion. Further review of Therapies is in hand, which should offset the shortfalls seen in Radiology in month.
/orporate Services Assurance can be given that the status is Green for all schemes included
.
12
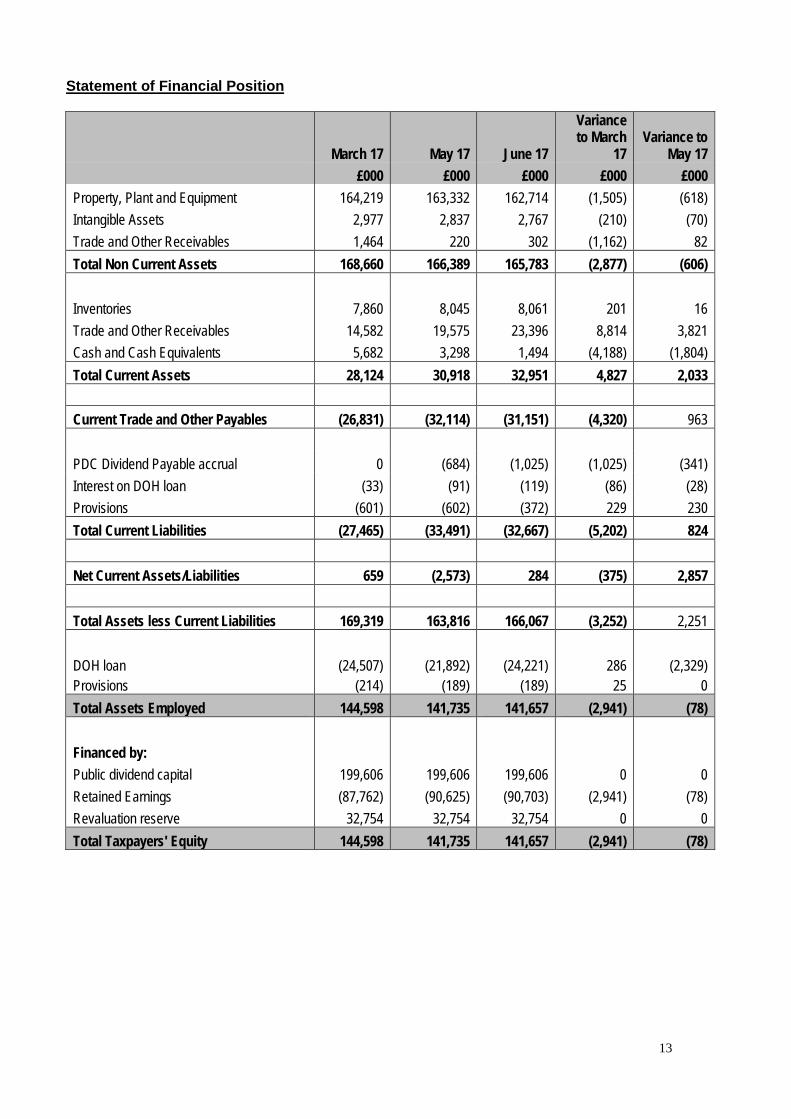
Statement of Financial Position
March 17 May 17 June 17
Variance to March
17 Variance to
May 17 £000 £000 £000 £000 £000
Property, Plant and Equipment 164,219 163,332 162,714 (1,505) (618) Intangible Assets 2,977 2,837 2,767 (210) (70) Trade and Other Receivables 1,464 220 302 (1,162) 82 Total Non Current Assets 168,660 166,389 165,783 (2,877) (606) Inventories 7,860 8,045 8,061 201 16 Trade and Other Receivables 14,582 19,575 23,396 8,814 3,821 Cash and Cash Equivalents 5,682 3,298 1,494 (4,188) (1,804) Total Current Assets 28,124 30,918 32,951 4,827 2,033 Current Trade and Other Payables (26,831) (32,114) (31,151) (4,320) 963 PDC Dividend Payable accrual 0 (684) (1,025) (1,025) (341) Interest on DOH loan (33) (91) (119) (86) (28) Provisions (601) (602) (372) 229 230 Total Current Liabilities (27,465) (33,491) (32,667) (5,202) 824 Net Current Assets/Liabilities 659 (2,573) 284 (375) 2,857 Total Assets less Current Liabilities 169,319 163,816 166,067 (3,252) 2,251 DOH loan (24,507) (21,892) (24,221) 286 (2,329) Provisions (214) (189) (189) 25 0 Total Assets Employed 144,598 141,735 141,657 (2,941) (78) Financed by: Public dividend capital 199,606 199,606 199,606 0 0 Retained Earnings (87,762) (90,625) (90,703) (2,941) (78) Revaluation reserve 32,754 32,754 32,754 0 0 Total Taxpayers' Equity 144,598 141,735 141,657 (2,941) (78)
13