trucking in canada - cargom · for-hire trucking : annual supplement statistics, 2005 • for-hire...
TRANSCRIPT

Catalogue no. 53-222-XIE
Truckingin Canada
2005

How to obtain more information
Specifi c inquiries about this product and related statistics or services should be directed to: Transportation Division, Statistics Canada, Ottawa, Ontario, K1A 0T6 (telephone: 1-866-500-8400).
For information on the wide range of data available from Statistics Canada, you can contact us by calling one of our toll-free numbers. You can also contact us by e-mail or by visiting our website at www.statcan.ca.
National inquiries line 1-800-263-1136National telecommunications device for the hearing impaired 1-800-363-7629Depository Services Program inquiries 1-800-700-1033Fax line for Depository Services Program 1-800-889-9734E-mail inquiries [email protected] www.statcan.ca
Information to access the product
This product, catalogue no. 53-222-XIE, is available for free in electronic format. To obtain a single issue, visit our website at www.statcan.ca and select Publications.
Standards of service to the public
Statistics Canada is committed to serving its clients in a prompt, reliable and courteous manner. To this end, the Agency has developed standards of service which its employees observe in serving its clients. To obtain a copy of these service standards, please contact Statistics Canada toll free at 1-800-263-1136. The service standards are also published on www.statcan.ca under About us > Providing services to Canadians.

Statistics CanadaTransportation DivisionTrucking Section
Truckingin Canada2005
Note of appreciation
Canada owes the success of its statistical system to a long-standing partnership between Statistics Canada, the citizens of Canada, its businesses, governments and other institutions. Accurate and timely statistical information could not be produced without their continued cooperation and goodwill.
Published by authority of the Minister responsible for Statistics Canada
© Minister of Industry, 2007
All rights reserved. The content of this electronic publication may be reproduced, in whole or in part, and by any means, without further permission from Statistics Canada, subject to the following conditions: that it be done solely for the purposes of private study, research, criticism, review or newspaper summary, and/or for non-commercial purposes; and that Statistics Canada be fully acknowledged as follows: Source (or “Adapted from”, if appropriate): Statistics Canada, year of publication, name of product, catalogue number, volume and issue numbers, reference period and page(s). Otherwise, no part of this publication may be reproduced, stored in a retrieval system or transmitted in any form, by any means—electronic, mechanical or photocopy—or for any purposes without prior written permission of Licensing Services, Client Services Division, Statistics Canada, Ottawa, Ontario, Canada K1A 0T6.
June 2007
Catalogue no. 53-222-XIEISSN 1481-0719
Frequency: annual
Ottawa
La version fançaise de cette publication est disponible sur demande (no 53-222-XIF au catalogue).

4 Trucking in Canada, 2005 Statistics Canada – Catalogue no. 53-222
The following standard symbols are used in Statistics Canada publications:
. not available for any reference period
.. not available for a specifi c reference period
… not applicable
0 true zero or a value rounded to zero
0s value rounded to 0 (zero) where there is a meaningful distinction between true zero and the value that was roundedp preliminaryr revised
x suppressed to meet the confi dentiality requirements of the Statistics ActE use with caution
F too unreliable to be published
Symbols
Acknowledgements
This publication was prepared in the Transportation Division under the direction of Gordon Baldwin, Director; Bruce Meyer, Assistant Director; Ed Hamilton, Chief, Trucking Section; Joe Foti, Chief Operations; John Nicoletta, and Denis Pilon, Unit Heads, Trucking Section.
The principal authors of this publication were John Nicoletta, Denis Pilon and Vincent Dubé.
Technical assistance was provided by: Johanne Desjardins; Johanne Caron-Dorion; Peggy Moffatt; Susan McLeod; and Suzanne Cousineau.
Other signifi cant contributions to the collection, preparation of the data were made by the following people:
Transportation DivisionGhislaine Comeau, Nathalie Larocque, Nicole Truax, and Elaine Heney Transportation Division, Systems & Data Integration Section Louis-Jérôme Belleau, Serge Robert, François Roy, Greg Toll, and Patrick Goubran
Business Surveys Methods Division Jack Lothian, Sébastien Landry, François Gagnon, Ling Su, Lyne Guertin and Windie Gagné
Survey Operations Division Ida Didomenico, Milena Zelenbaba, Paul Adams, and Linda Balloch
Statistics Canada Regional Offi ces
Operations Research and Development Division
Operations and Integration Division Marian Grant and Sylvie Boucher

Statistics Canada – Catalogue no. 53-222 Trucking in Canada, 2005 5
Table of contents
Page
Highlights 7
Chapter 1 – Trucking in Canada
The trucking industry in 2005 8The Canadian economy in 2005 8International trade and the trucking industry 8The transportation industry and the role of trucking 8Employment 8 About this publication 10
Chapter 2 – Surveys of For-hire Motor Carriers of Freight, 2005
Introduction 11
Section 1 – Quarterly Motor Carriers of Freight Survey 111.1 Revenues of trucking companies grew substantially in 2005 111.2 An industry dependent on the manufacturing sector 111.3 Operating ratios remain relatively low 111.4 Differences by carrier size 131.5 General freight transportation and long-distance trucking remained the sector’s dominant activities 131.6 Specialized freight carriers showed a better performance 131.7 Domestic market boosted growth 151.8 Labour costs account for half of total expenses 151.9 A year characterized by rising energy costs 15
Section 2 – Annual Motor Carriers of Freight Survey, 2005 242.1 According to balance sheets, 2005 was less profi table than 2004 for trucking companies 242.2 Both short-term and long-term solvency deteriorated 242.3 Financial leverage remains positive 262.4 Carriers owned three-quarters of their service equipment in 2005 26
Chapter 3 – Trucking Commodity Origin and Destination Survey, 2004 34
Chapter 4 – Survey Methodology and Data Quality
Introduction 35 Section 1 – Quarterly For-Hire Motor Carriers of Freight (QMCF) Survey and its Annual Supplement (Q5) – Chapter 2 35
Glossary 40
Defi nitions of Financial Ratios 42

6 Trucking in Canada, 2005 Statistics Canada – Catalogue no. 53-222
Table of contents (concluded)
Page
Figures
Chapter 1 – Trucking in Canada1.1 Annual Variation in GDP, Chained 1997 dollars, 1999-2005 91.2 Employment in Top 5 Transportation Industries, 2005 9
Chapter 2 - Surveys of For-hire Motor Carriers of Freight, 20052.1 Operating revenues (seasonally adjusted data) passed the $7 billion mark in 2005 122.2 Since mid-2004, there has been a major improvement in the profi tability of for-hire trucking companies in Canada 122.3 While top carriers represented only 3% of all carriers, they accounted for nearly one third of total operating revenues in 2005 132.4 General freight transportation dominates in eastern Canada while specialized freight is more dominant in the West 14 2.5 Long-haul trucking companies are generally larger than local trucking companies 142.6 Specialized freight carriers generally out-perform general freight carriers 152.7 The domestic market accounts for a rising share of transportation revenues in Canada 162.8 One of every two dollars spent by trucking companies was related to labour cost 162.9 Size of main expense items varies according to carrier size 172.10 Monthly diesel fuel Price index (excluding taxes and transportation) continued to show strong increases in 2005 172.11 Operating profi t margins declined in most regions in 2005 242.12 Operating profi t margin of forest product transportation showed the steepest drop in 2005 252.13 Operating profi t margins of all revenue groups declined in 2005 25
Tables
Chapter 1 – Trucking in Canada1 2005 Statistical Coverage of the Canadian Trucking Industry 10
Chapter 2 – Section 1 – QMCF Survey, For-hire Carriers2.1 Summary Statistics by Quarter, 2005 - Canada 182.2 Summary Statistics by Region, 2005 192.3 General and Specialized Freight, by Quarter, 2005 212.4 For-hire Carriers, revenues by type of movement by quarter, 2005 23
Chapter 2 – Section 2 – AMCF Survey, For-hire Carriers2.5 Summary of fi nancial statistics, 2000-2005 272.6 Financial statistics by region, 2005 282.7 Summary statistics by type of activity, 2005 292.8 Summary of fi nancial statistics, by local and long distance, 2005 302.9 Financial statistics by revenue size, 2005 322.10 Semi-trailers and other operated equipment by region, 2005 332.11 Semi-trailers and other operated equipment by industry, 2005 33
Chapter 3 – Trucking Commodity Origin and Destination Survey, 20043.1 For-hire Trucking Activity, 2004 34
Chapter 4 – Survey methodology and Data Quality4.1 QMCF survey, for-hire carriers, fi rst quarter 2005– Survey population and sample size by region and type of activity 374.2 2005 MCF Survey, Annual Supplement (Q5) – Survey population and sample size by region and type of activity 374.3 2005 QMCF Survey, Quality measures by region and by type of activity 384.4 2005 MCF Survey, Annual Supplement(Q5) – Quality measures by region, by type of activity and by size 39

Statistics Canada – Catalogue no. 53-222 Trucking in Canada, 2005 7
Highlights
For-hire trucking : Quarterly and annual industry statistics, 2005, Canadian-based carriers with annual revenues of $1 million or more
For-hire trucking : Quarterly Statistics, 2005
• In 2005, there were about 3,360 Canadian-based for-hire carriers.
• Seasonally adjusted operating revenues from for-hire trucking totalled $27.04 billion, up 7% compared to 2004.
• Total seasonally adjusted operating expenses stood at $24.87 billion, up 6% from 2004.
• Compared to 2004, the largest increases in operating expenses include depreciation (+15%), fuel expenses (+14%), wages and salaries (+10%) and maintenance and garage expenses (+10%).
• In 2005, one in two dollars spent by trucking companies was related to labour expenses.
• For-hire carriers continued to register operating ratios (total operating expenses divided by total operating revenues) that were among the lowest in more than a decade.
• General freight transportation accounted for 60% of total revenues. Long-distance trucking captured 78% of total transportation revenues.
• In the East, the transportation of general freight accounted for two-thirds of all operating revenues, while the transportation of specialized freight was predominant in the West, capturing more than half of all operating revenues.
• The domestic share of transportation improved from 64% to 67%, totalling $17.55 billion in 2005.
For-hire trucking : Annual supplement statistics, 2005
• For-hire trucking companies with annual revenues of $1million or more, earned $26.1 billion in operating revenues while they incurred $25.1 billion in operating expenses resulting in net operating revenues of $1.03 billion.
• Compared to 2004, carriers generally saw their profi tability decline in 2005. For example, their net operating revenues were down nearly 30%.
• The operating profi t margin (operating profi t as a share of total operating revenues) was also lower than 2004, dropping from 6.08% to 3.94%.
• Overall, total assets reached $13.5 billion. On a per carrier basis total asset growth was 2.2% compared to the previous year.
• The return on equity (16.3%) remained higher than the return on capital employed (13.3%), indicating positive fi nancial leverage.
For-hire trucking : Commodity origin and destination statistics, 2004
• Canadian for-hire trucking companies, with annual operating revenue of $1 million or more, hauled 65.9 million shipments weighing 604.3 million tonnes in 2004.

8 Trucking in Canada, 2005 Statistics Canada – Catalogue no. 53-222
Chapter 1Trucking in Canada
1. Refers to for-hire carriers with annual revenues of $1 million or more, from the annual supplement survey Q5.2.
2. Gross Domestic Product at basic prices, North American Industry Classifi cation System (NAICS), chained 1997 dollars, CANSIM table 379-0017 for Canada industry detail and CANSIM table 379-0025 for provincial industry detail. Statistics Canada.
Gross Domestic Product (GDP), expenditure-based, provincial economic accounts, chained 1997 dollars, CANSIM table 384-0002 for Canada, provincial and territories totals. Statistics Canada.
Provincial and Territorial Gross Domestic Product from the April 26, 2006 and November 8, 2006 Daily releases. Statistics Canada.
3 Source: CANSIM, Table 281-0024, Employment (SEPH), unadjusted for seasonal variation, by type of employee for selected industries classifi ed using the North American Industry Classifi cation Systems (NAICS), annual (Persons). SEPH data excludes the self-employed. Statistics Canada.
The trucking industry in 2005
Trucking is a major component of transportation Gross Domestic Product and in turn of the Canadian economy. It accounts for a signifi cant share of value, contributing over $14.2 billion to the economy in 2005. Not only does trucking provide service to Canadian manufacturers and shippers, it also provides Canadians, in general, with the necessities of everyday life.
In 2005, total operating revenues1 amounted to $26.1 billion, an increase of 8.8% from 2004. Although the estimated number of carriers increased by 10% in 2005, the average revenue per carrier dropped slightly by 1.2%. The Canadian economy in 20052
In 2005, gross domestic product (GDP) increased 2.9%, down from 3.3% growth a year earlier. Once again, the western provinces led the way as economic growth in Alberta, British Columbia and Saskatchewan was above the national average. During the last three years, growth in GDP has averaged 2.7% per year.
In the west, Alberta remained the top province in economic growth with a 4.6% increase in 2005. High oil prices and manu-facturing increases boosted the economy. Although British Columbia’s GDP increased at a lower rate than 2004, its economy was the next strongest in the west at a rate of 3.7%. This was due in part to the rise in exports of natural gas and electricity. In Saskatchewan, strong energy prices and increased mining aided in an increase in GDP of 3.1%.
In the territories, the Yukon posted the highest growth in GDP at 5.2%. Business investment rose leading to increased personal expenditures and housing demands. Northwest Territories remained relatively unchanged from 2004 as mining operations reached its capacity. After an increase in 2004, Nunavut’s GDP declined 1.1%, as a result of decreased mining operations.
Although Central and Eastern Canadian provinces all recorded positive growth in GDP, they all rose to levels below the national average of 2.9%. Ontario experienced the largest increase at 2.8%. This was mainly due to the continued growth in the auto industry. In Quebec, GDP increased at a slower rate than in 2004 reaching 2.2%. This growth was mainly attributable to increases in manufacturing activity and increased personal spending.
Atlantic Canada experienced moderate growth in 2005, with Prince Edward Island posting the highest growth in GDP at 2.1%. Strength in labour income increased personal spending which aided in this growth, as well as increases in manufacturing. Nova Scotia was next with a growth in GDP of 1.6%, as government spending increased and labour income rose. Newfoundland and Labrador and New Brunswick followed with slight increases of 0.4% and 0.3%, respectively.
International trade and the trucking industry
Trade with the United States continued to increase in 2005. Total exports to the United States grew 5.1% from 2004 while imports from the United States rose 3.0%. Trade with the United States accounted for 84% of Canada’s total exports and 57% of Canada’s total imports in 2005.
Trucking continued to be the dominant mode, in terms of revenue, for transporting goods between Canada and the United States. About 51% of the exports to the United States and 77% of the imports from the United States were moved by truck in 2005.
The transportation industry and the role of trucking
GDP in the transportation and warehousing sector rose by 3.5% in 2005, slightly lower than the 4.2% growth experienced a year earlier. Truck transportation accounted for the largest share of transportation and warehousing GDP at 28.8%, followed by rail and transit and ground transportation with 11.5% and 10.6%, respectively. Air transportation registered the highest growth rate of 10.8% followed by Truck transportation at 3.7%. (See Figure 1.1.)
Employment3
Employment in the top fi ve transportation industries increased by 2% in 2005 accounting for over 456,000 people. The trucking industry remained the single largest component, accounting for 38% or 171,400 of the people working in these top fi ve transportation industries. Transit and ground passenger transportation employed 100,000 people in the second spot. The share of people working in the trucking industry has been relatively constant since 1997, ranging from 35% to 38%. (See Figure 1.2.)

Statistics Canada – Catalogue no. 53-222 Trucking in Canada, 2005 9
-1.0
0.0
1.0
2.0
3.0
4.0
5.0
6.0
7.0
8.0
1999 2000 2001 2002 2003 2004 2005
Economy as a whole Transportation and warehousing Trucking
Figure 1.1Annual Variation in GDP, Chained 1997 dollars, 1999-2005
percentage
Source: Gross Domestic Product at basic prices, North American Industry Classification System (NAICS), chained 1997 dollars, CANSIM table 379-0017 for Canada industry detail. Statistics Canada. Gross Domestic Product (GDP), expenditure-based, provincial economic accounts, chained 1997 dollars, CANSIM table 384-0002 for Canada. Statistics Canada.
0 50 100 150 200
Rail transport
Air transport
Support activities for transport
Transit transport¹
Truck transport
Figure 1.2Employment in Top 5 Transporation Industries, 2005
Number of employees in thousands
1. This category consists of Transit and Ground Passenger Transportation.Source: Statistics Canada, CANSIM, Table 281-0024, Employment (SEPH), unadjusted for seasonal variation, by type of employee for selected industries classified using the North American Industry Classification Systems (NAICS), annual (Persons). SEPH data excludes the self-employed.

10 Trucking in Canada, 2005 Statistics Canada – Catalogue no. 53-222
A For-Hire Carrier is any carrier that undertakes the transport of goods for compensation.
Owner operators own or lease one or more power units and provide hauling services under contract to for-hire or private carriers.
A private carrier is a company whose principal occupation is not trucking, but which maintains its own fl eet of vehicles (owned or leased) for transporting its own freight.
About this publication
Trucking in Canada, 2005 presents information about the trucking industry in 2005. This chapter provides a discussion of the role of trucking in the Canadian economy.
Table 1 summarizes Statistics Canada’s coverage of the Canadian trucking industry, and explains how to use this publication to locate information about various classes of for-hire carriers.
Chapter 2 presents fi nancial and operating data about for-hire carriers with annual operating revenues of $1 million or more in 2005. These statistics were collected as part of the 2005 Motor Carriers of Freight (MCF) survey program. The MCF collects operating and fi nancial data in a quarterly sample survey of for-hire carriers. The survey gathers information on the size, structure and economic performance of motor freight carriers. In an annual supplement, it also collects balance sheet and equipment information. This chapter includes fi nancial data on revenues, expenditures and operating ratios, plus selected economic indicators.
Chapter 3: The For-hire Trucking (Commodity Origin/Destination) Survey has been redesigned. The detailed results have not been included in this publication but instead will be published at a later date. (See Chapter 3 in this publication for further details).
Chapter 4 presents a description of the survey methodologies and data quality.
Table 1
2005 Statistical coverage of the Canadian trucking industry
Carrier type For hire carriers Owner-operators
Data source MCF Surveys MCF Survey TCOD Survey MCF Survey (fi nancial & operating Administrative data (commodity origin/destination Administrative data statistics) (operational and fi nancial) (operational and fi nancial)
Frequency Quarterly and annual Annual Annual Annual
Carrier size Operating revenue Operating revenue Operating revenue from long Operating revenue > or = $1 million $30,000 - < $1 million distance trucking companies > > or = $30,000 or = $1 million
Class or level Medium – $1 to 12 million Operating revenue Class I (operating revenue N/A Large – $12 to 25 million Small carriers > or = $12 million) Top – $25 million and over $30,000 - <$1million Class II (operating revenue $1 million - < $12 million) (from annual revenue) (from annual revenue)
Geography Canada Canada Canada Canada Regions Regions Provinces Regions Provinces Provinces Territories Provinces Territories Territories Sub – Provincial Territories
For more Chapter 2 Service bulletin Chapter 3 Service bulletininformation Sections 2.1 & 2.2
Notes: MCF refers to the motor carriers of freight. TCOD refers to the For-Hire Trucking (Commodity Origin and Destination).

Statistics Canada – Catalogue no. 53-222 Trucking in Canada, 2005 11
Chapter 2Surveys of For-hire Motor Carriers of Freight, 2005
Seasonal adjustment removes seasonal fl uctuations from the original or “unadjusted” data series. Thus, seasonally adjusted data capture the more fundamental trend in a data series and provide more appropriate comparisons over time.
The operating ratio is the share of total operating revenues absorbed by total operating expenses (excluding interest charges). It is calculated by dividing operating expenses by operating revenues. A drop in the ratio indicates an improvement in fi nancial performance. A ratio greater than 1.00 represents an operating loss.
4. Revenues, expenses and operating ratios that are seasonally adjusted (seasonal fl uctuations removed) reveal the fundamental overall trends in the performance of the Canadian for-hire trucking industry.
5. Source: CANSIM tables 304-0014, 081-0007, 080-0015.
Introduction
This chapter provides statistical information about the fi nancial performance of companies operating in the Canadian for-hire trucking industry with annual revenues of $1 million or more.
The statistics are derived from quarterly and annual surveys of for-hire carriers of freight based in Canada. This chapter consists of two sections:
Section 1 – Findings of the Quarterly Survey of Motor Carriers of Freight
This quarterly survey is designed to gather data on various components of the revenue and expense statements of for-hire motor carriers, broken down by region of domicile, type of services and type of movement.
Section 2 – Findings of the Annual Survey of Motor Carriers of Freight
This annual survey, which is a supplement to round out the fi nancial information provided by the quarterly survey, collects data on the main elements of the balance sheets of for-hire trucking companies, broken down by region of domicile, type of service and size of company. It includes income and expense statements as well as fi nancial ratios such as profi tability, fi nancial leverages and solvency.
1.1 Revenues of trucking companies grew substantially in 2005
Overall, seasonally adjusted operating revenues from for-hire trucking totalled $27.04 billion, up 7% from the $25.24 billion reported in 2004 (see Figure 2.1).4 In 2005, this amounted to an annual average of $6.76 billion in operating revenues per quarter. Also, seasonally adjusted revenues grew steadily during the year, from $6.29 billion in the fi rst quarter to $7.34 billion in the fourth quarter.
Total seasonally adjusted operating expenses stood at $24.87 billion, up 6% from 2004 ($23.42 billion). Average annual seasonally adjusted expenses were $6.22 billion per quarter.
1.2 An industry dependent on the manufacturing sector
By its nature, for-hire trucking is especially sensitive to the overall economic situation, since it is stimulated by demand derived from other industries, notably the manufacturing sector.
In 2005, relatively favourable economic conditions, in particular the growth of wholesale and retail sales, greatly contributed to the demand for freight services. More specifi cally, the increased production and consumption of goods translated into a rise in the demand for transportation of goods.
This link emerges when the growth rates of associated industries are compared. From 2002 to 2005, Canada-based for-hire trucking companies saw their revenues increase by an average of 9.8% per year. During the same period, manufacturing output rose 3.6%, wholesale trade rose 4.7% and retail trade, 4.8%.5
1.3 Operating ratios remain relatively low
Despite increases in expenses, especially those related to wages and fuel purchases (see Section 1.9), for-hire carriers continued to register seasonally adjusted operating ratios that were among the lowest in more than a decade in Canada (see Figure 2.2). The seasonally adjusted quarterly operating ratio was 0.92 for most of 2005. Only the second quarter posted a slight pullback, with a ratio of 0.93.
Section 1
Quarterly Motor Carriers of Freight SurveyOn average, there were 3,356 Canada-based for-hire carriers with annual revenues of $1 million or more in 2005. This is a 5% increase over the 3,197 carriers observed in 2004.

12 Trucking in Canada, 2005 Statistics Canada – Catalogue no. 53-222
0.90
0.91
0.92
0.93
0.94
0.95
0.96
0.97
0.98
1994 1995 1996 1997 1998 1999 2000 2001 2002 2003 2004 2005
Trendline Operating Ratio
Since mid-2004, there has been a major improvement in the profitability of for-hire trucking companies in Canada
Figure 2.2
Note: Trendline is based on fourth quarter moving average.Source: Quarterly Motor Carriers of Freight survey, CANSIM Table 403-0002.
operating ratio
2,0
2,5
3,0
3,5
4,0
4,5
5,0
5,5
6,0
6,5
7,0
7,5
1994 1995 1996 1997 1998 1999 2000 2001 2002 2003 2004 2005
Operating Revenues Operating Expenses
Operating revenues (seasonally adjusted data) passed the $7 billion mark in 2005
Figure 2.1
Source: Quarterly Motor Carriers of Freight Survey, Cansim: Table 403-0002.
$ billion

Statistics Canada – Catalogue no. 53-222 Trucking in Canada, 2005 13
1.4 Differences by carrier size
As with a number of other industries, trucking is characterized by a highly skewed revenue distribution. For example, while they accounted for only 3% of all carriers with revenues of more than $1 million, the top carriers (annual revenues equal to or greater than $25 million) were responsible for 31% of total operating revenues (see Figure 2.3). Conversely, the smallest carriers (those with annual revenues between $1 million and $1.9 million) accounted for one-third of all companies but only 5% of total operating revenues.
1.5 General freight transportation and long-distance trucking remained the sector’s dominant activities
General freight operations generated $15.74 billion in revenue, accounting for 60% of the transportation activities of for-hire carriers in 2005. Of that fi gure, 66% came from the truckload type and 34% from the less-than-truckload type. Among the other major types of freight, other specialized freight accounted for 18% of the sector’s total revenues, followed by liquid bulk at 9% (see Table 2.1).
In comparison with 2004, increases were observed for most of the main types of freight carried. Among the largest increases, 22% were for transportation of less-than-truckload general freight and 18% for other specialized freight. By contrast, transportation of forest products posted a 12% decrease, while other revenues derived from transportation fell 8%.
Overall, the ratio of general freight to specialized freight transported showed little change since 2002. However, there were notable inter-regional variations.
6. Excludes household goods moving data.
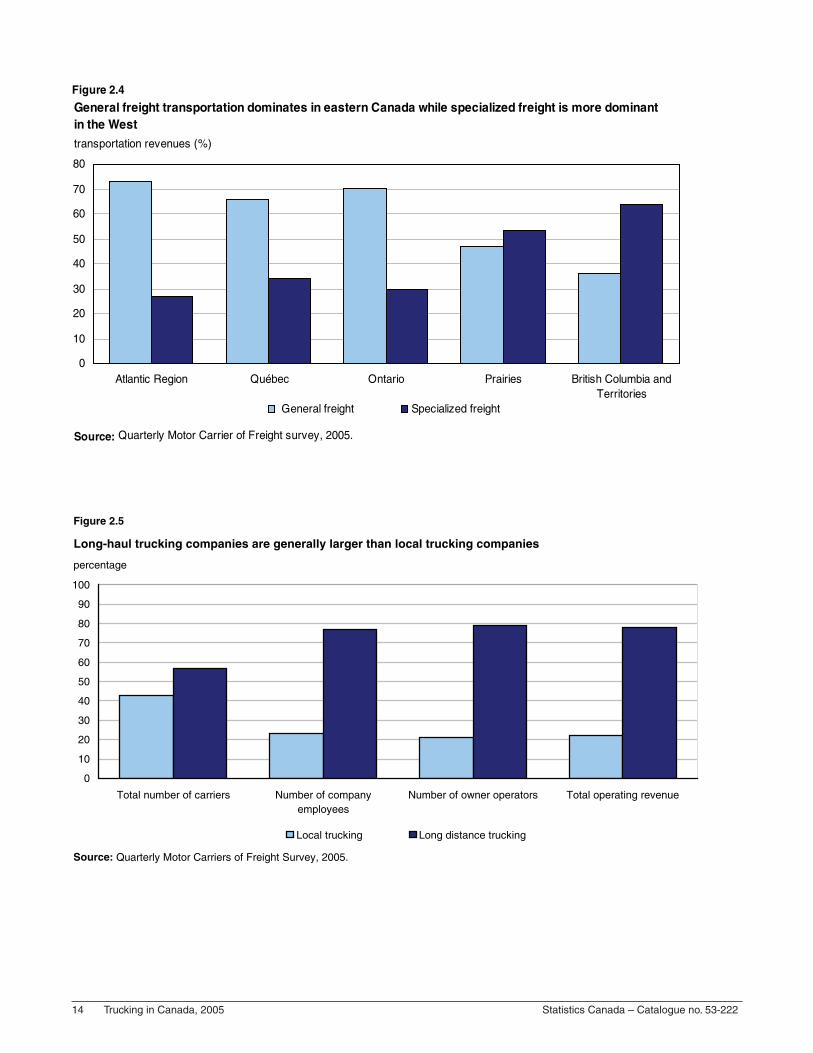
In the Atlantic provinces, Quebec and Ontario, the transportation of general freight accounted for approximately two-thirds of all operating revenues. By contrast, in the Prairies and in British Columbia and the territories, specialized freight accounted for more than half of all revenues (see Figure 2.4).
On the other hand, long-distance trucking, which accounted for 57% of the total number of companies in 2005, captured 78% of total transportation revenues and employed 77% of the total number of company employees and 79% of the total number of owner operators6 (see Figure 2.5). On average, carriers specializing in this type of transportation registered annual operating revenues of $2.90 million per carrier.
Thus, local trucking, which accounted for 43% of the total number of companies, captured 22% of total revenues and employed 23% of the total number of company employees and 21% of the total number of owner operators. On average, carriers specializing in local trucking registered annual operating revenues of approximately $1.07 million per carrier.
1.6 Specialized freight carriers showed a better performance
In each quarter of 2005, specialized freight carriers posted operating ratios at least two percent lower than those of general freight carriers. This situation is not new: since 1994, specialized freight carriers have generally had seasonally adjusted operating ratios slightly lower than those of general freight carriers (see Figure 2.6). However, since the industry is not homogeneous, it may be risky to attribute this situation to a few specifi c factors. More likely, it depends on a combination of inter-related factors, such as the effect of size, the effect of region and the type of transportation.
0
10
20
30
40
50
60
70
80
≥ $1M to < $2M ≥ $2M to < $12M ≥ $12M to < $25M ≥ $25M
Total number of carriers Total operating revenue
While top carriers represented only 3% of all carriers, they accounted for nearly one third of total operating revenues in 2005
Figure 2.3
Carrier size
Source: Quarterly Motor Carrier of Freight survey, 2005.
percentage
14 Trucking in Canada, 2005 Statistics Canada – Catalogue no. 53-222
0
10
20
30
40
50
60
70
80
90
100
Total number of carriers Number of companyemployees
Number of owner operators Total operating revenue
Local trucking Long distance trucking
percentage
Source: Quarterly Motor Carriers of Freight Survey, 2005.
Long-haul trucking companies are generally larger than local trucking companies
Figure 2.5
0
10
20
30
40
50
60
70
80
Atlantic Region Québec Ontario Prairies British Columbia andTerritories
General freight Specialized freight
General freight transportation dominates in eastern Canada while specialized freight is more dominant in the West
Figure 2.4
Source: Quarterly Motor Carrier of Freight survey, 2005.
transportation revenues (%)

Statistics Canada – Catalogue no. 53-222 Trucking in Canada, 2005 15
1.7 Domestic market boosted growth
Since 2002, there has been a shift in the sources of growth in the trucking industry, with domestic transport increasing more rapidly than international transport. Whereas domestic transport grew 13% between 2004 and 2005, international transport remained practically unchanged. The domestic share of transportation revenue went from 64% to 67%, totalling $17.55 billion in 2005 (see Figure 2.7), with intraprovincial trucking accounting for almost two-thirds of this fi gure, compared to approximately 35% for interprovincial trucking. To some extent, the appreciation of the Canadian dollar is probably not unrelated to this situation.
Nevertheless, cross-border activity between Canada, the United States and Mexico continued to play a signifi cant role, accounting for $8.73 billion in revenues.
1.8 Labour costs account for half of total expenses
Overall, the main expense items in 2005 were wages and salaries, with 27% of total expenses, and payments to owner operators, with 23% of total expenses (see Figure 2.8).
Currently there is much talk of a shortage of qualifi ed truckers and high turnover among truckers. In this context, carriers are facing diffi cult choices, because labour costs constitute a large share of total expenses. This means that the wage increases granted in order to attract new truckers or to retain the most qualifi ed ones have a direct impact on companies’ profi tability.
It is also worth noting that if company size is taken into account, there are differences in the breakdown of expenses (see Figure 2.9). For example, among small carriers (those with annual
revenues between $1 million and $2 million), wages and salaries accounted for a sizable share of their operating budget at 35% of their total expenses, whereas payments to owner operators account for only 11%. Conversely, for the top carriers (over $25 million in annual revenues), wages and salaries accounted for just under 25% of total expenses, while payments to owner operators accounted for approximately 27% of total expenses.Something else worth noting in Figure 2.9 is the relative share of fuel expenses by carrier size. Whereas this expense item represents only 8% of the total expenses of top carriers, it instead represents 18% of the smallest carriers’ total expenses. However, it is important to note that payments to owner operators indirectly account for a major share of fuel expenses, and this item is much larger for larger carriers.
1.9 A year characterized by rising energy costs
In comparison with 2004, the largest increases include depreciation (+15%), fuel expenses (+14%), wages and salaries (+10%) and maintenance and garage expenses (+10%).
Fluctuations in fuel prices remained a source of concern for carriers in 2005. Road diesel fuel prices kept rising through most of the year, even reaching their highest levels in more than a decade (see Figure 2.10).
Nevertheless, rising fuel prices do not appear to have had a major impact on carriers’ performance. While the share of total expenses represented by this item went from 11% to 12% between 2004 and 2005, the relatively favourable operating ratios appear to show that carriers have generally managed to do well. Probably contributing to this situation is the increasingly popular commercial practice of imposing a fuel surcharge on shippers.
0,88
0,90
0,92
0,94
0,96
0,98
1994 1995 1996 1997 1998 1999 2000 2001 2002 2003 2004 2005
General Freight Specialized Freight
Specialized freight carriers generally out-perform general freight carriers
Figure 2.6
Source: Quarterly Motor Carrier of Freight survey, 2005.
operating ratio

16 Trucking in Canada, 2005 Statistics Canada – Catalogue no. 53-222
0 5 10 15 20 25 30
Depreciation
Maintenance
Fuel
Purchased transportation
Other expenses
Owner operator payments
Wages and salaries
One of every two dollars spent by trucking companies was related to labour cost
Figure 2.8
Source: Quarterly Motor Carriers of Freight Survey, 2005.
percentage
63 64 64 67
33363637
0
10
20
30
40
50
60
70
80
90
100
2002 2003 2004 2005
Domestic movements International movements
percentage
Source: Quarterly Motor Carriers of Freight Survey, 2005.
The domestic market accounts for a rising share of transportation revenues in Canada
Figure 2.7

Statistics Canada – Catalogue no. 53-222 Trucking in Canada, 2005 17
70
100
130
160
190
220
250
1994 1995 1996 1997 1998 1999 2000 2001 2002 2003 2004 2005
Monthly diesel fuel Price index (excluding taxes and transportation) continued to show strong increases in 2005
Figure 2.10
Source: Diesel Fuel Price Index, Canada, Industrial Product Price Index, Statistics Canada. CANSIM Table 329-0046.
Index 1997=100
0
5
10
15
20
25
30
35
40
Salaries & wages Payments to owneroperators
Fuel (includingfuel tax)
Maintenanceexpenses
Purchasedtransportation
Depreciation andother expenses
≥ $1M to < $2M ≥ $2M to < $12M ≥ $12M to < $25M ≥ $25M
Size of main expense items varies according to carrier size
Figure 2.9
percentage
Source: Quarterly Motor Carriers of Freight Survey, 2005.

18 Trucking in Canada, 2005 Statistics Canada – Catalogue no. 53-222
Table 2.1
Quarterly motor carriers of freight survey, For-hire carriers: summary statistics by quarter, 2005 – Canada Quarter I II III IV
number
Number of carriers surveyed 787.0 789.0 794.0 794.0Estimated total number of carriers 3,309.0 3,333.0 3,376.0 3,406.0 $’000,000 Revenues and expensesGeneral freight : truckload 2,435.5 2,599.4 2,574.8 2,784.3General freight : less than truckload 1,170.0 1,258.3 1,444.7 1,472.6Dry bulk 294.8 303.8 350.3 374.3Liquid bulk 574.0 552.1 554.5 637.1Household goods moving 133.1 153.6 212.1 162.3Forest products 284.7 252.9 268.2 273.2Other specialized freight1 1,157.1 1,087.3 1,220.1 1,281.7Other transportation revenue 83.9 83.9 54.1 59.7Total transportation revenues 6,133.1 6,291.2 6,678.8 7,045.1Other revenues 228.9 270.8 231.0 247.9
Total operating revenues 6,362.0 6,562.0 6,909.8 7,293.0
Salaries and wages2 1,610.2 1,676.5 1,729.3 1,769.7Fuel expenses 697.1 711.2 712.6 777.3Maintenance and garage expenses 438.8 450.3 436.6 457.5Owner-operator expenses 1,358.1 1,305.1 1,434.8 1,537.7Other purchased transportation3 643.0 622.6 667.5 743.0Depreciation 302.6 310.2 333.5 345.7Miscellaneous expenses4 876.0 934.8 967.7 1,091.4
Total operating expenses 5,925.7 6,010.6 6,282.0 6,722.2 Operating ratio 0.93 0.92 0.91 0.92
Seasonally adjusted data Total operating revenues 6,285.8 6,490.1 6,924.3 7,343.5Total operating expenses 5,797.5 5,971.4 6,325.3 6,771.5Operating ratio 0.92 0.93 0.92 0.92 number EmploymentCompany drivers 86,750.0 87,232.0 89,083.0 92,632.0Owner operators 36,891.0 37,324.0 38,014.0 39,429.0Total number of drivers 123,640.0 124,556.0 127,098.0 132,061.0Company employees 139,300.0 143,180.0 146,397.0 150,752.0
Power Units Number of trucks 10,533.0 11,339.0 11,539.0 13,088.0Number of road tractors 71,468.0 72,550.0 69,761.0 71,404.01. Other includes heavy machinery, etc.2. Including employee benefi ts.3. Includes driver services, vehicle lease or rent, total purchased transportation and load broker services.4. Includes terminal expenses and other operating expenses (insurance, administration, etc.)

Statistics Canada – Catalogue no. 53-222 Trucking in Canada, 2005 19
Table 2.2
Quarterly motor carriers of freight survey, for-hire carriers: summary statistics by region, 20055 Atlantic Region Quebec Ontario Quarter I II III IV I II III IV I II III IV
number
Number of Carriers Surveyed 129 130 131 134 149 150 152 153 192 191 190 188Estimated Total Number of Carriers 192 194 195 198 735 747 765 793 1,066 1,052 1,047 1,024 $’000,000
General Freight : Truckload 187.5 223.6 233.8 244.6 571.5 597.4 553.5 592.8 1,068.0 1,077.6 1,133.3 1,223.1General Freight : Less than Truckload 114.2 127.1 141.0 139.5 275.8 301.5 357.6 403.6 562.7 609.6 682.7 682.2Dry Bulk 6.8 12.6 17.3 15.3 59.7 65.5 69.6 76.8 158.7 150.4 156.0 184.0Liquid Bulk 15.0 16.5 16.2 18.2 73.3 110.3 134.3 111.3 137.0 123.7 102.0 120.4Household Goods Moving 9.2 11.4 16.0 10.8 32.9 32.1 47.2 36.1 50.8 50.1 73.1 53.8Forest Products 43.9 31.0 29.8 28.0 82.0 79.8 79.4 82.7 35.6 39.4 39.1 30.0Other Specialized Freight1 54.3 56.5 54.8 57.0 189.0 163.3 155.6 197.5 311.5 369.3 407.7 396.5Other Transportation Revenue 54.3 56.5 54.8 57.0 14.7 11.8 16.4 14.2 29.2 32.8 14.6 7.9
Total Transportation Revenues 432.7 482.5 510.6 515.8 1,298.9 1,361.8 1,413.6 1,514.9 2,353.4 2,452.9 2,608.6 2,697.9Other Revenues 9.6 14.2 9.4 14.2 54.2 58.4 47.7 63.1 97.4 135.1 102.6 94.3
Total Operating Revenues 442.3 496.7 520.0 530.0 1,353.2 1,420.2 1,461.3 1,578.1 2,450.8 2,588.1 2,711.2 2,792.2
Salaries and Wages2 98.5 114.1 117.1 114.9 366.8 398.5 395.7 417.6 633.4 663.2 709.9 705.2Fuel Expenses 40.2 43.0 42.6 43.6 171.0 180.6 180.3 198.2 261.4 280.2 277.6 296.5Maintenance and Garage Expenses 30.2 31.9 28.6 28.3 99.8 108.2 103.3 112.9 159.9 157.2 152.1 151.3Owner-Operator Expenses 112.0 123.6 119.1 122.3 230.5 197.9 213.2 237.5 556.6 494.6 569.3 605.4Other Purchased Transportation3 57.8 61.5 65.0 77.7 129.2 115.9 132.2 156.8 258.8 275.2 271.0 276.4Depreciation 17.5 19.2 22.4 21.0 79.4 82.9 81.2 89.4 116.0 119.7 139.0 132.7Miscellaneous Expenses4 63.9 72.6 80.1 83.6 192.1 213.2 223.4 242.8 321.8 371.1 358.6 405.9
Total Operating Expenses 420.1 466.1 474.9 491.4 1,268.7 1,297.2 1,329.2 1,455.1 2,307.9 2,361.2 2,477.5 2,573.3
Operating Ratio 0.95 0.94 0.91 0.93 0.94 0.91 0.91 0.92 0.94 0.91 0.91 0.92
number
Company Drivers 4,430 4,574 4,863 5,586 20,869 21,337 21,673 23,364 33,834 35,163 36,060 36,389Owner Operators 3,093 3,395 3,270 3,553 6,818 5,938 5,970 6,192 14,832 14,808 15,046 15,884
Total Number of Drivers 7,523 7,968 8,134 9,139 27,687 27,275 27,644 29,556 48,666 49,970 51,106 52,273
See notes at the end of this table.

20 Trucking in Canada, 2005 Statistics Canada – Catalogue no. 53-222
Number of carriers surveyedEstimated total number of carriers
General freight : truckloadGeneral freight : less than truckloadDry bulkLiquid bulkHousehold goods movingForest productsOther specialized freight1Other transportation revenue
Total transportation revenueOther revenues
Total operating revenues
Salaries and wages2
Fuel expensesMaintenance and garage expensesOwner-operator expensesOther purchased transportation3
Depreciation Miscellaneous expenses4
Total operating expenses
Operating ratio
Company driversOwner operators
Total number of drivers
1. Other includes heavy machinery, etc.2. Including employee benefi ts.3. Includes driver services, vehicle lease or rent, total purchased transportation and load broker services.4. Includes terminal expenses and other operating expenses (insurance, administration, etc.)5. Except for fi nancial data, the values shown are averages of the Quarterly data.
Table 2.2
Quarterly motor carriers of freight survey, for-hire carriers: summary statistics by region, 20055 ( concluded) Prairies British Columbia and Territories Canada Quarter I II III IV I II III IV I II III IV
number
229 231 235 233 88 87 86 86 787 789 794 794 917 926 960 978 400 413 409 413 3,309 3,333 3,376 3,406
$’000,000
468.8 543.7 518.7 552.6 139.7 157.1 135.5 171.3 2,435.5 2,599.4 2,574.8 2,784.3 176.9 184.8 205.9 203.4 40.4 35.3 57.4 43.9 1,170.0 1,258.3 1,444.7 1,472.6 55.0 50.0 75.4 78.1 14.7 25.2 32.0 20.1 294.8 303.8 350.3 374.3 282.7 249.7 254.0 330.4 66.0 51.9 47.9 56.8 574.0 552.1 554.5 637.1 17.7 19.7 36.1 26.5 22.5 40.2 39.6 35.1 133.1 153.6 212.1 162.3 65.6 47.4 51.8 54.8 57.6 55.2 68.1 77.7 284.7 252.9 268.2 273.2 445.4 326.0 429.9 438.3 157.0 172.1 172.2 192.4 1,157.1 1,087.3 1,220.1 1,281.7 35.4 27.5 19.0 19.7 2.8 8.0 2.4 15.5 83.9 83.9 54.1 59.7 1,547.3 1,448.9 1,591.1 1,703.6 500.6 545.0 555.0 612.8 6,133.1 6,291.2 6,678.8 7,045.1 51.5 50.8 58.0 62.4 16.3 12.4 13.3 13.8 228.9 270.8 231.0 247.9 1,598.8 1,499.6 1,649.0 1,766.1 516.9 557.4 568.3 626.6 6,362.0 6,562.0 6,909.8 7,293.0 394.7 373.7 385.4 395.1 116.8 127.0 121.2 136.9 1,610.2 1,676.5 1,729.3 1,769.7 169.5 152.4 155.1 174.1 55.0 54.9 57.0 65.0 697.1 711.2 712.6 777.3 113.9 112.9 112.9 124.0 35.1 40.0 39.7 41.0 438.8 450.3 436.6 457.5 339.2 344.1 396.7 432.2 119.9 144.9 136.5 140.5 1,358.1 1,305.1 1,434.8 1,537.7 139.4 109.0 135.9 153.1 57.7 61.1 63.4 79.0 643.0 622.6 667.5 743.0 70.5 69.4 71.2 78.6 19.2 18.9 19.7 24.0 302.6 310.2 333.5 345.7 215.1 207.0 223.1 256.2 83.1 70.9 82.4 102.8 876.0 934.8 967.7 1,091.4 1,442.2 1,368.4 1,480.3 1,613.3 486.9 517.6 520.0 589.1 5,925.7 6,010.6 6,282.0 6,722.2 0.90 0.91 0.90 0.91 0.94 0.93 0.92 0.94 0.93 0.92 0.91 0.92 number 21,451 19,700 20,136 20,220 6,166 6,458 6,351 7,073 86,750 87,232 89,083 92,632 8,917 9,324 10,254 10,323 3,231 3,860 3,474 3,475 36,891 37,324 38,014 39,429 30,368 29,024 30,390 30,546 9,397 10,318 9,824 10,547 123,640 124,556 127,098 132,061

Statistics Canada – Catalogue no. 53-222 Trucking in Canada, 2005 21
Table 2.3
Quarterly motor carriers of freight survey, for-hire carriers: general and specialized freight, by quarter, 20054
Quarter I Quarter II General Specialized General Specialized Freight Freight Total Freight Freight Total
number
Number of Carriers Surveyed 361 426 787 355 434 789Estimated Total Number of Carriers 1,713 1,596 3,309 1,611 1,722 3,333 $’000,000
Total Operating Revenues 3,918.4 2,443.6 6,362.0 4,145.8 2,416.2 6,562.0 Salaries and Wages1 970.9 639.3 1,610.2 1,037.7 638.8 1,676.5 Payments to Owner-Operator 899.1 459.1 1,358.1 857.1 448.0 1,305.1 Fuel Expenses 419.2 277.9 697.1 441.7 269.5 711.2 Maintenance Expenses 242.0 196.8 438.8 234.3 216.0 450.3 Depreciation 183.6 119.0 302.6 187.0 123.1 310.2 Purchased Transportation2 451.4 191.6 643.0 448.2 174.4 622.6 Other Expenses3 521.4 354.6 876.0 587.4 347.4 934.8 Total Operating Expenses 3,687.4 2,238.3 5,925.7 3,793.4 2,217.2 6,010.6 Operating Ratio 0.94 0.92 0.93 0.92 0.92 0.92
number Company Drivers 51,401 35,349 86,750 53,069 34,163 87,232 Owner Operator 24,731 12,160 36,891 24,782 12,542 37,324 Total Number of Drivers 76,132 47,509 123,640 77,851 46,705 124,556See note(s) at the end of this table.

22 Trucking in Canada, 2005 Statistics Canada – Catalogue no. 53-222
Quarter III Quarter IV General Specialized General Specialized freight freight Total freight freight Total number
Number of Carriers Surveyed 364 430 794 355 439 794Estimated Total Number of Carriers 1,641 1,735 3,376 1,662 1,743 3,406 $’000,000
Total Operating Revenues 4,314.7 2,595.1 6,909.8 4,555.9 2,737.1 7,293.0 Salaries and Wages1 1,085.5 643.8 1,729.3 1,122.5 647.1 1,769.7 Payments to Owner-Operator 954.1 480.7 1,434.8 992.1 545.7 1,537.7 Fuel Expenses 434.5 278.1 712.6 481.3 296.0 777.3 Maintenance Expenses 227.6 209.0 436.6 235.3 222.2 457.5 Depreciation 208.8 124.7 333.5 215.9 129.8 345.7 Purchased Transportation2 454.8 212.8 667.5 515.6 227.4 743.0 Other Expenses3 583.5 384.2 967.7 665.4 426.0 1,091.4 Total Operating Expenses 3,948.7 2,333.3 6,282.0 4,228.0 2,494.2 6,722.2 Operating Ratio 0.92 0.90 0.91 0.93 0.91 0.92 number
Company Drivers 54,059 35,024 89,083 57,688 34,944 92,632 Owner Operator 25,575 12,439 38,014 25,735 13,693 39,429 Total Number of Drivers 79,634 47,463 127,098 83,423 48,638 132,0611. Including employee benefi ts. 2. Includes driver services, vehicle lease or rent, total purchased transportation and load broker services.3. Includes terminal expenses and other operating expenses (insurance, administration, etc.). 4. Except for fi nancial data, the values shown are averages of the Quarterly data.
Table 2.3
Quarterly motor carriers of freight survey, for-hire carriers: general and specialized freight, by quarter, 20054 (concluded)

Statistics Canada – Catalogue no. 53-222 Trucking in Canada, 2005 23
Table 2.4
For-hire carriers, revenues by type of movement by quarter, 2005 Quarter I II III IV
number
Number of Carriers in Sample 787 789 794 794Estimated Number of Carriers 3,309 3,333 3,376 3,406
$’000,000 Operating Revenues Domestic Intraprovincial 2,619.2 2,687.7 3,018.5 3,055.7Interprovincial 1,401.0 1,525.0 1,585.6 1,638.0Total - Domestic 4,020.2 4,212.7 4,604.1 4,693.7 International Into Canada 1,085.1 1,081.6 999.6 1,132.7Out of Canada 1,027.8 996.8 1,075.1 1,218.8International 2,112.9 2,078.4 2,074.7 2,351.5 Transportation Revenues 6,133.1 6,291.2 6,678.8 7,045.1Other Revenues 228.9 270.8 231.0 247.9 Operating Revenue 6,362.0 6,562.0 6,909.8 7,293.0

24 Trucking in Canada, 2005 Statistics Canada – Catalogue no. 53-222
Section 2 – Annual Motor Carriers of Freight Survey, 2005
In 2005, the estimated size of the population (annual supplement Q5) was 3,429 carriers compared to 3,114 in 2004, a 10.1% increase.
2.1 According to balance sheets, 2005 was less profi table than 2004 for trucking companies
According to an analysis of the balance sheets of Canada-based for-hire trucking companies with annual revenues of $1 million or more, carriers generally saw their profi tability decline in 2005. For example, their net operating revenues were $1.03 billion, down nearly 30% from 2004. This situation is the result of a greater increase in operating expenses (+11%) than in operating revenues (+8%). The operating profi t margin was also lower than in 2004, dropping from 6.08% to 3.94% (see Table 2.5).
The operating profit margin decreased for carriers in all regions except British Columbia. The greatest decreases were recorded in Ontario and the Atlantic region (see Figure 2.11 and Table 2.6).
Furthermore, all types of activity declined, except movers. Among the largest decreases were the transport of forest products and the transport of other specialized freight (see Figure 2.12 and Table 2.7).
There was also a decline in the profi t margin of carriers in all revenue groups. Carriers with annual revenues between $12 million and $25 million experienced the strongest decrease, followed by carriers with annual revenues between $2 million and $5 million (see Figure 2.13 and Table 2.9).
2.2 Both short-term and long-term solvency deteriorated
For-hire motor carriers of freight saw some deterioration in their short-term solvency. A greater increase in short-term liabilities (+13%) than in short-term assets (+10%) led to a 17 % drop in working capital. This result also explains the decrease in the working capital ratio, which went from 1.120 in 2004 to 1.080 in 2005 (see tables 2.6, 2.7 and 2.9).
By region, declines in working capital were recorded in all regions except British Columbia. The largest declines were registered by carriers based in Ontario and the Atlantic region.
From one year to the next, there were larger variations in working capital by type of activity. For example, liquid bulk transport posted an increase, while general freight transport remained unchanged and the other activities posted declines.
Short-term solvency deteriorated for three of the fi ve revenue groups, the exceptions being small carriers (those with annual revenues between $1 million and $2 million) and the top carriers (annual revenues of more than $25 million).
Long-term solvency, as measured by the long-term debt to shareholders’ equity ratio, also declined, from 0.47 in 2004 to 0.52 in 2005.
On a regional basis, results varied, ranging from 0.47 in British Columbia to 0.60 in the territories. Overall, the ratio increased for all regions except the territories.
0
1
2
3
4
5
6
7
8
Atlantic Quebec Ontario Prairies British Columbia /Territories
Canada
2004 2005
percentage
Source: Annual Survey of Motor Carriers of Freight.
Operating profit margins declined in most regions in 2005
Figure 2.11

Statistics Canada – Catalogue no. 53-222 Trucking in Canada, 2005 25
0
1
2
3
4
5
6
7
8
9
10
General freigth Movers Liquid bulk Dry bulk Forest products Other specializedfreight
2004 2005
percentage
Source: Annual Survey of Motor Carriers of Freight.
Operating profit margin of forest product transportation showed the steepest drop in 2005
Figure 2.12
0
1
2
3
4
5
6
7
8
≥ $1M to < $2M ≥ $2M to < $5M ≥ $5M to < $12M ≥ $12M to < $25M ≥ $25M
2004 2005
percentage
Source: Annual Survey of Motor Carriers of Freight.
Operating profit margins of all revenue groups declined in 2005
Figure 2.13

26 Trucking in Canada, 2005 Statistics Canada – Catalogue no. 53-222
The lowest ratio of long-term debt to shareholders’ equity was for the transport of dry bulk products (0.40), while the highest ratio was for other specialized freight (0.57). This ratio increased for all activities in 2005, except the transport of liquid bulk.
By size, the lowest ratio of long-term debt to shareholders’ equity was for small carriers (those with annual revenues between $1 million and $2 million) and the highest, for the top carriers (annual revenues of more than $25 million). All groups posted increased ratios in 2005, except small carriers (annual revenues between $1 million and $2 million).
2.3 Financial leverage remains positive
In 2005, the return on equity remained substantially higher at 16.3% than the return on capital employed (13.3%). This means that for-hire trucking companies, for an eighth consecutive year, posted a higher return on equity than the interest rate they paid on borrowed funds. This gave them more leeway in fi nancing company operations.
The return on equity exceeded the return on capital employed in all regions and for all types of transport. By company size, the leverage effect was also positive for all revenue sizes, apart from the top carriers (those with annual revenues of more than $25 million) (see tables 2.5, 2.6 and 2.9).
2.4 Carriers owned three-quarters of their service equipment
The annual survey of for-hire motor carriers of freight also gathers information on equipment in service. In 2005, the quantity of equipment in service totalled 203,355 units, for an average of 59 units per carrier.
Overall, 76% of for-hire motor carriers of freight owned their equipment in service. Compared with 2004, the quantity of owned equipment increased 3%, from 150,015 units to 154,443 units, while the quantity of leased equipment jumped 41%, going from 34,717 units in 2004 to 48,912 units in 2005. As a result, the proportion of leased equipment in service increased from 19% to 24%.
By type of activity, leased units in service (semi-trailers and other equipment) represented 28% of the fl eet for general freight carriers but only 15% for specialized freight carriers.
Finally, non-temperature-controlled vans/semi-trailers were the most popular equipment for general freight carriers, with 57% of total equipment, compared to 20% for specialized freight carriers (see Table 2.11).

Statistics Canada – Catalogue no. 53-222 Trucking in Canada, 2005 27
Table 2.5
Annual motor carriers of freight survey, for-hire carriers, summary of fi nancial statistics, 2000-20051
2000 2001 2002 2003 2004 2005
number
Number of Carriers in Sample 765 724 793 748 752 797Estimated Number of Carriers 2,831 2,838 2,909 2,894 3,114 3,425
Balance sheet $’000,000
Current Assets 3,548.5 3,843.1 3,935.2 4,010.2 4,806.2 5,289.4Current Liabilities 3,046.2 3,126.8 3,315.0 3,528.8 4,307.8 4,875.9 Working Capital 502.3 716.3 620.2 481.3 498.4 413.4 Long-Term Assets 5,826.5 6,124.8 6,281.4 5,978.1 7,176.8 8,176.6 Net Assets 6,328.8 6,841.1 6,901.7 6,459.4 7,675.1 8,590.0 Long-Term Liabilities 3,262.2 3,444.1 3,384.0 3,014.6 3,598.8 4,427.3Owner(s) Equity 3,066.0 3,397.0 3,517.7 3,444.9 4,076.4 4,162.7 Long-Term Capital Employed 6,328.2 6,841.1 6,901.7 6,459.4 7,675.1 8,590.0 Income Statement Operating Revenues 17,601.9 19,524.9 19,341.3 20,505.2 24,010.8 26,075.7Operating Expenses 16,672.0 18,405.8 18,317.1 19,600.1 22,550.6 25,047.1 Net Operating Income 929.9 1,119.0 1,024.2 905.1 1,460.3 1,028.6 Other Revenues 555.8 464.0 476.9 603.2 866.3 595.1Other Expenses 734.1 762.5 597.6 729.8 1,355.5 722.0 Net Other Income -183.2 -298.8 -120.6 -126.5 -489.2 -126.9 Net Income before Taxes 746.6 820.2 903.6 778.4 975.3 901.7 Provisions for Income Taxes 201.5 192.8 183.5 205.2 298.5 220.9 Net Income before Extraordinary Items 545.2 627.4 720.2 573.2 676.8 680.8 Extraordinary Items 21.8 96.2 9.4 9.2 8.6 11.0 Net Profi t 523.4 531.2 710.7 564.1 668.2 669.8 Financial ratios percentage
Profi tabilityOperating Profi t Margin % 5.28 5.73 5.30 4.41 6.08 3.94Operating Ratio 0.95 0.94 0.95 0.96 0.94 0.96Return on Assets % 5.82 6.29 7.05 5.74 5.65 5.06 Leverage Return on Equity % 17.78 18.47 20.47 16.64 16.60 16.35Return on Capital Employed % 14.84 15.57 16.38 16.17 15.69 13.32Interest Coverage Ratio 4.88 4.34 4.98 3.92 5.25 4.72 Solvency Working Capital Ratio 1.160 1.230 1.190 1.140 1.120 1.080Long-Term Debt to Equity Ratio 0.520 0.500 0.490 0.470 0.470 0.5201. Data are from the Annual motor carriers of freight survey (Supplement - Q5).

28 Trucking in Canada, 2005 Statistics Canada – Catalogue no. 53-222
Table 2.6
Annual motor carriers of freight survey, for-hire carriers, fi nancial statistics by region, 2005 Atlantic British Canada Region Quebec Ontario Prairies Columbia Territories
number Number of carriers in sample 796 132 146 190 238 82 8Estimated number of carriers 3,425 199 760 1,054 983 420 8
$’000,000 Balance sheet
Current assets 5,289.4 390.9 1,108.1 1,860.1 1,526.9 376.0 27.4Current liabilities 4,875.9 373.2 1,042.2 1,834.9 1,289.3 309.7 26.7
Working capital 413.4 17.7 65.9 25.2 237.7 66.3 0.7
Long-term assets 8,176.6 834.8 1,823.4 2,883.8 1,983.7 607.1 43.8
Net assets 8,590.0 852.4 1,889.4 2,909.0 2,221.3 673.5 44.4Long-term liabilities 4,427.3 423.8 943.5 1,524.2 1,192.3 316.8 26.7Owner(s) equity 4,162.7 428.6 945.8 1,384.8 1,029.1 356.7 17.8
Long-term capital employed 8,590.0 852.4 1,889.4 2,909.0 2,221.3 673.5 44.4
Income statement
Operating revenues 26,075.7 2,056.3 5,482.3 9,672.1 6,490.9 2,227.6 146.5Operating expenses 25,047.1 1,961.5 5,249.8 9,381.6 6,196.3 2,122.1 135.8
Net operating income 1,028.6 94.9 232.5 290.5 294.5 105.5 10.7
Other revenues 595.1 45.2 158.9 208.7 137.9 42.7 1.9Other expenses 722.0 47.0 175.0 293.7 142.9 62.0 1.5
Net other income -126.9 -1.9 -16.1 -85.1 -5.0 -19.3 0.4
Net income before taxes 901.7 93.0 216.5 205.4 289.5 86.2 11.1
Provisions for income taxes 220.9 20.9 56.1 64.4 51.8 24.0 3.7
Net income before extraordinary items 680.8 72.1 160.3 141.1 237.7 62.3 7.4
Extraordinary items 11.0 0.4 2.9 5.5 1.5 0.7 0.0
Net profi t 669.8 71.7 157.4 135.6 236.2 61.6 7.4
percentage Financial ratios
Profi tability Operating profi t margin % 3.94 4.61 4.24 3.00 4.54 4.74 7.30Operating ratio 0.96 0.95 0.96 0.97 0.95 0.95 0.93Return on assets % 5.06 5.88 5.47 2.97 6.77 6.33 10.40
Leverage Return on equity % 16.35 16.81 16.95 10.19 23.09 17.46 41.58Return on capital employed % 13.32 14.69 14.59 10.03 15.08 15.50 27.96Interest coverage ratio 4.72 3.88 4.66 3.38 7.36 5.75 9.48
Solvency Working capital ratio 1.080 1.050 1.060 1.010 1.180 1.210 1.020Long-term debt to equity ratio 0.520 0.500 0.500 0.520 0.540 0.470 0.600

Statistics Canada – Catalogue no. 53-222 Trucking in Canada, 2005 29
Table 2.7
For-hire carriers, summary statistics by type of activity, 2005 Other General Liquid Forest Specialized All Freight Movers bulk Dry bulk products freight Industries
number
Number of carriers in sample 367 78 76 83 43 149 796Estimated total number of carriers 1,814 217 337 363 189 506 3,425 $’000,000 Balance sheet
Current assets 3,272.8 117.0 591.5 323.8 159.5 824.7 5,289.4Current liabilities 3,033.0 96.1 485.4 274.1 135.9 851.6 4,875.9
Working capital 239.9 21.0 106.2 49.6 23.7 -26.9 413.4
Long-term assets 4,815.3 147.6 879.1 740.5 372.1 1,221.9 8,176.6
Net assets 5,055.2 168.6 985.2 790.2 395.8 1,195.0 8,590.0
Long-term liabilities 2,676.0 70.1 495.3 319.3 185.7 680.9 4,427.3Owner(s) equity 2,379.2 98.5 489.9 470.9 210.1 514.1 4,162.7
Long-term capital employed 5,055.2 168.6 985.2 790.2 395.8 1,195.0 8,590.0
Income statement
Operating revenues 16,866.4 711.9 1,889.8 1,438.3 859.2 4,310.0 26,075.7Operating expenses 16,238.4 687.6 1,795.9 1,330.1 854.9 4,140.2 25,047.1
Net operating income 628.1 24.3 94.0 108.1 4.2 169.8 1,028.6
Other revenues 381.6 11.6 60.6 44.6 55.1 41.7 595.1Other expenses 445.5 11.8 62.9 86.5 41.6 73.8 722.0
Net other income -63.8 -0.2 -2.3 -41.9 13.4 -32.1 -126.9
Net income before taxes 564.2 24.1 91.7 66.2 17.7 137.8 901.7
Provisions for income taxes 151.4 3.2 17.3 11.3 5.1 32.6 220.9
Net income before extraordinary items 412.8 21.0 74.4 54.9 12.6 105.1 680.8
Extraordinary items 7.9 0.5 0.7 0.6 0.0 1.3 11.0
Net profi t 404.9 20.5 73.7 54.3 12.6 103.8 669.8
percentage Financial ratios
Profi tabilityOperating profi t margin % 3.72 3.42 4.97 7.52 0.49 3.94 3.94Operating ratio 0.96 0.97 0.95 0.92 1.00 0.96 0.96Return on assets % 5.10 7.92 5.06 5.16 2.37 5.14 5.06
LeverageReturn on equity % 17.35 21.27 15.18 11.66 5.99 20.45 16.35Return on capital employed % 14.26 18.87 11.36 10.83 5.90 14.28 13.32Interest coverage ratio 4.60 4.14 5.54 4.43 4.11 5.19 4.72
SolvencyWorking capital ratio 1.080 1.220 1.220 1.180 1.170 0.970 1.080Long-term debt to equity ratio 0.530 0.420 0.500 0.400 0.470 0.570 0.520

30 Trucking in Canada, 2005 Statistics Canada – Catalogue no. 53-222
Table 2.8
Annual motor carriers of freight survey, for-hire carriers: Financial statistics by local and long distance trucking and type of activity, 2005 Local General Liquid Dry Forest Other freight bulk bulk products specifi cations
number
Number of carriers in sample 117 26 35 16 30Estimated number of carriers 716 173 252 69 157
$ 000,000 Balance sheet
Current assets 730.1 131.8 143.5 51.9 249.9Current liabilities 761.6 76.9 149.6 35.0 186.1
Working capital -31.5 54.9 -6.1 16.9 63.8Long-term assets 998.9 180.1 350.8 105.9 353.0
Net assets 967.4 235.0 344.8 122.8 416.8
Long-term liabilities 489.9 83.6 131.5 61.5 182.9Owner(s) equity 477.5 151.5 213.3 61.3 233.9
Long-term capital employed 967.4 235.0 344.8 122.8 416.8
Income statement
Operating revenues 3,748.9 557.6 716.4 258.7 1,006.6Operating expenses 3,607.1 521.5 665.4 254.4 943.2
Net operating income 141.8 36.1 50.9 4.3 63.3
Other revenues 87.3 14.1 16.2 30.4 14.3Other expenses 95.2 7.3 45.7 29.6 11.0
Net other income -7.9 6.8 -29.5 0.9 3.3
Net income before taxes 133.9 42.8 21.4 5.2 66.7
Provisions for income taxes 19.5 7.6 3.4 1.6 4.1
Net income before extraordinary items 114.4 35.3 18.0 3.6 62.5
Extraordinary items 1.6 0.2 0.4 0.0 0.8
Net profi t 112.8 35.1 17.6 3.6 61.8 percentage Financial ratios
Profi tabilityOperating profi t margin % 3.78 6.47 7.11 1.67 6.29Operating ratio 0.96 0.94 0.93 0.98 0.94Return on assets % 6.62 11.31 3.64 2.30 10.37
LeverageReturn on equity % 23.96 23.29 8.43 5.93 26.74Return on capital employed % 15.96 20.12 8.79 5.93 18.22Interest coverage ratio 7.55 10.60 3.41 3.48 8.21
SolvencyWorking capital ratio 0.960 1.710 0.960 1.480 1.340Long-term debt to equity ratio 0.510 0.360 0.380 0.500 0.440

Statistics Canada – Catalogue no. 53-222 Trucking in Canada, 2005 31
190 60 50 48 27 119 872 225 165 110 120 348
1,625.2 917.5 459.7 180.3 107.6 574.8 1,471.5 799.9 408.5 124.6 100.8 665.5
153.7 117.6 51.2 55.7 6.8 -90.7 2,379.2 1,437.2 699.0 389.7 266.2 869.0 2,533.0 1,554.8 750.2 445.4 273.0 778.3 1,418.0 768.1 411.7 187.8 124.2 498.0 1,115.0 786.7 338.5 257.6 148.7 280.2
2,533.0 1,554.8 750.2 445.4 273.0 778.3
8,697.0 4,420.5 1,332.2 721.9 600.5 3,303.5 8,362.0 4,269.2 1,274.3 664.7 600.6 3,197.0
334.9 151.3 57.9 57.2 -0.1 106.5
172.9 121.4 46.5 28.4 24.6 27.4 261.4 88.9 55.5 40.8 12.1 62.8
-88.5 32.5 -9.0 -12.4 12.6 -35.4
246.5 183.9 48.8 44.8 12.5 71.1
82.3 49.6 9.7 7.8 3.5 28.5
164.1 134.3 39.1 36.9 8.9 42.6
0.3 5.9 0.5 0.2 0.0 0.6
163.8 128.4 38.6 36.8 8.9 42.1
3.85 3.42 4.35 7.92 -0.01 3.22 0.96 0.97 0.96 0.92 1.00 0.97 4.10 5.70 3.37 6.48 2.39 2.9
14.72 17.07 11.55 14.34 6.01 15.20 12.31 16.40 8.61 12.40 5.89 12.18 4.77 3.59 4.10 5.29 4.47 4.00
1.100 1.150 1.130 1.450 1.070 0.860 0.560 0.490 0.550 0.420 0.460 0.640
Table 2.8
Annual motor carriers of freight survey, for-hire carriers: Financial statistics by local and long distance trucking and type of activity, 2005 (concluded) Long distance General General freight freight Liquid Dry Forest Other (TL) (LTL) bulk bulk products specifi cations
number Number of carriers in sampleEstimated number of carriers
$ 000,000 Balance sheet
Current assetsCurrent liabilities
Working capitalLong-term assets
Net assets
Long-term liabilitiesOwner(s) equity
Long-term capital employed
Income statement
Operating revenuesOperating expenses
Net operating income
Other revenuesOther expenses
Net other income
Net income before taxes
Provisions for income taxes
Net income before extraordinary items
Extraordinary items
Net profi t percentage
Financial ratios
Profi tabilityOperating profi t margin %Operating ratioReturn on assets %
LeverageReturn on equity %Return on capital employed %Interest coverage ratio
SolvencyWorking capital ratioLong-term debt to equity ratio

32 Trucking in Canada, 2005 Statistics Canada – Catalogue no. 53-222
Table 2.9
Annual motor carriers of freight survey, for-hire carriers: Financial statistics by revenue size, 2005 ≥ $1m to ≥ $2m to ≥ $5m to ≥ $12m to < $2m < $5m < $12m < $25m ≥ $25m
number
Number of carriers in sample 189 176 157 194 80Estimated number of carriers 1,233 1,111 645 357 80 Balance sheet $’000,000
Current assets 343.7 684.0 845.0 1,946.1 1,470.6 Current liabilities 262.1 546.7 874.0 1,756.2 1,436.9
Working capital 81.6 137.3 -29.0 189.8 33.7
Long-term assets 728.4 1,052.8 1,592.0 2,547.8 2,255.5
Net assets 810.0 1,190.1 1,563.0 2,737.7 2,289.2
Long-term liabilities 317.1 559.6 842.6 1,406.9 1,301.1 Owner(s) equity 492.9 630.4 720.4 1,330.8 988.1
Long-term capital employed 810.0 1,190.1 1,563.0 2,737.7 2,289.2
Income statement
Operating revenues 1,673.2 3,555.0 4,721.7 9,483.1 6,642.7 Operating expenses 1,588.2 3,403.4 4,483.1 9,141.0 6,431.4
Net operating income 85.0 151.5 238.7 342.1 211.3
Other revenues 53.0 125.3 91.5 159.9 165.4 Other expenses 47.4 126.8 128.4 210.9 208.4
Net other income 5.6 -1.6 -36.9 -51.0 -43.0
Net income before taxes 90.6 150.0 201.8 291.1 168.3
Provisions for income taxes 12.4 19.9 42.8 80.9 64.9
Net income before extraordinary items 78.2 130.0 159.0 210.2 103.4
Extraordinary items 2.0 2.1 3.7 2.8 0.5
Net profi t 76.2 127.9 155.4 207.4 102.9 percentage Financial ratios
Profi tability Operating profi t margin % 5.08 4.26 5.05 3.61 3.18 Operating ratio 0.95 0.96 0.95 0.96 0.97 Return on assets % 7.29 7.49 6.52 4.68 2.78
Leverage Return on equity % 15.86 20.63 22.07 15.79 10.47 Return on capital employed % 13.03 14.77 15.19 13.99 10.60 Interest coverage ratio 7.06 6.82 6.66 4.16 3.27
SolvencyWorking capital ratio 1.310 1.250 0.970 1.110 1.020 Long-term debt to equity ratio 0.390 0.470 0.540 0.510 0.570

Statistics Canada – Catalogue no. 53-222 Trucking in Canada, 2005 33
Table 2.10
Annual motor carriers of freight, for-hire carriers: Semi-trailers and other operated equipment by region, 2005 Atlantic British region Québec Ontario Prairies Columbia Territories Canada
Van / Semi-trailer non-temperature controlled 8,687 25,249 40,891 15,393 4,559 342 95,122
Van / Semi-trailer temperature controlled 3,143 5,143 9,608 5,240 2,689 47 25,871
Flatdeck 1,668 6,108 7,844 11,838 2,250 116 29,825
Other trailers1 1,797 7,992 13,293 4,765 3,267 10 31,124
Tank (liquid and dry bulk) 608 2,658 6,383 7,656 802 19 18,126
Other type of equipment 106 895 1,286 921 79 0 3,287
Grand total 16,009 48,046 79,305 45,814 13,647 534 203,355Owned 11,692 37,282 62,586 32,545 9,812 525 154,443Leased 4,317 10,764 16,719 13,269 3,834 9 48,9121. Includes full trailers, dump trailers and container-chassis.
Table 2.11
Annual motor carriers of freight, for-hire carriers: Semi-trailers and other operated equipment by industry, 2005 General freight Specialized freight All industries Owned Leased Owned Leased Owned Leased
Van / semi-trailer non-temperature controlled 60,145 23,391 10,212 1,374 70,358 24,764
Van / semi-trailer temperature controlled 12,474 4,886 5,418 3,093 17,892 7,979
Flatdeck 10,621 8,352 9,739 1,113 20,360 9,465
Other trailers1 18,358 2,828 8,181 1,759 26,539 4,586
Tank (liquid and dry bulk) 3,242 416 13,380 1,087 16,623 1,504
Other type of equipment 971 469 1,701 146 2,672 615
Grand total 105,812 40,342 48,630 8,571 154,443 48,9121. Includes full trailers, dump trailers and container-chassis.

34 Trucking in Canada, 2005 Statistics Canada – Catalogue no. 53-222
Chapter 3Trucking Commodity Origin and Destination Survey, 2004
Canadian for-hire trucking companies, with annual operating revenue of $1 million or more, hauled 65.9 million shipments weighing 604.3 million tonnes in 2004. Long distance carriers accounted for 69% of shipments and 60% of tonnage while local carriers hauled the rest.
The Trucking Commodity Origin and Destination Survey has been redesigned and replaces the For-hire Trucking (Commodity Origin and Destination) Survey. The scope of the survey has been expanded to include the local shipments of long distance carriers and all shipments of local carriers. The sample of shipments has also been substantially increased, primarily through expanded electronic data collection.
The new survey design allows for provincial and territorial origin and destination data, rather than the regional data that could be provided in the past. As well, information about shipments within census metropolitan areas can now be provided for the fi rst time.
Detailed tabulations for 2004 will be available in the summer of 2007.
Data for 2005 are expected to be released in The Daily in the summer of 2007.
For further information regarding the new TCOD Survey please refer to Chapter 5 “Redesign of the Trucking Commodity Origin and Destination Survey” in Trucking in Canada, 2003 Catalogue No. 53-222-XIB.
Table 3.1
For-hire Trucking Activity, 2004
Long distance shipments Local shipments Total
number weight number weight number weight millions million millions million millions million tonnes tonnes tonnes
Long distance carriers 40.2 297.2 5.6 66.1 45.8 363.3
Local carriers 12.4 140.9 7.7 100.1 20.1 241.0
Total 52.6 438.1 13.3 166.2 65.9 604.3
The objective of the survey continues to be measurement of the origin and destination of commodities carried by Canadian for-hire trucking companies. The key variables collected (number of shipments, weight, distance, commodity, tonne-kilometres and revenue) remain unchanged from the previous design. Long distance carriers are those in North American Industrial Classifi cation System 484121, 484122, 484210, 484231, 484232, 484233 and 484239. Local carriers include NAICS 484110, 484221, 484222, 484223 and 484229. Local carriers normally operate within a metropolitan area and its hinterland, while long distance carriers normally operate between metropolitan areas. Long distance shipments are those of 25 kilometres or more in length. Local shipments include those less than 25 kilometres.

Statistics Canada – Catalogue no. 53-222 Trucking in Canada, 2005 35
Chapter 4Survey methodology and data quality
Introduction
This chapter describes the methodology of the surveys of the trucking industry carried out by the Transportation Division of Statistics Canada. Sections 1 and 2 provide, for each survey, descriptions of the target and survey populations, the sample design, and the data processing and estimation methods. Notes for historical comparisons are also provided. In Section 3, the quality of the data presented in this publication is discussed and quality indicators for some key statistics are given.
Several methodology terms (target population, survey population, survey frame, stratifi cation, sampling weight, imputation, etc.) are frequently used in this chapter. Their defi nitions can be found in the Glossary located at the end of this document.
Users who require additional information can obtain details from the Transportation Division upon request (Telephone: 1-866-500-8400, Email: [email protected], Fax: 613-951-0579).
Section 1 Quarterly For-Hire Motor Carriers of Freight (QMCF) Survey and its Annual Supplement (Q5) – Chapter 2
A. Survey Objectives
The principal objective of these surveys is to provide information about the size, structure and economic performance of Canada’s for-hire trucking industry. Financial data are used as inputs to the System of National Accounts. Federal and provincial governments use the data to formulate policies and to monitor the trucking industry in Canada. Trucking companies and associations use the published statistics for benchmarking purposes.
B. Populations
Target Population
The target population for both surveys includes all Canadian domiciled for-hire motor carriers (companies) of freight with annual operating revenues of $1 million or more.
Survey Population
2005 QMCF
The survey population consists of all companies on Statistics Canada’s business register, the Central Frame Data Base (CFDB), classifi ed as for-hire trucking with an annual gross business income value of $1 million or more. The CFDB is a dynamic database, updated on an ongoing basis. Since 1997, the survey population is updated each quarter to refl ect the most up-to-date information on the CFDB.
2005 Q5 Annual Supplement
The survey population consisted of all companies on the CFDB at the end of 2005 classifi ed as for-hire trucking with an annual gross business income value of $1 million or more. This population was slightly more up-to-date than the QMCF fourth quarter survey population.
C. Sample Design
2005 QMCF
A sample of carriers was selected from the survey population for the fi rst quarter of 2005. Sample rotation, except among carriers that have a substantial impact on the survey estimates, was made for the 2005 reference year in order to reduce response burden. Rather than selecting an independent sample in the fi rst quarter of every reference year, the previous year’s fourth quarter sample is rotated to minimize the sample overlap from one year to the next. This sample was then updated each quarter so that it would remain representative of the survey population. Each segment of the industry and each province and territory of Canada was represented in the sample.
The carriers on the fi rst quarter survey frame were fi rst grouped (stratifi ed) according to their province or territory of domicile and their type of activity. Since 1997, the type of activity is defi ned according to the North American Industrial Classification System (NAICS). Then, within each province (or territory)/type of activity combination, the carriers were divided into three size groups (strata). The size was measured by annual gross business income.
For reasons of effi ciency, carriers in the largest size stratum within each province (or territory)/type of activity combination were included in the sample with certainty. Carriers in the remaining size strata were sampled according to a probability mechanism called simple random sampling with rotation, which gives every carrier within the same stratum an equal chance of selection. The number of carriers selected from each stratum is determined such that the total sample size is minimized subject to fi xed levels of precision for estimates of operating revenues, for each province (or territory) and for each type of activity. The coeffi cient of variation, described in Section 3, was used as the measure of precision. All carriers in Newfoundland and Prince Edward Island, as well as in Yukon, Nunavut and Northwest Territories were included in the sample with certainty due to the small number of in-scope carriers in these provinces/territories.
The fi rst quarter sample for 2005 consisted of 1053 carriers representing a survey population of 4427 carriers. Table 4.1 presents the survey population size and sample size for each

36 Trucking in Canada, 2005 Statistics Canada – Catalogue no. 53-222
region of domicile and type of activity. The sample size is presented in parentheses beside the population size. Note that the estimated number of carriers in the popu lation is generally smaller than the survey population, due to out-of-business or out-of-scope units identifi ed during collection that were included in error on the survey frame. For each of the second, third and fourth quarters of 2005, the previous quarter sample was updated so that it would remain representative of the updated survey population for that quarter. Units in the previous quarter sample no longer in the survey population were removed, and a sample of the units new to the survey population for that quarter (births) was added. The births were assigned to the strata defi ned for the fi rst quarter, and a random sample of them was selected from each stratum. The fraction of births selected in each stratum was the same as the fraction of units selected in that stratum for the fi rst quarter.
2005 Q5 Annual Supplement
The 2005 Q5 survey sample was the fourth quarter 2005 QMCF sample, updated to refl ect any changes between the fourth quarter QMCF survey population and the Q5 survey population. Companies no longer in the survey population were removed, and a sample of new units was added (just as is done for each quarter of QMCF). Table 4.2 presents the total survey population size and sample size for each region of domicile and type of activity.
D. Data Collection and Processing
2005 QMCF
At the end of each quarter, a QMCF questionnaire was sent to each sampled carrier. The data were collected by mail-back, facsimile or through computer assisted telephone interviews. The survey data were captured and checked for errors and inconsistencies. Inconsistent, questionable and missing data were referred back to the carrier for clarifi cation or revision. Problems or missing data which could not be resolved with the carrier were then replaced with consistent values (were imputed) using Statistics Canada’s Generalized Edit and Imputation System. The system imputes the data using different imputation rules depending on the type of carrier and the type of data to be imputed. For example, the data can be imputed from historical files (using data from previous QMCF and Q5 surveys), or by using representative data from another carrier. The data were then verifi ed by subject matter specialists.
2005 Q5 Annual Supplement
For the 2005 Q5 survey, the questionnaires were mailed in early spring of 2006. The carriers were asked to report data pertaining to their own 12-month accounting period ending no later than March 31, 2006. The process ing methods were similar to those used for the 2005 QMCF survey.
E. Estimation
Since only a sample of carriers was contacted for the QMCF survey, the individual values were weighted to represent the whole industry within the scope of the survey. The value for each carrier in the sample was multiplied by the sampling weight for that carrier, and then the weighted data from all sampled carriers belonging to a given estimation domain (e.g. general freight in Ontario) were summed to obtain the estimate. The same method was used to produce the estimates for the Q5 survey. Table 4.3 provides quality measures by region and by type of activity, for all four quarters surveyed by QMCF in 2005. Table 4.4 provides for the Q5 survey quality measures by region, by type of activity and by size.
The fi nancial ratios presented in Chapter 2 (e.g. operating ratio) are for-hire trucking industry level ratios. They are calculated by dividing the estimate of one total (e.g. total operating expenses) by another (e.g. total operating revenues). The result may differ somewhat from a ratio calculated as the average of the individual ratios of each carrier.
Notes for Historical Comparisons
– The target population for the 1988 and 1989 QMCF surveys consisted of carriers with annual operating revenues of $250,000 or more.
– The survey frame prior to 1995 was maintained by Transportation Division and updated annually from an administrative fi le of tax fi lers.
– Prior to 1997, the same survey population and sample was used for all four quarters of the reference year for QMCF.
– Prior to 2000, an independent sample was selected in the fi rst quarter and updated for each of the following quarters of the reference year. Since 2000, rather than selecting an independent sample in the fi rst quarter of every reference year, a sample rotation – except among carriers that have a substantial impact on the survey estimates – was performed in order to minimize the sample overlap from one year to the next. The sample rotation thus reduces the response

Statistics Canada – Catalogue no. 53-222 Trucking in Canada, 2005 37
Table 4.1
Quarterly motor carriers of freight survey, for-hire carriers, fi rst quarter, 2005 – Survey population and sample size1 by region and type of activity Type of activity Household General goodsRegion freight movers Bulk Other Total
Atlantic 133 (78) 1 24 (24) 38 (30) 91 (60) 286 (192)
Québec 492 (101) 49 (12) 137 (32) 234 (42) 912 (187)
Ontario 960 (158) 125 (22) 223 (36) 239 (36) 1,547 (252)
Prairies 480 (110) 49 (31) 349 (84) 237 (64) 1,115 (289)
British Columbia and Territories 242 (44) 36 (13) 90 (35) 199 (41) 567 (133)
Total 2,307 (491) 283 (102) 837 (217) 1000 (243) 4,427 (1,053)1. Data in parentheses show sample size.Table 4.1
Table 4.2
2005 motor carriers of freight survey annual supplement (Q5) – Survey population and sample size1 by region and type of activity Type of activity Household General goodsRegion freight movers Bulk Other Total
Atlantic 146 (83) 1 23 (23) 39 (31) 99 (64) 307 (201)
Québec 533 (105) 54 (12) 154 (33) 251 (42) 992 (192)
Ontario 1,009 (163) 135 (22) 244 (41) 257 (38) 1,645 (264)
Prairies 539 (112) 57 (36) 407 (97) 276 (71) 1,279 (316)
British Columbia and Territories 263 (46) 40 (14) 97 (39) 224 (40) 624 (139)
Total 2,490 (509) 309 (107) 941 (241) 1,107 (255) 4,847 (1,112))1. Data in parentheses show sample size.

38 Trucking in Canada, 2005 Statistics Canada – Catalogue no. 53-222
Table 4.3
2005 Quarterly Motor Carriers of Freight Survey - Quality measures by region and by type of activity 1st quarter 2nd quarter Response Revenues Expenses Response Revenues Expenses rate rate Relative CV Relative CV Relative CV Relative CV imputation imputation imputation imputation rate rate rate rate
%RegionAtlantic 51.9 25.2 2.1 25.1 2.1 46.9 28.7 1.9 28.2 1.8Québec 74.5 24.0 6.0 24.1 5.9 70.7 24.6 6.7 24.9 6.6Ontario 58.3 42.3 5.1 42.5 5.0 59.7 42.3 4.7 42.8 4.5Prairies 50.7 43.2 3.8 44.9 3.6 52.4 43.9 4.9 44.1 5.0British Columbia and Territories 47.7 41.6 6.5 41.6 6.6 51.7 42.2 6.9 45.0 6.9
Main type of activityGeneral freight 59.0 36.2 3.7 36.7 3.7 58.6 36.9 4.0 37.4 3.9Specialized freight 55.2 39.3 3.5 39.7 3.3 55.1 39.4 3.9 39.7 3.8
Total 56.9 37.4 2.6 37.8 2.6 56.7 37.8 2.7 38.3 2.6 3rd quarter 4th quarter Response Revenues Expenses Response Revenues Expenses rate rate Relative CV Relative CV Relative CV Relative CV imputation imputation imputation imputation rate rate rate rate %RegionAtlantic 50.4 22.7 1.8 22.7 1.9 50.0 34.4 1.8 34.4 1.8Québec 67.8 29.4 6.1 29.1 6.3 63.4 39.3 5.8 38.7 6.1Ontario 56.3 41.8 5.3 41.9 5.1 58.0 39.6 5.3 40.0 5.1Prairies 48.9 50.6 5.0 51.0 5.3 52.4 47.2 4.3 47.6 4.4British Columbia and Territories 51.2 48.4 6.7 39.4 6.7 51.2 36.3 7.1 35.4 7.2
Main type of activityGeneral freight 56.3 38.4 4.3 38.1 4.2 55.8 40.3 4.2 40.3 4.1Specialized freight 53.5 43.6 3.7 42.3 3.7 54.9 41.4 3.8 41.4 3.8
Total 54.8 40.4 2.8 39.7 2.8 55.3 40.7 2.7 40.7 2.7

Statistics Canada – Catalogue no. 53-222 Trucking in Canada, 2005 39
Table 4.4
2005 Motor Carriers of Freight Survey Annual Supplement (Q5) – Quality measures by region, by type of activity and by size Response Revenues Expenses rate Relative CV Relative CV imputation imputation rate rate
%RegionAtlantic 49.2 28.7 2.3 29.2 2.2Québec 63.0 47.4 6.4 48.1 6.4Ontario 60.0 42.0 5.6 44.6 5.5Prairies 51.7 47.1 5.9 47.8 67.1British Columbia and Territories 53.3 37.6 6.1 37.2 6.2
Type of activityGeneral freight (local) 50.4 48.9 12.3 49.1 12.5General freight (long distance) 63.2 38.2 4.0 38.6 3.9Specialized freight (local) 52.3 51.4 9.7 53.1 9.6Specialized freight (long distance) 52.1 44.9 3.0 48.9 3.0Household goods movers 53.9 53.5 11.0 53.4 11.2
Size (based on total annual opearting revenue)Less than $2,000,000 48.2 57.9 7.6 58.0 7.6$2,000,000 to $4,999,999 47.7 55.8 8.2 56.0 8.2$5,000,000 to $11,999,999 52.9 50.1 9.4 50.8 9.4$12,000,000 and above (excluding top carriers) 58.8 53.1 8.0 53.5 8.0Top carriers 87.5 12.8 0.0 17.0 0.0
Total 55.5 43.0 2.9 44.3 2.9

40 Trucking in Canada, 2005 Statistics Canada – Catalogue no. 53-222
Glossary
Bill of lading. A contract setting out the details for transporting goods from a consignor (shipper) to a consignee (receiver). The bill of lading usually contains a description of the goods, the origin and destination, the weight and the transportation charges.
Commodity. The description of the transported merchandise as recorded on the carrier’s shipping document. This information is encoded according to the Standard Classifi cation of Transported Goods (SCTG).
Current ratio. A measure of liquidity obtained by dividing current assets by current liabilities. This ratio is used to show the ability to pay current debts from current assets.
Destination. The point to which goods were delivered by the fi nal carrier.
Domestic shipment. A shipment whose origin and destination are in Canada.
Fiscal year (Motor Carriers of Freight Survey, Q5 Annual Supplement). Any 12 month period adopted by a carrier as its annual accounting period, ending any time between April 1, 2005 and March 31, 2006.
For-hire carrier. Any carrier which undertakes the transport of goods for compensation.
Freight forwarders. Companies that play an intermediary role between the shipper and the carrier by arranging the transport of freight for a fee. These companies are excluded from this report.
General freight. Freight that is packed (not bulk) and does not need specialized transportation equipment.
Imputation. Procedure of completing a response by using values from one or more records on the same fi le or from external sources. (e.g. historical data on non-respondents, administrative sources, etc.)
Industry activity statistics. Statistics that describe the output of the industry in such terms as tonnes, tonne-kilometres, vehicle kilometres traveled, commodities transported from point to point.
Industry structure statistics. Statistics that describe the size, performance and economic health of the industry, such as revenues, expenses, balance sheets, equipment operated, employment. These are also referred to as input variables.
Intercity shipment (For-hire Trucking Commodity Origin/Destination Survey). A shipment transported for a distance greater than 24 km.
Interest coverage ratio. The number of times a company can meet the interest payments of its creditors. The ratio is calculated by dividing the net income before interest and taxes by the amount of interest paid.
Interline shipment. The movement of a consignment by an initiating carrier to an intermediate point. From this point, a subsequent carrier moves the consignment to another point which may be an intermediate point or the fi nal destination.
International motor carrier. A Canadian-based for-hire or private carrier that operates in the United States, or Mexico.
Interprovincial motor carrier. A for-hire or private carrier that operates in more than one province or territory.
LTL - Less than truckload LTL carriers are characterized by the use of terminals to consolidate shipments, generally from several shippers, into a single truck for haulage between a load assembly terminal and a disassembly terminal, where the load is sorted and shipments are re-routed for delivery.
Leverage. The extent to which the company has been fi nanced by debt.
Local carrier. A company which gains the majority of its revenues by providing trucking services within a metropolitan area and its hinterland, (see NAICS defi nition and For-hire Motor Carriers of Freight-Annual Supplement survey).
Long-distance carrier. A company which gains the majority of its revenues by providing trucking services between metropolitan areas (see NAICS defi nition and For-hire Motor Carriers of Freight-Annual Supplement survey).
Long-term debt ratio. The percentage of capital provided by creditors. This ratio is used as a measure of solvency and is obtained by dividing long term liabilities by long term liabilities plus total owner’s equity.
North American Industrial Classifi cation System (NAICS). Classifi cation system developed in 1997 which allows the reporting of an integrated system of economic statistics by breaking down Canada’s total economic production into industries. Trucking industries (Industry Group 484) are establishments primarily engaged in the truck transportation of goods. This industry group is a part of the Major Groups 48-49 (Transportation, Warehousing and Storage industries) which include establishments primarily engaged in transporting passengers and goods, warehousing and storing goods, and providing services to these establishments. The modes of transportation are road (trucking, transit and ground passenger), rail, water, air and pipeline.

Statistics Canada – Catalogue no. 53-222 Trucking in Canada, 2005 41
Operating expenses. Operating expenses include expenses incurred in carrying motor carrier freight operations only. These generally exclude non-operating expenses such as capital loss, interest paid, etc.
Operating ratio. The proportion of operating revenues absorbed by operating expenses. Calculated by dividing operating expenses by operating revenues. Operating revenues. Operating revenues include revenues pertaining to the motor carriers of freight operations only. These correspond to the total amount billed by the carrier and exclude revenues earned by other carriers in the case of interline shipments.
Origin. The point at which goods were received by the initial road carrier. Road carrier in this context includes piggyback (a rail movement where the transport of goods is in highway trailers/containers on railway cars).
Owner operators. Owner Operators own/lease one or more power units and provide hauling services under contract to for-hire or private carriers.
Private carrier. A company whose principal occupation is not trucking but maintains its own fl eet of vehicles (owned or leased) for transporting its own freight.
Probill. A document which is made by the trucking company from the bill of lading. It is a company control document describing the handling of a shipment of goods and usually contains information on origin, destination, commodity description, weight (or other measurement), rate, revenues and interlining. A probill is sometimes referred to as a waybill.
Profi t margin. The percentage of profi t earned from each revenue dollar. It is obtained by dividing net income after taxes by total revenues and multiplying by 100.
Province or territory of domicile. The province or territory where the head offi ce of the carrier is located.
Relative imputation rate. The proportion of the corresponding published estimate that is accounted for by the imputed data.
Response rate. The number of carriers that gave complete or partial answers to the survey divided by the total number of carriers in-scope for the survey (cases resolved and unresolved).
Return on assets. A measure of profi tability, calculated as a percentage and obtained by dividing net income after taxes by total assets and multiplying by 100.
Return on equity. A measure of the fi nancial return to owners of a business. Calculated by dividing net income before extraordinary items by owner’s equity.
Return on long-term capital employed. Measures the fi nancial return to the providers of long term capital and is obtained by dividing net income before interest and taxes by the sum of long term liabilities plus owner’s equity.
Sampling. A procedure used to select randomly a part of a group for examination. Rather than examining an entire group referred to as the population or universe, one may examine a part of the group called a “sample”.
Sampling weight. A raising factor attached to each sampled unit to obtain estimates for the population from a sample. The basic concept of the sampling weight can be explained by using the representation rate. For example, if 2 units are selected out of 10 population units at random, then each selected unit represents 5 units in the population including itself, and is given the sampling weight of 5. A survey with a complex sample design requires a more complicated way of calculating the sampling weight. However, the sampling weight is still equal to the number of units in the population the unit represents.
Shipment (For-hire Trucking Commodity Origin/Destination Survey). A quantity of merchandise transported by a for-hire carrier from one person or organization (consignor or shipper) to another person or organization (consignee or receiver).
Shipping document. Any document recording the transportation of goods by a carrier, which can be sampled. A probill (waybill), bill of lading, load manifest, trip report, invoice, or the individual records of a summary sheet or tape are considered to be shipping documents.
Stratification. A non-overlapping partition of the survey population into relatively homogeneous groups with respect to certain characteristics such as geographical and industrial classifi cation, size, etc. These groups are called strata and are used for sample allocation and selection.
Survey frame. A list of all units in the survey population (e.g. carriers, shipments) that carries the contact (e.g., name, address) and the classifi cation information (e.g. industrial, geographical and size) of the units to be surveyed.
Survey population. Collection of all units (e.g. carriers, shipments) for which the survey can realistically provide information. The survey population may differ from the target population due to the operational diffi culty in identifying all the units that belong to the target population.
Target population. Collection of all units (e.g. carriers, shipments) for which the information is required.
Tonne-kilometre. An expression of weight (mass) multiplied by distance from origin to destination for each shipment. This is the standard output measure of the trucking industry.
Top carriers. A group of for-hire motor carriers of freight with annual revenues of $25 million and more per carrier.
Trip report. A statement giving details of at least one trip of a transport vehicle detailing the origin, destination, commodity, weight (or other measurement), rate, revenues and interlining. It may include both inbound and outbound journeys.
Truckload (TL) A shipment generally devoted to the goods of a single shipper, taken directly from a point of origin to one or more destination points.
Weight (Mass). An expression of the weight of goods shipped as noted on the shipping document. Liquids, gases, pieces and other items not rated on a weight basis are assigned weights from a conversion table.
Working capital ratio. This ratio examines the relationship of current assets to current liabilities. It measures the ability to pay short-term debts easily when they become due.

42 Trucking in Canada, 2005 Statistics Canada – Catalogue no. 53-222
Defi nitions of fi nancial ratios
Profi tability
Net operating incomeOperating profi t margin (%) = X 100 Operating revenue
Operating expensesOperating ratio = Operating revenue
Net income before extraordinary itemsReturn on assets (%) = X 100 Total assets
Leverage
Net income before extraordinary itemsReturn on equity (%) = X 100 Owner’s equity
Net income before tax and interestReturn on capital employed (%) = X 100 Long term capital employed
Net income before tax and interestInterest coverage ratio = Interest expenses
Solvency
Current assetsWorking capital ratio = Current liabilities
Long-term debtLong-term debt to equity ratio = Long term capital employed

Statistics Canada – Catalogue no. 53-222 Trucking in Canada, 2005 43
How to get the economic facts and analysis you need on transportation!
Available from the Transportation Division are...
• key fi nancial operating statistics and commodity and/or passenger origin-destination data for the trucking, bus, marine, rail and air transport industries;
• special tabulations and analytical studies tailored to your business needs on a cost-recovery basis;
• service bulletins providing preliminary release data, intermodal comparisons, etc.
Get the facts! Find out how the Transportation Division can help you meet your information needs by contacting:
Client Services Unit Transportation Division Statistics Canada 150 Tunney’s Pasture DrivewayMain Bldg. Room 1506Ottawa, OntarioK1A 0T6
Telephone: 1-866-500-8400Facsimile: 613-951-0009 Internet: [email protected]

44 Trucking in Canada, 2005 Statistics Canada – Catalogue no. 53-222
For further reading
Selected publications from Statistics Canada
Catalogue no. Title
50-002-XIE Surface and Marine Transport - Service Bulletin
51-004-XIE Aviation - Service Bulletin
51-203-XIE Air Carrier Traffi c at Canadian Airports – Annual
51-205-XIE Air Passenger Origin and Destination, Canada-United States Report - Annual
51-207-XIE Air Charter Statistics - Annual
52-001-XIE Railway Carloadings - Monthly
52-216-XIE Rail in Canada - Annual
53-222-XIE Trucking in Canada - Annual
53-223-XIE Canadian Vehicle Survey - Annual
54-205-XIE Shipping in Canada - AnnualThese products are available for free in electronic format. To obtain a single issue, visit our website at www.statcan.ca and select Publications, or phone toll-free 1-800-263-1136 or 1-613-951-8116.