truck traffic analysis using weigh-in-motion (wim) … traffic analysis using weigh-in-motion (wim)...
TRANSCRIPT

DRAFT
Truck Traffic Analysis using Weigh-In-Motion (WIM) Data in
California
by
Q. Lu, J. Harvey, T. Le, J. Lea, R. Quinley, D. Redo, J. Avis
June 2002
University of California, BerkeleyInstitute of Transportation Studies
Pavement Research Center

ii

iii
TABLE OF CONTENTS
Table of Contents ...........................................................................................................................iii
List of Figures ................................................................................................................................. v
List of Tables.................................................................................................................................. ix
Executive Summary ...................................................................................................................... 11
1.0 Introduction ....................................................................................................................... 15
1.1 Background ....................................................................................................................... 15
1.2 Objectives of This Study................................................................................................... 18
1.3 Scope of This Report......................................................................................................... 19
2.0 Discussion of Data Handling............................................................................................. 25
2.1 WIM systems..................................................................................................................... 25
2.2 Data Sampling Method...................................................................................................... 26
2.3 Computer Programs........................................................................................................... 28
2.4 ASCII format..................................................................................................................... 28
2.5 Erroneous Data.................................................................................................................. 31
2.5.1 Records with Non-zero Violation Codes .................................................................. 31
2.5.2 Records with Zero Violation Codes .......................................................................... 31
2.6 Assumptions Used in Analysis.......................................................................................... 34
2.7 Data Analysis .................................................................................................................... 35
3.0 Analysis of Observed Data................................................................................................ 37
3.1 Generalized Axle Load Spectra and Truck Composition in California ............................ 37
3.2 Generalized Axle Load Spectra in Different Regions....................................................... 42
4.0 Truck Traffic Data Analysis of Six WIM Sites................................................................. 49
4.1 Axle Load Spectra Analysis.............................................................................................. 49
4.1.1 Axle Load Spectra on All Lanes ............................................................................... 49
4.1.2 Axle Load Spectra for Each Lane ............................................................................. 53
4.1.3 Axle Load Spectra by Year ....................................................................................... 53
4.2 Truck Traffic Volume Analysis ........................................................................................ 60
4.2.1 Traffic distribution between day and night ............................................................... 60
4.2.2 Traffic Seasonal Distribution .................................................................................... 64
4.2.3 Traffic Distribution by Lane ..................................................................................... 66

iv
4.2.4 Traffic Growth Trend Analysis ................................................................................. 66
4.3 Side Wheel Load Difference Analysis .............................................................................. 76
4.4 Truck Speed Analysis........................................................................................................ 76
4.5 Truck Gross Weight Analysis ........................................................................................... 79
5.0 Comparison of Truck Traffic among Sites........................................................................ 89
6.0 Conclusions and Recommendations.................................................................................. 95
6.1 Summary ........................................................................................................................... 95
6.2 Conclusions Regarding Axle Load Spectra ...................................................................... 96
6.2.1 Analysis of the Full Data Set..................................................................................... 96
6.2.2 Conclusions from Analysis of the Six Representative WIM Sites: Axle Load
Spectra, Truck Traffic Volumes, and Equivalent Single Axle Loads (ESALs) .................... 98
6.2.3 Conclusions from Analysis of the Six Representative WIM Sites: Truck Speeds and
Gross Vehicle Weights........................................................................................................... 99
6.3 Conclusions Regarding Extrapolation of WIM Data to Adjacent Sites............................ 99
6.4 Recommendations for the Use of the WIM Database..................................................... 100
6.5 Recommendations for Improving the Capability of the WIM Data Collection System . 101
7.0 References ....................................................................................................................... 103
Appendices .................................................................................................................................. 109

v
LIST OF FIGURES
Figure 1. Distribution of WIM stations on California state highway network in March 2001.... 20
Figure 2. Common configuration of WIM system....................................................................... 26
Figure 3. Typical vehicle profiles for Caltrans truck type. .......................................................... 33
Figure 4. General steering axle load spectra across all dates and locations................................. 38
Figure 5. General single axle load spectra across all dates and locations. ................................... 38
Figure 6. General tandem axle load spectra across all dates and locations.................................. 39
Figure 7. General tridem axle load spectra across all dates and locations. .................................. 39
Figure 8. General steering axle load spectra at different times. ................................................... 40
Figure 9. General single axle load spectra at different times. ...................................................... 40
Figure 10. General tandem axle load spectra at different times................................................... 41
Figure 12. General truck traffic compositions (day, night, and 24-hour). ................................... 43
Figure 13. General truck traffic compositions (yearly, wet season, spring season, and wet season
averages)................................................................................................................................ 43
Figure 14. Steering axle load spectra in three regions. ................................................................ 44
Figure 15. Single axle load spectra in three regions. ................................................................... 44
Figure 16. Tandem load spectra in three regions. ........................................................................ 45
Figure 17. Tridem load spectra in three regions........................................................................... 45
Figure 18. Steering axle load spectra in two areas. ...................................................................... 46
Figure 19. Single axle load spectra in two areas. ......................................................................... 46
Figure 20. Tandem load spectra in two areas............................................................................... 47
Figure 21. Tridem load spectra in two areas. ............................................................................... 47
Figure 22. Axle load spectra, Station 2 (Redding), steering axle................................................. 50
Figure 23. Axle load spectra, Station 2 (Redding), single axle.................................................... 50
Figure 24. Axle load spectra, Station 2 (Redding), tandem axle. ................................................ 51
Figure 25. Axle load spectra, Station 2 (Redding), tridem axle................................................... 51
Figure 26. Axle load spectra by lane, Station 2 (Redding), steering axle. ................................... 54
Figure 27. Axle load spectra by lane, Station 2 (Redding), single axle. ...................................... 54
Figure 28. Axle load spectra by lane, Station 2 (Redding), tandem axle..................................... 55
Figure 29. Axle load spectra by lane, Station 2 (Redding), tridem axle. ..................................... 55
Figure 30. Axle load spectra by year, Station 2 (Redding), steering axle.................................... 56

vi
Figure 31. Axle load spectra by year, Station 2 (Redding), single axle....................................... 56
Figure 32. Axle load spectra by year, Station 2 (Redding), tandem axle..................................... 57
Figure 33. Axle load spectra by year, Station 2 (Redding), tridem axle. ..................................... 57
Figure 34. Load spectra coefficients at Station 2 (Redding) by year for all four axle groups. .... 58
Figure 35. General load spectra coefficients across all stations in California in each year 1991
through 2000. ........................................................................................................................ 58
Figure 36. Percentage of trucks operating in the daytime, Station 2 (Redding). ......................... 61
Figure 37. Percentage of trucks operating in the daytime, Stations 17 and 18 (Hayward).......... 61
Figure 38. Percentage of trucks operating in the daytime, Station 21 (Mojave).......................... 62
Figure 39. Percentage of trucks operating in the daytime, 47 and 48 (Castaic)........................... 62
Figure 40. Percentage of trucks operating in the daytime, Stations 57 and 58 (Pinole). ............. 63
Figure 41. Percentage of trucks operating in the daytime, (Bowman)......................................... 63
Figure 42. Percentage of trucks operating in the daytime, (Redding).......................................... 64
Figure 43. Seasonal average daily truck volume (both directions), Site 1 (Station 2, Redding). 65
Figure 44. Seasonal averaged daily truck volume (both directions), Site 2 (Stations 17 and 18,
Hayward). .............................................................................................................................. 65
Figure 45. Truck traffic distribution by lane, Site 1 (Station 2, Redding), Southbound.............. 68
Figure 46. Truck traffic distribution by lane, Site 1 (Station 2, Redding), Northbound.............. 68
Figure 47. Truck traffic distribution by lane, Site 2 (Stations 17 and 18, Hayward), Southbound.
............................................................................................................................................... 69
Figure 48. Truck traffic distribution by lane, Site 2 (Stations 17 and 18, Hayward), Northbound.
............................................................................................................................................... 69
Figure 49. Daily truck volume and ESALs at Site 1 (Station 2, Redding). ................................. 70
Figure 50. Daily truck volume and ESALs at Site 2 (Stations 17 and 18, Hayward). ................. 70
Figure 51. Daily truck volume and ESALs at Site 3 (Station 21, Mojave).................................. 71
Figure 52. Daily truck volume and ESALs at Site 4 (Stations 47 and 48, Castaic)..................... 71
Figure 53. Daily truck volume and ESALs at Site 5 (Stations 57 and 58, Pinole). ..................... 72
Figure 54. Daily truck volume and ESALs at Site 6 (Station 72, Bowman). .............................. 72
Figure 55. Annual average daily truck traffic (AADTT) at Site 1 (Station 2, Redding). ............ 74
Figure 56. Annual average daily truck traffic of each truck type at Site 1 (Station 2, Redding). 74

vii
Figure 57. Side wheel load difference ratio distribution, Site 1 (Station 2, Redding),
Southbound. .......................................................................................................................... 77
Figure 58. Side wheel load difference ratio distribution, Site 1 (Station 2, Redding),
Northbound............................................................................................................................ 77
Figure 59. Speed distribution of each truck type at Site 1 (Station 2, Redding), Southbound. ... 78
Figure 60. Speed distribution of each truck type at Site 1 (Station 2, Redding), Northbound. ... 78
Figure 61. Truck gross weight distribution for Truck Type 4 at Site 1 (Station 2, Redding),
Northbound............................................................................................................................ 81
Figure 62. Truck gross weight distribution for Truck Type 5 at Site 1 (Station 2, Redding),
Northbound............................................................................................................................ 81
Figure 63. Truck gross weight distribution for Truck Type 6 at Site 1 (Station 2, Redding),
Northbound............................................................................................................................ 82
Figure 64. Truck gross weight distribution for Truck Type 7 at Site 1 (Station 2, Redding),
Northbound............................................................................................................................ 82
Figure 65. Truck gross weight distribution for Truck Type 8 at Site 1 (Station 2, Redding),
Northbound............................................................................................................................ 83
Figure 66. Truck gross weight distribution for Truck Type 9 at Site 1 (Station 2, Redding),
Northbound............................................................................................................................ 83
Figure 67. Truck gross weight distribution for Truck Type 10 at Site 1 (Station 2, Redding),
Northbound............................................................................................................................ 84
Figure 68. Truck gross weight distribution for Truck Type 11 at Site 1 (Station 2, Redding),
Northbound............................................................................................................................ 84
Figure 69. Truck gross weight distribution for Truck Type 12 at Site 1 (Station 2, Redding),
Northbound............................................................................................................................ 85
Figure 70. Truck gross weight distribution for Truck Type 13 at Site 1 (Station 2, Redding),
Northbound............................................................................................................................ 85
Figure 71. Truck gross weight distribution for Truck Type 14 at Site 1 (Station 2, Redding),
Northbound............................................................................................................................ 86
Figure 72. Truck gross weight distribution for Truck Type 15 at Site 1 (Station 2, Redding),
Northbound............................................................................................................................ 86
Figure 73. Average yearly truck gross weight at Site 1 (Station 2, Redding), Northbound. ....... 87

viii
Figure 74. Annual growth rate of truck gross weight at six WIM sites. ...................................... 87
Figure 75. The six WIM station groups used in comparison. ...................................................... 91
Figure 76. Comparison of load spectra coefficients from Group 1.............................................. 92
Figure 77. Comparison of load spectra coefficients from Group 2.............................................. 92
Figure 78. Comparison of load spectra coefficients from Group 3.............................................. 93
Figure 79. Comparison of load spectra coefficients from Group 4.............................................. 93
Figure 80. Comparison of load spectra coefficients from Group 5.............................................. 94
Figure 81. Comparison of load spectra coefficients from Group 6.............................................. 94

ix
LIST OF TABLES
Table 1 Summary of Basic Information for Each WIM Station in California ........................... 21
Table 2 Fields in ASCII Data Files ............................................................................................ 30
Table 3 WIM Vehicle Classification Parameters ....................................................................... 32
Table 4 WIM Station Location Groupings................................................................................. 48
Table 5 Descriptions of Six WIM Sites Selected as Representative Examples ......................... 49
Table 6 Load Spectra Coefficients for Site 1 (Station 2, Redding)............................................ 52
Table 7 Load Spectra Coefficients for Site 2 (Stations 17 and 18, Hayward) ........................... 52
Table 8 Load Spectra Coefficients for Site 3 (Station 21, Mojave) ........................................... 52
Table 9 Load Spectra Coefficients for Site 4 (Stations 47 and 48, Castaic) .............................. 52
Table 10 Load Spectra Coefficients for Site 5 (Stations 57 and 58, Pinole)................................ 52
Table 11 Load Spectra Coefficients of Site 6 (Station 72, Bowman) .......................................... 53
Table 12 Load Spectra Coefficients of Site 1 (Station 2, Redding) by Lane ............................... 59
Table 13 Load Spectra Coefficients of Site 2 (Stations 17 and 18, Hayward) by Lane............... 59
Table 14 Load Spectra Coefficients of Site 3 (Station 21, Mojave) by Lane .............................. 59
Table 15 Load Spectra Coefficients of Site 4 (Stations 47 and 48, Castaic) by Lane ................. 59
Table 16 Load Spectra Coefficients of Site 5 (Stations 57 and 58, Pinole) by Lane ................... 59
Table 17 Load Spectra Coefficients of Site 6 (Station 72, Bowman) by Lane ............................ 60
Table 18 Truck Traffic Distribution by Lane............................................................................... 67
Table 19 Estimated Annual Growth Rate of Truck Traffic Volume at 6 WIM sites ................... 75
Table 20 Average Speed Of Each Truck Type at 6 WIM Sites ................................................... 79
Table 21 Annual Growth Rate of Truck Gross Weight at Six WIM Sites. .................................. 80
Table 22 Six WIM Station Groups Compared ............................................................................. 89
Table 23 Load Spectra Coefficient and AADTT of Six WIM Station Groups............................ 90

x

11
EXECUTIVE SUMMARY
This report is based on truck traffic data collected during 1991 to early 2001 from all the
Weight in Motion (WIM) stations on the California State highway network. The entire set of
data was obtained, sampled, and cleaned before subsequent analysis.
The objectives of the studies reported herein were as follows:
• develop axle load spectra for various axle groups of each truck type and compare
these load spectra among various locations and time periods;
• determine truck traffic volume and load growth trends using regression methods;
• characterize past truck traffic loading patterns, including truck speeds, gross weights,
and side wheel load differences;
• check the possibility of extrapolation of available truck traffic data to sites where
WIM stations are not installed.
Chapter 2 provides a summary of data preparation and analysis techniques. Chapter 2
also includes a brief introduction to WIM systems, description of the WIM data structure, data
sampling and cleaning methods, and assumptions used in the analysis.
The data were sampled and cleaned in such a way that all the data used in the analysis
were those that had been checked for validity by Caltrans and did not include identifiable
erroneous records.
Chapter 3 reports the results of analysis of combined data from all the WIM stations
across the entire analysis period. It shows that the generalized load spectra of all four axle
groups became heavier at night than in the daytime, but had little seasonal variation. It also
shows that the axle load spectra in Central Valley were heavier than those in the Bay Area and

12
Southern California, and that the axle load spectra in rural areas were heavier than those in urban
areas.
Chapter 4 contains the results of analysis of data from six representative WIM sites. It
includes the comparison of axle load spectra for various directions, lanes, years, and day versus
night. Chapter 4 also contains the comparison of truck traffic volume for day versus night,
among seasons, and among lanes. The growth trends of truck traffic volumes were estimated
using linear and non-linear regression methods. Side wheel load variation, truck speed
distribution, truck gross weight distribution, and yearly variation also included in this chapter.
The results show that the axle load spectra were similar for both directions of travel, but
varied among lanes. The load spectra at night were generally heavier than those in the daytime.
The load spectra didn’t show much yearly variation, but the load spectra coefficients changed
with time, especially for tandem and tridem axle groups. An increasing trend of truck volumes
was observed from each WIM station, and can be fitted with linear regression modeling. The
load difference between wheels on each end of the same axle(s) was very small and can possibly
be ignored in pavement design. The speed of each truck type had a narrow distribution, ranging
mainly from 80 km/h to 112 km/h. The gross weight of each truck type did not show appreciable
yearly change.
Chapter 5 includes the comparison of axle load spectra and truck traffic volume among
some WIM stations grouped by their close proximity to each other. The results show that it is
possible to extend axle load spectra at available WIM stations to adjacent sites, if the
extrapolation is made judiciously. The truck traffic volume, however, usually changes
significantly from site to site, and can not be extrapolated.

13
Chapter 6 includes the conclusions and recommendations of the study. It is
recommended that adequate resources be provided to perform regular quality assurance checks at
all WIM stations. This is essential if the tremendously valuable WIM data will continue to be
accurately collected in the future.

14

15
1.0 INTRODUCTION
1.1 Background
Pavements are damaged by the environment and by traffic, and by the interaction of the
two. Highway pavements sustain nearly all the traffic-related damage from trucks and nearly
none from automobiles. Until relatively recently, truck traffic data have typically been
aggregated into equivalent repetitions of a standard axle load (ESAL) for pavement design for
two reasons:
• Pavement design methods required relatively simple computations in order to be
widely implemented in the absence of high-speed computers, axle load database
storage capacity, and low-cost methods of collecting detailed truck traffic load data,
and
• Empirical pavement design methods did not analyze pavement damage in terms of
specific distress models, therefore, it was not necessary to calculate the different
damage rates for each distress mode caused by a given axle load.
The increasing sophistication of pavement distress models used in mechanistic pavement
design methods requires more detailed truck traffic information in order to take full advantage of
their increased predictive capability. At the same time, computing speed, database storage, and
access to databases have improved to the point that highly detailed truck traffic information can
be easily stored, organized, and readily used for pavement design.
The Portland Cement Association (PCA) method of rigid pavement design recognized the
need for detailed data early, and has used detailed axle load spectrum data since 1966.(1) The
AASHTO 2002 methods for rigid and flexible design use axle load spectra.(2) Mechanistic
pavement design procedures being developed for the California Department of Transportation

16
(Caltrans) by the University of California Pavement Research Center (UCPRC) (which will
make use of some AASHTO 2002 models) will also make use of axle load spectra in cases for
which that level of detail is required.
With its Weigh-In-Motion (WIM) systems, Caltrans collects all the data needed for axle
load spectra, but currently only uses it to calculate the Traffic Index (TI) used in the current
Caltrans pavement design procedures. This quick and readily understood number provides a
good general indication of traffic loading. The Traffic Index is calculated using the following
formula:
TI = 9.0 × (ESAL/106)0.119 (1)
where:
T = Traffic Index,ESAL = Equivalent 80-kN Single Axle Loads, calculated by:
�
��
�
�
���
���
�
××=
2.4
)(80)(__
KNnKNloadgroupaxlenESAL (2)
where:
n = 1 for steering and single axle group, 2 for tandem axle group, 3 for tridemaxle group.
= summation on all axle group loads expected in the design life of thepavement.
An axle load spectrum is the load distribution of an axle group during a period of time.
The equation for converting spectra into ESALs is based on an average across all pavement
types, (i.e., rigid and flexible), and all distress mechanisms, (i.e., faulting and cracking in rigid
pavements and cracking and rutting in flexible pavements), and ride quality across all
pavements. It is well known that different pavement types and different distress mechanisms are
affected at different rates by the same axle load, information that is lost by converting to ESALs.

17
For example, transverse cracking in rigid pavements is mostly determined by the few
heaviest single axle loads, and is little damaged by other loads. Therefore, the 4.2 exponent in
Equation 2 underestimates the damage caused by those loads, particularly during the day when
curling stresses compound the damage caused by the trucks at the edge of the slab.
For another example, consider base and subgrade rutting in flexible pavements. The 4.2
exponent greatly overestimates the damage caused by heavy loads for thick flexible pavements.
This is particularly true at night, when the asphalt concrete is stiff and protects the underlying
layers.
These two examples also illustrate the extra information obtained from examining data
showing how axle load spectra may vary from day to night and season to season.
WIM systems can continuously measure and store loads and axle spacing data for each
truck that passes through the WIM station. Additionally, they also record supplementary data
such as the date, time, speed, lane of travel, vehicle type, and station identification. With the
information provided by WIM systems, it is possible to get detailed truck traffic data, such as
axle load spectra, required in modern pavement design methods.
In the late 1980s, Caltrans began to install WIM systems on its highways to record truck
traffic information. Currently, over 100 WIM stations are installed on the California highway
system. These WIM stations are producing massive amounts of traffic data every day. Figure 1
and Table 1 show WIM station locations throughout California as of March 2001.

18
1.2 Objectives of This Study
The objectives of this study are:
1. Take the binary database of available Caltrans WIM data, clean it, and convert it into
a relational database to provide easy access to facilitate pavement design and
management.
2. Examine the axle load spectra for the total data set by:
a. axle type (steering single, single, tandem, tridem)
b. day versus night, and across the three typical California seasons (wet, spring, dry)
c. by region (Bay Area, Central Valley, Southern California)
d. by rural versus urban locations, and
e. the distribution of truck types
3. Examine the axle load spectra and axle load spectra coefficients for six WIM sites
representative of the three regions and rural versus urban by:
a. day versus night
b. direction (Northbound versus Southbound)
c. axle type
d. lane
e. year (growth rates)
4. Examine truck traffic volume and ESALs for the 6 stations by:
a. truck type
b. day versus night
c. direction
d. season
e. lane

19
f. year (growth rate)
g. differential load between axle ends
5. Examine truck speeds for the 6 stations by truck type and location
6. Examine gross vehicle weights (GVW) by truck type, location, and year (growth rate)
7. Evaluate the feasibility of estimating truck traffic information for adjacent locations
from a given WIM station, including:
a. Average Annual Daily Truck Traffic (AADTT), equivalent single axle loads
(ESALs)
1.3 Scope of This Report
This report analyzes the data collected from all WIM stations in California from January
1991 to March 2001, explores axle load frequency distributions for the various axle groups
within all truck types, and compares frequency distributions among sites, years, seasons,
day/night, and various regions. Also reported are analyses of truck volume distributions among
lanes, directions, years, and truck types, right/left side wheel load difference distribution, and
truck speed distribution.

20
Figure 1. Distribution of WIM stations on California state highway network inMarch 2001.

Table 1 Summary of Basic Information for Each WIM Station in CaliforniaLocation Information Lane ConfigurationStation
No. Name District County Route PostmileData System
(Vendor) No. of Lanes Direction1
1 Lodi 10 San Joaquin 5 43.7 DAW 200 4 1234(N2N1S1S2)DAW 200 (7/99) 4 1234(S2S1N1N2)2 Redding 2 Shasta 5 R24.9 IRD (7/99-Pres) 4 1234(N2N1S1S2)
Antelope DAW 200 (8/95) 4 1234(W4W3W2W1)3 Antelope (EB)-After 95 3 Sacramento 80 15 IRD (8/95-Pres) 4 1234(E4E3E2E1)4 Antelope (WB)-After 98 3 Sacramento 80 17.2 IRD 4 1234(W4W3W2W1)
DAW 200 (4/00) 4 1234(E2E1W1W2)5 Indio 8 Riverside 10 R59.4 IRD (4/00-Pres) 4 1234(W2W1E1E2)Newhall-Before 98 7 Los Angeles 5 44.6 DAW 200 2 14(N1N2)6 Palmdale 7 Los Angeles 14 R57.8 *SITE INSTALLATION PENDING
7 Santa Nella 10 Merced 5 20.2 DAW 200 4 1234(S2S1N1N2)Ventura(SB) 7 Los Angeles 101 37.8 DAW 200 (8/99) 6 SSSSS8 Conejo (SB) 7 Ventura 101 12 DAW 190 (8/99-Pres) 3 123(S3S2S1)Ventura(NB) Los Angeles 37.8 DAW 200 (8/99) 6 NNNNN9 Conejo (NB)
7Ventura
1017.7 DAW 190 (8/99-Pres) 3 123(N3N2N1)
10 Fresno 6 Fresno 99 25 DAW 200 6 123456(S3S2S1N1N2N3)11 Sonoma 4 Sonoma 37 2.7 DAW 200 4 1234(W2W1E1E2)
DAW 200 (6/94) 5 12345(S5S4S2S1S3)12 Van Nuys (SB) 7 Los Angeles 405 42.9 DAW 190 (6/94-Pres) 5 12345(S5S4S3S2S1)DAW 200 (6/94) 5 12345(N5N4N2N1N3)13 Van Nuys (NB) 7 Los Angeles 405 42.9 DAW 190 (6/94-Pres) 5 12345(N5N4N3N2N1)
14 San Marcos 11 San Diego 78 10.7 DAW 200 6 123456(E3E2E1W1W2W3)DAW 200 (1/98) 6 123456(S6S5S3S2S4S1)15 Irvine (SB) 12 Orange 5 25.8 DAW 190 (1/98-Pres) 6 123456(S6S5S4S3S2S1)DAW 200 (1/98) 6 123456(N6N5N3N2N4N1)16 Irvine (NB) 12 Orange 5 25.8 DAW 190 (1/98-Pres) 6 123456(N6N5N4N3N2N1)
17 Hayward (SB) 4 Alameda 880 14.7 DAW 200 6 123456(S6S5S3S2S4S1)18 Hayward (NB) 4 Alameda 880 14.7 DAW 200 6 123456(N6N5N3N2N4N1)19 Martinez 4 Contra Costa 4 11.2 *SITE INSTALLATION PENDING20 Loleta 1 Humboldt 101 65.6 DAW 200 4 1234(N2N1S1S2)21 Mojave 6 Kern 58 108.1 DAW 200 4 1234(E2E1W1W2)
21

Location Information Lane ConfigurationStationNo. Name District County Route Postmile
Data System(Vendor) No. of Lanes Direction1
22 Jeffrey 11 Imperial 8 25.8 DAW 200 4 1234(E2E1W1W2)23 El Centro 11 Imperial 8 40 DAW 200 4 1234(E2E1W1W2)24 Napa 4 Napa 12 2.3 DAW 200 2 14(W1E1)25 Newberry 8 San Bernardino 40 28.9 DAW 200 4 1234(E2E1W1W2)26 Cameron 11 San Diego 8 51.5 DAW 200 4 1234(E2E1W1W2)27 Tracy 10 San Joaquin 5 7.4 DAW 200 4 1234(S2S1N1N2)28 Macdoel 2 Siskiyou 97 34.5 IRD 2 12(S1N1)29 Arco (SB) 3 Sacramento 5 28.9 IRD 3 123(S1S2S3)30 Mt Shasta 2 Siskiyou 5 11.4 DAW 200 4 1234(S2S1N1N2)31 Woodside (SB) 4 San Mateo 280 5.6 DAW 200 6 123456(S6S53S2S4S1)32 Woodside (NB) 4 San Mateo 280 5.6 DAW 200 6 123456(N6N5N3N2N4N1)33 Burlingame (SB) 4 San Mateo 101 17.5 DAW 200 6 123456(S6S53S2S4S1)34 Burlingame (NB) 4 San Mateo 101 17.5 DAW 200 6 123456(N6N5N3N2N4N1)35 Pacheco 4 Santa Clara 152 26.9 DAW 200 4 1234(W2W1E1E2)36 Los Banos 10 Merced 152 23 DAW 200 4 1234(W2W1E1E2)
DAW 200(11/99) 6 123456(S6S53S2S4S1)37 Elsinore (SB) 8 Riverside 15 21.6 DAW 190(11/99-Pres) 6 123456(S6S5S4S3S2S1)DAW 200(11/99) 6 123456(N6N5N3N2N4N1)38 Elsinore (NB) 8 Riverside 15 21.6 DAW 190(11/99-Pres) 6 123456(N6N5N4N3N2N1)
39 Redlands 8 San Bernardino 30 31.7 DAW 200 4 1234(E2E1W1W2)40 Coachella 8 Riverside 86 R16 DAW 200 4 1234(N2N1S1S2)41 Vacaville (EB) 4 Solano 80 30.6 IRD 4 1234(E4E3E2E1)42 Vacaville (WB) 4 Solano 80 30.6 IRD 4 1234(W4W3W2W1)43 Cholame 5 San Luis Obispo 46 44.7 IRD 2 12(E1W1)
DAW 200 (8/00) 4 1234(W2W1E1E2)44 Banta 10 San Joaquin 205 R9.5 DAW 190 (8/00-Pres) 4 1234(W2W1E1E2)45 Carbona 10 San Joaquin 580 6.4 DAW 200 4 1234(E2E1W1W2)46 Galt 3 Sacramento 99 6.9 IRD 4 1234(S2S1N1N2)47 Castaic (SB) 7 Los Angeles 5 R56.1 DAW 200 6 123456(S6S53S2S4S1)48 Castaic (NB) 7 Los Angeles 5 R56.1 DAW 200 6 123456(N6N5N3N2N4N1)49 Auburn 3 Placer 49 9 DAW 200 4 1234(N2N1S1S2)50 Elmira 4 Solano 505 2.2 IRD 4 1234(N2N1S1S2)51 West Sac (EB) 3 Yolo 50 0.6 IRD 4 1234(E4E3E2E1)
22

Location InformationStationNo. Name District County52 West Sac (WB) 3 Yolo53 Montrose (EB) 7 Los Angeles54 Montrose (WB) 7 Los Angeles55 Dublin (SB) 4 Contra Costa56 Dublin (NB) 4 Contra Costa57 Pinole (EB) 4 Contra Costa58 Pinole (WB) 4 Contra Costa59 LA - 710 (SB) 7 Los Angeles60 LA - 710 (NB) 7 Los Angeles61 Peralta (EB) 12 Orange62 Peralta (WB) 12 Orange63 Murrieta 8 Riverside64 Foster City 4 San Mateo65 Piru 7 Ventura66 Calico 8 San Bernardino67 Devore 8 San Bernardino68 Gilroy 4 Santa Clara69 Fontana (SB) 8 San Bernardino70 Fontana (NB) 8 San Bernardino71 Hinkley 8 San Bernardino72 Bowman 3 Placer73 Stockdale 6 Kern74 Bakersfield 6 Kern75 Keyes 10 Stanislaus76 Templeton 5 San Luis Obispo77 Colton (EB) 8 San Bernardino78 Colton (WB) 8 San Bernardino79 Artesia (EB) 7 Los Angeles80 Artesia (WB) 7 Los Angeles81 Positas 5 San Benito82 Glendora (EB) 7 Los Angeles83 Glendora (WB) 7 Los Angeles84 Leucadia (SB) 11 San Diego
23
Lane ConfigurationRoute Postmile
Data System(Vendor) No. of Lanes Direction1
50 0.6 IRD 4 1234(W4W3W2W1)2 21.9 *SITE ABANDONED2 21.9 *SITE ABANDONED
680 R0.1 DAW 100 4 1234(S4S3S2S1)680 R0.1 DAW 100 4 1234(N4N3N2N1)80 7.5 DAW 200 6 123456(E6E5E3E2E4E1)80 7.5 DAW 200 6 123456(W6W5W3W2W4W1)
710 11.5 IRD 4 1234(S4S3S2S1)710 11.5 IRD 4 1234(N4N3N2N1)91 11.9 IRD 4 1234(E4E3E2E1)91 11.9 IRD 4 1234(W4W3W2W1)
215 R15 DAW 100 4 1234(N2N1S1S2)92 14.1 IRD 6 123456(W3W2W1E1E2E3)126 30.8 DAW 100 4 1234(W2W1E1E2)15 R81.4 IRD 4 1234(N2N1S1S2)
215 14.8 DAW 100 4 1234(N2N1S1S2)101 R9.8 IRD 6 123456(S3S2S1N1N2N3)15 6.1 DAW 100 4 1234(S4S3S2S1)15 6.1 DAW 100 4 1234(N4N3N2N1)58 19.7 DAW 100 4 1234(W2W1E1E2)80 23.4 IRD 6 123456(W3W2W1E1E2E3)5 48.7 IRD 4 1234(N2N1S1S2)99 20.2 IRD 6 123456(N3N2N1S1S2S3)99 R8.4 IRD 6 123456(N3N2N1S1S2S3)101 49.5 IRD 4 1234(S2S1N1N2)10 12.4 IRD 4 1234(E4E3E2E1)10 12.4 IRD 4 1234(W4W3W2W1)91 7.5 IRD 5 12345(E4E3E2E1,E(HOV))91 7.5 IRD 5 12345(W4W3W2W1,W(HOV))101 16.2 IRD 6 123456(N3N2N1S1S2S3)210 42.6 IRD 5 12345(E4E3E2E1,E(HOV))210 42.6 IRD 5 12345(W4W3W2W1,W(HOV))5 42.2 IRD 4 1234(S4S3S2S1)

Location InformationStationNo. Name District County85 Leucadia (NB) 11 San Diego86 Ukiah 1 Mendocino87 Balboa (SB) 11 San Diego88 Balboa (NB) 11 San Diego89 Dekema (SB) 11 San Diego90 Dekema (NB) 11 San Diego91 Poggi (SB) 11 San Diego92 Poggi (NB) 11 San Diego93 Lakeport 1 Lake94 Greenfield 5 Monterey95 Ontario (EB) 8 San Bernardino96 Ontario (WB) 8 San Bernardino97 Chino 8 San Bernardino98 Prado 8 San Bernardino99 Tulloch 10 Tuolumne100 Miramar (SB) 11 San Diego101 Miramar (NB) 11 San Diego
1 The lane numbers in the parentheses are Caltrans lancenterline )
24
Lane ConfigurationRoute Postmile
Data System(Vendor) No. of Lanes Direction1
5 42.2 IRD 4 1234(N4N3N2N1)101 21.9 DAW 190 4 1234(S2S1N1N2)15 10 IRD 4 1234(S4S3S2S1)15 10 IRD 4 1234(N4N3N2N1)
805 24.5 IRD 4 1234(S4S3S2S1)805 24.5 IRD 4 1234(N4N3N2N1)805 5.6 IRD 4 1234(S4S3S2S1)805 5.6 IRD 4 1234(N4N3N2N1)29 44.4 IRD 4 1234(N2N1S1S2)101 47.9 IRD 4 1234(S2S1N1N2)60 R7.9 IRD 3 123(E3E2E1)60 R7.9 IRD 3 123(W3W2W1)83 5.7 IRD 4 1234(N2N1S1S2)71 R5.8 IRD 4 1256(S3S2N2N3)120 6.4 IRD 4 1234(E2E1W1W2)163 10.4 DAW 190 5 12345(S5S4S3S2S1)163 10.4 DAW 190 4 1235(N4N3N2N1)
e number designation. (e.g.,W2 represents westbound second lane from the

25
2.0 DISCUSSION OF DATA HANDLING
The methods used in the analysis to process the traffic data are presented in this chapter.
2.1 WIM systems
The efficiency and effectiveness of traditional static weigh stations has been limited
because of their lengthy weighing processes. Additionally, truck traffic volumes often exceed
the capacity of static weigh stations, with the result that only a small portion of vehicles are
weighed, which can lead to biased data. Weigh-in-Motion (WIM) systems are introduced to
improve the operational efficiency of the traditional static weigh stations. As its name implies,
WIM stations weigh trucks and their axles while these vehicles travel at full highway speed. The
typical vehicle presence sensors employed in the WIM system are piezoelectric sensors, bending
plate scales, inductance loops, and pressure cell scales. These sensors are usually installed in a
strip embedded in the pavement perpendicular to the traffic direction, as shown in Figure 2.
WIM systems record instantaneous dynamic axle loads and spacings, number of axles, speed of
vehicle, lane and direction of travel, and the date and time as a vehicle is passing over the
sensors. The accuracy of these systems is primarily dependent on the vehicle dynamics and the
inherent variance of the technology used within the WIM system.
The WIM station systems used by Caltrans were provided by two different vendors: PAT
Traffic Control Corporation and International Road Dynamics Inc. PAT Traffic Control
Corporation provided three slightly different systems: DAW 100, DAW 190 and DAW 200,
while International Road Dynamics Inc. provided one system called the IRD system. These two
companies have different data handling software and data format. The ASCII truck information
files used in this analysis also differ slightly from one another.

26
Traffic Flow
Inductive Loop
Configuration 1 Configuration 2
AxleSensor
Bending Plate/Pressure Cell Scale
PiezoelectricSensor
Traffic Flow
Figure 2. Common configuration of WIM system.
2.2 Data Sampling Method
Ideally, the Caltrans WIM stations collected and stored truck traffic information
continuously once they were installed. Only on abnormal occasions would the data collection
action be interrupted. These occasions included power failures, communication interruptions,
pavement maintenance and rehabilitation activities, etc. Typically, a huge amount of data has
been collected for each WIM station and included in the database developed by UCPRC.
However, because traffic patterns generally do not change much over short periods such as a few
days, it is not necessary to analyze the whole data set, and the results for the full set would be too
difficult to report.

27
Based on the results of preliminary analysis of traffic data from six Caltrans WIM
stations, which show a significant difference in traffic from weekdays to weekends and less
significant differences across months, it was decided that the data in one week out of each month
be used in the analysis. In this way, the variation in traffic patterns from weekdays to weekends
and across months can be included in the sampled data set.
The data to be sampled were primarily determined according to the WIM File Download
Record maintained by the WIM office of Caltrans. The WIM office of Caltrans has checked one
to two weeks’ WIM data in each month for validity and has kept the results in the WIM File
Download Record. Two kinds of data were chosen to be candidates for sampling: D and M. D
denotes data collected from a system that was working well and the provided good data; M
denotes data collected from a system that had some minor errors but was generally considered
acceptable.
As the data checked by Caltrans were continuous for one- to two-week periods, most of
the data sampled for this research also came from continuous one-week periods. When a
continuous week of good data was not available, two sampling strategies were used. First, if
good data on the same day of the week in the same month was available, that day’s data was
selected (e.g., if the data from the first Monday of the month was bad but was good for the
second Monday, then the data from the second Monday of the month was selected to combine
with good data from the rest of the first week.) The second strategy was as follows: if less than 7
days of good data were available for a given month, then the data from three weekdays and one
weekend were selected to keep the ratio of weekdays to weekends in the sampled data set close
to 2.5:1.

28
Due to breakdown of WIM stations, system errors lasting several months, communication
interruptions between WIM station and the WIM office, and other reasons, a complete one-
week-out-of-one-month data set sample was rarely obtained for each WIM station. This may
have introduced some errors in the analysis results, but they were believed to be small because of
the large sample size of the remaining data sets analyzed.
2.3 Computer Programs
The raw data obtained from the WIM office of Caltrans were compressed and in a binary
format that couldn’t be analyzed directly. After sampling and extraction, these data files were
converted into ASCII files using software provided by the two WIM vendors.
The program used to convert PAT system data files is called REPORTER, which uses
different switches to convert DAW 100/190 and DAW 200 data files. This program obtains lane
and direction information from a file called RESTAT.LST, which also contained other basic
information from each WIM station.
The program used to convert IRD system data files is called OFFICE. This program
provides the lane, direction, and other basic information of each station.
Both programs can also provide detailed truck weight, truck traffic volume, speed
distribution analysis, summaries, and other analyses for each day’s traffic data.
2.4 ASCII format
The ASCII truck information files created by REPORTER and OFFICE have similar
format. They are both text files, in which each line of record represents one truck that has passed
through the WIM systems. Each record is composed of a certain number of fields, which are
delimited with commas.

29
The name of the PAT system ASCII file has the format of “A###MMDD.YY”, where
### is the WIM station number, MM is month, DD is day in a month, and YY is year. For
example, A0100112.98 means the data in the file was collected from WIM Station 10 on January
12, 1998.
Each record in the PAT system ASCII file has 41 fields, as shown in Table 2.
The filename of the IRD system ASCII file has the format of “YYMMDDTR.###”,
where ### is the WIM station number, MM is month, DD is day in a month, and YY is year.
Each record in the IRD system ASCII file has 40 fields. The first 39 fields are identical
to those of the PAT system ASCII files, as shown in Table 2. The data type of the last field is
unknown.
The lane number used in the ASCII files is determined by the order in which the WIM
storage hardware is installed, not by the Caltrans lane number designation system.
Because the WIM storage hardware was installed in arbitrary order, the lane number
designation varies from station to station. In this report, however, the lane number has been
converted into the Caltrans designation, which starts with the innermost lane as lane 1 and
increases sequentially outward. The relationship between WIM lane numbers and Caltrans lane
numbers is shown in Table 1.
The vehicle classification method used by Caltrans was primarily based on axle spacing
and vehicle weight, as shown in Table 3. The typical profiles for each truck type are sketched in
Figure 3.
As WIM stations record only truck information, vehicle Types 1 to 3 are not included in
the ASCII truck information file. Vehicle Type 4 (Bus) is regarded as a truck and is included in
the WIM ASCII truck information file.

30
Table 2 Fields in ASCII Data FilesField PAT Data Type by Field IRD Data Type by Field1234567891011121314151617181920212223242526272829303132333435363738394041
LaneMonthDayYearHourMinuteSecondVehicle NumberTypeGross weight (kips)Overall length (feet)Speed (mph)Violation codeAxle 1 Right Side weight (kips)Axle 1 Left Side weight (kips)Axle 2 Right Side weight (kips)Axle 2 Left Side weight (kips)Spacing between Axles 1 & 2 (feet)Axle 3 Right Side weight (kips)Axle 3 Left Side weight (kips)Spacing between Axles 2 & 3 (feet)Axle 4 Right Side weight (kips)Axle 4 Left Side weight (kips)Spacing between Axles 3 & 4 (feet)Axle 5 Right Side weight (kips)Axle 5 Left Side weight (kips)Spacing between Axles 4 & 5 (feet)<unused><unused><unused><unused><unused><unused><unused><unused><unused><unused><unused><unused>DirectionAxle number
LaneMonthDayYearHourMinuteSecondVehicle NumberTypeGross weight (kips)Overall length (feet)Speed (mph)Violation codeAxle 1 Right Side weight (kips)Axle 1 Left Side weight (kips)Axle 2 Right Side weight (kips)Axle 2 Left Side weight (kips)Spacing between Axles 1 & 2 (feet)Axle 3 Right Side weight (kips)Axle 3 Left Side weight (kips)Spacing between Axles 2 & 3 (feet)Axle 4 Right Side weight (kips)Axle 4 Left Side weight (kips)Spacing between Axles 3 & 4 (feet)Axle 5 Right Side weight (kips)Axle 5 Left Side weight (kips)Spacing between Axles 4 & 5 (feet)<unused><unused><unused><unused><unused><unused><unused><unused><unused><unused><unused><unused><unknown><does not exist>

31
2.5 Erroneous Data
Although all the data to be analyzed were sampled from the data set that had been
checked for validity by Caltrans, there still remained a variety of erroneous records in the
sampled data set. The following sections explain these errors.
2.5.1 Records with Non-zero Violation Codes
Each truck record in the data set has a violation code. Any non-zero violation code
means some kind of violation, which includes axle weight violation, tandem weight violation,
bridge weight violation, speed violation, off scale violation, imbalance, etc. The meanings of the
violation codes differ for the PAT and IRD systems.
After discussion with the WIM office of Caltrans, the following methods were used to
deal with those truck records with non-zero violation codes: For PAT stations, codes 1-15 are
weight violations and do not require any special treatment. Records with codes larger than 15
were exempted from analysis. For IRD stations, all violation codes had already been taken into
account and the corresponding records were kept in the analysis.
However, in the analysis of annual average daily truck traffic, all truck records were
included.
2.5.2 Records with Zero Violation Codes
During the analysis, a small percentage of truck records with zero violation codes were
found to contain other types of erroneous data, such as negative load values or lane numbers,
erroneous (impossibly large) spacing between two axles, or zero or extremely large axle load
values. Because these records only account for a very small percentage of the data sample size,
they were deleted from the analysis.

Table 3 WIM Vehicle Classification Paramet
Spacing (ft.)Type Vehicle Description # ofAxles 1-2 2-3
1 Motorcycle 2 0.10-5.992 Auto, Pickup 2 6.00-9.993 Other (Limo, Van, RV) 2 10.00-22.994 Bus 2 23.00-40.005 2D 2 6.00-22.992 Auto W/ 1 Axle trailer 3 6.00-9.99 6.00-25.003 Other W/ 1 Axle trailer 3 10.00-16.00 6.00-25.004 Bus 3 23.10-40.00 3.00-5.995 2D W/ 1 Axle trailer 3 6.00-23.09 6.00-25.006 3 Axle 3 6.00-23.09 3.00-5.998 2S1,21 3 6.00-23.00 11.00-40.02 Auto W/ 2 Axle trailer 4 6.00-9.99 6.00-25.003 Other W/ 2 Axle trailer 4 10.00-16.00 6.00-25.005 2D W/ 2 Axle trailer 4 6.00-23.09 6.00-25.007 4 Axle 4 6.00-23.09 3.00-5.998 3S1, 31 4 6.00-23.00 3.00-5.998 2S2 4 6.00-23.00 11.00-44.03 Other W/ 3 Axle trailer 5 10.00-16.00 6.00-25.009 3S2 5 6.00-26.00 3.00-5.9911 2S12 5 6.00-26.00 11.00-26.014 32 5 6.00-26.00 3.00-5.9910 3S2, 33 6 6.00-26.00 3.00-5.9912 3S12 6 6.00-26.00 3.00-5.9913 2S23, 3S22, 3S13 7 6.00-45.00 3.00-45.0013 3S23 8 6.00-45.00 3.00-45.0013 Permit 9 6.00-45.00 3.00-45.0015 Error and/or unclassified vehicles not meeting axle config
32
ersWeight(kips)
3-4 4-5 5-6 6-7 7-8 8-9 Min.-Max.0.10-3.001.00-7.991.00-7.9912.00->8.00->1.00-11.991.00-11.9920.00->12.00-19.9912.00->
0 20.00->1.00-11.99 1.00-11.991.00-11.99 1.00-11.991.00-11.99 12.00-19.993.00-12.99 12.00->13.00-44.00 12.00->
0 3.00-11.99 20.00->1.00-3.49 1.00-3.49 1.00-11.996.00-46.00 3.00-10.99 12.00->
0 6.00-20.00 11.00-26.00 12.00->6.00-23.00 11.00-27.00 12.00->6.00-46.00 3.00-11.99 3.00-10.99 12.00->11.00-26.00 6.00-24.00 11.00-26.00 12.00->3.00-45.00 3.00-45.00 3.00-45.00 3.00-45.00 12.00->3.00-45.00 3.00-45.00 3.00-45.00 3.00-45.00 3.00-45.00 12.00->3.00-45.00 3.00-45.00 3.00-45.00 3.00-45.00 3.00-45.00 3.00-45.00 12.00->
urations set for classifications 1 through 14

Figure 3. Typical vehicle profiles for Caltrans truc
33
k type.

34
2.6 Assumptions Used in Analysis
Several assumptions have been used in the analysis. These assumptions include:
• Axle grouping assumption. The first axle of each truck type was regarded as a
steering axle. The spacing used to distinguish between single axles, tandem axles and
tridem axles is 1.8 m (6 ft.). That is, if the spacing between one axle and its adjacent
axles is larger than 1.8 m (6 ft.), this axle is regarded as a single axle; if the spacing
between two adjacent axles is less than 1.8 m (6 ft.) and the spacing between these
two axles and their adjacent axles is larger than 1.8 m (6 ft.), these two axles were
regarded as a tandem; if the spacing between three adjacent axles is both less than 1.8
m (6 ft.)and the spacing between these three axles and their adjacent axles is larger
than 1.8 m (6 ft.), these three axles were regarded as a tridem.
• Daytime assumption. Daytime was assumed to be between 6 AM and 6 PM. Night
was assumed to be between 6 PM and 6 AM.
• Season assumption. Three seasons were used to characterize the weather in
California: wet season (from November to February), spring season (from March to
June) and dry season (from July to October).
• Axle load ranges assumption. The load interval for steering axles and single axles is
in 5-kN increments from 0 to 220 kN. The load interval for tandem axles is in 10-kN
increments from 0 to 440 kN. The load interval for tridem axles is in 10-kN
increments from 0 to 500 kN. Analysis showed that almost all the axle weights were
in the load ranges above. The very few exceptions were believed to be erroneous data
that had not been deleted from the sample data set.

35
2.7 Data Analysis
After sampling and conversion of the binary data files, the cleaned ASCII files were run
by a FORTRAN program (WIMANA.FOR developed by the UC Pavement Research Center) to
compute the load spectra of the four axle groups (steering, single, tandem, and tridem) of
different truck types at different times (day/night, season, year) and different locations (site,
direction, and lane), and to compute the traffic volume distribution among different locations
(site, direction, and lane) and at different times (day/night, season, and year). Truck traffic
growth trends, side wheel load differences, and truck speed distributions were also analyzed.
The comparison and evaluation of axle load spectra are necessary in the analysis of truck
traffic data. Several comparison and evaluation methods have been proposed, such as plotting
the load distributions and using non-parametric statistical tests (e.g., Kruskal-Wallis test,
Kolmogorov-Smirnov test).
Because the effect of traffic loads on pavement damage increases exponentially with the
size of the load, statistical tests are not appropriate to evaluate axle load spectra, as they do not
reflect the influence of axle load on pavement damage.
According to the discussion in FHWA-RD-00-054 report,(3) Load Spectrum Coefficient
(LSC) is a better statistical measure that is related to the concept of pavement damage and is
independent of pavement-related variables. The LSC for normalized load spectra was defined by
Equation (3):
×−
×
�
�����
�
���
��
� −
==
l
i
i
mi
Lcounttotal
countrangeloadLrangeloadmid
LSC1 _
_80
_
(3)
where:

36
LSC = Load spectrum coefficient used to compare normalized loadspectra
l = Number of load rangesmid-load_range = Average load range (kN) for load range iLoad_range_counti = Number of axles in load range i
L = 1 for steering axle and single axle, 2 for tandem, and 3 for tridemm =exponent, 3.8
As Equation (3) is similar to Equation (2) used by Caltrans to compute ESALs, with the
difference being the exponent, the exponent 4.2 was used instead of 3.8 to compute the LSC in
this report. With this change, ESALs as defined by Caltrans can be easily calculated from LSCs
for different axle groups and truck types.
In this report, different load spectra were compared using load spectra diagrams as well
as LSCs.

37
3.0 ANALYSIS OF OBSERVED DATA
3.1 Generalized Axle Load Spectra and Truck Composition in California
In this section, the data files sampled from all the WIM sites across the entire analysis
period were combined to give the general load spectra of steering axle, single axle, tandem axles
and tridem axles, and general truck traffic composition. Furthermore, these load spectra and
truck traffic compositions were examined for day/night and seasonal variation. Load spectra are
shown in Figures 4 through 11. Truck traffic compositions are shown in Figures 12 and 13.
(Refer to Figure 3 for the truck type designations referred to in this section.) The legal load limit
for single axles in California is 89 kN; for tandem axles it is 151 kN.
Figure 4 shows that the majority of steering axles come from Truck Types 5 and 9, and
most of the steering axle loads are less than 90 kN.
Figure 5 shows that the majority of single axles come from Truck Types 5, 8, and 11, and
most of the single axle loads are less than 110 kN.
Figure 6 shows that the majority of tandem axles come from Truck Type 9, and most of
the tandem axle loads are less than 210 kN.
Figure 7 shows that the majority of tridem axles come from Truck Types 10 and 15, and
most of the tridem axle loads are less than 260 kN.
Figures 8-11 show that at night, the load spectra of all four axle groups shift to the right
of corresponding load spectra in the daytime, meaning that trucks running at night generally
carry heavier loads than those running in the daytime. On the other hand, there is little seasonal
variation in all load spectra.

38
0
0.05
0.1
0.15
0.2
0.25
0.3
0 20 40 60 80 100 120 140 160
Axle Load, kN
Nor
mal
ized
Fre
quen
cy
TotalTruck Type 4Truck Type 5Truck Type 6Truck Type 7Truck Type 8Truck Type 9Truck Type 10Truck Type 11Truck Type 12Truck Type 13Truck Type 14Truck Type 15
Lega
l Lim
it =
89 k
N
Figure 4. General steering axle load spectra across all dates and locations.
0
0.02
0.04
0.06
0.08
0.1
0.12
0 20 40 60 80 100 120 140 160 180 200
Axle Load, kN
Nor
mal
ized
Fre
quen
cy
TotalTruck Type 4Truck Type 5Truck Type 6Truck Type 7Truck Type 8Truck Type 9Truck Type 10Truck Type 11Truck Type 12Truck Type 13Truck Type 14Truck Type 15
Lega
l Lim
it =
89 k
N
Figure 5. General single axle load spectra across all dates and locations.

39
0
0.02
0.04
0.06
0.08
0.1
0.12
0 50 100 150 200 250 300 350
Axle Load, kN
Nor
mal
ized
Fre
quen
cy
TotalTruck Type 4Truck Type 5Truck Type 6Truck Type 7Truck Type 8Truck Type 9Truck Type 10Truck Type 11Truck Type 12Truck Type 13Truck Type 14Truck Type 15
Lega
l Lim
it =
89 k
N
Figure 6. General tandem axle load spectra across all dates and locations.
0
0.02
0.04
0.06
0.08
0.1
0.12
0 50 100 150 200 250 300 350 400Axle Load, kN
Nor
mal
ized
Fre
quen
cy
TotalTruck Type 4Truck Type 5Truck Type 6Truck Type 7Truck Type 8Truck Type 9Truck Type 10Truck Type 11Truck Type 12Truck Type 13Truck Type 14Truck Type 15
Figure 7. General tridem axle load spectra across all dates and locations.

40
0
0.05
0.1
0.15
0.2
0.25
0.3
0 20 40 60 80 100 120 140 160Axle Load, kN
Nor
mal
ized
Fre
quen
cy
TotalDaytimeNightWet SeasonSpring SeasonDry Season
Figure 8. General steering axle load spectra at different times.
0
0.02
0.04
0.06
0.08
0.1
0.12
0 20 40 60 80 100 120 140 160 180 200
Axle Load, kN
Nor
mal
ized
Fre
quen
cy
TotalDaytimeNightWet SeasonSpring SeasonDry Season
Figure 9. General single axle load spectra at different times.

41
0
0.02
0.04
0.06
0.08
0.1
0.12
0.14
0 50 100 150 200 250 300 350
Axle Load, kN
Nor
mal
ized
Fre
quen
cy
TotalDaytimeNightWet SeasonSpring SeasonDry Season
Figure 10. General tandem axle load spectra at different times.
0
0.02
0.04
0.06
0.08
0.1
0.12
0 50 100 150 200 250 300 350 400
Axle Load, kN
Nor
mal
ized
Fre
quen
cy
TotalDaytimeNightWet SeasonSpring SeasonDry Season

42
Figure 11. General tridem axle load spectra at different times. Figures 12 and 13 show that
Truck Types 5, 6, 8, 9, and 11 account for an average of 90 percent of all the truck traffic. Their
frequency in decreasing order is Type 9, Type 5, Type 11, Type 8, and Type 6.
The percentages of Types 9 and 11 (semi tractor trailers typically used for long-hauls)
increase and those of Type 5, 6 and 8 (typically used for local hauls) decrease at night.
Moreover, the truck traffic composition shows little seasonal variation.
3.2 Generalized Axle Load Spectra in Different Regions
Because pavements in a specific region are designed according to the specific
environmental and traffic conditions in that region, it is useful to perform regional comparisons
of the axle load spectra. In this report the WIM stations are grouped in two ways. The first is to
group them by geographical region: Central Valley, Bay Area and Southern California. The
second way is group them by type of area: Rural and Urban. Table 4 shows both groupings of
stations by both criteria.
The load spectra of the four axle groups (steering, single, tandem, and tridem) are shown
by geographical region in Figures 14 through 17. The load spectra of the four axle groups by
type of area are shown in Figures 18 through 21.
Figures 14-17 show that there is little difference in the axle load spectra between the Bay
Area and Southern California, while the load spectra in Central Valley shift to the right (heavier)
of those in the Bay Area and Southern California.
Figures 18-21 show that the load spectra in rural areas shift to the right (heavier) of those
in urban areas. A few urban links that likely carry very heavy short-haul traffic do not have
WIM stations. These include the link between the Port of Oakland and the Richmond container

43
0
10
20
30
40
50
60Pe
rcen
tage
, %
4 5 6 7 8 9 10 11 12 13 14 15Truck Type
24-hour AverageDaytime AverageNight Average
Figure 12. General truck traffic compositions (day, night, and 24-hour).
0
10
20
30
40
50
60
Perc
enta
ge, %
4 5 6 7 8 9 10 11 12 13 14 15Truck type
Whole Year AverageWet Season AverageSpring Season AverageDry Season Average
Figure 13. General truck traffic compositions (yearly, wet season, spring season, and wetseason averages).

44
0
0.05
0.1
0.15
0.2
0.25
0.3
0 20 40 60 80 100 120 140 160
Load Range, kN
Nor
mal
ized
Fre
quen
cyBay AreaCentral ValleySouthern California
Figure 14. Steering axle load spectra in three regions.
0
0.02
0.04
0.06
0.08
0.1
0.12
0 20 40 60 80 100 120 140 160 180
Load Range, KN
Nor
mal
ized
Fre
quen
cy
Bay AreaCentral ValleySouthern California
Figure 15. Single axle load spectra in three regions.

45
0
0.02
0.04
0.06
0.08
0.1
0.12
0.14
0.16
0 50 100 150 200 250 300
Load Range, kN
Nor
mal
ized
Fre
quen
cy
Bay AreaCentral ValleySouthern California
Figure 16. Tandem load spectra in three regions.
0
0.02
0.04
0.06
0.08
0.1
0.12
0.14
0 50 100 150 200 250 300 350
Load Range, KN
Nor
mal
ized
Fre
quen
cy
Bay AreaCentral ValleySouthern California
Figure 17. Tridem load spectra in three regions.

46
0
0.05
0.1
0.15
0.2
0.25
0.3
0 20 40 60 80 100 120 140 160Load Range, kN
Nor
mal
ized
Fre
quen
cyRuralUrban
Figure 18. Steering axle load spectra in two areas.
0
0.02
0.04
0.06
0.08
0.1
0.12
0 20 40 60 80 100 120 140 160 180Load Range, kN
Nor
mal
ized
Fre
quen
cy
RuralUrban
Figure 19. Single axle load spectra in two areas.

47
0
0.02
0.04
0.06
0.08
0.1
0.12
0.14
0 50 100 150 200 250 300Load Range, kN
Nor
mal
ized
Fre
quen
cyRuralUrban
Figure 20. Tandem load spectra in two areas.
0
0.02
0.04
0.06
0.08
0.1
0.12
0 50 100 150 200 250 300 350Load Range, kN
Nor
mal
ized
Fre
quen
cy
RuralUrban
Figure 21. Tridem load spectra in two areas.

48
Table 4 WIM Station Location GroupingsGeographical
Region WIM Station No.
Central Valley 2, 10, 20, 28, 30, 49, 72, 99
Bay Area 1, 3, 4, 7, 11, 17, 18, 24, 27, 29, 31, 32, 33, 34, 35, 36, 41, 42, 44, 45, 46, 50,51, 52, 55, 56, 57, 58, 64, 68, 71, 75, 81, 86, 93, 94
SouthernCalifornia
5, 8, 9, 12, 13, 14, 15, 16, 21, 22, 23, 25, 26, 37, 38, 39, 40, 43, 47, 48, 53, 54,59, 60, 61, 62, 63, 65, 66, 67, 69, 70, 73, 74, 76, 77, 78, 79, 80, 82, 83, 84, 85,87, 88, 89, 90, 91, 92, 95, 96, 97, 98
Type of Area WIM Station No.
Rural 7, 20, 21, 22, 23, 25, 26, 27, 28, 30, 35, 36, 40, 43, 44, 45, 49, 66, 71,72, 73,76, 86, 93, 94, 99
Urban
1, 2, 3, 4, 5, 8, 9, 10, 11, 12, 13, 14, 15, 16, 17, 18, 24, 29, 31, 32, 33, 34, 37,38, 39, 41, 42, 46, 47, 48, 50, 51, 52, 53, 54, 55, 56, 57, 58, 59, 60, 61, 62, 63,64, 65, 67, 68, 69, 70, 74, 75, 77, 78, 79, 80, 81, 82, 83, 84, 85, 87, 88, 89, 90,91, 92, 95, 96, 97, 98
rail yard on I-880 and I-580; and the link between the Ports of Long Beach and Los Angeles and
State Route 1 on I-710.

49
4.0 TRUCK TRAFFIC DATA ANALYSIS OF SIX WIM SITES
In this chapter, six WIM sites (listed in Table 5) were selected to illustrate the analysis
results. These six sites are located in three regions (Bay Area, Central Valley and Southern
California) and two areas (rural area and urban area), and in two different freight distribution
directions (westbound/eastbound and southbound/northbound).
Table 5 Descriptions of Six WIM Sites Selected as Representative ExamplesLocation InformationSite
No.
WIMStationNo. Name District County Route Postmile
Direction Area 1
1 2 Redding 2 Shasta 5 R24.9 SB/NB CV/U2 17,18 Hayward 4 Alameda 880 14.7 SB/NB BA/U3 21 Mojave 6 Kern 58 108.1 WB/EB SC/R4 47,48 Castaic 7 Los Angeles 5 R56.1 SB/NB SC/U5 57,58 Pinole 4 Contra Costa 80 7.5 WB/EB BA/U6 72 Bowman 3 Placer 80 23.4 WB/EB CV/R
1 CV-Central Valley; BA-Bay Area; SC-Southern California; U-Urban; R-Rural.
4.1 Axle Load Spectra Analysis
4.1.1 Axle Load Spectra on All Lanes
The axle load spectra of both traveled directions combined for various times of the day
(whole day, day, and night), and each direction for the whole day at Site 1 (Station 2) are shown
in Figures 22–25. Spectra at the other five sites are shown in Appendix A.
It can be observed that steering axle load spectra are similar among all the six sites, but
single axle, tandem and tridem load spectra are quite different among these sites. For all the sites,
the load spectra of all the four axle groups at night shift slightly to the right (heavier) of those in
the daytime. Furthermore, the load spectra are also a little different between the two directions.
Similar results can also be observed from the load spectra coefficient (LSC) table (Tables 6
through 11).

50
0
0.05
0.1
0.15
0.2
0.25
0.3
0.35
0 20 40 60 80 100 120 140 160
Load, kN
Nor
mal
ized
Fre
quen
cy2-Direction_Total2-Direct_Day2-Direct_NightSouthboundNorthbound
Figure 22. Axle load spectra, Station 2 (Redding), steering axle.
0
0.01
0.02
0.03
0.04
0.05
0.06
0.07
0.08
0.09
0.1
0 20 40 60 80 100 120 140 160 180
Load, kN
Nor
mal
ized
Fre
quen
cy
2-Direction_Total2-Direct_Day2-Direct_NightSouthboundNorthbound
Figure 23. Axle load spectra, Station 2 (Redding), single axle.

51
0
0.02
0.04
0.06
0.08
0.1
0.12
0.14
0.16
0.18
0.2
0 50 100 150 200 250 300
Load, kN
Nor
mal
ized
Fre
quen
cy2-Direction_Total2-Direct_Day2-Direct_NightSouthboundNorthbound
Figure 24. Axle load spectra, Station 2 (Redding), tandem axle.
0
0.02
0.04
0.06
0.08
0.1
0.12
0.14
0 50 100 150 200 250 300 350 400
Load, kN
Nor
mal
ized
Fre
quen
cy
2-Direction_Total2-Direct_Day2-Direct_NightSouthboundNorthbound
Figure 25. Axle load spectra, Station 2 (Redding), tridem axle.

52
Table 6 Load Spectra Coefficients for Site 1 (Station 2, Redding)Axle
GroupBoth
DirectionsBoth Directions,
DayBoth Directions,
NightSouthbound Northbound
Steering 0.108 0.113 0.116 0.113 0.114Single 0.322 0.309 0.351 0.326 0.319
Tandem 0.739 0.740 0.738 0.724 0.754Tridem 0.279 0.282 0.274 0.267 0.291
Table 7 Load Spectra Coefficients for Site 2 (Stations 17 and 18, Hayward)Axle
GroupBoth
DirectionsBoth Directions,
DayBoth Directions,
NightSouthbound Northbound
Steering 0.062 0.074 0.068 0.073 0.071Single 0.193 0.182 0.225 0.195 0.190
Tandem 0.328 0.311 0.379 0.333 0.323Tridem 0.226 0.215 0.269 0.272 0.174
Table 8 Load Spectra Coefficients for Site 3 (Station 21, Mojave)Axle
GroupBoth
DirectionsBoth Directions,
DayBoth Directions,
NightWestbound Eastbound
Steering 0.078 0.079 0.081 0.067 0.089Single 0.295 0.281 0.316 0.337 0.259
Tandem 0.615 0.595 0.637 0.567 0.649Tridem 0.267 0.273 0.257 0.277 0.257
Table 9 Load Spectra Coefficients for Site 4 (Stations 47 and 48, Castaic)Axle
GroupBoth
DirectionsBoth Directions,
DayBoth Directions,
NightSouthbound Northbound
Steering 0.088 0.097 0.090 0.095 0.093Single 0.253 0.248 0.259 0.252 0.255
Tandem 0.469 0.450 0.492 0.516 0.428Tridem 0.240 0.224 0.260 0.257 0.222
Table 10 Load Spectra Coefficients for Site 5 (Stations 57 and 58, Pinole)Axle
GroupBoth
DirectionsBoth Directions,
DayBoth Directions,
NightWestbound Eastbound
Steering 0.083 0.094 0.091 0.089 0.097Single 0.211 0.203 0.225 0.205 0.217
Tandem 0.398 0.393 0.411 0.432 0.356Tridem 0.271 0.272 0.268 0.269 0.273

53
Table 11 Load Spectra Coefficients of Site 6 (Station 72, Bowman)Axle
GroupBoth
DirectionsBoth Directions,
DayBoth Directions,
NightWestbound Eastbound
Steering 0.105 0.102 0.111 0.109 0.102Single 0.275 0.259 0.297 0.292 0.259
Tandem 0.636 0.620 0.657 0.614 0.659Tridem 0.330 0.337 0.316 0.305 0.353
4.1.2 Axle Load Spectra for Each Lane
The axle load spectra vary among lanes. Figures 26–29 show the load spectra of the four
axle groups on four lanes of Site 1. The load spectra of the other five sites are shown in
Appendix B. The corresponding load spectra coefficients are listed in Tables 12 through 17. For
each site, it can be observed that the load spectra for the lanes with the same lane number but
different directions of travel are similar, and that load spectra on the outside lanes are mostly
located to the right (heavier) side of the load spectra on the inside lanes. This difference shows
that heavier trucks run more frequently on the outside lanes than on the inside lanes. At Sites 2,
4 and 5, each of which have 3 lanes in one direction, the load spectra on the outside two lanes are
similar.
4.1.3 Axle Load Spectra by Year
The axle load spectra at Site 1 (Station 2) in each year from 1991 through 2000 are
shown in Figures 30–33. Figure 34 presents load spectra coefficients (LSCs) for Site 1 over the
same period for all four axle groups. It can be seen that the load spectra are similar in shape for
each year while the LSCs change with time. The LSCs of tandem and tridem axles decreased
from 1991 to 1994 and increased after 1995, which means that these two axle groups showed a
trend of becoming lighter from 1991 to 1994 and a trend of becoming heavier after 1995. The

54
0
0.05
0.1
0.15
0.2
0.25
0.3
0.35
0 20 40 60 80 100 120 140 160
Load, kN
Nor
mal
ized
Fre
quen
cySB-Lane 1SB-Lane 2NB-Lane 1NB-Lane 2
Figure 26. Axle load spectra by lane, Station 2 (Redding), steering axle.
0
0.02
0.04
0.06
0.08
0.1
0.12
0.14
0 20 40 60 80 100 120 140 160 180
Load, kN
Nor
mal
ized
Fre
quen
cy
SB-Lane 1SB-Lane 2NB-Lane 1NB-Lane 2
Figure 27. Axle load spectra by lane, Station 2 (Redding), single axle.

55
0
0.02
0.04
0.06
0.08
0.1
0.12
0.14
0.16
0.18
0.2
0 50 100 150 200 250 300
Load, kN
Nor
mal
ized
Fre
quen
cySB-Lane 1SB-Lane 2NB-Lane 1NB-Lane 2
Figure 28. Axle load spectra by lane, Station 2 (Redding), tandem axle.
0
0.02
0.04
0.06
0.08
0.1
0.12
0 50 100 150 200 250 300 350 400
Load, kN
Nor
mal
ized
Fre
quen
cy
SB-Lane 1SB-Lane 2NB-Lane 1NB-Lane 2
Figure 29. Axle load spectra by lane, Station 2 (Redding), tridem axle.

56
0
0.05
0.1
0.15
0.2
0.25
0.3
0.35
0.4
0 20 40 60 80 100 120 140 160
Load Range, kN
Nor
mal
ized
Fre
quen
cy1991199219931994199519961997199819992000
Figure 30. Axle load spectra by year, Station 2 (Redding), steering axle.
0
0.02
0.04
0.06
0.08
0.1
0.12
0 50 100 150 200
Load Range, kN
Nor
mal
ized
Fre
quen
cy
1991199219931994199519961997199819992000
Figure 31. Axle load spectra by year, Station 2 (Redding), single axle.

57
0
0.05
0.1
0.15
0.2
0.25
0 50 100 150 200 250 300 350
Load Range, kN
Nor
mal
ized
Fre
quen
cy1991199219931994199519961997199819992000
Figure 32. Axle load spectra by year, Station 2 (Redding), tandem axle.
Tridem Load Spectra
0
0.02
0.04
0.06
0.08
0.1
0.12
0.14
0 50 100 150 200 250 300 350 400
Load Range, kN
Nor
mal
ized
Fre
quen
cy
1991199219931994199519961997199819992000
Figure 33. Axle load spectra by year, Station 2 (Redding), tridem axle.

58
0
0.1
0.2
0.3
0.4
0.5
0.6
1990 1992 1994 1996 1998 2000 2002
Year
Load
Spe
ctra
Coe
ffici
ent STEER
SINGLETANDEMTRIDEM
Figure 34. Load spectra coefficients at Station 2 (Redding) by year for all four axle groups.
0.000
0.050
0.100
0.150
0.200
0.250
0.300
0.350
0.400
0.450
1990 1992 1994 1996 1998 2000 2002
Year
Load
Spe
ctra
Coe
ffici
ent
SteeringSingleTandemTridem
Figure 35. General load spectra coefficients across all stations in California in each year1991 through 2000.

59
Table 12 Load Spectra Coefficients of Site 1 (Station 2, Redding) by LaneAxle
GroupSouthbound
Lane 1Southbound
Lane 2Northbound
Lane 1Northbound
Lane 2Steering 0.135 0.112 0.117 0.114Single 0.271 0.319 0.321 0.330
Tandem 0.782 0.743 0.818 0.727Tridem 0.308 0.284 0.307 0.271
Table 13 Load Spectra Coefficients of Site 2 (Stations 17 and 18, Hayward) by LaneAxle
GroupSouthbound
Lane 4Southbound
Lane 5Southbound
Lane 6Northbound
Lane 4Northbound
Lane 5Northbound
Lane 6Steering 0.052 0.079 0.069 0.035 0.067 0.079Single 0.139 0.229 0.163 0.081 0.173 0.220
Tandem 0.320 0.333 0.334 0.279 0.295 0.357Tridem 0.315 0.310 0.225 0.118 0.167 0.181
Table 14 Load Spectra Coefficients of Site 3 (Station 21, Mojave) by LaneAxle
GroupWestbound
Lane 1Westbound
Lane 2Eastbound
Lane 1Eastbound
Lane 2Steering 0.068 0.067 0.078 0.090Single 0.160 0.348 0.217 0.261
Tandem 0.335 0.583 0.692 0.645Tridem 0.151 0.284 0.223 0.259
Table 15 Load Spectra Coefficients of Site 4 (Stations 47 and 48, Castaic) by LaneAxle
GroupSouthbound
Lane 4Southbound
Lane 5Southbound
Lane 6Northbound
Lane 4Northbound
Lane 5Northbound
Lane 6Steering 0.050 0.098 0.094 0.051 0.086 0.097Single 0.088 0.286 0.235 0.081 0.206 0.278
Tandem 0.296 0.560 0.492 0.271 0.339 0.461Tridem 0.190 0.352 0.212 0.125 0.171 0.238
Table 16 Load Spectra Coefficients of Site 5 (Stations 57 and 58, Pinole) by LaneAxle
GroupWestbound
Lane 4Westbound
Lane 5Westbound
Lane 6Eastbound
Lane 4Eastbound
Lane 5Eastbound
Lane 6Steering 0.064 0.085 0.093 0.056 0.091 0.109Single 0.114 0.189 0.218 0.116 0.171 0.268
Tandem 0.425 0.360 0.472 0.364 0.245 0.480Tridem 0.065 0.217 0.309 0.039 0.194 0.380

60
Table 17 Load Spectra Coefficients of Site 6 (Station 72, Bowman) by LaneAxle
GroupWestbound
Lane 2Westbound
Lane 3Eastbound
Lane 2Eastbound
Lane 3Steering 0.095 0.114 0.091 0.105Single 0.193 0.322 0.140 0.303
Tandem 0.623 0.612 0.638 0.662Tridem 0.241 0.316 0.158 0.376
LSCs of steering and single axles did not show much yearly change. The LSCs of the other five
sites (shown in Appendix C) also show that the LSCs of steering and single axles are similar
among years, while the LSCs of tandem and tridem axles vary from year to year.
Figure 35 shows the general load spectra coefficients across all stations in California for
each year. It shows that the LSC of the steering axle group is stable across all years, while the
LSCs of single, tandem, and tridem axles decreased from 1991 to 1995 and then remained stable
after 1996.
4.2 Truck Traffic Volume Analysis
4.2.1 Traffic distribution between day and night
Traffic distribution between day and night is an important factor in pavement design
because the environmental factors (e.g., temperature) vary greatly between day and night, which
leads to corresponding changes in pavement material properties.
The percentage of trucks operating in the daytime for each direction for each truck type
and total and total truck types for the six sites are shown in Figures 36 through 41. It can be
observed that the daytime percentages are similar for both directions at a given WIM site. In
general, the daytime truck percentage for total truck types ranges from 55 to 75 percent, and is
close to the corresponding values of Truck Type 9.

61
Station 2 Redding - Daytime Truck Percentage
0
10
20
30
40
50
60
70
80
90
100
All Typ
es
Type 4
Type 5
Type 6
Type 7
Type 8
Type 9
Type 1
0
Type 1
1
Type 1
2
Type 1
3
Type 1
4
Type 1
5
Truck Type
Day
time
Truc
k Pe
rcen
tage
, %
Southbound
Northbound
Figure 36. Percentage of trucks operating in the daytime, Station 2 (Redding).
Stations 17 & 18 Hayward - Daytime Truck Percentage
0
10
20
30
40
50
60
70
80
90
100
All Typ
es
Type 4
Type 5
Type 6
Type 7
Type 8
Type 9
Type 1
0
Type 1
1
Type 1
2
Type 1
3
Type 1
4
Type 1
5
Truck Type
Day
time
Truc
k Pe
rcen
tage
, %
SouthboundNorthbound
Figure 37. Percentage of trucks operating in the daytime, Stations 17 and 18 (Hayward).

62
Station 21 Mojave - Daytime Truck Percentage
0
10
20
30
40
50
60
70
80
90
All Typ
es
Type 4
Type 5
Type 6
Type 7
Type 8
Type 9
Type 1
0
Type 1
1
Type 1
2
Type 1
3
Type 1
4
Type 1
5
Truck Type
Day
time
Truc
k Pe
rcen
tage
, %
Westbound
Eastbound
Figure 38. Percentage of trucks operating in the daytime, Station 21 (Mojave).
Stations 47 & 48 Castaic - Daytime Truck Percentage
0
10
20
30
40
50
60
70
80
90
100
All Typ
es
Type 4
Type 5
Type 6
Type 7
Type 8
Type 9
Type 1
0
Type 1
1
Type 1
2
Type 1
3
Type 1
4
Type 1
5
Truck Type
Day
time
Truc
k Pe
rcen
tage
, %
Southbound
Northbound
Figure 39. Percentage of trucks operating in the daytime, 47 and 48 (Castaic).

63
Stations 57 & 58 Pinole - Daytime Truck Percentage
0
10
20
30
40
50
60
70
80
90
100
All Typ
es
Type 4
Type 5
Type 6
Type 7
Type 8
Type 9
Type 1
0
Type 1
1
Type 1
2
Type 1
3
Type 1
4
Type 1
5
Truck Type
Day
time
Truc
k Pe
rcen
tage
, %
Westbound
Eastbound
Figure 40. Percentage of trucks operating in the daytime, Stations 57 and 58 (Pinole).
Station 72 Bowman - Daytime Truck Percentage
0
10
20
30
40
50
60
70
80
90
100
All Typ
es
Type 4
Type 5
Type 6
Type 7
Type 8
Type 9
Type 1
0
Type 1
1
Type 1
2
Type 1
3
Type 1
4
Type 1
5
Truck Type
Day
time
Truc
k Pe
rcen
tage
, %
Westbound
Eastbound
Figure 41. Percentage of trucks operating in the daytime, (Bowman).

64
Figure 42 shows each sampled day’s daytime percentage for total truck types at Station 2.
The higher points in the figure are for weekdays and the lower points are for weekends. This
figure shows that the daytime percentage is quite stable across the whole analysis period.
Similar conclusions can be made from other sites’ daytime truck percentage diagrams, which are
shown in Appendix D.
4.2.2 Traffic Seasonal Distribution
Traffic seasonal distribution is also an important factor in pavement design because the
same traffic loading will have different effects on pavement damage during different seasons.
The seasonal average daily truck traffic volume for Site 1 (Station 2) and Site 2 (Stations
17 and 18) are shown in Figures 43 and 44, respectively. The figures show that there is little
seasonal variation in traffic volume. The same conclusion can be drawn from the other 4 sites.
0
10
20
30
40
50
60
70
80
90
5/7/90 9/19/91 1/31/93 6/15/94 10/28/95 3/11/97 7/24/98 12/6/99 4/19/01 9/1/02
Date
Day
time
Truc
k Pe
rcen
tage
, %
SB NB
Figure 42. Percentage of trucks operating in the daytime, (Redding).

65
All T
ypes
Type
4
Type
5
Type
6
Type
7
Type
8
Type
9
Type
10
Type
11
Type
12
Type
13
Type
14
Type
15
0
1000
2000
3000
4000
5000
6000D
aily
Tru
ck V
olum
e
Truck Type
WetSpringDry
Figure 43. Seasonal average daily truck volume (both directions), Site 1 (Station 2,Redding).
All T
ypes
Type
4
Type
5
Type
6
Type
7
Type
8
Type
9
Type
10
Type
11
Type
12
Type
13
Type
14
Type
15
0
2000
4000
6000
8000
10000
12000
Dai
ly T
ruck
Vol
ume
Truck Type
WetSpringDry
Figure 44. Seasonal averaged daily truck volume (both directions), Site 2 (Stations 17 and18, Hayward).

66
4.2.3 Traffic Distribution by Lane
The knowledge of traffic distribution by lane is important in determining the expected
traffic volume that will travel on the designed pavement. Table 18 summarizes the distribution
of each truck type at the six WIM sites by lane.
Table 18 shows that when there are two lanes in one driving direction, over 90 percent of the
truck traffic will travel on the outside lane, and when there three or more lanes in one driving
direction, over 90 percent of the truck traffic will travel on the outermost two lanes. In the latter
situation, the truck traffic distribution between the outermost two lanes differs across sites. For
example, at Stations 17 and 18, the right-hand lane has a slightly smaller percentage than the left-
hand lane, while at Stations 47 and 48, the right-hand lane has a much larger percentage than the
left-hand lane.
Figures 45 through 48 show the averaged daily truck traffic volume distributions by lane
at Site 1 (Station 2) and Site 2 (Stations 17 and 18). The figures show that the truck traffic
distributions by lane are similar in both directions for a given WIM site.
4.2.4 Traffic Growth Trend Analysis
One of the main goals of truck traffic analysis is to produce a long-term forecast of traffic
loading on the pavement being considered. Two parameters are currently used by Caltrans to
estimate the traffic growth trend: annual average daily truck traffic (AADTT) and equivalent
single axle loads (ESALs). Figures 49 through 54 show truck volume and ESALs of the six
WIM sites for each sampled day. In each series, the higher points occur on weekdays and the
lower points occur on weekends. The figures show that the traffic volume reaches its maximum
value during June through August of each year.

67
Table 18 Truck Traffic Distribution by LaneTruck Traffic Distribution for Each Truck Type (percent)
Station LaneNo. All
TypesType
4Type
5Type
6Type
7Type
8Type
9Type
10Type
11Type
12Type
13Type
14Type
151 7 18 18 8 4 7 6 4 5 5 8 4 8Station 2
Southbound 2 93 82 82 92 96 93 94 96 95 95 92 96 921 7 19 17 9 0 8 6 5 5 6 5 5 10Station 2
Northbound 2 93 81 83 91 100 92 94 95 95 94 95 95 904 7 27 15 3 1 2 2 1 2 1 1 3 165 53 46 47 55 46 52 59 55 57 47 45 71 44Stations 17 & 18
Southbound 6 40 27 39 42 54 46 39 44 40 52 54 26 404 5 23 12 1 0 0 0 0 0 0 0 0 75 49 45 43 51 29 47 56 58 44 42 35 60 51Stations 17&18
Northbound 6 46 32 45 48 71 53 44 42 56 58 65 40 421 7 24 11 10 2 6 6 5 5 5 5 9 6Station 21
Westbound 2 93 76 89 90 30 94 94 95 95 95 96 91 941 7 18 11 9 1 5 7 6 6 5 5 5 5Station 21
Eastbound 2 93 82 89 91 28 95 93 94 94 95 95 95 954 2 46 10 4 0 1 0 0 0 0 0 0 25 38 44 43 40 19 37 37 33 37 38 19 34 34Stations 47 & 48
Southbound 6 60 11 47 56 81 62 62 66 63 62 81 66 644 3 49 10 4 0 1 0 0 0 0 0 0 55 27 37 42 30 5 30 26 22 22 22 12 26 32Stations 47 & 48
Northbound 6 70 14 48 66 95 69 74 77 78 77 88 74 634 3 24 8 2 0 0 0 0 0 0 0 0 65 36 52 39 30 8 29 37 45 24 27 24 20 29Stations 57 & 58
Westbound 6 61 24 53 68 72 70 63 55 76 73 76 80 654 6 31 14 4 0 0 0 0 0 0 0 0 55 48 53 46 41 14 44 55 59 35 45 37 29 41Stations 57 & 58
Eastbound 6 46 16 40 55 86 56 45 41 65 55 63 71 542 24 61 50 35 6 14 17 13 12 13 7 7 21Station 72
Westbound 3 76 39 50 65 94 86 83 87 88 87 93 93 792 25 56 60 31 0 17 12 13 8 10 1 11 18Station 72
Eastbound 3 75 44 40 69 100 83 88 87 92 90 99 89 82

68
All T
ypes
Type
4
Type
5
Type
6
Type
7
Type
8
Type
9
Type
10
Type
11
Type
12
Type
13
Type
14
Type
15
0
500
1000
1500
2000
2500Tr
uck
Volu
me
Truck Type
( 002_Redding SB)
Lane 1Lane 2
Figure 45. Truck traffic distribution by lane, Site 1 (Station 2, Redding), Southbound.
All T
ypes
Type
4
Type
5
Type
6
Type
7
Type
8
Type
9
Type
10
Type
11
Type
12
Type
13
Type
14
Type
15
0
500
1000
1500
2000
2500
Truc
k Vo
lum
e
Truck Type
( 002_Redding NB)
Lane 1Lane 2
Figure 46. Truck traffic distribution by lane, Site 1 (Station 2, Redding), Northbound.

69
All T
ypes
Type
4
Type
5
Type
6
Type
7
Type
8
Type
9
Type
10
Type
11
Type
12
Type
13
Type
14
Type
15
0
500
1000
1500
2000
2500Tr
uck
Volu
me
Truck Type
( 017018_Hayward SB)
Lane 4Lane 5Lane 6
Figure 47. Truck traffic distribution by lane, Site 2 (Stations 17 and 18, Hayward),Southbound.
All T
ypes
Type
4
Type
5
Type
6
Type
7
Type
8
Type
9
Type
10
Type
11
Type
12
Type
13
Type
14
Type
15
0
500
1000
1500
2000
2500
Truc
k Vo
lum
e
Truck Type
( 017018_Hayward NB)
Lane 4Lane 5Lane 6
Figure 48. Truck traffic distribution by lane, Site 2 (Stations 17 and 18, Hayward),Northbound.

70
0
1000
2000
3000
4000
5000
6000
7000
8000
9000
5/7/90 9/19/91 1/31/93 6/15/94 10/28/95 3/11/97 7/24/98 12/6/99 4/19/01
Date
Dai
ly T
ruck
Vol
ume
(ESA
L)
Truck Volume (SB)ESAL (SB)Truck Volume (NB)ESAL (NB)
Figure 49. Daily truck volume and ESALs at Site 1 (Station 2, Redding).
0
1000
2000
3000
4000
5000
6000
7000
8000
9000
5/7/90 9/19/91 1/31/93 6/15/94 10/28/95 3/11/97 7/24/98 12/6/99 4/19/01
Date
Truc
k Vo
lum
e (E
SAL)
Truck Volume (SB)ESAL (SB)Truck Volume (NB)ESAL (NB)
Figure 50. Daily truck volume and ESALs at Site 2 (Stations 17 and 18, Hayward).
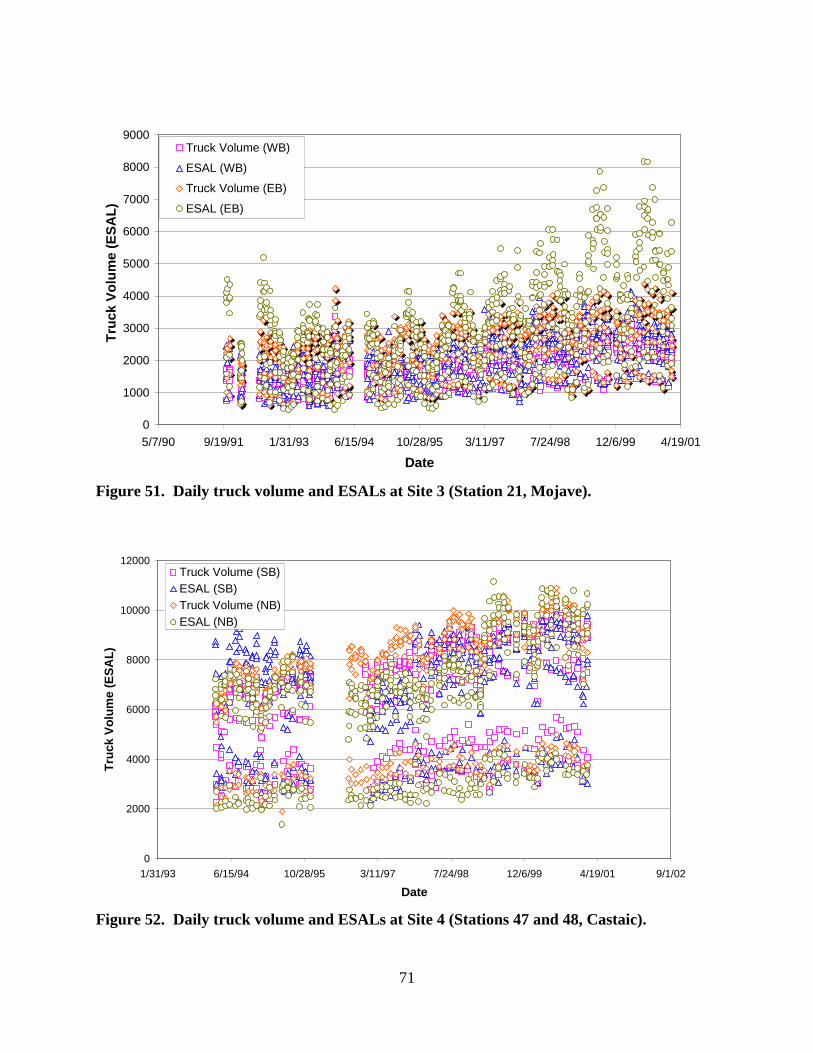
71
0
1000
2000
3000
4000
5000
6000
7000
8000
9000
5/7/90 9/19/91 1/31/93 6/15/94 10/28/95 3/11/97 7/24/98 12/6/99 4/19/01
Date
Truc
k Vo
lum
e (E
SAL)
Truck Volume (WB)ESAL (WB)Truck Volume (EB)
ESAL (EB)
Figure 51. Daily truck volume and ESALs at Site 3 (Station 21, Mojave).
0
2000
4000
6000
8000
10000
12000
1/31/93 6/15/94 10/28/95 3/11/97 7/24/98 12/6/99 4/19/01 9/1/02
Date
Truc
k Vo
lum
e (E
SAL)
Truck Volume (SB)ESAL (SB)Truck Volume (NB)ESAL (NB)
Figure 52. Daily truck volume and ESALs at Site 4 (Stations 47 and 48, Castaic).

72
0
1000
2000
3000
4000
5000
6000
7000
6/15/94 10/28/95 3/11/97 7/24/98 12/6/99 4/19/01 9/1/02
Date
Truc
k Vo
lum
e &
ESA
L
Truck Volume (WB)ESAL (WB)Truck Volume (EB)ESAL (EB)
Figure 53. Daily truck volume and ESALs at Site 5 (Stations 57 and 58, Pinole).
0
1000
2000
3000
4000
5000
6000
7000
12/1/96 6/19/97 1/5/98 7/24/98 2/9/99 8/28/99 3/15/00 10/1/00 4/19/01
Date
Truc
k Vo
lum
e &
ESA
L
Truck Volume (WB)ESAL (WB)Truck Volume (EB)ESAL (EB)
Figure 54. Daily truck volume and ESALs at Site 6 (Station 72, Bowman).

73
It can also be observed from Figures 49–54 that the traffic volume growth trends are
identical for both directions. Moreover, both traffic volume and ESALs show similar growth
trends over the time period studied.
However, traffic volume is the better choice to measure trends in truck traffic growth for
the following two reasons:
• ESALs have a larger variance than traffic volume. One of the reasons for this is that
there are still some erroneous records (e.g., extremely heavy axle load records) in the
raw data. Although their percentage is small, they generate erroneously large ESAL
numbers due to their heavy loads.
• In the analysis of load spectra, all the identifiable erroneous records were deleted.
These records, however, usually represent some real trucks. These records cannot be
used to calculate ESALs, but they should be included in the truck volume.
Based on these two reasons, it is more appropriate to use traffic volume to reflect truck
traffic growth trend.
Figure 55 shows the AADTT of Site 1 (Station 2), including the volume for each
direction of travel individually and both directions combined. Figure 56 shows the AADTT of
each truck type at this site.
From Figure 55, it can be observed that the southbound AADTT and the northbound
AADTT are almost identical and have the same growth trend.
Using simple linear regression modeling, a linear function was fitted to the AADTT for
both directions combined, which is given by:
yearAADTT ×+−= 29.211416653 (4)

74
0
1000
2000
3000
4000
5000
6000
7000
1990 1992 1994 1996 1998 2000 2002Year
AA
DTT
SouthboundNorthboundBoth Directions
Figure 55. Annual average daily truck traffic (AADTT) at Site 1 (Station 2, Redding).
0
1000
2000
3000
4000
5000
6000
7000
1990 1992 1994 1996 1998 2000 2002
Year
AA
DTT
ALL_TYPETYPE4TYPE5TYPE6TYPE7TYPE8TYPE9TYPE10TYPE11TYPE12TYPE13TYPE14TYPE15
Figure 56. Annual average daily truck traffic of each truck type at Site 1 (Station 2,Redding).

75
The multiple R-Squared is 0.82, which indicates that the linear relationship between AADTT and
year is good.
Using annual growth rate can also be estimated using non-linear regression modeling.
The function used in the non-linear regression analysis has the following form:
)1990(10 )1( −+×= yearbbAADTT (5)
Where:
b0 = Coefficient.b1 = Annual Growth Rate.
For Site 1, the estimated annual growth rate b1 of truck traffic volume (both directions
combined) is 4.2 percent.
Figure 56 shows that the increase in the total traffic volume was mainly caused by the
increase in the volumes of Truck Types 5 and 9 — especially Truck Type 9. Therefore, the
growth trend of total traffic volume can be roughly estimated from the growth trend of Truck
Type 9. This conclusion is valid with the qualification that if these truck types fall out of favor
due to legislation or other causes, then their use as an estimate will no longer be valid.
Similar conclusions for the other 5 sites can be obtained from their AADTT diagrams,
which are shown in the appendices, and the estimated annual growth rates listed in Table 19.
Table 19 Estimated Annual Growth Rate of Truck Traffic Volume at 6 WIM sites
Station No. Annual Growth Rate ofTotal Truck Traffic (%)
Annual Growth Rate ofType 9 Truck Traffic (%)
2 (Redding) 4.2 5.717 & 18 (Hayward) 3.0 2.521 (Mojave) 3.9 3.647 & 48 (Castaic) 2.4 4.457 & 58 (Pinole) 4.9 5.172 (Bowman) 2.0 1.3

76
4.3 Side Wheel Load Difference Analysis
In pavement mechanical analysis, axle load is generally assumed to be distributed equally
on the wheels at each end of the axle. The validity of this assumption, however, directly affects
pavement performance. Large unequal distribution of axle load will accelerate pavement
damage and shorten pavement service life on the side where the heavier wheel travels.
Side wheel load difference can be represented by Side Wheel Load Difference Ratio
(SWLDR), which is calculated with the following equation:
( ) ( ) %100×+−= leftrightleftright LLLLSWLDR (2)
Where:Lright = Right side wheel load (kN)Lleft = Left side wheel load (kN)
The side wheel load difference ratio distributions of the four axle groups at Station 2 are
shown in Figures 57 and 58. It can be observed that SWLDR has a normal distribution shape,
with most of its values in the range of –20 to +20 percent. The expectations of this distribution
are greater than zero and smaller than 3 percent, which means that right-side wheel loads are a
little heavier than the left-side loads. This result can be attributed to the transverse slope of the
pavement. The SWLDR distributions at the other 5 sites are shown in Appendix E, which gives
similar results. These results suggest that the side wheel load difference can probably be ignored
in pavement analysis.
4.4 Truck Speed Analysis
Truck speed information is also useful in pavement design. Figures 59 and 60 show the
speed distribution of each truck type at Station 2. It can be observed from these figures that the
speed of each truck type has a narrow distribution, mainly between 80 km/h (50 mph) and 112

77
0
0.01
0.02
0.03
0.04
0.05
0.06
0.07
0.08
0.09
0.1
0.11
0.12
-60 -40 -20 0 20 40 60
Side Load Difference Ratio, %
Nor
mal
ized
Fre
quen
cy
SteeringSingleTandemTridem
Steering Single Tandem TridemMean 1.3948 1.6371 1.5254 2.2497S.D. 6.0478 8.1319 5.1854 7.0773
Figure 57. Side wheel load difference ratio distribution, Site 1 (Station 2, Redding),Southbound.
0
0.01
0.02
0.03
0.04
0.05
0.06
0.07
0.08
0.09
0.1
0.11
0.12
-60 -40 -20 0 20 40 60
Side Load Difference Ratio, %
Nor
mal
ized
Fre
quen
cy
SteeringSingleTandemTridem
Steering Single Tandem TridemMean 0.6302 0.4364 0.7722 0.9133S.D. 6.3141 7.4965 4.9256 6.4349
Figure 58. Side wheel load difference ratio distribution, Site 1 (Station 2, Redding),Northbound.

78
0
0.05
0.1
0.15
0.2
0.25
0.3
0.35
30 40 50 60 70 80 90
Speed, Miles/Hour
Nor
mal
ized
Fre
quen
cy
Type4Type5Type6Type7Type8Type9Type10Type11Type12Type13Type14Type15
Figure 59. Speed distribution of each truck type at Site 1 (Station 2, Redding),Southbound.
0
0.05
0.1
0.15
0.2
0.25
0.3
0.35
30 40 50 60 70 80 90
Speed, Miles/Hour
Nor
mal
ized
Fre
quen
cy
Type4Type5Type6Type7Type8Type9Type10Type11Type12Type13Type14Type15
Figure 60. Speed distribution of each truck type at Site 1 (Station 2, Redding),Northbound.

79
km/h (70 mph), except for the speed distributions of Truck Types 4 and 5, which fall between 80
km/h (50 mph) and 120 km/h (75 mph).
Table 20 gives the average speed of each truck type at the six WIM sites. This table
shows that the average speed of each truck is similar between two directions, but different
between sites. The table also shows that the average speeds of Truck Type 5 through Truck Type
15 are quite similar at the same site, most of which vary between 80 km/h (50 mile/h) and 96
km/h (60 mile/h).
Table 20 Average Speed Of Each Truck Type at 6 WIM SitesSpeed by Truck Type (km/h)Station
No. Location Direction 4 5 6 7 8 9 10 11 12 13 14 15Southbound 103 97 93 90 92 93 92 92 92 90 92 922 Redding Northbound 103 97 92 87 90 93 92 92 92 89 92 92Southbound 92 87 85 84 85 85 85 85 87 77 87 7617 &
18 Hayward Northbound 89 84 82 80 82 82 80 84 82 79 84 77Westbound 92 87 87 76 84 84 82 76 79 66 84 8421 Mojave Eastbound 97 92 93 89 90 92 90 92 92 85 90 90Southbound 101 93 92 85 90 90 90 92 92 85 90 8947 &
48 Castaic Northbound 100 93 90 84 90 90 90 90 90 84 90 90Westbound 89 85 80 74 80 80 80 79 79 71 77 7757 &
58 Pinole Eastbound 95 90 87 85 89 89 87 89 89 84 87 84Westbound 109 106 101 97 100 101 101 103 103 98 98 9572 Bowman Eastbound 105 105 100 95 97 95 95 93 95 93 93 92
4.5 Truck Gross Weight Analysis
The changes in truck gross weight are directly related to the effect that truck traffic has
on pavement damage. They can also reflect the economic development of an area. Changes in
truck gross weights were analyzed for this report for the period 1991–2000. The legal maximum
gross vehicle weight in California is 355 kN (80,000 lbs.).
Because the gross weight of one truck type running on a certain highway has a
distribution pattern instead of a single value, it’s somewhat difficult to describe its variation

80
trend. One direct method is to draw the gross weight distribution curve of each year in the same
diagram and make a visual comparison.
Figures 61–72 show the gross weight distribution of each truck type at Station 2
(Redding) northbound from 1991 to 2000. It can be observed that the gross weight distribution
shifts slightly to the right (heavier) over time for Truck Types 6, 8 and 9, and shows no
significant change for other truck types except Truck Types 7 and 13, which came from small
sample sizes. As Truck Types 5, 6, 8, 9, and 11 make up the majority of total truck traffic
volume, it can be concluded that in general, there is a slight increase in the truck gross weight at
Station 2. To quantify this increase, the mean value of truck gross weight distribution was
computed and fitted with non-linear regression functions. The maximum legal truck gross
weight for Truck Type 9 is 356 kN (80,000 lbs.)
Figure 73 shows the yearly averaged truck gross weight at Station 2 northbound.
The fitted annual growth rates at the six sites are shown in Table 21 and Figure 74. The
apparent large values of Truck Type 13 were caused by a small sample size and do not have
much meaning.
It can be observed that the growth rates of truck gross weight are different between sites
and between truck types. Generally the value is between –1 and +2 percent.
Table 21 Annual Growth Rate of Truck Gross Weight at Six WIM Sites.Growth Rate by Truck Type (percent)Station
No. 4 5 6 7 8 9 10 11 12 13 14 152 1.54 -0.13 0.75 3.05 3.41 0.95 0.76 1.57 1.81 4.93 0.49 -0.74
17 & 18 0.45 0.07 0.29 0.47 0.78 -0.43 1.04 -0.24 -0.67 3.46 -0.27 3.5121 0.76 0.89 1.57 -0.17 2.47 0.12 0.44 0.67 0.51 2.59 0.89 -1.80
47 & 48 0.17 0.54 0.69 0.96 1.65 -0.37 -0.88 -0.39 -1.45 0.25 -0.72 1.7157 & 58 -0.20 -0.10 0.25 -0.49 2.34 0.05 0.61 0.06 0.45 3.36 0.81 0.42
72 -0.06 -2.86 0.99 1.65 0.68 -1.35 0.62 -0.16 -0.15 4.41 -0.41 -6.27

81
0
5
10
15
20
25
30
0 100 200 300 400 500 600 700 800 900 1000
Truck Type 4 Gross Weight, kN
Nor
mal
ized
Fre
quen
cy, % 1991
199219931994199519961997199819992000
Figure 61. Truck gross weight distribution for Truck Type 4 at Site 1 (Station 2, Redding),Northbound.
0
5
10
15
20
25
30
0 100 200 300 400 500 600 700 800 900 1000
Truck Type 5 Gross Weight, kN
Nor
mal
ized
Fre
quen
cy, % 1991
199219931994199519961997199819992000
Figure 62. Truck gross weight distribution for Truck Type 5 at Site 1 (Station 2, Redding),Northbound.

82
0
5
10
15
20
25
30
0 100 200 300 400 500 600 700 800 900 1000
Truck Type 6 Gross Weight, kN
Nor
mal
ized
Fre
quen
cy, % 1991
199219931994199519961997199819992000
Figure 63. Truck gross weight distribution for Truck Type 6 at Site 1 (Station 2, Redding),Northbound.
0
5
10
15
20
25
30
0 100 200 300 400 500 600 700 800 900 1000
Truck Type 7 Gross Weight, kN
Nor
mal
ized
Fre
quen
cy, %
1991199219931994199519961997199819992000
Figure 64. Truck gross weight distribution for Truck Type 7 at Site 1 (Station 2, Redding),Northbound.

83
0
5
10
15
20
25
30
0 100 200 300 400 500 600 700 800 900 1000
Truck Type 8 Gross Weight, kN
Nor
mal
ized
Fre
quen
cy, % 1991
199219931994199519961997199819992000
Figure 65. Truck gross weight distribution for Truck Type 8 at Site 1 (Station 2, Redding),Northbound.
0
5
10
15
20
25
30
0 100 200 300 400 500 600 700 800 900 1000
Truck Type 9 Gross Weight, kN
Nor
mal
ized
Fre
quen
cy, % 1991
199219931994199519961997199819992000
Figure 66. Truck gross weight distribution for Truck Type 9 at Site 1 (Station 2, Redding),Northbound.

84
0
5
10
15
20
25
30
0 100 200 300 400 500 600 700 800 900 1000
Truck Type 10 Gross Weight, kN
Nor
mal
ized
Fre
quen
cy, %
1991199219931994199519961997199819992000
Figure 67. Truck gross weight distribution for Truck Type 10 at Site 1 (Station 2,Redding), Northbound.
0
5
10
15
20
25
30
0 100 200 300 400 500 600 700 800 900 1000
Truck Type 11 Gross Weight, kN
Nor
mal
ized
Fre
quen
cy, %
1991199219931994199519961997199819992000
Figure 68. Truck gross weight distribution for Truck Type 11 at Site 1 (Station 2,Redding), Northbound.

85
0
5
10
15
20
25
30
0 100 200 300 400 500 600 700 800 900 1000
Truck Type 12 Gross Weight, kN
Nor
mal
ized
Fre
quen
cy, %
1991199219931994199519961997199819992000
Figure 69. Truck gross weight distribution for Truck Type 12 at Site 1 (Station 2,Redding), Northbound.
0
5
10
15
20
25
30
0 100 200 300 400 500 600 700 800 900 1000
Truck Type 13 Gross Weight, kN
Nor
mal
ized
Fre
quen
cy, %
1991199219931994199519961997199819992000
Figure 70. Truck gross weight distribution for Truck Type 13 at Site 1 (Station 2,Redding), Northbound.

86
0
5
10
15
20
25
30
0 100 200 300 400 500 600 700 800 900 1000
Truck Type 14 Gross Weight, kN
Nor
mal
ized
Fre
quen
cy, %
1991199219931994199519961997199819992000
Figure 71. Truck gross weight distribution for Truck Type 14 at Site 1 (Station 2,Redding), Northbound.
0
5
10
15
20
25
30
0 100 200 300 400 500 600 700 800 900 1000
Truck Type 15 Gross Weight, kN
Nor
mal
ized
Fre
quen
cy, % 1991
199219931994199519961997199819992000
Figure 72. Truck gross weight distribution for Truck Type 15 at Site 1 (Station 2,Redding), Northbound.

87
0
100
200
300
400
500
600
1990 1992 1994 1996 1998 2000 2002
Year
Truc
k G
ross
Wei
ght,
KN
Type_4Type_5Type_6Type_7Type_8Type_9Type_10Type_11Type_12Type_13Type_14Type_15
Figure 73. Average yearly truck gross weight at Site 1 (Station 2, Redding), Northbound.
-0.08
-0.06
-0.04
-0.02
0
0.02
0.04
0.06
Site 1 Site 2 Site 3 Site 4 Site 5 Site 6
WIM Site
Ann
ual G
row
th R
ate
Type_4 Type_5Type_6 Type_7Type_8 Type_9Type_10 Type_11Type_12 Type_13Type_14 Type_15
(Sta. 2) (Sta. 17 & 18) (Sta. 21) (Sta. 47 & 48) (Sta. 57 & 58) (Sta. 72)
Figure 74. Annual growth rate of truck gross weight at six WIM sites.

88

89
5.0 COMPARISON OF TRUCK TRAFFIC AMONG SITES
Although there are more than 100 WIM stations across the state highway system in
California and more stations will be installed in the future, there still remain many highway links
from which traffic data are not available. It would be useful if the truck traffic characteristics on
these links can be inferred from the traffic data from adjacent WIM stations.
The two most important traffic characteristics are axle load spectra and truck traffic
volume. In this section, these two factors are compared for selected adjacent WIM sites.
Six WIM station groups were selected according to their geographic distribution, which
is shown in Table 22 and Figure 75. All these station groups are located in areas with low WIM
station density, and all WIM stations in one group are close to each other geographically.
Table 22 Six WIM Station Groups ComparedGroup No. WIM Stations Included
1 20, 86, 932 2, 28, 303 21, 73, 744 25, 66, 715 43, 76, 956 22, 23, 26
Load spectra coefficient (LSC) was used to compare the load spectra of each axle group,
and AADTT (both directions combined) from year 2000 was used to compare truck traffic
volume of each site. Their values are presented in Table 23. Load spectra coefficients are also
shown in Figures 76 through 81.
It can be observed from the data presented in Table 23 that for Groups 2, 5, and 6, the
LSCs are close to one another for all four axle groups. For Groups 1, 3, and 4, the LSCs of
tandem and tridem axles are significantly across the stations in the group, but the LSCs of the

90
Table 23 Load Spectra Coefficient and AADTT of Six WIM Station GroupsLoad Spectra CoefficientGroup WIM Station Steering Single Tandem Tridem AADTT
Station 20 0.083 0.300 0.863 0.190 1446Station 86 0.079 0.303 0.739 1.912 20571Station 93 0.050 0.185 0.446 0.161 561Station 2 0.108 0.322 0.739 0.279 6234Station 28 0.094 0.357 0.751 0.258 10542Station 30 0.098 0.301 0.737 0.229 5689Station 21 0.078 0.295 0.615 0.267 5443Station 73 0.111 0.300 0.532 0.214 76043Station 74 0.087 0.288 0.405 0.172 8529Station 25 0.101 0.340 0.738 0.339 5824Station 66 0.107 0.342 0.589 0.238 65844Station 71 0.114 0.334 0.746 0.222 3784Station 43 0.070 0.271 0.545 0.200 1782Station 76 0.068 0.242 0.465 0.202 36165Station 94 0.085 0.208 0.487 0.215 3123Station 22 0.067 0.213 0.405 0.279 1666Station 23 0.072 0.241 0.429 0.270 32176Station 26 0.079 0.175 0.394 0.289 1811
steering and single axles are similar. This means that it is possible to extend the axle load
spectra of available WIM stations to adjacent sites where WIM stations are not installed,
especially for the load spectra of steering axle and single axle. But this interpolation should be
made judiciously according to results from these adjacent WIM stations. These LSCs/Truck
Factors can probably be improved by inclusion of additional information such as area economic
factors, local population, and highway direction.
Table 23 shows that AADTT varies widely in each group and therefore the interpolation
of AADTT is not useful. However, this value can be obtained from the Annual Average Daily
Truck Traffic on the California State Highway System compiled by Traffic and Vehicle Data
Systems, which can be obtained from Caltrans (6).

91
Figure 75. The six WIM station groups used in comparison.

92
0
0.5
1
1.5
2
2.5
Steering Single Tandem Tridem
Axle Group
Load
Spe
ctra
Coe
ffici
ent
Site 20 Site 86 Site 93
Figure 76. Comparison of load spectra coefficients from Group 1.
0
0.1
0.2
0.3
0.4
0.5
0.6
0.7
0.8
Steering Single Tandem Tridem
Axle Group
Load
Spe
ctra
Coe
ffice
nt
Site 2 Site 28 Site 30
Figure 77. Comparison of load spectra coefficients from Group 2.
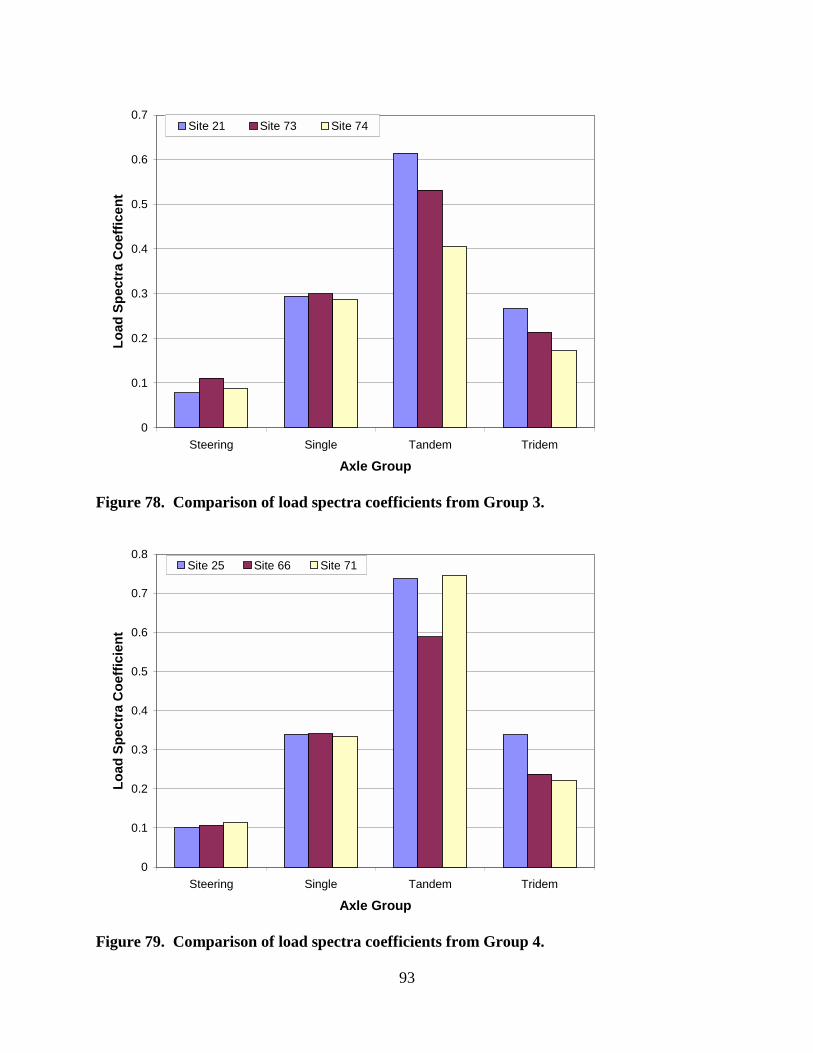
93
0
0.1
0.2
0.3
0.4
0.5
0.6
0.7
Steering Single Tandem Tridem
Axle Group
Load
Spe
ctra
Coe
ffice
ntSite 21 Site 73 Site 74
Figure 78. Comparison of load spectra coefficients from Group 3.
0
0.1
0.2
0.3
0.4
0.5
0.6
0.7
0.8
Steering Single Tandem Tridem
Axle Group
Load
Spe
ctra
Coe
ffici
ent
Site 25 Site 66 Site 71
Figure 79. Comparison of load spectra coefficients from Group 4.

94
0
0.1
0.2
0.3
0.4
0.5
0.6
Steering Single Tandem Tridem
Axle Group
Load
Spe
ctra
Coe
ffici
ent
Site 43 Site 76 Site 94
Figure 80. Comparison of load spectra coefficients from Group 5.
0
0.05
0.1
0.15
0.2
0.25
0.3
0.35
0.4
0.45
0.5
Steering Single Tandem Tridem
Axle Group
Load
Spe
ctra
Coe
ffici
ent
Site 22 Site 23 Site 26
Figure 81. Comparison of load spectra coefficients from Group 6.

95
6.0 CONCLUSIONS AND RECOMMENDATIONS
The complete truck traffic data collected from more than 100 WIM stations on the
California state highway network since 1991 were sampled and used in this analysis. For sites
where WIM stations were installed in the late 1990s, conclusions on truck traffic growth trend
may not be reliable because of the small sample size. The computer program developed in this
project to perform the analyses included in this report can accommodate more data collected in
the future, which will make future analysis results more accurate.
6.1 Summary
The database of Weigh-In-Motion (WIM) axle load and truck traffic count measurements
collected by the Caltrans from early 1991 through 2001 was converted from binary format,
cleaned, and organized into an accessible relational database. This database includes data from
more than 100 stations that were installed during that time.
Once the database was set up, a research-grade computer program was developed to
analyze the massive amount of data with the goal of answering specific questions of interest for
pavement design and management. Some questions were analyzed using the full data set from
all WIM stations, although only data from one week per month were analyzed because of the
time required to perform the analyses on the complete data set. Other questions were analyzed
using only data from six representative WIM stations, again because of the time required to
perform the analyses on the huge database.
The analyses performed for this study and included in this report are by no means
exhaustive, and were intended to answer a few important questions as well as to demonstrate the
quality and potential uses of the data included in the database. For sites where WIM stations
were installed in the late 1990s, conclusions regarding truck traffic growth trends may not be

96
reliable because of the small sample size. The computer program developed for this project can
accommodate more data collected in the future.
6.2 Conclusions Regarding Axle Load Spectra
6.2.1 Analysis of the Full Data Set
The following conclusions were drawn from analysis of the full data set of all WIM
stations across the time they were in operation:
1. A very small number of extremely high axle loads in the database are probably due to
error in the equipment and were not included in the analyses. A very few of these
loads may be real, and may represent permitted as well as illegal overloads.
2. Across all truck types operating in California:
a. nearly all steering axle loads are less than 90 kN,
b. nearly all of the single axle loads are less than 110 kN,
c. nearly all of the tandem axle loads are less than 210 kN, and
d. nearly all of the tridem axle loads are less than 260 kN.
The legal load limit for single axle loads is 89 kN, and the legal limit for tandem axle
loads is 151 kN. It is clear that there is a small, but significant portion of the axle
loads that are over the legal limit.
3. All four axle types had a bimodal pattern of load spectra. The reasons for these
bimodal patterns varied. For tandem axles, the bimodal pattern is due to the empty
and full loading status of Truck Type 9 (the predominant truck type, consisting of a
tractor with a tandem axle and a single semi-trailer with a tandem axle [3S2]). For

97
the other three axle types, the bimodal pattern is caused by the different loading levels
associated with the various truck types.
4. Axle load spectra are heavier at night than in the daytime. Two possible reasons for
this are that it is more efficient to operate when car traffic is lighter, and that heavier
and potentially overloaded trucks operate more at night when more Highway Patrol
load enforcement stations are closed.
5. Axle load spectra show very little seasonal variation. This contradicts the assumption
that truck loads are significantly influenced by agricultural hauling during the harvest
season (fall).
6. Axle load spectra are much higher in the Central Valley than in the Bay Area and
Southern California, particularly for tandem axles. Axle load spectra are similar
between the Bay Area and Southern California.
7. Axle load spectra are much higher at rural WIM stations compared to urban WIM
stations. This is likely due to the presence of more long-haul trucking at rural WIM
stations, and more short-haul, less-than-full-load trucking in urban areas.
8. The predominant truck types across the state are Truck Type 9, accounting for 49
percent of all trucks, and Truck Type 5 (two-axle truck with dual tires at the back
[2D]), accounting for 23 percent of all trucks. Truck Type 11 (tractor with single
axle, one semi-trailer with a single axle and another trailer with single axles [2S12])
accounted for 8 percent of all trucks, and the rest of the truck types together
accounted for the remaining 20 percent of all trucks.
9. The proportion of larger truck types, which would more typically be used for long-
haul trucking, increases at night, with Truck Type 9 accounting for 56 percent of all

98
trucks at night. The proportion of smaller truck types, such as Truck Type 5, that
would more typically be used for shorter deliveries decreases at night.
10. Truck type distribution does not change much across the seasons.
6.2.2 Conclusions from Analysis of the Six Representative WIM Sites: Axle Load Spectra,Truck Traffic Volumes, and Equivalent Single Axle Loads (ESALs)
The following conclusions were drawn from a set of six WIM sites selected to represent
different combinations of direction (east/westbound versus north/southbound), region (Bay Area,
Central Valley and Southern California), and urban versus rural:
11. Steering axle load spectra were similar across all six stations.
12. Axle load spectra for other axle types varied considerably across the six stations.
13. Axle load spectra were similar for both directions.
14. Axle load spectra were much heavier in the outside lanes.
15. Axle load spectra for steering and single axles remained fairly constant across the
years. Axle load spectra for tandem and tridem axles exhibited yearly variation.
16. The right-side (outside) ends of each axle were heavier on average than the left-side
ends, which can probably be attributed to the transverse slope of most facilities. The
difference was typically less than 3 percent on average, which indicates that it is
probably not significant enough to include in pavement design calculations.
17. For facilities with two lanes in each direction, more than 90 of the truck traffic
traveled in the outside lane. For facilities with three or more lanes in each direction,
more than 90 percent of the truck traffic traveled in the two outside lanes. The
distribution of trucks across those two outside lanes varied across the six sites.
99
18. All six sites showed growth of Average Annual Daily Truck Traffic (AADTT), with
growth rates ranging between 2 and 5 percent.
19. The growth rates for different truck types varied considerably.
20. Equivalent Single Axle Loads (ESAL) were calculated for each site and growth
trends were estimated for ESALs. Equivalent single axle loads were calculated using
the Caltrans exponential function with a 4.2 exponent. However, the growth trends
were erratic, primarily because a few very heavy and possibly erroneously measured
loads significantly influenced the ESAL calculations.
6.2.3 Conclusions from Analysis of the Six Representative WIM Sites: Truck Speeds andGross Vehicle Weights
21. Truck speeds typically fall within the range of 80 to 120 km/h (50 to 75 mph).
22. Truck speeds vary by truck type.
23. Examination of the truck speed distributions at Station 2 on Interstate 5 in Redding
indicated that many truck types have a bimodal speed distribution, which may reflect
loaded trucks traveling more slowly than unloaded trucks.
24. Gross Vehicle Weights (GVW) generally did not grow across the six sites. Annual
growth rates of GVW typically ranged between –1 and +2 percent. This conclusion
combined with conclusion 18, indicates that there were increasing numbers of trucks
using California highways in the 1990s, but the trucks were generally not carrying
heavier loads.
6.3 Conclusions Regarding Extrapolation of WIM Data to Adjacent Sites
The following conclusions are drawn from comparison of data from adjacent WIM sites:

100
25. Truck traffic volumes (AADTT) cannot be extrapolated from one site to another, and
must be measured for each site.
26. Axle load spectra, as characterized by Load Spectra Coefficients ([LSC] similar to
truck factors) can generally be extrapolated for steering and single axles to adjacent
sites. Differences in LSC for tandem and tridem axles are larger and more common
among adjacent sites, which means that extrapolation to adjacent sites for design is
more risky. The effect of extrapolation of axle load spectra to adjacent sites was not
quantified for different pavement types.
6.4 Recommendations for the Use of the WIM Database
1. It is recommended that Caltrans begin to use the WIM database for pavement design
and management. Caltrans does not currently use its WIM data for pavement design
and management. Traffic indices (summations of ESALs in the design period) for
pavement designs are currently estimated by a variety of means, and are often
considered to include gross over- and under-estimates. Anecdotal checks performed
by Caltrans Traffic Operations between WIM truck traffic counts and Traffic Index
calculations, and design estimates used in the districts have shown some large
discrepancies.
Truck volume estimates and ESAL estimates in the Caltrans Pavement
Management System database (7) are also suspected of containing significant
numbers of errors or poor relation to actual traffic, based on comparison of pavement
performance and traffic levels.
The data in the WIM database appears to be of much higher quality than the data
currently being used for pavement design and management. The primary problem

101
will be estimation of truck traffic volumes and load spectra coefficients for locations
that are not equipped with WIMs. A standard method needs to be developed for
filtering out the few super-heavy overloads that are probably errors, and that can skew
Traffic Index estimates using the WIM data.
2. It is recommended that further research be conducted to improve methods of
estimation for locations that are not equipped with WIMs. This research should
develop improved, statistically based estimation methods for truck traffic volumes
(AADTT) and Load Spectra Coefficients (LSC). The results should include
procedures for short-term measurements on non-WIM equipped locations, and
verification of the risk associated with errors in these estimation methods for different
pavement types.
6.5 Recommendations for Improving the Capability of the WIM Data Collection System
3. It is recommended that the two WIM vendors that Caltrans uses, IRD Inc. and PAT
Traffic Control Corporation, be contacted to find an improved method for identifying
and modifying erroneous records that appear as super-heavy overloads.
4. It is recommended that Caltrans continue to collect WIM data, and that Caltrans
Traffic Operations assume responsibility for expanding and maintaining the WIM
database that the University of California has created. This database can be of great
value to Design, Maintenance, and Materials for the design and maintenance of
pavements. The WIM database can also be used by Traffic Operations for the
development of Traffic Management Plans, because it provides very good estimates
of truck traffic volume that can augment loop detector data. If this recommendation
is implemented, the University of California and Caltrans Design, Maintenance, and

102
Materials can work with Traffic Operations in the future to increase the accessibility
of the WIM database to Caltrans engineers, and the ability to use it for analysis.
5. It is recommended that adequate resources be provided to perform quality assurance
checks at all WIM stations and to maintain them as needed. The high quality of the
WIM data is dependent upon the WIM devices being routinely checked, calibrated,
and maintained.

103
7.0 REFERENCES
1. Portland Cement Association. Thickness Design for Concrete Pavement. Portland CementAssociation, Illinois, 1966.
2. Personal conversation with developers of 2002 AASHTO Test Methods, currently in processof writing.
3. Lee, C. E. and N. Souny-Slitine. Final Research Findings on Traffic-Load ForecastingUsing Weigh-in-Motion Data. Research Report 987-7, Center for Transportation Research,Bureau of Engineering Research, the University of Texas at Austin, September 1998.
4. Hajek, J. J. and O. I. Selezneva. Estimating Cumulative Traffic Loads, Final Report forPhase 1. FHWA-RD-00-054, Federal Highway Administration, July 2000.
5. Hajek, J. .J. “General Axle Load Equivalency Factors.” Transportation Research BoardRecord 1482, Transportation Research Board, National Research Council, Washington, DC,1995, pp. 57-68.
6. California Department of Transportation. Annual Average Daily Truck Traffic on theCalifornia State Highway System. State of California, Business, Transportation and HousingAgency, Department of Transportation, 1998.
7. Lea, J. et al. Datamining of the Caltrans PMS Database. Draft report delivered to CaliforniaDepartment of Transportation. Pavement Research Center, University of California. June2002.

104

A-1
APPENDIX A:
AXLE LOAD SPECTRA IN TWO DIRECTIONS
(WHOLE DAY, DAYTIME AND NIGHT) AND EACH
DIRECTION AT 5 WIM SITES

A-2
Stations 17 & 18 Hayward - Steering Axle Load Spectra
0
0.05
0.1
0.15
0.2
0.25
0.3
0 20 40 60 80 100 120 140 160
Load, kN
Nor
mal
ized
Fre
quen
cy
2-Direction_Total2-Direct_Day2-Direct_NightSouthboundNorthtbound
Stations 17 & 18 Hayward - Single Axle Load Spectra
0
0.02
0.04
0.06
0.08
0.1
0.12
0.14
0 20 40 60 80 100 120 140 160 180Load, kN
Nor
mal
ized
Fre
quen
cy
2-Direction_Total2-Direct_Day2-Direct_NightSouthboundNorthbound

A-3
Stations 17 & 18 Hayward - Tandem Axle Load Spectra
0
0.02
0.04
0.06
0.08
0.1
0.12
0.14
0.16
0.18
0.2
0 50 100 150 200 250 300Load, kN
Nor
mal
ized
Fre
quen
cy
2-Direction_Total2-Direct_Day2-Direct_NightSouthboundNorthbound
Stations 17 & 18 Hayward - Tridem Axle Load Spectra
0
0.05
0.1
0.15
0.2
0.25
0 50 100 150 200 250 300 350 400
Load, kN
Nor
mal
ized
Fre
quen
cy
2-Direction_Total2-Direct_Day2-Direct_NightSouthboundNorthbound

A-4
Station 21 Mojave - Steering Axle Load Spectra
0
0.05
0.1
0.15
0.2
0.25
0.3
0.35
0.4
0 20 40 60 80 100 120 140 160
Load,kN
Nor
mal
ized
Fre
quen
cy
2-Direction_Total2-Direct_Day2-Direct_NightWestboundEastbound
Station 21 Mojave - Single Axle Load Spectra
0
0.02
0.04
0.06
0.08
0.1
0.12
0 20 40 60 80 100 120 140 160 180
Load,kN
Nor
mal
ized
Fre
quen
cy
2-Direction_Total2-Direct_Day2-Direct_NightWestboundEastbound

A-5
Station 21 Mojave - Tandem Axle Load Spectra
0
0.02
0.04
0.06
0.08
0.1
0.12
0.14
0.16
0.18
0.2
0 50 100 150 200 250 300
Load,kN
Nor
mal
ized
Fre
quen
cy
2-Direction_Total2-Direct_Day2-Direct_NightWestboundEastbound
Station 21 Mojave - Tridem Axle Load Spectra
0
0.02
0.04
0.06
0.08
0.1
0.12
0 50 100 150 200 250 300 350 400
Load,kN
Nor
mal
ized
Fre
quen
cy
2-Direction_Total2-Direct_Day2-Direct_NightWestboundEastbound
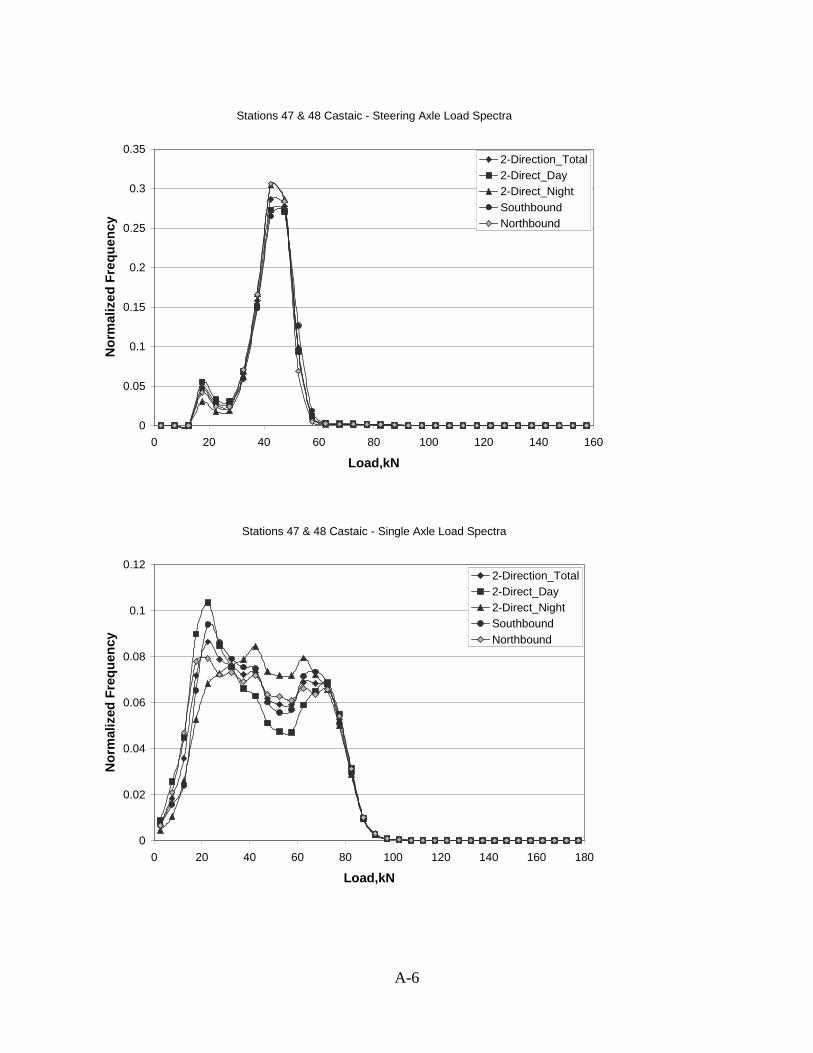
A-6
Stations 47 & 48 Castaic - Steering Axle Load Spectra
0
0.05
0.1
0.15
0.2
0.25
0.3
0.35
0 20 40 60 80 100 120 140 160
Load,kN
Nor
mal
ized
Fre
quen
cy
2-Direction_Total2-Direct_Day2-Direct_NightSouthboundNorthbound
Stations 47 & 48 Castaic - Single Axle Load Spectra
0
0.02
0.04
0.06
0.08
0.1
0.12
0 20 40 60 80 100 120 140 160 180
Load,kN
Nor
mal
ized
Fre
quen
cy
2-Direction_Total2-Direct_Day2-Direct_NightSouthboundNorthbound

A-7
Stations 47 & 48 Castaic - Tandem Axle Load Spectra
0
0.02
0.04
0.06
0.08
0.1
0.12
0.14
0 50 100 150 200 250 300
Load,kN
Nor
mal
ized
Fre
quen
cy
2-Direction_Total2-Direct_Day2-Direct_NightSouthboundNorthound
Stations 47 & 48 Castaic - Tridem Axle Load Spectra
0
0.02
0.04
0.06
0.08
0.1
0.12
0 50 100 150 200 250 300 350 400
Load,kN
Nor
mal
ized
Fre
quen
cy
2-Direction_Total2-Direct_Day2-Direct_NightSouthboundNorthbound

A-8
Stations 57 & 58 Pinole - Steering Axle Load Spectra
0
0.05
0.1
0.15
0.2
0.25
0 20 40 60 80 100 120 140 160
Load,kN
Nor
mal
ized
Fre
quen
cy
2-Direction_Total2-Direct_Day2-Direct_NightWestboundEastbound
Stations 57 & 58 Pinole - Single Axle Load Spectra
0
0.02
0.04
0.06
0.08
0.1
0.12
0.14
0.16
0 20 40 60 80 100 120 140 160 180
Load,kN
Nor
mal
ized
Fre
quen
cy
2-Direction_Total2-Direct_Day2-Direct_NightWestboundEastbound
\

A-9
Stations 57 & 58 Pinole - Tandem Axle Load Spectra
0
0.02
0.04
0.06
0.08
0.1
0.12
0.14
0.16
0.18
0 50 100 150 200 250 300
Load,kN
Nor
mal
ized
Fre
quen
cy
2-Direction_Total2-Direct_Day2-Direct_NightWestboundEastbound
Stations 57 & 58 Pinole - Tridem Axle Load Spectra
0
0.05
0.1
0.15
0.2
0.25
0 50 100 150 200 250 300 350 400
Load,kN
Nor
mal
ized
Fre
quen
cy
2-Direction_Total2-Direct_Day2-Direct_NightWestboundEastbound

A-10
Station 72 Bowman - Steering Axle Load Spectra
0
0.05
0.1
0.15
0.2
0.25
0.3
0.35
0.4
0 20 40 60 80 100 120 140 160
Load, kN
Nor
mal
ized
Fre
quen
cy
2-Direction_Total2-Direct_Day2-Direct_NightWestboundEastbound
Station 72 Bowman - Single Axle Load Spectra
0
0.02
0.04
0.06
0.08
0.1
0.12
0.14
0 20 40 60 80 100 120 140 160 180
Load, kN
Nor
mal
ized
Fre
quen
cy
2-Direction_Total2-Direct_Day2-Direct_NightWestboundEastbound

A-11
Station 72 Bowman - Tandem Axle Load Spectra
0
0.02
0.04
0.06
0.08
0.1
0.12
0.14
0.16
0.18
0 50 100 150 200 250 300
Load, kN
Nor
mal
ized
Fre
quen
cy
2-Direction_Total2-Direct_Day2-Direct_NightWestboundEastbound
Station 72 Bowman - Tridem Axle Load Spectra
0
0.02
0.04
0.06
0.08
0.1
0.12
0.14
0 50 100 150 200 250 300 350 400
Load, kN
Nor
mal
ized
Fre
quen
cy
2-Direction_Total2-Direct_Day2-Direct_NightWestboundEastbound

A-12

B-1
APPENDIX B:
LANEWISE AXLE LOAD SPECTRA AT 5 WIM SITES

B-2
Station 17(SB) & 18(NB) Hayward - Steering Axle Load SpectraLane Distribution
0
0.05
0.1
0.15
0.2
0.25
0.3
0.35
0.4
0.45
0.5
0 20 40 60 80 100 120 140 160Load, kN
Nor
mal
ized
Fre
quen
cy
SB-Lane 4SB-Lane 5SB-Lane 6NB-Lane 4NB-Lane 5NB-Lane 6
Station 17(SB) & 18(NB) Hayward - Single Axle Load SpectraLane Distribution
0
0.05
0.1
0.15
0.2
0.25
0.3
0 20 40 60 80 100 120 140 160 180
Load, kN
Nor
mal
ized
Fre
quen
cy
SB-Lane 4SB-Lane 5SB-Lane 6NB-Lane 4NB-Lane 5NB-Lane 6

B-3
Station 17(SB) & 18(NB) Hayward - Tandem Axle Load SpectraLane Distribution
0
0.02
0.04
0.06
0.08
0.1
0.12
0.14
0.16
0.18
0 50 100 150 200 250 300Load, kN
Nor
mal
ized
Fre
quen
cy
SB-Lane 4SB-Lane 5SB-Lane 6NB-Lane 4NB-Lane 5NB-Lane 6
Station 17(SB) & 18(NB) Hayward - Tridem Axle Load SpectraLane Distribution
0
0.05
0.1
0.15
0.2
0.25
0.3
0.35
0.4
0.45
0.5
0 50 100 150 200 250 300 350 400Load, kN
Nor
mal
ized
Fre
quen
cy
SB-Lane 4SB-Lane 5SB-Lane 6NB-Lane 4NB-Lane 5NB-Lane 6

B-4
Station 21 Mojave - Steering Axle Load SpectraLane Distribution
0
0.05
0.1
0.15
0.2
0.25
0.3
0.35
0.4
0 20 40 60 80 100 120 140 160
Load, kN
Nor
mal
ized
Fre
quen
cy
WB-Lane 1WB-Lane 2EB-Lane 1EB-Lane 2
Station 21 Mojave - Single Axle Load SpectraLane Distribution
0
0.02
0.04
0.06
0.08
0.1
0.12
0 20 40 60 80 100 120 140 160 180
Load, kN
Nor
mal
ized
Fre
quen
cy
WB-Lane 1WB-Lane 2EB-Lane 1EB-Lane 2

B-5
Station 21 Mojave - Tandem Axle Load SpectraLane Distribution
0
0.05
0.1
0.15
0.2
0.25
0 50 100 150 200 250 300
Load, kN
Nor
mal
ized
Fre
quen
cy
WB-Lane 1WB-Lane 2EB-Lane 1EB-Lane 2
Station 21 Mojave - Tridem Axle Load SpectraLane Distribution
0
0.02
0.04
0.06
0.08
0.1
0.12
0.14
0 50 100 150 200 250 300 350 400
Load, kN
Nor
mal
ized
Fre
quen
cy
WB-Lane 1WB-Lane 2EB-Lane 1EB-Lane 2

B-6
Station 47(SB) & 48(NB) Castaic - Steering Axle Load SpectraLane Distribution
0
0.05
0.1
0.15
0.2
0.25
0.3
0.35
0.4
0 20 40 60 80 100 120 140 160
Load, kN
Nor
mal
ized
Fre
quen
cy
SB-Lane 4SB-Lane 5SB-Lane 6NB-Lane 4NB-Lane 5NB-Lane 6
Station 47(SB) & 48(NB) Castaic - Single Axle Load SpectraLane Distribution
0
0.05
0.1
0.15
0.2
0.25
0 20 40 60 80 100 120 140 160 180
Load, kN
Nor
mal
ized
Fre
quen
cy
SB-Lane 4SB-Lane 5SB-Lane 6NB-Lane 4NB-Lane 5NB-Lane 6

B-7
Station 47(SB) & 48(NB) Castaic - Tandem Axle Load SpectraLane Distribution
0
0.05
0.1
0.15
0.2
0.25
0 50 100 150 200 250 300Load, kN
Nor
mal
ized
Fre
quen
cy
SB-Lane 4SB-Lane 5SB-Lane 6NB-Lane 4NB-Lane 5NB-Lane 6
Station 47(SB) & 48(NB) Castaic - Tridem Axle Load SpectraLane Distribution
0
0.02
0.04
0.06
0.08
0.1
0.12
0.14
0.16
0.18
0 50 100 150 200 250 300 350 400Load, kN
Nor
mal
ized
Fre
quen
cy
SB-Lane 4SB-Lane 5SB-Lane 6NB-Lane 4NB-Lane 5NB-Lane 6

B-8
Station 57(EB) & 58 (WB) Pinole - Steering Axle Load SpectraLane Distribution
0
0.05
0.1
0.15
0.2
0.25
0.3
0.35
0.4
0.45
0.5
0 20 40 60 80 100 120 140 160
Load, kN
Nor
mal
ized
Fre
quen
cy
WB-Lane 4WB-Lane 5WB-Lane 6EB-Lane 4EB-Lane 5EB-Lane 6
Station 57(EB) & 58 (WB) Pinole - Single Axle Load SpectraLane Distribution
0
0.05
0.1
0.15
0.2
0.25
0.3
0.35
0.4
0 20 40 60 80 100 120 140 160 180
Load, kN
Nor
mal
ized
Fre
quen
cy
WB-Lane 4WB-Lane 5WB-Lane 6EB-Lane 4EB-Lane 5EB-Lane 6

B-9
Station 57(EB) & 58 (WB) Pinole - Tandem Axle Load SpectraLane Distribution
0
0.05
0.1
0.15
0.2
0.25
0 50 100 150 200 250 300
Load, kN
Nor
mal
ized
Fre
quen
cy
WB-Lane 4WB-Lane 5WB-Lane 6EB-Lane 4EB-Lane 5EB-Lane 6
Station 57(EB) & 58 (WB) Pinole - Tridem Axle Load SpectraLane Distribution
0
0.05
0.1
0.15
0.2
0.25
0.3
0.35
0.4
0 50 100 150 200 250 300 350 400
Load, kN
Nor
mal
ized
Fre
quen
cy
WB-Lane 4WB-Lane 5WB-Lane 6EB-Lane 4EB-Lane 5EB-Lane 6

B-10
Station 72 Bowman - Steering Axle Load SpectraLane Distribution
0
0.05
0.1
0.15
0.2
0.25
0.3
0.35
0.4
0.45
0 20 40 60 80 100 120 140 160Load, kN
Nor
mal
ized
Dis
trib
utio
n
WB-Lane 2WB-Lane 3EB-Lane 2EB-Lane 3
Station 72 Bowman - Single Axle Load SpectraLane Distribution
0
0.05
0.1
0.15
0.2
0.25
0.3
0 20 40 60 80 100 120 140 160 180Load, kN
Nor
mal
ized
Fre
quen
cy
WB-Lane 2WB-Lane 3EB-Lane 2EB-Lane 3

B-11
Station 72 Bowman - Tandem Axle Load SpectraLane Distribution
0
0.02
0.04
0.06
0.08
0.1
0.12
0.14
0.16
0.18
0.2
0 50 100 150 200 250 300Load, kN
Nor
mal
ized
Fre
quen
cy
WB-Lane 2WB-Lane3EB-Lane 2EB-Lane 3
Station 72 Bowman - Tridem Axle Load SpectraLane Distribution
0
0.02
0.04
0.06
0.08
0.1
0.12
0.14
0.16
0.18
0.2
0 50 100 150 200 250 300 350 400Load, kN
Nor
mal
ized
Fre
quen
cy
WB-Lane 2
WB-Lane 3
EB-Lane 2
EB-Lane 3

B-12

C-1
APPENDIX C:
LOAD SPECTRA COEFFICIENTS IN EACH YEAR AT
5 WIM SITES

C-2
Load Spectra Coefficients in Each Year at Station 21
0
0.1
0.2
0.3
0.4
0.5
0.6
1990 1992 1994 1996 1998 2000 2002
Year
Load
Spe
ctra
Coe
ffici
ent
SteeringSingleTandemTridem
Load Spectra Coefficients in Each Year at Stations 17&18
0
0.05
0.1
0.15
0.2
0.25
0.3
1990 1992 1994 1996 1998 2000 2002
Year
Load
Spe
ctra
Coe
ffici
ent
SteeringSingleTandemTridem

C-3
Load Spectra Coefficients in Each Year at Stations 47&48
0
0.05
0.1
0.15
0.2
0.25
0.3
0.35
0.4
1993 1994 1995 1996 1997 1998 1999 2000 2001 2002
Year
Load
Spe
ctra
Coe
ffici
ent
SteeringSingleTandemTridem
Load Spectra Coefficients in Each Year at Stations 57&58
0
0.05
0.1
0.15
0.2
0.25
0.3
0.35
1994 1995 1996 1997 1998 1999 2000 2001 2002
Year
Load
Spe
ctra
Coe
ffici
ent
SteeringSingleTandemTridem

C-4
Load Spectra Coefficients in Each Year at Station 72
0
0.05
0.1
0.15
0.2
0.25
0.3
0.35
0.4
0.45
0.5
1996 1997 1998 1999 2000 2001 2002
Year
Load
Spe
ctra
Coe
ffici
ent
SteeringSingleTandemTridem

D-1
APPENDIX D:
AADTT OF 5 WIM SITES

D-2
AADTT (017018_HAYWARD)
0
2000
4000
6000
8000
10000
12000
14000
1990 1992 1994 1996 1998 2000 2002
Year
AA
DTT
SouthboundNorthboundTwo Directions
AADTT (017018_HAYWARD)
0
2000
4000
6000
8000
10000
12000
14000
1990 1992 1994 1996 1998 2000 2002
Year
AA
DTT
ALL_TYPETYPE4TYPE5TYPE6TYPE7TYPE8TYPE9TYPE10TYPE11TYPE12TYPE13TYPE14TYPE15

D-3
AADTT (021_MOJAVE)
0
1000
2000
3000
4000
5000
6000
1990 1992 1994 1996 1998 2000 2002
Year
AA
DTT
WestboundEastboundTwo Directions
AADTT (021_MOJAVE)
0
1000
2000
3000
4000
5000
6000
1990 1992 1994 1996 1998 2000 2002
Year
AA
DTT
ALL_TYPETYPE4TYPE5TYPE6TYPE7TYPE8TYPE9TYPE10TYPE11TYPE12TYPE13TYPE14TYPE15

D-4
AADTT (047048_CASTAIC)
0
2000
4000
6000
8000
10000
12000
14000
16000
18000
1993 1994 1995 1996 1997 1998 1999 2000 2001 2002Year
AA
DTT
SouthboundNorthboundTwo Directions
AADTT (047048_CASTAIC)
0
2000
4000
6000
8000
10000
12000
14000
16000
18000
1993 1994 1995 1996 1997 1998 1999 2000 2001 2002
Year
AA
DTT
ALL_TYPETYPE4TYPE5TYPE6TYPE7TYPE8TYPE9TYPE10TYPE11TYPE12TYPE13TYPE14TYPE15

D-5
AADTT (057058_PINOLE)
0
1000
2000
3000
4000
5000
6000
7000
8000
9000
10000
1994 1995 1996 1997 1998 1999 2000 2001 2002Year
AA
DTT
WestboundEastboundTwo Drections
AADTT (057058_PINOLE)
0
1000
2000
3000
4000
5000
6000
7000
8000
9000
10000
1994 1995 1996 1997 1998 1999 2000 2001 2002
Year
AA
DTT
ALL_TYPETYPE4TYPE5TYPE6TYPE7TYPE8TYPE9TYPE10TYPE11TYPE12TYPE13TYPE14TYPE15

D-6
AADTT (072_BOWMAN)
0
1000
2000
3000
4000
5000
6000
1996 1997 1998 1999 2000 2001 2002Year
AA
DTT
WestboundEastboundTwo Directions
AADTT (072_BOWMAN)
0
1000
2000
3000
4000
5000
6000
1996 1997 1998 1999 2000 2001 2002
Year
AA
DTT
ALL_TYPETYPE4TYPE5TYPE6TYPE7TYPE8TYPE9TYPE10TYPE11TYPE12TYPE13TYPE14TYPE15

E-1
APPENDIX E:
DAYTIME TRUCK PERCENTAGE OF
EACH SAMPLED DAY AT 5 WIM SITES

E-2
DAYTIME TRUCK PERCENTAGE (%) ( 017018_HAYWARD )
0
10
20
30
40
50
60
70
80
90
5/7/90 9/19/91 1/31/93 6/15/94 10/28/95 3/11/97 7/24/98 12/6/99 4/19/01 9/1/02
Date
Day
time
Truc
k Pe
rcen
tage
(%)
SBNB
DAYTIME TRUCK PERCENTAGE (%) ( 021_MOJAVE )
0
10
20
30
40
50
60
70
80
5/7/90 9/19/91 1/31/93 6/15/94 10/28/95 3/11/97 7/24/98 12/6/99 4/19/01 9/1/02
Date
Day
time
Truc
k Pe
rcen
tage
(%)
WBEB

E-3
DAYTIME TRUCK PERCENTAGE (%)( 047048_CASTAIC )
0
10
20
30
40
50
60
70
80
1/31/93 6/15/94 10/28/95 3/11/97 7/24/98 12/6/99 4/19/01 9/1/02
Date
Day
time
Truc
k Pe
rcen
tage
(%)
SBNB
DAYTIME TRUCK PERCENTAGE (%)( 057058_PINOLE )
0
10
20
30
40
50
60
70
80
90
6/15/94 10/28/95 3/11/97 7/24/98 12/6/99 4/19/01 9/1/02
Date
Day
time
Truc
k Pe
rcen
tage
(%)
WBEB

E-4
DAYTIME TRUCK PERCENTAGE (%)( 072_BOWMAN )
0
10
20
30
40
50
60
70
80
12/1/96 6/19/97 1/5/98 7/24/98 2/9/99 8/28/99 3/15/00 10/1/00 4/19/01
Date
Day
time
Truc
k Pe
rcen
tage
(%)
WBEB

G-1
APPENDIX F:
SIDE WHEEL LOAD DIFFERENCE RATIO DISTRIBUTION AT
5 WIM SITES

G-2
Right Side & Left Side Wheel Load Difference Ratio Distribution(017018_HAYWARD SOUTHBOUND )
0
0.01
0.02
0.03
0.04
0.05
0.06
0.07
0.08
-60 -40 -20 0 20 40 60
Side Load Difference Ratio (%)
Nor
mal
ized
Fre
quen
cy
SteeringSingleTandemTridem
STEERING SINGLE TANDEM TRIDEMMEAN 0.1205 0.1729 0.1292 0.1912S.D. 3.438 4.315 2.8631 3.0849
Right Side & Left Side Wheel Load Difference Ratio Distribution(017018_HAYWARD NORTHBOUND )
0
0.01
0.02
0.03
0.04
0.05
0.06
0.07
-60 -40 -20 0 20 40 60
Side Load Difference Ratio (%)
Nor
mal
ized
Fre
quen
cy
SteeringSingleTandemTridem
STEERING SINGLE TANDEM TRIDEMMEAN 0.1205 0.1729 0.1292 0.1912S.D. 3.438 4.315 2.8631 3.0849

G-3
Right Side & Left Side Wheel Load Difference Ratio Distribution(021_MOJAVE WESTBOUND )
0
0.01
0.02
0.03
0.04
0.05
0.06
-60 -40 -20 0 20 40 60
Side Load Difference Ratio (%)
Nor
mal
ized
Fre
quen
cy
SteeringSingleTandemTridem
STEERING SINGLE TANDEM TRIDEMMEAN 0.1205 0.1729 0.1292 0.1912S.D. 3.438 4.315 2.8631 3.0849
Right Side & Left Side Wheel Load Difference Ratio Distribution(021_MOJAVE EASTBOUND )
0
0.01
0.02
0.03
0.04
0.05
0.06
0.07
0.08
0.09
0.1
-60 -40 -20 0 20 40 60
Side Load Difference Ratio (%)
Nor
mal
ized
Fre
quen
cy
SteeringSingleTandemTridem
STEERING SINGLE TANDEM TRIDEMMEAN 0.1205 0.1729 0.1292 0.1912S.D. 3.438 4.315 2.8631 3.0849

G-4
Right Side & Left Side Wheel Load Difference Ratio Distribution(047048_CASTAIC SOUTHBOUND )
0
0.01
0.02
0.03
0.04
0.05
0.06
0.07
-60 -40 -20 0 20 40 60
Side Load Difference Ratio (%)
Nor
mal
ized
Fre
quen
cy
SteeringSingleTandemTridem
STEERING SINGLE TANDEM TRIDEMMEAN 0.1205 0.1729 0.1292 0.1912S.D. 3.438 4.315 2.8631 3.0849
Right Side & Left Side Wheel Load Difference Ratio Distribution(047048_CASTAIC NORTHBOUND )
0
0.01
0.02
0.03
0.04
0.05
0.06
0.07
0.08
-60 -40 -20 0 20 40 60
Side Load Difference Ratio (%)
Nor
mal
ized
Fre
quen
cy
SteeringSingleTandemTridem
STEERING SINGLE TANDEM TRIDEMMEAN 0.1205 0.1729 0.1292 0.1912S.D. 3.438 4.315 2.8631 3.0849

G-5
Right Side & Left Side Wheel Load Difference Ratio Distribution(057058_PINOLE WESTBOUND )
0
0.01
0.02
0.03
0.04
0.05
0.06
0.07
0.08
0.09
-60 -40 -20 0 20 40 60
Side Load Difference Ratio (%)
Nor
mal
ized
Fre
quen
cy
SteeringSingleTandemTridem
STEERING SINGLE TANDEM TRIDEMMEAN 0.1205 0.1729 0.1292 0.1912S.D. 3.438 4.315 2.8631 3.0849
Right Side & Left Side Wheel Load Difference Ratio Distribution(057058_PINOLE EASTBOUND )
0
0.01
0.02
0.03
0.04
0.05
0.06
0.07
0.08
0.09
0.1
-60 -40 -20 0 20 40 60
Side Load Difference Ratio (%)
Nor
mal
ized
Fre
quen
cy
SteeringSingleTandemTridem
STEERING SINGLE TANDEM TRIDEMMEAN 0.1205 0.1729 0.1292 0.1912S.D. 3.438 4.315 2.8631 3.0849

G-6
Right Side & Left Side Wheel Load Difference Ratio Distribution(072_BOWMAN WESTBOUND )
0
0.02
0.04
0.06
0.08
0.1
0.12
-60 -40 -20 0 20 40 60
Side Load Difference Ratio (%)
Nor
mal
ized
Fre
quen
cy
SteeringSingleTandemTridem
STEERING SINGLE TANDEM TRIDEMMEAN 0.1205 0.1729 0.1292 0.1912S.D. 3.438 4.315 2.8631 3.0849
Right Side & Left Side Wheel Load Difference Ratio Distribution(072_BOWMAN EASTBOUND )
0
0.02
0.04
0.06
0.08
0.1
0.12
0.14
0.16
0.18
-60 -40 -20 0 20 40 60
Side Load Difference Ratio (%)
Nor
mal
ized
Fre
quen
cy
SteeringSingleTandemTridem
STEERING SINGLE TANDEM TRIDEMMEAN 0.1205 0.1729 0.1292 0.1912S.D. 3.438 4.315 2.8631 3.0849

G-7
APPENDIX G:
TRUCK AXLE RELATIONSHIP (PER 1000 TRUCKS)
(AVERAGED OVER ALL THE WIM STATIONS IN CA FROM
1991 TO 2001)

G-8
Axle Number per 1000 TrucksTruck TypeAxle
Group 4 5 6 7 8 9 10 11 12 13 14 15Steering 1000 1000 1000 1000 1000 1000 1000 1000 1000 1000 1000 1000Single 342 1000 0 893 1583 0 0 4000 3000 1600 2000 1214Tandem 649 0 1000 893 494 2000 1000 0 1000 2400 1000 577Tridem 0 0 0 107 0 0 1000 0 0 200 0 143

H-1
APPENDIX H:
LOAD SPECTRA AND AADT FOR EACH STATION

H-2

H-3
STATION 1 LODI
Load Spectra for Different Axles ( Station001 Lodi)
0
0.05
0.1
0.15
0.2
0.25
0 50 100 150 200 250 300 350
Load, kN
Nor
mal
ized
Fre
quen
cy
SteeringSingleTandemTridem
Average Annual Daily Truck Traffic (AADTT) for Different Truck TypesTruck TypeYearAll 4 5 6 7 8 9 10 11 12 13 14 15
1991 6364 55 741 160 2 490 3098 30 1249 154 8 152 2251992 6214 56 724 157 1 474 3132 39 1135 170 7 137 1811993 6807 51 748 173 1 482 3499 48 1262 177 8 145 2141994 7568 58 766 179 1 499 3896 62 1558 183 8 161 1981995 7480 54 748 197 2 491 3979 72 1431 163 8 145 1901996 8235 59 1030 225 3 435 4530 95 1421 176 8 144 1101997 8762 70 1151 220 4 479 4942 101 1319 158 8 150 1591998 9238 66 1286 232 4 434 5290 118 1405 145 10 136 1121999 10037 65 1612 239 4 460 5747 121 1375 137 9 138 1302000 10400 70 1763 251 3 491 6035 119 1237 130 12 131 1562001 9172 76 1493 205 2 443 5643 113 859 111 9 111 106

H-4
Annual Average Daily Traffic For Different Truck Types ( Station 001_Lodi)
0
2000
4000
6000
8000
10000
12000
1990 1992 1994 1996 1998 2000 2002
Year
AA
DTT
All_TypeType4Type5Type6Type7Type8Type9Type10Type11Type12Type13Type14Type15

H-5
STATION 2 REDDING
Load Spectra for Different Axles ( Station002 Redding)
0
0.05
0.1
0.15
0.2
0.25
0.3
0.35
0 50 100 150 200 250 300 350
Load, kN
Nor
mal
ized
Fre
quen
cy
SteeringSingleTandemTridem
Average Annual Daily Traffic for Different Truck TypesTruck TypeYearAll 4 5 6 7 8 9 10 11 12 13 14 15
1991 4454 26 385 214 2 238 2605 55 488 157 7 201 761992 3928 18 350 151 4 244 2299 54 411 148 7 171 691993 3868 16 366 141 1 214 2237 61 389 136 9 178 1211994 5035 20 382 165 3 223 2977 91 554 159 23 231 2071995 4737 23 387 140 2 265 2768 104 417 141 43 203 2461996 5166 25 539 126 3 298 3012 126 425 133 36 173 2721997 5372 24 542 146 2 296 3423 125 422 119 8 175 891998 5457 29 740 125 2 162 3495 141 431 108 6 160 581999 5898 37 828 139 3 153 3815 147 433 100 5 169 702000 6234 47 977 145 3 154 3978 153 429 88 5 172 842001 5743 41 881 68 1 152 3805 148 379 71 4 138 56

H-6
Annual Average Daily Traffic For Different Truck Types ( Station 002_REDDING)
0
1000
2000
3000
4000
5000
6000
7000
1990 1992 1994 1996 1998 2000 2002
Year
AA
DTT
All_TypeType4Type5Type6Type7Type8Type9Type10Type11Type12Type13Type14Type15

H-7
STATIONS 3&4 ANTELOPE
Load Spectra for Different Axles ( Station003004 Antelope)
0
0.05
0.1
0.15
0.2
0.25
0 50 100 150 200 250 300 350
Load, kN
Nor
mal
ized
Fre
quen
cy
SteeringSingleTandemTridem
Average Annual Daily Traffic for Different Truck TypesTruck TypeYearAll 4 5 6 7 8 9 10 11 12 13 14 15
1998 7634 89 1774 297 7 537 3807 42 569 108 12 288 1041999 3989 40 889 155 4 290 2023 20 295 54 5 144 682000 8359 99 2020 317 6 579 4273 41 530 118 9 260 1072001 7292 93 1830 255 3 541 3730 35 389 103 6 229 79

H-8
Annual Average Daily Traffic For Different Truck Types ( Station 003004_ANTELOPE)
0
1000
2000
3000
4000
5000
6000
7000
8000
9000
1997 1998 1999 2000 2001 2002
Year
AA
DTT
All_TypeType4Type5Type6Type7Type8Type9Type10Type11Type12Type13Type14Type15

H-9
STATION 5 INDIO
Load Spectra for Different Axles ( Station005 Indio)
0
0.05
0.1
0.15
0.2
0.25
0.3
0.35
0 50 100 150 200 250 300 350
Load, kN
Nor
mal
ized
Fre
quen
cy
SteeringSingleTandemTridem
Average Annual Daily Traffic for Different Truck TypesTruck TypeYearAll 4 5 6 7 8 9 10 11 12 13 14 15
1991 4182 41 258 111 1 213 2855 10 444 146 4 59 411992 4232 45 263 108 0 210 2908 12 438 153 5 45 441993 4636 48 269 98 1 241 3200 13 482 158 6 55 651994 5049 57 310 65 0 245 3534 19 490 165 5 50 1101995 5289 63 332 63 1 269 3658 23 533 166 5 48 1291996 5685 60 342 87 1 271 4000 28 556 158 5 51 1271997 6013 62 359 100 1 295 4323 32 524 127 6 48 1371998 6458 71 491 110 1 268 4669 36 520 132 7 46 1071999 7137 83 560 125 2 318 5140 40 542 149 7 46 1252000 7900 92 709 99 1 253 5808 45 564 163 7 39 1202001 7869 105 768 75 1 235 5740 49 539 174 9 46 128

H-10
Annual Average Daily Traffic For Different Truck Types ( Station 005_INDIO)
0
1000
2000
3000
4000
5000
6000
7000
8000
9000
1990 1992 1994 1996 1998 2000 2002
Year
AA
DTT
All_TypeType4Type5Type6Type7Type8Type9Type10Type11Type12Type13Type14Type15

H-11
STATION 6 NEWHALL
Load Spectra for Different Axles ( Station006 Newhall)
0
0.05
0.1
0.15
0.2
0.25
0.3
0 50 100 150 200 250 300 350
Load, kN
Nor
mal
ized
Fre
quen
cy
SteeringSingleTandemTridem
Average Annual Daily Traffic for Different Truck TypesTruck TypeYearAll 4 5 6 7 8 9 10 11 12 13 14 15
1991 7120 37 1157 270 21 460 3738 26 838 133 10 302 1301992 7117 32 1129 251 20 444 3794 28 845 133 9 305 1271993 7737 36 1269 250 24 456 4106 38 906 127 8 346 1721994 2291 51 738 122 10 135 755 8 216 16 4 136 991995 8459 53 1392 280 26 443 4598 59 885 121 8 359 2341996 8806 34 1642 295 28 389 4477 156 789 112 31 321 5321997 9037 34 1551 313 27 424 4900 138 795 117 19 328 3921998 8094 39 1499 261 32 377 4503 94 677 104 9 296 203

H-12
Annual Average Daily Traffic For Different Truck Types ( Station 006_NEWHAll)
0
1000
2000
3000
4000
5000
6000
7000
8000
9000
10000
1990 1991 1992 1993 1994 1995 1996 1997 1998 1999
Year
AA
DTT
All_TypeType4Type5Type6Type7Type8Type9Type10Type11Type12Type13Type14Type15

H-13
STATION 7 SANTA NELLA
Load Spectra for Different Axles ( Station007 Santa Nella)
0
0.05
0.1
0.15
0.2
0.25
0.3
0 50 100 150 200 250 300 350
Load, kN
Nor
mal
ized
Fre
quen
cy
SteeringSingleTandemTridem
Average Annual Daily Traffic for Different Truck TypesTruck TypeYearAll 4 5 6 7 8 9 10 11 12 13 14 15
1991 4518 33 346 126 1 231 2715 33 750 145 7 93 391992 4701 29 403 535 1 362 2381 38 618 140 7 41 1461993 4744 31 370 315 1 243 2755 45 652 132 6 74 1211994 4444 29 325 74 1 204 2869 47 591 120 5 89 891995 5496 41 419 98 1 270 3491 63 772 137 7 82 1151996 6288 38 519 195 1 351 3976 78 755 131 6 67 1701997 6437 40 465 116 1 296 4289 90 755 138 6 86 1541998 6827 46 578 126 1 231 4662 98 761 135 7 77 1061999 7164 51 618 127 1 239 5032 90 681 133 7 74 1112000 7907 58 866 132 1 268 5416 92 746 131 8 72 1162001 7465 50 762 126 1 273 5300 98 572 123 6 56 100

H-14
Annual Average Daily Traffic For Different Truck Types ( Station 007_SANTA_NELLA)
0
1000
2000
3000
4000
5000
6000
7000
8000
9000
1990 1992 1994 1996 1998 2000 2002
Year
AA
DTT
All_TypeType4Type5Type6Type7Type8Type9Type10Type11Type12Type13Type14Type15

H-15
STATIONS 8&9 CONEJO
Load Spectra for Different Axles ( Station008009 Conejo)
0
0.05
0.1
0.15
0.2
0.25
0 50 100 150 200 250 300 350
Load, kN
Nor
mal
ized
Fre
quen
cy
SteeringSingleTandemTridem
Average Annual Daily Traffic for Different Truck TypesTruck TypeYearAll 4 5 6 7 8 9 10 11 12 13 14 15
2000 6291 147 2333 225 17 580 2335 13 309 26 6 248 522001 5905 132 2189 214 20 524 2228 10 266 23 3 253 44

H-16
Annual Average Daily Traffic For Different Truck Types ( Station 008009_CONEJO)
0
1000
2000
3000
4000
5000
6000
7000
1999.8 2000 2000.2 2000.4 2000.6 2000.8 2001 2001.2
Year
AA
DTT
All_TypeType4Type5Type6Type7Type8Type9Type10Type11Type12Type13Type14Type15

H-17
STATION 10 FRESNO
Load Spectra for Different Axles ( Station010 Fresno)
0
0.05
0.1
0.15
0.2
0.25
0 50 100 150 200 250 300 350
Load, kN
Nor
mal
ized
Fre
quen
cy
SteeringSingleTandemTridem
Average Annual Daily Traffic for Different Truck TypesTruck TypeYearAll 4 5 6 7 8 9 10 11 12 13 14 15
1991 8679 53 1440 287 8 764 4055 17 1440 118 8 191 2961992 8308 49 1358 273 16 726 3891 18 1379 114 16 181 2861993 8860 50 1498 316 17 844 4147 23 1353 120 19 179 2941994 9358 56 1495 327 12 888 4501 30 1411 127 20 181 3111995 9131 53 1491 326 8 923 4406 32 1277 108 23 163 3211996 9474 43 1737 331 8 831 4706 41 1328 116 14 165 1531997 10113 43 1988 383 13 748 5047 47 1427 117 12 170 1191998 9604 36 1956 328 10 721 5051 61 973 112 64 129 1631999 12150 74 2713 661 21 870 5963 62 1168 120 8 110 3802000 12594 104 2914 654 20 791 6307 60 1199 123 5 120 2972001 11071 93 2504 557 4 638 5975 53 852 102 5 119 169

H-18
Annual Average Daily Traffic For Different Truck Types ( Station 010_FRESNO)
0
2000
4000
6000
8000
10000
12000
14000
1990 1992 1994 1996 1998 2000 2002
Year
AA
DTT
All_TypeType4Type5Type6Type7Type8Type9Type10Type11Type12Type13Type14Type15

H-19
STATION 11 SONOMA
Load Spectra for Different Axles ( Station011 Sonoma)
0
0.05
0.1
0.15
0.2
0.25
0 50 100 150 200 250 300 350
Load, kN
Nor
mal
ized
Fre
quen
cy
SteeringSingleTandemTridem
Average Annual Daily Traffic for Different Truck TypesTruck TypeYearAll 4 5 6 7 8 9 10 11 12 13 14 15
1991 1831 28 449 102 2 181 566 5 228 12 2 179 781992 1914 27 438 100 2 190 622 4 235 15 2 187 931993 1924 25 459 101 1 190 614 7 233 13 3 196 831994 1913 33 454 92 1 185 628 11 227 13 3 179 871995 1988 37 485 96 2 193 655 10 223 14 2 180 921996 2090 39 531 101 2 203 670 11 236 17 2 177 1011997 2215 32 574 108 1 223 724 15 258 17 3 148 1121998 2396 31 697 112 1 199 799 21 272 18 5 169 731999 2504 33 809 114 1 180 826 20 290 14 3 154 59

H-20
Annual Average Daily Traffic For Different Truck Types ( Station 011_SONOMA)
0
500
1000
1500
2000
2500
3000
1990 1991 1992 1993 1994 1995 1996 1997 1998 1999 2000
Year
AA
DTT
All_TypeType4Type5Type6Type7Type8Type9Type10Type11Type12Type13Type14Type15

H-21
STATIONS 12&13 VAN NUYS
Load Spectra for Different Axles ( Station012013 Van Nuys)
0
0.02
0.04
0.06
0.08
0.1
0.12
0.14
0.16
0.18
0.2
0 50 100 150 200 250 300 350
Load, kN
Nor
mal
ized
Fre
quen
cy
SteeringSingleTandemTridem
Average Annual Daily Traffic for Different Truck TypesTruck TypeYearAll 4 5 6 7 8 9 10 11 12 13 14 15
1991 6134 120 2432 647 39 416 1512 8 267 15 10 389 2801992 5591 120 2120 553 31 390 1466 9 261 16 7 357 2601993 5473 111 2132 516 26 376 1461 10 222 14 7 321 2791994 6727 130 2745 681 37 440 1699 11 267 16 12 319 3711997 6813 48 2747 739 50 484 1804 39 234 11 13 299 3461998 6643 47 2522 723 59 444 1903 42 246 13 14 304 3241999 6944 54 2806 691 54 477 2047 29 221 16 12 277 2602000 6948 76 2761 710 60 473 2067 30 213 13 13 302 2322001 6635 84 2714 670 55 465 1888 36 161 11 12 305 233

H-22
Annual Average Daily Traffic For Different Truck Types ( Station 012013_VAN_NUYS)
0
1000
2000
3000
4000
5000
6000
7000
8000
1990 1992 1994 1996 1998 2000 2002
Year
AA
DTT
All_TypeType4Type5Type6Type7Type8Type9Type10Type11Type12Type13Type14Type15

H-23
STATION 14 SAN MARCOS
Load Spectra for Different Axles ( Station014 San)
0
0.02
0.04
0.06
0.08
0.1
0.12
0.14
0.16
0.18
0.2
0 50 100 150 200 250 300 350
Load, kN
Nor
mal
ized
Fre
quen
cy
SteeringSingleTandemTridem
Average Annual Daily Traffic for Different Truck TypesTruck TypeYearAll 4 5 6 7 8 9 10 11 12 13 14 15
1991 2304 20 963 167 29 255 533 2 114 6 6 103 1051992 2188 38 684 247 37 221 565 4 113 5 7 60 2091993 2616 36 871 230 22 307 730 3 153 5 8 107 1451994 2777 22 1095 180 26 347 754 3 145 5 5 100 951995 2855 24 1131 175 25 341 794 4 142 6 11 100 1011996 3228 26 1264 203 43 366 891 6 155 9 11 121 1331997 3565 28 1375 234 50 372 1015 6 183 19 12 124 1461998 3662 31 1557 258 62 358 995 6 178 8 19 117 741999 4071 39 1670 299 64 360 1179 7 187 8 14 145 1012000 4015 41 1727 281 45 383 1147 8 147 8 10 127 902001 3745 42 1619 231 25 370 1079 7 158 5 26 91 92

H-24
Annual Average Daily Traffic For Different Truck Types ( Station 014_SAN_MARCOS)
0
500
1000
1500
2000
2500
3000
3500
4000
4500
1990 1992 1994 1996 1998 2000 2002
Year
AA
DTT
All_TypeType4Type5Type6Type7Type8Type9Type10Type11Type12Type13Type14Type15

H-25
STATIONS 15&16 IRVINE
Load Spectra for Different Axles ( Station015016 Irvine)
0
0.02
0.04
0.06
0.08
0.1
0.12
0.14
0.16
0.18
0.2
0 50 100 150 200 250 300 350
Load, kN
Nor
mal
ized
Fre
quen
cy
SteeringSingleTandemTridem
Average Annual Daily Traffic for Different Truck Types
Truck TypeYearAll 4 5 6 7 8 9 10 11 12 13 14 15
1993 7640 118 2559 520 23 828 2758 13 435 42 13 182 1501994 8045 94 2770 519 43 848 2824 15 400 35 13 225 2571995 8952 98 2979 675 78 1144 2925 18 440 34 11 196 3551996 9696 89 3283 857 53 1443 3176 19 328 27 13 33 3761997 11695 100 4028 1041 108 1794 3723 20 302 27 17 43 4911998 11914 151 4270 1300 102 1922 3594 24 319 26 17 58 1311999 12185 166 4512 1369 116 1830 3681 24 281 23 14 56 1142000 12674 191 4764 1338 144 1594 4059 44 286 25 14 63 1522001 10627 190 3579 1086 120 1190 3816 91 249 23 22 58 203

H-26
Annual Average Daily Traffic For Different Truck Types ( Station 015016_IRVINE)
0
2000
4000
6000
8000
10000
12000
14000
1992 1993 1994 1995 1996 1997 1998 1999 2000 2001 2002
Year
AA
DTT
All_TypeType4Type5Type6Type7Type8Type9Type10Type11Type12Type13Type14Type15

H-27
STATIONS 17&18 HAYWARD
Load Spectra for Different Axles ( Station017018 Hayward)
0
0.05
0.1
0.15
0.2
0.25
0 50 100 150 200 250 300 350
Load, kN
Nor
mal
ized
Fre
quen
cy
SteeringSingleTandemTridem
Average Annual Daily Traffic for Different Truck TypesTruck TypeYearAll 4 5 6 7 8 9 10 11 12 13 14 15
1991 8776 100 2697 504 7 1160 3158 10 566 57 8 130 3791992 8457 61 2571 483 9 1105 3004 18 590 60 6 132 4181993 8424 63 2724 489 11 1050 3064 18 495 56 5 119 3301994 9025 56 3033 482 11 1097 3433 25 494 57 5 129 2011995 9318 62 3155 505 11 1122 3538 33 467 61 5 138 2191996 9840 57 3326 742 18 1231 3622 37 363 68 5 75 2981997 10214 60 3442 749 21 1298 3776 51 347 71 6 69 3221998 9833 56 3523 878 22 1067 3523 45 313 56 7 70 2741999 11442 64 4495 808 17 1217 4030 56 334 65 7 79 2702000 11598 75 4608 800 21 1249 4026 56 352 65 7 78 2602001 10221 72 4113 655 13 1083 3650 55 275 63 5 61 175

H-28
Annual Average Daily Traffic For Different Truck Types ( Station 017018_HAYWARD)
0
2000
4000
6000
8000
10000
12000
14000
1990 1992 1994 1996 1998 2000 2002
Year
AA
DTT
All_TypeType4Type5Type6Type7Type8Type9Type10Type11Type12Type13Type14Type15

H-29
STATION 20 LOLETA
Load Spectra for Different Axles ( Station020 Loleta)
0
0.05
0.1
0.15
0.2
0.25
0 50 100 150 200 250 300 350
Load, kN
Nor
mal
ized
Fre
quen
cy
SteeringSingleTandemTridem
Average Annual Daily Traffic for Different Truck TypesTruck TypeYearAll 4 5 6 7 8 9 10 11 12 13 14 15
1991 1170 6 255 172 1 109 455 1 57 3 0 78 331992 1434 7 377 197 3 144 537 1 53 4 1 89 201993 1473 7 394 208 4 115 527 1 57 4 1 95 611994 1608 7 400 219 5 116 628 1 65 4 1 97 651995 1516 11 397 221 5 111 564 1 51 5 1 81 681996 1624 10 417 230 3 112 636 1 51 4 1 92 691997 1513 10 390 204 1 100 620 1 45 4 1 82 551998 1412 10 441 171 2 88 565 1 47 3 1 71 131999 1508 10 509 164 2 105 567 1 49 3 1 87 102000 1446 15 470 151 1 95 562 1 46 2 1 90 122001 1305 14 419 152 1 81 506 1 52 2 0 65 12

H-30
Annual Average Daily Traffic For Different Truck Types ( Station 020_LOLETA)
0
200
400
600
800
1000
1200
1400
1600
1800
1990 1992 1994 1996 1998 2000 2002
Year
AA
DTT
All_TypeType4Type5Type6Type7Type8Type9Type10Type11Type12Type13Type14Type15

H-31
STATION 21 MOJAVE
Load Spectra for Different Axles ( Station021 Mojave)
0
0.05
0.1
0.15
0.2
0.25
0.3
0.35
0 50 100 150 200 250 300 350
Load, kN
Nor
mal
ized
Fre
quen
cy
SteeringSingleTandemTridem
Average Annual Daily Traffic for Different Truck TypesTruck TypeYearAll 4 5 6 7 8 9 10 11 12 13 14 15
1991 3711 27 301 62 0 229 2605 11 304 36 6 56 741992 3517 25 208 64 1 153 2595 8 327 39 4 54 401993 3610 25 198 59 1 133 2627 8 389 47 3 47 731994 4448 29 256 72 1 179 3184 15 471 66 4 56 1151995 4117 29 250 69 1 182 2921 19 422 49 3 44 1281996 4294 27 272 118 1 194 3003 19 411 49 4 40 1561997 4567 28 308 118 1 207 3207 18 452 45 3 37 1421998 4963 28 499 129 0 163 3432 23 496 46 5 38 1031999 5165 31 509 127 0 171 3581 24 518 43 4 43 1142000 5443 31 532 142 1 183 3865 25 457 43 5 39 1212001 4742 25 545 131 0 204 3324 24 318 35 4 34 97

H-32
Annual Average Daily Traffic For Different Truck Types ( Station 021_MOJAVE)
-1000
0
1000
2000
3000
4000
5000
6000
1990 1992 1994 1996 1998 2000 2002
Year
AA
DTT
All_TypeType4Type5Type6Type7Type8Type9Type10Type11Type12Type13Type14Type15

H-33
STATION 22 JEFFREY
Load Spectra for Different Axles ( Station022 Jeffrey)
0
0.05
0.1
0.15
0.2
0.25
0.3
0 50 100 150 200 250 300 350
Load, kN
Nor
mal
ized
Fre
quen
cy
SteeringSingleTandemTridem
Average Annual Daily Traffic for Different Truck TypesTruck TypeYearAll 4 5 6 7 8 9 10 11 12 13 14 15
1991 1104 18 170 38 1 122 538 3 126 11 1 63 141992 1041 18 173 43 1 123 491 2 103 11 1 50 251993 988 16 145 33 0 98 540 2 91 9 1 39 141994 1187 20 199 44 2 138 580 2 122 12 1 40 301995 1109 20 184 39 0 111 553 3 104 13 1 32 491996 1298 22 220 41 0 138 652 3 103 18 1 47 531997 1307 24 210 41 0 124 714 3 92 10 1 42 461998 1566 26 356 54 3 77 812 4 139 9 1 41 441999 1631 26 355 64 1 74 890 4 125 8 1 44 392000 1666 27 344 68 3 81 897 6 118 8 2 43 692001 1665 25 335 89 8 91 949 6 65 7 1 51 38

H-34
Annual Average Daily Traffic For Different Truck Types ( Station 022_JEFFREY)
-200
0
200
400
600
800
1000
1200
1400
1600
1800
1990 1992 1994 1996 1998 2000 2002
Year
AA
DTT
All_TypeType4Type5Type6Type7Type8Type9Type10Type11Type12Type13Type14Type15

H-35
STATION 23 EL CENTRO
Load Spectra for Different Axles ( Station023 El Centro)
0
0.05
0.1
0.15
0.2
0.25
0.3
0 50 100 150 200 250 300 350
Load, kN
Nor
mal
ized
Fre
quen
cy
SteeringSingleTandemTridem
Average Annual Daily Traffic for Different Truck TypesTruck TypeYearAll 4 5 6 7 8 9 10 11 12 13 14 15
1991 1608 49 270 59 4 150 805 3 183 16 1 44 241992 1662 41 287 77 3 153 792 2 197 16 1 59 341993 1690 38 315 67 2 138 725 3 248 18 2 60 751994 1875 28 316 90 2 152 886 3 255 20 1 54 691995 1967 31 343 75 2 173 924 4 271 19 2 41 821996 2100 37 369 78 1 188 1017 5 246 24 2 52 821997 2321 38 364 92 2 187 1192 6 280 21 3 47 911998 2430 38 463 102 2 111 1315 7 268 23 2 43 561999 2727 39 566 124 1 130 1465 6 280 23 1 38 552000 3217 43 643 127 1 173 1804 6 284 27 2 46 602001 3456 39 715 132 0 206 1958 9 272 20 2 41 62

H-36
Annual Average Daily Traffic For Different Truck Types ( Station 023_EL_CENTRO)
0
500
1000
1500
2000
2500
3000
3500
4000
1990 1992 1994 1996 1998 2000 2002
Year
AA
DTT
All_TypeType4Type5Type6Type7Type8Type9Type10Type11Type12Type13Type14Type15

H-37
STATION 24 NAPA
Load Spectra for Different Axles ( Station024 Napa)
0
0.02
0.04
0.06
0.08
0.1
0.12
0.14
0.16
0.18
0.2
0 50 100 150 200 250 300 350
Load, kN
Nor
mal
ized
Fre
quen
cy
SteeringSingleTandemTridem
Average Annual Daily Traffic for Different Truck TypesTruck TypeYearAll 4 5 6 7 8 9 10 11 12 13 14 15
1993 1175 10 382 77 2 121 329 4 100 7 4 72 671994 1227 9 397 61 3 126 356 5 118 10 3 69 711995 1327 8 424 67 5 130 392 9 120 9 4 78 801996 1439 10 448 90 4 152 412 19 115 8 2 61 1201997 1819 11 717 157 6 205 445 22 66 7 1 21 1621998 2011 10 784 214 13 170 542 39 76 6 1 16 1411999 2038 9 790 193 16 148 569 43 119 8 1 38 1042000 2243 11 851 180 12 133 678 36 164 9 1 66 1022001 1981 8 780 145 9 124 619 25 122 6 5 57 81

H-38
Annual Average Daily Traffic For Different Truck Types ( Station 024_NAPA)
0
500
1000
1500
2000
2500
1992 1993 1994 1995 1996 1997 1998 1999 2000 2001 2002
Year
AA
DTT
All_TypeType4Type5Type6Type7Type8Type9Type10Type11Type12Type13Type14Type15

H-39
STATION 25 NEWBERRY
Load Spectra for Different Axles ( Station025 Newberry)
0
0.05
0.1
0.15
0.2
0.25
0.3
0.35
0.4
0.45
0.5
0 50 100 150 200 250 300 350
Load, kN
Nor
mal
ized
Fre
quen
cy
SteeringSingleTandemTridem
Average Annual Daily Traffic for Different Truck TypesTruck TypeYearAll 4 5 6 7 8 9 10 11 12 13 14 15
1993 1175 10 382 77 2 121 329 4 100 7 4 72 671994 1227 9 397 61 3 126 356 5 118 10 3 69 711995 1327 8 424 67 5 130 392 9 120 9 4 78 801996 1439 10 448 90 4 152 412 19 115 8 2 61 1201997 1819 11 717 157 6 205 445 22 66 7 1 21 1621998 2011 10 784 214 13 170 542 39 76 6 1 16 1411999 2038 9 790 193 16 148 569 43 119 8 1 38 1042000 2243 11 851 180 12 133 678 36 164 9 1 66 1022001 1981 8 780 145 9 124 619 25 122 6 5 57 81

H-40
Annual Average Daily Traffic For Different Truck Types ( Station 025_NEWBERRY)
-1000
0
1000
2000
3000
4000
5000
6000
7000
1990 1992 1994 1996 1998 2000 2002
Year
AA
DTT
All_TypeType4Type5Type6Type7Type8Type9Type10Type11Type12Type13Type14Type15

H-41
STATION 26 CAMERON
Load Spectra for Different Axles ( Station026 Cameron)
0
0.05
0.1
0.15
0.2
0.25
0 50 100 150 200 250 300 350
Load, kN
Nor
mal
ized
Fre
quen
cy
SteeringSingleTandemTridem
Average Annual Daily Traffic for Different Truck TypesTruck TypeYearAll 4 5 6 7 8 9 10 11 12 13 14 15
1993 1184 23 259 40 1 108 567 2 105 12 3 21 451994 1219 20 268 41 0 102 594 3 107 11 2 18 531995 1198 21 236 49 0 94 586 3 105 13 1 33 571996 1270 30 265 73 1 126 612 4 56 12 1 6 851997 1424 31 279 85 1 154 743 4 47 8 1 7 631998 1546 35 362 79 2 78 856 5 58 8 1 11 511999 1795 36 508 90 2 88 918 6 40 7 1 7 912000 1811 33 479 77 0 105 1004 7 40 7 1 7 50

H-42
Annual Average Daily Traffic For Different Truck Types ( Station 026_CAMERON)
-200
0
200
400
600
800
1000
1200
1400
1600
1800
2000
1992 1993 1994 1995 1996 1997 1998 1999 2000 2001
Year
AA
DTT
All_TypeType4Type5Type6Type7Type8Type9Type10Type11Type12Type13Type14Type15

H-43
STATION 27 TRACY
Load Spectra for Different Axles ( Station027 Tracy)
0
0.05
0.1
0.15
0.2
0.25
0.3
0.35
0 50 100 150 200 250 300 350
Load, kN
Nor
mal
ized
Fre
quen
cy
SteeringSingleTandemTridem
Average Annual Daily Traffic for Different Truck TypesTruck TypeYearAll 4 5 6 7 8 9 10 11 12 13 14 15
1992 3175 16 235 44 0 204 1954 31 441 107 5 113 251993 3366 19 256 53 1 203 1954 34 612 97 4 105 281994 3477 20 245 50 0 192 2015 40 669 93 4 120 291995 3622 20 239 54 1 166 2167 44 680 91 4 108 491996 4092 22 249 59 1 177 2519 55 744 99 4 103 621997 4383 23 274 67 1 183 2811 61 688 99 4 111 621998 4762 27 409 70 1 133 3060 72 751 96 5 105 341999 5114 32 499 80 2 147 3310 69 735 90 5 105 422000 5760 35 550 95 1 161 3601 69 943 90 5 159 502001 5047 30 493 90 1 162 3338 79 543 82 5 180 45

H-44
Annual Average Daily Traffic For Different Truck Types ( Station 027_TRACY)
0
1000
2000
3000
4000
5000
6000
7000
1990 1992 1994 1996 1998 2000 2002
Year
AA
DTT
All_TypeType4Type5Type6Type7Type8Type9Type10Type11Type12Type13Type14Type15

H-45
STATION 28 MACDOEL
Load Spectra for Different Axles ( Station028 Macdoel)
0
0.05
0.1
0.15
0.2
0.25
0.3
0.35
0 50 100 150 200 250 300 350
Load, kN
Nor
mal
ized
Fre
quen
cy
SteeringSingleTandemTridem
Average Annual Daily Traffic for Different Truck TypesTruck TypeYearAll 4 5 6 7 8 9 10 11 12 13 14 15
1992 1098 4 81 28 0 15 766 13 88 28 2 64 101993 989 3 116 24 0 18 693 11 36 27 1 48 111996 1204 4 124 45 0 20 844 21 59 17 1 49 211997 1148 5 100 41 0 19 834 22 47 13 0 43 221998 1108 5 93 44 0 21 801 22 45 13 1 43 211999 1054 5 80 42 0 27 781 18 30 10 0 36 242000 1081 8 107 42 0 19 805 17 18 8 0 38 19

H-46
Annual Average Daily Traffic For Different Truck Types ( Station 028_MACDOEL)
-200
0
200
400
600
800
1000
1200
1400
1991 1992 1993 1994 1995 1996 1997 1998 1999 2000 2001
Year
AA
DTT
All_TypeType4Type5Type6Type7Type8Type9Type10Type11Type12Type13Type14Type15

H-47
STATION 29 ARCO
Load Spectra for Different Axles (Station029 Arco)
0
0.05
0.1
0.15
0.2
0.25
0 50 100 150 200 250 300 350
Load, kN
Nor
mal
ized
Fre
quen
cy
SteeringSingleTandemTridem
Average Annual Daily Traffic for Different Truck TypesTruck TypeYearAll 4 5 6 7 8 9 10 11 12 13 14 15
1993 4230 31 725 157 9 229 1664 28 1019 92 6 154 1181995 3845 39 615 143 9 227 1883 42 581 83 5 145 731996 4671 46 743 179 10 267 2146 50 886 88 5 151 991997 4727 59 781 185 9 270 2302 56 745 84 4 142 881998 4973 67 872 175 13 279 2443 64 732 77 4 161 861999 5147 72 924 180 19 280 2566 63 721 71 3 159 872000 5054 77 992 191 27 285 2597 61 528 60 4 161 722001 5199 70 1154 175 20 301 2562 60 541 57 5 153 101

H-48
Annual Average Daily Traffic For Different Truck Types ( Station 029_ARCO)
0
1000
2000
3000
4000
5000
6000
1992 1993 1994 1995 1996 1997 1998 1999 2000 2001 2002
Year
AA
DTT
All_TypeType4Type5Type6Type7Type8Type9Type10Type11Type12Type13Type14Type15

H-49
STATION 30 MT. SHASTA
Load Spectra for Different Axles ( Station030 Mt. Shasta)
0
0.05
0.1
0.15
0.2
0.25
0.3
0.35
0 50 100 150 200 250 300 350
Load, kN
Nor
mal
ized
Fre
quen
cy
SteeringSingleTandemTridem
Average Annual Daily Traffic for Different Truck TypesTruck TypeYearAll 4 5 6 7 8 9 10 11 12 13 14 15
1992 4699 15 302 340 0 203 2975 74 379 181 10 156 641993 4666 17 374 380 3 196 2657 77 419 161 11 188 1821994 4725 20 321 223 0 206 2964 89 437 158 10 179 1171995 5076 24 407 201 0 216 3176 118 434 159 10 191 1401996 4703 21 335 136 1 181 3145 128 365 140 6 126 1181997 5139 24 511 166 0 121 3478 126 381 119 7 130 751998 5101 23 504 124 0 127 3543 145 343 112 6 104 681999 5501 29 637 160 1 141 3756 147 345 98 6 101 822000 5689 38 645 147 0 153 3908 150 361 90 5 97 942001 5166 35 575 81 1 137 3651 146 285 73 6 85 91

H-50
Annual Average Daily Traffic For Different Truck Types ( Station 030_MT._SHASTA)
0
1000
2000
3000
4000
5000
6000
1990 1992 1994 1996 1998 2000 2002
Year
AA
DTT
All_TypeType4Type5Type6Type7Type8Type9Type10Type11Type12Type13Type14Type15
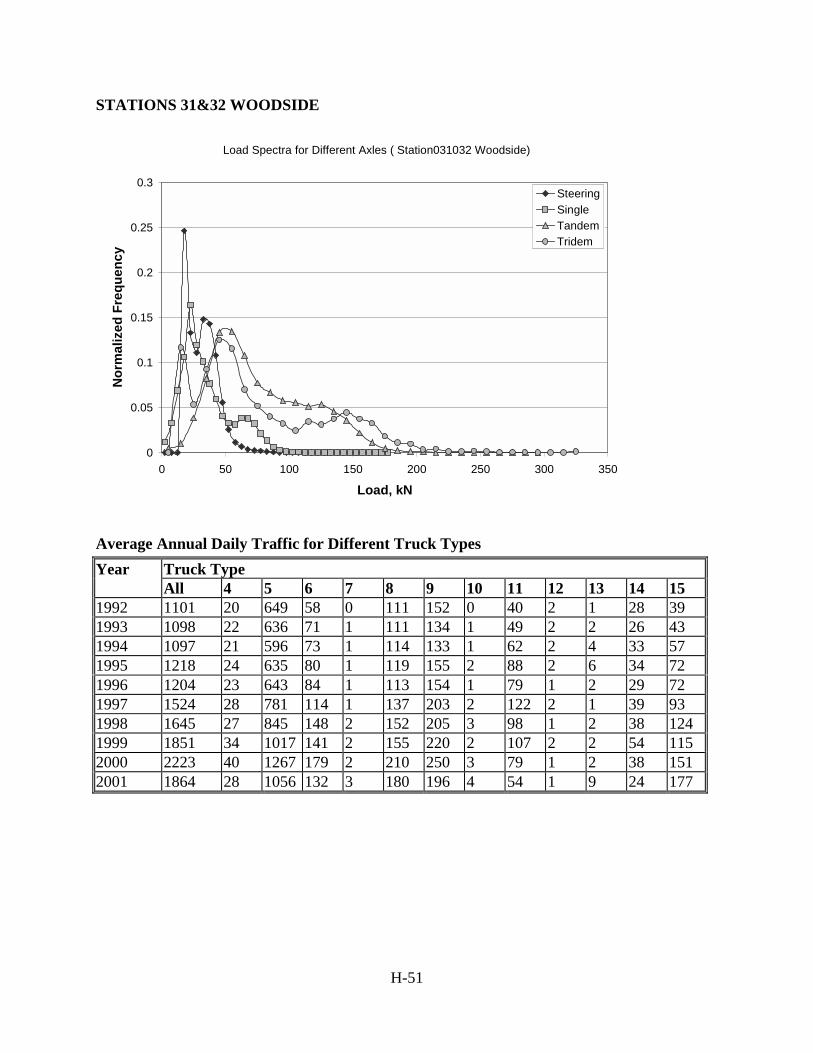
H-51
STATIONS 31&32 WOODSIDE
Load Spectra for Different Axles ( Station031032 Woodside)
0
0.05
0.1
0.15
0.2
0.25
0.3
0 50 100 150 200 250 300 350
Load, kN
Nor
mal
ized
Fre
quen
cy
SteeringSingleTandemTridem
Average Annual Daily Traffic for Different Truck TypesTruck TypeYearAll 4 5 6 7 8 9 10 11 12 13 14 15
1992 1101 20 649 58 0 111 152 0 40 2 1 28 391993 1098 22 636 71 1 111 134 1 49 2 2 26 431994 1097 21 596 73 1 114 133 1 62 2 4 33 571995 1218 24 635 80 1 119 155 2 88 2 6 34 721996 1204 23 643 84 1 113 154 1 79 1 2 29 721997 1524 28 781 114 1 137 203 2 122 2 1 39 931998 1645 27 845 148 2 152 205 3 98 1 2 38 1241999 1851 34 1017 141 2 155 220 2 107 2 2 54 1152000 2223 40 1267 179 2 210 250 3 79 1 2 38 1512001 1864 28 1056 132 3 180 196 4 54 1 9 24 177

H-52
Annual Average Daily Traffic For Different Truck Types ( Station 031032_WOODSIDE)
0
500
1000
1500
2000
2500
1990 1992 1994 1996 1998 2000 2002
Year
AA
DTT
All_TypeType4Type5Type6Type7Type8Type9Type10Type11Type12Type13Type14Type15

H-53
STATIONS 33&34 BURLINGAME
Load Spectra for Different Axles ( Station033034 Burlingame)
0
0.02
0.04
0.06
0.08
0.1
0.12
0.14
0.16
0.18
0.2
0 50 100 150 200 250 300 350
Load, kN
Nor
mal
ized
Fre
quen
cy
SteeringSingleTandemTridem
Average Annual Daily Traffic for Different Truck TypesTruck TypeYearAll 4 5 6 7 8 9 10 11 12 13 14 15
1993 7273 112 3381 361 12 1075 1643 9 325 19 4 133 1991994 7116 113 3302 337 11 1034 1612 7 330 17 3 129 2221995 7205 104 3363 360 13 1019 1651 9 334 15 3 117 2191996 7474 86 3520 370 15 1062 1776 11 280 14 4 121 2151997 8100 72 3953 396 17 1078 1841 12 332 16 5 116 2641998 8925 78 4912 406 23 919 1894 18 339 15 17 131 1731999 9638 87 5698 422 22 911 1893 16 336 14 4 140 952000 10696 167 6353 778 40 1004 1801 14 185 12 3 48 2902001 10342 162 6440 582 27 994 1637 14 180 12 4 72 219

H-54
Annual Average Daily Traffic For Different Truck Types ( Station 033034_BURLINGAME)
0
2000
4000
6000
8000
10000
12000
1992 1993 1994 1995 1996 1997 1998 1999 2000 2001 2002
Year
AA
DTT
All_TypeType4Type5Type6Type7Type8Type9Type10Type11Type12Type13Type14Type15

H-55
STATION 35 PACHECO
Load Spectra for Different Axles ( Station035 Pacheco)
0
0.05
0.1
0.15
0.2
0.25
0.3
0 50 100 150 200 250 300 350
Load, kN
Nor
mal
ized
Fre
quen
cy
SteeringSingleTandemTridem
Average Annual Daily Traffic for Different Truck TypesTruck TypeYearAll 4 5 6 7 8 9 10 11 12 13 14 15
1993 3716 27 391 90 2 252 1954 13 746 56 5 58 1241994 3571 26 377 81 1 241 1921 16 678 53 6 53 1181995 3937 25 499 95 1 258 2043 19 686 48 3 57 2031996 3571 22 371 72 1 213 2090 17 570 52 2 47 1151997 3879 28 454 88 1 232 2244 19 586 51 2 54 1211998 3999 31 529 90 1 176 2418 21 565 48 2 63 551999 4199 43 586 92 1 178 2505 22 595 49 2 63 622000 4009 45 598 88 1 184 2444 21 474 42 2 56 552001 3592 39 732 62 1 186 2024 26 356 33 2 72 59

H-56
Annual Average Daily Traffic For Different Truck Types ( Station 035_PACHECO)
0
500
1000
1500
2000
2500
3000
3500
4000
4500
1992 1993 1994 1995 1996 1997 1998 1999 2000 2001 2002
Year
AA
DTT
All_TypeType4Type5Type6Type7Type8Type9Type10Type11Type12Type13Type14Type15

H-57
STATION 36 LOS BANOS
Load Spectra for Different Axles ( Station036 Los Banos)
0
0.05
0.1
0.15
0.2
0.25
0.3
0.35
0 50 100 150 200 250 300 350
Load, kN
Nor
mal
ized
Fre
quen
cy
SteeringSingleTandemTridem
Average Annual Daily Traffic for Different Truck TypesTruck TypeYearAll 4 5 6 7 8 9 10 11 12 13 14 15
1993 2239 12 492 68 2 192 926 2 423 20 3 58 421994 2068 12 361 63 1 138 950 4 400 21 2 55 611995 2196 14 356 64 4 154 1121 8 304 21 4 51 961996 2327 17 512 141 1 357 1017 8 133 13 1 10 1171997 2380 19 531 141 2 343 1056 9 132 13 2 11 1211998 2364 19 610 134 2 211 1082 8 135 13 2 8 1401999 2334 22 605 115 2 165 1075 8 213 16 3 25 852000 2581 23 581 94 3 130 1306 8 318 24 3 51 402001 2084 17 513 78 1 112 1094 7 155 14 10 43 41

H-58
Annual Average Daily Traffic For Different Truck Types ( Station 036_LOS_BANOS)
0
500
1000
1500
2000
2500
3000
1992 1993 1994 1995 1996 1997 1998 1999 2000 2001 2002
Year
AA
DTT
All_TypeType4Type5Type6Type7Type8Type9Type10Type11Type12Type13Type14Type15

H-59
STATIONS 37&38 ELSINORE
Load Spectra for Different Axles ( Station037038 Elsinore)
0
0.05
0.1
0.15
0.2
0.25
0 50 100 150 200 250 300 350
Load, kN
Nor
mal
ized
Fre
quen
cy
SteeringSingleTandemTridem
Average Annual Daily Traffic for Different Truck TypesTruck TypeYearAll 4 5 6 7 8 9 10 11 12 13 14 15
1993 4502 50 1344 247 54 464 1481 5 467 26 16 215 1331994 4450 30 1350 259 64 457 1519 10 390 30 13 194 1361995 4615 35 1359 270 56 470 1586 11 433 31 15 198 1501996 4712 33 1379 306 54 501 1674 10 346 31 14 208 1551997 5271 41 1471 336 57 531 1895 12 444 32 18 277 1551998 5588 51 1791 374 84 468 1966 11 417 30 17 287 931999 6742 61 2144 441 103 531 2355 16 544 39 22 361 1272000 7774 88 2450 469 97 812 2653 20 594 49 27 403 1122001 7363 90 2276 460 86 746 2641 22 499 44 21 369 109

H-60
Annual Average Daily Traffic For Different Truck Types ( Station 037038_ELSINORE)
0
1000
2000
3000
4000
5000
6000
7000
8000
9000
1992 1993 1994 1995 1996 1997 1998 1999 2000 2001 2002
Year
AA
DTT
All_TypeType4Type5Type6Type7Type8Type9Type10Type11Type12Type13Type14Type15

H-61
STATION 39 REDLANDS
Load Spectra for Different Axles ( Station039 Redlands)
0
0.02
0.04
0.06
0.08
0.1
0.12
0.14
0.16
0.18
0.2
0 50 100 150 200 250 300 350
Load, kN
Nor
mal
ized
Fre
quen
cy
SteeringSingleTandemTridem
Average Annual Daily Traffic for Different Truck TypesTruck TypeYearAll 4 5 6 7 8 9 10 11 12 13 14 15
1993 1187 14 496 91 22 79 181 0 143 1 5 98 561994 1367 22 521 75 16 98 291 2 134 4 4 106 951995 2202 18 858 116 28 136 375 2 392 12 6 125 1331996 1802 20 706 115 13 132 357 3 257 15 4 91 901997 1946 21 750 163 13 190 360 2 236 16 3 102 921998 2806 24 1059 248 55 316 456 4 377 18 3 143 1051999 2430 25 970 190 19 150 482 5 370 19 3 123 732000 2381 25 853 199 16 152 527 5 349 25 4 156 712001 2257 31 920 193 22 179 528 3 156 14 5 135 71

H-62
Annual Average Daily Traffic For Different Truck Types ( Station 039_REDLANDS)
0
500
1000
1500
2000
2500
3000
1992 1993 1994 1995 1996 1997 1998 1999 2000 2001 2002
Year
AA
DTT
All_TypeType4Type5Type6Type7Type8Type9Type10Type11Type12Type13Type14Type15

H-63
STATION 40 COCHELLA
Load Spectra for Different Axles ( Station040 Cochella)
0
0.05
0.1
0.15
0.2
0.25
0.3
0 50 100 150 200 250 300 350
Load, kN
Nor
mal
ized
Fre
quen
cy
SteeringSingleTandemTridem
Average Annual Daily Traffic for Different Truck TypesTruck TypeYearAll 4 5 6 7 8 9 10 11 12 13 14 15
1993 608 3 59 13 1 27 318 1 132 8 3 33 111994 779 2 88 15 2 33 412 1 178 9 1 25 131995 877 3 91 17 1 41 484 1 184 11 1 23 181996 1035 4 127 22 5 39 563 1 219 9 2 23 221997 976 3 128 23 3 36 501 2 230 9 1 22 181998 1450 6 179 30 3 36 750 2 374 14 1 38 181999 1867 10 221 45 4 45 1023 2 434 19 2 35 262000 2162 11 278 49 5 59 1207 3 452 23 3 35 372001 2872 13 330 75 13 77 1829 3 415 19 3 41 54

H-64
Annual Average Daily Traffic For Different Truck Types ( Station 040_COCHELLA)
0
500
1000
1500
2000
2500
3000
3500
1992 1993 1994 1995 1996 1997 1998 1999 2000 2001 2002
Year
AA
DTT
All_TypeType4Type5Type6Type7Type8Type9Type10Type11Type12Type13Type14Type15

H-65
STATIONS 41&42 VACAVILLE
Load Spectra for Different Axles ( Station041042 Vacaville)
0
0.05
0.1
0.15
0.2
0.25
0 50 100 150 200 250 300 350
Load, kN
Nor
mal
ized
Fre
quen
cy
SteeringSingleTandemTridem
Average Annual Daily Traffic for Different Truck TypesTruck TypeYearAll 4 5 6 7 8 9 10 11 12 13 14 15
1994 5904 129 1702 209 6 563 2323 28 596 75 6 187 801996 5887 139 1573 230 14 578 2394 37 510 78 9 176 1501997 6719 151 1985 248 14 608 2696 38 564 85 7 185 1391998 7371 155 2390 250 10 661 2909 38 598 88 5 190 771999 7669 172 2528 264 13 685 3026 35 589 87 6 170 932000 7754 178 2701 251 7 668 2962 36 513 80 5 164 1902001 3833 66 1454 106 0 333 1477 19 232 41 2 71 31

H-66
Annual Average Daily Traffic For Different Truck Types ( Station 041042_VACAVILLE)
0
1000
2000
3000
4000
5000
6000
7000
8000
9000
1993 1994 1995 1996 1997 1998 1999 2000 2001 2002
Year
AA
DTT
All_TypeType4Type5Type6Type7Type8Type9Type10Type11Type12Type13Type14Type15

H-67
STATION 43 CHOLAME
Load Spectra for Different Axles ( Station043 Cholame)
0
0.05
0.1
0.15
0.2
0.25
0.3
0 50 100 150 200 250 300 350
Load, kN
Nor
mal
ized
Fre
quen
cy
SteeringSingleTandemTridem
Average Annual Daily Traffic for Different Truck TypesTruck TypeYearAll 4 5 6 7 8 9 10 11 12 13 14 15
1993 1634 11 288 26 1 48 953 3 200 9 2 71 231994 1079 8 186 23 1 47 563 2 149 14 1 75 121996 1672 15 291 34 7 53 1004 4 184 13 1 53 141997 1666 18 273 28 1 55 997 4 198 15 1 63 131998 1688 19 279 29 1 63 1006 6 192 15 1 64 141999 2013 22 368 32 2 77 1218 6 205 15 1 47 202000 1782 22 375 29 2 81 1017 6 169 14 1 48 182001 1566 21 369 34 2 76 799 5 175 14 1 53 17

H-68
Annual Average Daily Traffic For Different Truck Types ( Station 043_CHOLAME)
0
500
1000
1500
2000
2500
1992 1993 1994 1995 1996 1997 1998 1999 2000 2001 2002
Year
AA
DTT
All_TypeType4Type5Type6Type7Type8Type9Type10Type11Type12Type13Type14Type15

H-69
STATION 44 BANTA
Load Spectra for Different Axles ( Station044 Banta)
0
0.05
0.1
0.15
0.2
0.25
0.3
0 50 100 150 200 250 300 350
Load, kN
Nor
mal
ized
Fre
quen
cy
SteeringSingleTandemTridem
Average Annual Daily Traffic for Different Truck TypesTruck TypeYearAll 4 5 6 7 8 9 10 11 12 13 14 15
1994 7845 74 1405 296 4 830 3616 35 989 97 6 123 3691995 7631 93 1221 310 5 778 3786 45 876 97 6 126 2871996 8535 104 1562 601 6 938 3920 56 693 113 6 34 5031997 9028 100 1803 668 8 828 4241 59 650 108 6 35 5201998 9128 98 1670 434 10 679 4731 56 924 105 20 170 2291999 9506 116 1738 369 20 644 5126 65 924 100 24 216 1642000 3940 41 753 359 7 437 1987 29 210 37 5 17 582001 3979 60 914 338 25 425 1916 19 185 39 4 16 41

H-70
Annual Average Daily Traffic For Different Truck Types ( Station 044_BANTA)
0
2000
4000
6000
8000
10000
12000
1993 1994 1995 1996 1997 1998 1999 2000 2001 2002
Year
AA
DTT
All_TypeType4Type5Type6Type7Type8Type9Type10Type11Type12Type13Type14Type15

H-71
STATION 45 CARBONA
Load Spectra for Different Axles ( Station045 Carbona)
0
0.05
0.1
0.15
0.2
0.25
0.3
0.35
0 50 100 150 200 250 300 350
Load, kN
Nor
mal
ized
Fre
quen
cy
SteeringSingleTandemTridem
Average Annual Daily Traffic for Different Truck TypesTruck TypeYearAll 4 5 6 7 8 9 10 11 12 13 14 15
1994 3646 23 451 114 1 197 2168 23 446 58 4 72 891995 3939 36 489 102 1 211 2420 26 456 60 4 62 731996 4220 34 571 228 1 281 2458 35 386 51 4 29 1441997 4046 22 544 191 1 207 2495 42 322 51 3 44 1241998 4774 37 712 213 0 193 2936 40 427 58 5 40 1141999 5066 35 821 210 1 197 3097 32 434 67 4 58 1102000 5718 39 926 233 1 213 3339 37 601 68 4 103 1532001 5475 31 835 199 1 226 3360 40 496 63 4 89 131

H-72
Annual Average Daily Traffic For Different Truck Types ( Station 045_CARBONA)
0
1000
2000
3000
4000
5000
6000
7000
1993 1994 1995 1996 1997 1998 1999 2000 2001 2002
Year
AA
DTT
All_TypeType4Type5Type6Type7Type8Type9Type10Type11Type12Type13Type14Type15

H-73
STATION 46 GALT
Load Spectra for Different Axles ( Station046 Galt)
0
0.05
0.1
0.15
0.2
0.25
0.3
0 50 100 150 200 250 300 350
Load, kN
Nor
mal
ized
Fre
quen
cy
SteeringSingleTandemTridem
Average Annual Daily Traffic for Different Truck TypesTruck TypeYearAll 4 5 6 7 8 9 10 11 12 13 14 15
1994 5191 59 1092 197 11 377 2471 19 729 69 3 115 501995 5583 48 1179 212 4 457 2693 19 700 80 3 118 721996 5955 72 1343 217 8 407 2693 24 856 101 3 154 761997 6030 73 1293 222 9 420 2879 24 753 108 3 145 991998 6319 69 1432 246 13 432 2997 26 760 117 4 141 811999 6839 74 1611 255 14 445 3250 29 770 108 4 179 1012000 6717 77 1691 247 13 473 3248 33 591 105 4 140 97

H-74
Annual Average Daily Traffic For Different Truck Types ( Station 046_GALT)
0
1000
2000
3000
4000
5000
6000
7000
8000
1993 1994 1995 1996 1997 1998 1999 2000 2001
Year
AA
DTT
All_TypeType4Type5Type6Type7Type8Type9Type10Type11Type12Type13Type14Type15

H-75
STATIONS 47&48 CASTAIC
Load Spectra for Different Axles ( Station047048 Castaic)
0
0.05
0.1
0.15
0.2
0.25
0.3
0.35
0 50 100 150 200 250 300 350
Load, kN
Nor
mal
ized
Fre
quen
cy
SteeringSingleTandemTridem
Average Annual Daily Traffic for Different Truck TypesTruck TypeYearAll 4 5 6 7 8 9 10 11 12 13 14 15
1994 11480 172 1196 270 13 536 6914 71 1472 213 8 403 2131995 11818 170 1215 283 13 514 7255 81 1403 208 12 412 2531996 14153 183 1268 591 11 607 8824 101 1519 236 12 375 4251997 13521 190 1338 602 21 563 8416 115 1343 223 9 339 3621998 14677 199 1718 674 29 497 9138 132 1405 222 19 363 2811999 15171 211 1876 704 41 496 9493 129 1368 227 10 306 3092000 15948 222 1838 759 31 480 10270 126 1360 228 12 310 3142001 14652 189 1538 712 22 451 9459 127 1180 208 132 259 375

H-76
Annual Average Daily Traffic For Different Truck Types ( Station 047048_CASTAIC)
0
2000
4000
6000
8000
10000
12000
14000
16000
18000
1993 1994 1995 1996 1997 1998 1999 2000 2001 2002
Year
AA
DTT
All_TypeType4Type5Type6Type7Type8Type9Type10Type11Type12Type13Type14Type15

H-77
STATION 49 AUBURN
Load Spectra for Different Axles ( Station049 Auburn)
0
0.05
0.1
0.15
0.2
0.25
0.3
0 50 100 150 200 250 300 350
Load, kN
Nor
mal
ized
Fre
quen
cy
SteeringSingleTandemTridem
Average Annual Daily Traffic for Different Truck TypesTruck TypeYearAll 4 5 6 7 8 9 10 11 12 13 14 15
1994 741 12 351 67 0 96 118 1 16 1 0 45 341995 740 10 359 65 0 92 121 0 14 1 0 39 371996 753 18 347 82 1 93 114 0 11 1 1 37 481997 769 11 370 69 0 97 122 1 14 1 0 44 401998 823 11 456 72 1 80 129 1 16 1 0 43 131999 933 12 533 80 2 80 143 1 16 1 0 50 152000 937 14 537 77 2 82 145 0 18 1 0 43 182001 817 7 490 50 1 73 136 1 12 1 0 38 7

H-78
Annual Average Daily Traffic For Different Truck Types ( Station 049_AUBURN)
-200
0
200
400
600
800
1000
1993 1994 1995 1996 1997 1998 1999 2000 2001 2002
Year
AA
DTT
All_TypeType4Type5Type6Type7Type8Type9Type10Type11Type12Type13Type14Type15

H-79
STATION 50 ELMIRA
Load Spectra for Different Axles ( Station050 Elmira)
0
0.05
0.1
0.15
0.2
0.25
0.3
0 50 100 150 200 250 300 350
Load, kN
Nor
mal
ized
Fre
quen
cy
SteeringSingleTandemTridem
Average Annual Daily Traffic for Different Truck TypesTruck TypeYearAll 4 5 6 7 8 9 10 11 12 13 14 15
1996 1996 25 389 58 2 85 825 36 345 26 2 159 461997 2000 26 375 50 2 67 874 37 367 22 2 158 191998 2116 27 448 61 2 65 882 36 389 22 1 159 222000 2333 34 552 62 3 64 1007 36 376 22 1 155 212001 1988 31 494 44 0 57 943 34 242 16 1 110 16

H-80
Annual Average Daily Traffic For Different Truck Types ( Station 050_ELMIRA)
0
500
1000
1500
2000
2500
1995 1996 1997 1998 1999 2000 2001 2002
Year
AA
DTT
All_TypeType4Type5Type6Type7Type8Type9Type10Type11Type12Type13Type14Type15

H-81
STATIONS 51&52 WESTSAC
Load Spectra for Different Axles ( Station051052 Westsac)
0
0.05
0.1
0.15
0.2
0.25
0 50 100 150 200 250 300 350
Load, kN
Nor
mal
ized
Fre
quen
cy
SteeringSingleTandemTridem
Average Annual Daily Traffic for Different Truck TypesTruck TypeYearAll 4 5 6 7 8 9 10 11 12 13 14 15
1996 4278 108 1163 275 10 436 1402 16 584 33 4 194 541997 4398 104 1222 278 7 468 1539 21 481 34 4 180 611998 4910 117 1439 354 15 486 1648 20 540 46 4 179 611999 4793 135 1439 305 10 488 1641 18 493 37 4 159 652000 5433 148 1776 329 9 520 1821 21 517 43 4 173 71

H-82
Annual Average Daily Traffic For Different Truck Types ( Station 051052_WESTSAC)
0
1000
2000
3000
4000
5000
6000
1995 1996 1997 1998 1999 2000 2001 2002
Year
AA
DTT
All_TypeType4Type5Type6Type7Type8Type9Type10Type11Type12Type13Type14Type15
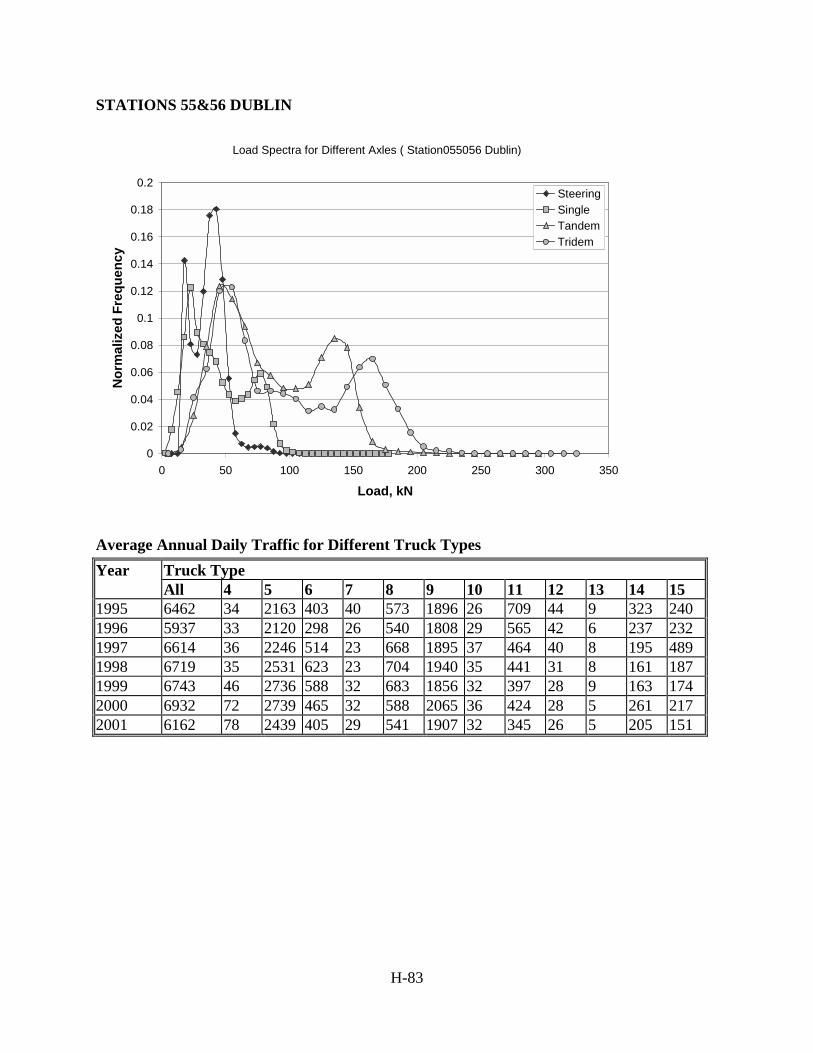
H-83
STATIONS 55&56 DUBLIN
Load Spectra for Different Axles ( Station055056 Dublin)
0
0.02
0.04
0.06
0.08
0.1
0.12
0.14
0.16
0.18
0.2
0 50 100 150 200 250 300 350
Load, kN
Nor
mal
ized
Fre
quen
cy
SteeringSingleTandemTridem
Average Annual Daily Traffic for Different Truck TypesTruck TypeYearAll 4 5 6 7 8 9 10 11 12 13 14 15
1995 6462 34 2163 403 40 573 1896 26 709 44 9 323 2401996 5937 33 2120 298 26 540 1808 29 565 42 6 237 2321997 6614 36 2246 514 23 668 1895 37 464 40 8 195 4891998 6719 35 2531 623 23 704 1940 35 441 31 8 161 1871999 6743 46 2736 588 32 683 1856 32 397 28 9 163 1742000 6932 72 2739 465 32 588 2065 36 424 28 5 261 2172001 6162 78 2439 405 29 541 1907 32 345 26 5 205 151

H-84
Annual Average Daily Traffic For Different Truck Types ( Station 055056_DUBLIN)
0
1000
2000
3000
4000
5000
6000
7000
8000
1994 1995 1996 1997 1998 1999 2000 2001 2002
Year
AA
DTT
All_TypeType4Type5Type6Type7Type8Type9Type10Type11Type12Type13Type14Type15

H-85
STATIONS 57&58 PINOLE
Load Spectra for Different Axles ( Station057058 Pinole)
0
0.05
0.1
0.15
0.2
0.25
0 50 100 150 200 250 300 350
Load, kN
Nor
mal
ized
Fre
quen
cy
SteeringSingleTandemTridem
Average Annual Daily Traffic for Different Truck TypesTruck TypeYearAll 4 5 6 7 8 9 10 11 12 13 14 15
1995 6909 196 1962 426 5 669 2718 40 375 67 6 188 2561996 6663 163 1887 425 4 633 2696 45 354 59 7 183 2071997 6706 153 1785 402 5 638 2866 50 350 62 5 148 2421998 7024 135 2053 580 1 616 2937 54 273 58 4 50 2641999 8170 140 2629 650 2 683 3296 54 273 63 4 66 3112000 8626 137 2771 672 2 687 3582 53 271 63 4 85 2972001 8381 124 2813 655 2 659 3397 48 256 65 4 89 269
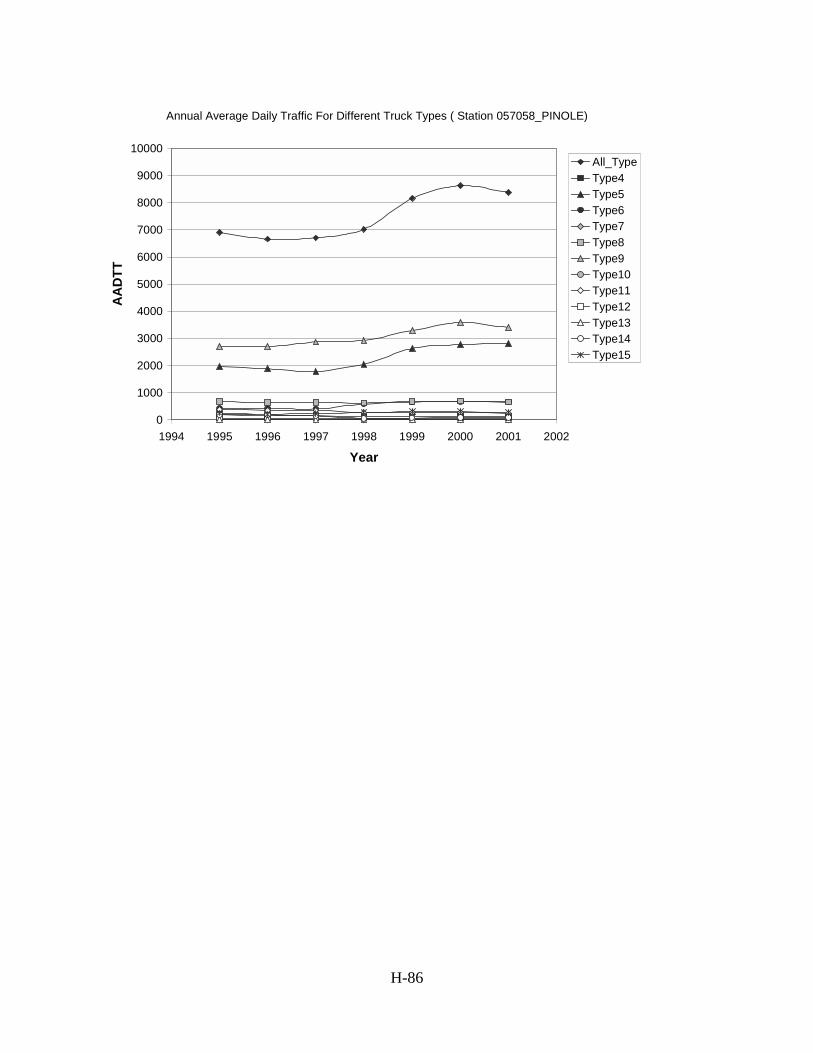
H-86
Annual Average Daily Traffic For Different Truck Types ( Station 057058_PINOLE)
0
1000
2000
3000
4000
5000
6000
7000
8000
9000
10000
1994 1995 1996 1997 1998 1999 2000 2001 2002
Year
AA
DTT
All_TypeType4Type5Type6Type7Type8Type9Type10Type11Type12Type13Type14Type15

H-87
STATIONS 59&60 LA-710
Load Spectra for Different Axles ( Station059060 La-710)
0
0.05
0.1
0.15
0.2
0.25
0.3
0.35
0 50 100 150 200 250 300 350
Load, kN
Nor
mal
ized
Fre
quen
cy
SteeringSingleTandemTridem
Average Annual Daily Traffic for Different Truck TypesTruck TypeYearAll 4 5 6 7 8 9 10 11 12 13 14 15
1995 19841 212 3696 2819 57 1008 10113 201 537 39 23 674 4631996 19684 237 3628 2727 67 847 10232 167 689 34 15 739 3021997 21431 215 3832 3038 64 826 11560 191 710 37 16 683 2601998 22868 190 3800 3220 64 841 13019 230 619 35 16 596 2381999 23394 223 3843 3272 78 808 13397 211 654 33 15 584 2772000 25626 267 4104 3458 89 827 14595 258 1182 42 21 613 1712001 24419 263 3975 3463 63 682 13744 276 1130 39 36 562 186

H-88
Annual Average Daily Traffic For Different Truck Types ( Station 059060_LA-710)
0
5000
10000
15000
20000
25000
30000
1994 1995 1996 1997 1998 1999 2000 2001 2002
Year
AA
DTT
All_TypeType4Type5Type6Type7Type8Type9Type10Type11Type12Type13Type14Type15

H-89
STATIONS 61&62 PERALTA
Load Spectra for Different Axles ( Station061062 Peralta)
0
0.05
0.1
0.15
0.2
0.25
0 50 100 150 200 250 300 350
Load, kN
Nor
mal
ized
Fre
quen
cy
SteeringSingleTandemTridem
Average Annual Daily Traffic for Different Truck TypesTruck TypeYearAll 4 5 6 7 8 9 10 11 12 13 14 15
1996 10962 93 3415 527 87 722 3620 26 1379 46 18 910 1201997 11137 100 3496 590 129 672 3689 21 1367 37 17 905 1141998 12019 115 3739 616 108 719 3873 20 1679 38 17 944 1521999 11692 131 3628 607 141 683 3778 17 1652 37 14 871 1332000 10348 150 3604 490 86 647 3579 17 1017 38 8 570 1412001 11157 163 4381 499 81 792 3893 20 665 42 4 468 149

H-90
Annual Average Daily Traffic For Different Truck Types ( Station 061062_PERALTA)
0
2000
4000
6000
8000
10000
12000
14000
1995 1996 1997 1998 1999 2000 2001 2002
Year
AA
DTT
All_TypeType4Type5Type6Type7Type8Type9Type10Type11Type12Type13Type14Type15

H-91
STATION 63 MURRIETA
Load Spectra for Different Axles ( Station063 Murrieta)
0
0.02
0.04
0.06
0.08
0.1
0.12
0.14
0.16
0.18
0.2
0 50 100 150 200 250 300 350
Load, kN
Nor
mal
ized
Fre
quen
cy
SteeringSingleTandemTridem
Average Annual Daily Traffic for Different Truck TypesTruck TypeYearAll 4 5 6 7 8 9 10 11 12 13 14 15
1995 2156 14 879 135 12 189 507 5 128 8 9 57 2121996 2185 12 897 178 15 211 555 3 136 13 5 56 1051997 2486 22 942 222 24 235 636 4 184 12 9 59 1351998 2492 24 916 240 26 238 686 4 168 10 4 63 1131999 2927 27 1144 254 31 262 779 5 179 12 6 76 1512000 3212 27 1252 271 48 281 863 6 187 15 6 93 1642001 3110 26 1221 280 51 277 822 4 156 11 3 87 172

H-92
Annual Average Daily Traffic For Different Truck Types ( Station 063_MURRIETA)
0
500
1000
1500
2000
2500
3000
3500
1994 1995 1996 1997 1998 1999 2000 2001 2002
Year
AA
DTT
All_TypeType4Type5Type6Type7Type8Type9Type10Type11Type12Type13Type14Type15

H-93
STATION 64 FOSTER CITY
Load Spectra for Different Axles (Station 064_Poster City )
0
0.02
0.04
0.06
0.08
0.1
0.12
0.14
0.16
0.18
0.2
0 50 100 150 200 250 300 350
Load, kN
Nor
mal
ized
Fre
quen
cy
SteeringSingleTandemTridem
Average Annual Daily Traffic for Different Truck TypesTruck TypeYearAll 4 5 6 7 8 9 10 11 12 13 14 15
1997 4262 27 2139 182 1 410 1110 8 225 13 2 77 681998 5127 25 2713 193 2 485 1257 9 281 13 2 88 581999 5735 32 3119 224 5 526 1343 11 302 14 3 94 612000 5611 33 3156 205 2 486 1322 10 235 12 3 85 612001 5725 30 3521 181 1 453 1194 9 177 14 2 68 73

H-94
Annual Average Daily Traffic For Different Truck Types ( Station 064_POSTER_CITY)
0
1000
2000
3000
4000
5000
6000
7000
1996.5
1997 1997.5
1998 1998.5
1999 1999.5
2000 2000.5
2001 2001.5
Year
AA
DTT
All_TypeType4Type5Type6Type7Type8Type9Type10Type11Type12Type13Type14Type15

H-95
STATION 65 PIRU
Load Spectra for Different Axles ( Station065 Piru)
0
0.05
0.1
0.15
0.2
0.25
0.3
0 50 100 150 200 250 300 350
Load, kN
Nor
mal
ized
Fre
quen
cy
SteeringSingleTandemTridem
Average Annual Daily Traffic for Different Truck TypesTruck TypeYearAll 4 5 6 7 8 9 10 11 12 13 14 15
1998 2009 16 435 76 4 83 932 6 324 12 3 92 261999 2304 18 528 68 2 100 1095 9 319 17 8 94 452000 2501 20 575 86 4 101 1200 13 286 20 12 114 722001 2361 16 487 85 8 98 1164 13 266 16 17 104 87

H-96
Annual Average Daily Traffic For Different Truck Types ( Station 065_PIRU)
0
500
1000
1500
2000
2500
3000
1997.5 1998 1998.5 1999 1999.5 2000 2000.5 2001 2001.5
Year
AA
DTT
All_TypeType4Type5Type6Type7Type8Type9Type10Type11Type12Type13Type14Type15

H-97
STATION 66 CALICO
Load Spectra for Different Axles ( Station066 Calico)
0
0.05
0.1
0.15
0.2
0.25
0.3
0.35
0 50 100 150 200 250 300 350
Load, kN
Nor
mal
ized
Fre
quen
cy
SteeringSingleTandemTridem
Average Annual Daily Traffic for Different Truck TypesTruck TypeYearAll 4 5 6 7 8 9 10 11 12 13 14 15
1996 5792 174 968 149 2 230 3378 47 598 97 4 54 931997 5762 195 938 155 1 167 3508 51 533 74 4 52 831998 6100 207 992 152 1 216 3689 44 567 83 5 44 1001999 6321 207 1064 147 1 289 3832 41 490 75 5 40 1292000 6584 216 1134 143 1 190 4152 41 493 73 5 41 952001 6073 188 1086 128 1 168 3879 43 410 56 6 38 70

H-98
Annual Average Daily Traffic For Different Truck Types ( Station 066_CALICO)
0
1000
2000
3000
4000
5000
6000
7000
1995 1996 1997 1998 1999 2000 2001 2002
Year
AA
DTT
All_TypeType4Type5Type6Type7Type8Type9Type10Type11Type12Type13Type14Type15

H-99
STATION 67 DEVORE
Load Spectra for Different Axles ( Station067 Devore)
0
0.05
0.1
0.15
0.2
0.25
0 50 100 150 200 250 300 350
Load, kN
Nor
mal
ized
Fre
quen
cy
SteeringSingleTandemTridem
Average Annual Daily Traffic for Different Truck TypesTruck TypeYearAll 4 5 6 7 8 9 10 11 12 13 14 15
1997 3210 61 892 117 3 153 1238 11 527 33 4 99 711998 3547 68 799 129 2 155 1245 16 822 43 5 125 1381999 3654 66 886 144 10 156 1490 14 631 49 9 130 702000 3785 81 923 133 2 156 1589 16 601 59 9 130 872001 3387 79 741 128 2 158 1559 15 444 41 13 107 100

H-100
Annual Average Daily Traffic For Different Truck Types ( Station 067_DEVORE)
0
500
1000
1500
2000
2500
3000
3500
4000
1996.5
1997 1997.5
1998 1998.5
1999 1999.5
2000 2000.5
2001 2001.5
Year
AA
DTT
All_TypeType4Type5Type6Type7Type8Type9Type10Type11Type12Type13Type14Type15

H-101
STATION 68 GILROY
Load Spectra for Different Axles ( Station068 Gilroy)
0
0.02
0.04
0.06
0.08
0.1
0.12
0.14
0.16
0.18
0.2
0 50 100 150 200 250 300 350
Load, kN
Nor
mal
ized
Fre
quen
cy
SteeringSingleTandemTridem
Average Annual Daily Traffic for Different Truck TypesTruck TypeYearAll 4 5 6 7 8 9 10 11 12 13 14 15
1996 5812 65 1667 182 26 410 2504 24 482 62 2 242 1461997 6029 88 1767 187 19 460 2480 27 556 59 3 281 1021998 6509 97 1930 206 23 535 2564 34 602 54 4 341 1201999 6479 111 1995 194 18 465 2568 40 563 53 4 355 1152000 6496 112 2139 210 19 417 2564 40 518 42 3 351 802001 6690 111 2419 196 22 384 2567 40 491 39 3 355 63

H-102
Annual Average Daily Traffic For Different Truck Types ( Station 068_GILROY)
0
1000
2000
3000
4000
5000
6000
7000
8000
1995 1996 1997 1998 1999 2000 2001 2002
Year
AA
DTT
All_TypeType4Type5Type6Type7Type8Type9Type10Type11Type12Type13Type14Type15

H-103
STATION 69&70 FONTANA
Load Spectra for Different Axles ( Station069070 Fontana)
0
0.05
0.1
0.15
0.2
0.25
0.3
0 50 100 150 200 250 300 350
Load, kN
Nor
mal
ized
Fre
quen
cy
SteeringSingleTandemTridem
Average Annual Daily Traffic for Different Truck TypesTruck TypeYearAll 4 5 6 7 8 9 10 11 12 13 14 15
1997 10273 151 1603 462 26 374 5744 66 1354 120 31 191 1501998 11000 167 1777 561 43 397 6158 58 1321 134 24 199 1631999 11548 166 1933 587 47 391 6522 55 1298 125 31 219 1762000 6367 87 1076 340 26 207 3382 28 878 62 16 153 1132001 5747 76 928 320 12 180 3091 26 830 49 9 122 103

H-104
Annual Average Daily Traffic For Different Truck Types ( Station 069070_FONTANA)
0
2000
4000
6000
8000
10000
12000
14000
1997 1997 1998 1998 1999 1999 2000 2000 2001 2001 2002
Year
AA
DTT
All_TypeType4Type5Type6Type7Type8Type9Type10Type11Type12Type13Type14Type15

H-105
STATION 71 HINKLEY
Load Spectra for Different Axles ( Station071 Hinkley)
0
0.05
0.1
0.15
0.2
0.25
0.3
0.35
0.4
0 50 100 150 200 250 300 350
Load, kN
Nor
mal
ized
Fre
quen
cy
SteeringSingleTandemTridem
Average Annual Daily Traffic for Different Truck TypesTruck TypeYearAll 4 5 6 7 8 9 10 11 12 13 14 15
1997 3108 31 306 41 0 59 2413 16 148 22 2 18 521998 3365 31 317 39 0 72 2618 19 162 24 3 24 561999 3534 33 352 42 0 86 2716 22 161 22 4 25 722000 3784 35 365 43 0 87 2972 21 143 19 2 30 652001 3286 28 378 39 0 91 2502 22 125 19 1 24 59

H-106
Annual Average Daily Traffic For Different Truck Types ( Station 071_HINKLEY)
0
500
1000
1500
2000
2500
3000
3500
4000
1996.5
1997 1997.5
1998 1998.5
1999 1999.5
2000 2000.5
2001 2001.5
Year
AA
DTT
All_TypeType4Type5Type6Type7Type8Type9Type10Type11Type12Type13Type14Type15

H-107
STATION 72 BOWMAN
Load Spectra for Different Axles ( Station072 Bowman)
0
0.05
0.1
0.15
0.2
0.25
0.3
0.35
0 50 100 150 200 250 300 350
Load, kN
Nor
mal
ized
Fre
quen
cy
SteeringSingleTandemTridem
Average Annual Daily Traffic for Different Truck TypesTruck TypeYearAll 4 5 6 7 8 9 10 11 12 13 14 15
1997 4523 119 742 139 1 144 2755 40 254 98 7 126 971998 4602 136 918 126 2 147 2700 30 265 98 5 117 581999 5043 130 1039 129 3 158 2992 28 262 102 21 115 642000 5308 140 1189 124 2 146 3159 26 265 109 3 100 452001 4659 112 1139 91 2 133 2718 19 231 91 2 93 28

H-108
Annual Average Daily Traffic For Different Truck Types ( Station 072_BOWMAN)
0
1000
2000
3000
4000
5000
6000
1996.5
1997 1997.5
1998 1998.5
1999 1999.5
2000 2000.5
2001 2001.5
Year
AA
DTT
All_TypeType4Type5Type6Type7Type8Type9Type10Type11Type12Type13Type14Type15

H-109
STATION 73 STOCKDALE
Load Spectra for Different Axles ( Station073 Stockdale)
0
0.05
0.1
0.15
0.2
0.25
0.3
0.35
0 50 100 150 200 250 300 350
Load, kN
Nor
mal
ized
Fre
quen
cy
SteeringSingleTandemTridem
Average Annual Daily Traffic for Different Truck TypesTruck TypeYearAll 4 5 6 7 8 9 10 11 12 13 14 15
1997 6614 60 684 83 2 288 4263 80 803 149 4 69 1311998 6719 70 689 85 1 163 4585 92 763 143 4 68 581999 7200 79 783 88 8 165 4988 81 717 149 4 66 732000 7604 83 844 91 4 196 5218 92 758 145 8 58 1082001 7085 71 794 87 1 199 4975 91 594 131 4 63 75

H-110
Annual Average Daily Traffic For Different Truck Types ( Station 073_STOCKDALE)
0
1000
2000
3000
4000
5000
6000
7000
8000
1996.5
1997 1997.5
1998 1998.5
1999 1999.5
2000 2000.5
2001 2001.5
Year
AA
DTT
All_TypeType4Type5Type6Type7Type8Type9Type10Type11Type12Type13Type14Type15

H-111
STATION 74 BAKERSFIELD
Load Spectra for Different Axles ( Station074 Bakersfield)
0
0.05
0.1
0.15
0.2
0.25
0.3
0 50 100 150 200 250 300 350
Load, kN
Nor
mal
ized
Fre
quen
cy
SteeringSingleTandemTridem
Average Annual Daily Traffic for Different Truck TypesTruck TypeYearAll 4 5 6 7 8 9 10 11 12 13 14 15
1997 8449 118 1116 223 16 307 5063 51 986 90 4 415 601998 8229 131 1282 236 20 315 4626 39 1023 96 4 385 721999 8546 133 1485 262 21 390 4725 43 960 99 3 324 1002000 8529 129 1441 271 27 362 4927 40 869 98 4 260 1032001 7226 111 1363 228 30 227 4285 31 630 82 3 178 57

H-112
Annual Average Daily Traffic For Different Truck Types ( Station 074_BAKERSFIELD)
0
1000
2000
3000
4000
5000
6000
7000
8000
9000
1996.5
1997 1997.5
1998 1998.5
1999 1999.5
2000 2000.5
2001 2001.5
Year
AA
DTT
All_TypeType4Type5Type6Type7Type8Type9Type10Type11Type12Type13Type14Type15

H-113
STATION 75 KEYES
Load Spectra for Different Axles ( Station075 Keyes)
0
0.05
0.1
0.15
0.2
0.25
0.3
0 50 100 150 200 250 300 350
Load, kN
Nor
mal
ized
Fre
quen
cy
SteeringSingleTandemTridem
Average Annual Daily Traffic for Different Truck TypesTruck TypeYearAll 4 5 6 7 8 9 10 11 12 13 14 15
1997 9839 64 1654 328 7 523 5432 65 1224 113 3 193 2331998 10471 69 1906 338 10 556 5469 70 1614 122 5 204 1091999 10578 73 1961 325 11 568 5838 69 1290 117 4 213 1102000 12097 89 2272 407 26 595 6526 75 1636 118 4 227 1202001 10890 69 2156 356 24 555 6212 65 1062 97 2 188 105

H-114
Annual Average Daily Traffic For Different Truck Types ( Station 075_KEYES)
0
2000
4000
6000
8000
10000
12000
14000
1997 1997 1998 1998 1999 1999 2000 2000 2001 2001 2002
Year
AA
DTT
All_TypeType4Type5Type6Type7Type8Type9Type10Type11Type12Type13Type14Type15

H-115
STATION 76 TEMPLETON
Load Spectra for Different Axles ( Station076 Templeton)
0
0.05
0.1
0.15
0.2
0.25
0 50 100 150 200 250 300 350
Load, kN
Nor
mal
ized
Fre
quen
cy
SteeringSingleTandemTridem
Average Annual Daily Traffic for Different Truck TypesTruck TypeYearAll 4 5 6 7 8 9 10 11 12 13 14 15
1998 2828 35 1121 118 9 168 892 6 215 16 2 215 331999 3085 55 1311 109 8 172 948 10 213 14 6 184 542000 3616 69 1601 140 11 191 1035 11 241 14 3 227 722001 3340 65 1647 118 14 191 895 7 205 14 2 146 38

H-116
Annual Average Daily Traffic For Different Truck Types ( Station 076_TEMPLETON)
0
500
1000
1500
2000
2500
3000
3500
4000
1997.5 1998 1998.5 1999 1999.5 2000 2000.5 2001 2001.5
Year
AA
DTT
All_TypeType4Type5Type6Type7Type8Type9Type10Type11Type12Type13Type14Type15

H-117
STATIONS 77&78 COLTON
Load Spectra for Different Axles ( Station077078 Colton)
0
0.05
0.1
0.15
0.2
0.25
0.3
0 50 100 150 200 250 300 350
Load, kN
Nor
mal
ized
Fre
quen
cy
SteeringSingleTandemTridem
Average Annual Daily Traffic for Different Truck TypesTruck TypeYearAll 4 5 6 7 8 9 10 11 12 13 14 15
1998 15961 189 3644 1250 53 967 8146 58 1024 132 17 322 1591999 16946 222 3778 1348 48 941 8828 64 1035 124 20 360 1792000 18208 239 3972 1465 51 987 9652 60 1062 130 20 375 1942001 18225 250 3724 1520 44 909 9986 54 985 144 22 380 209

H-118
Annual Average Daily Traffic For Different Truck Types ( Station 077078_COLTON)
0
2000
4000
6000
8000
10000
12000
14000
16000
18000
20000
1997.5 1998 1998.5 1999 1999.5 2000 2000.5 2001 2001.5
Year
AA
DTT
All_TypeType4Type5Type6Type7Type8Type9Type10Type11Type12Type13Type14Type15

H-119
STATIONS 79&80 ARTESIA
Load Spectra for Different Axles ( Station079080 Artesia)
0
0.05
0.1
0.15
0.2
0.25
0 50 100 150 200 250 300 350
Load, kN
Nor
mal
ized
Fre
quen
cy
SteeringSingleTandemTridem
Average Annual Daily Traffic for Different Truck TypesTruck TypeYearAll 4 5 6 7 8 9 10 11 12 13 14 15
1998 10514 173 4298 975 28 853 3416 30 368 11 8 277 791999 10915 185 4346 1014 53 839 3620 36 425 9 6 299 822000 11717 201 4385 1083 62 849 4247 46 424 9 8 303 1002001 10949 209 4286 976 48 755 3951 55 296 5 5 262 102

H-120
Annual Average Daily Traffic For Different Truck Types ( Station 080_ARTESIA)
0
2000
4000
6000
8000
10000
12000
14000
1997.5 1998 1998.5 1999 1999.5 2000 2000.5 2001 2001.5
Year
AA
DTT
All_TypeType4Type5Type6Type7Type8Type9Type10Type11Type12Type13Type14Type15

H-121
STATION 81 POSITAS
Load Spectra for Different Axles ( Station081 Positas)
0
0.05
0.1
0.15
0.2
0.25
0 50 100 150 200 250 300 350
Load, kN
Nor
mal
ized
Fre
quen
cy
SteeringSingleTandemTridem
Average Annual Daily Traffic for Different Truck TypesTruck TypeYearAll 4 5 6 7 8 9 10 11 12 13 14 15
1998 4658 152 1844 360 38 302 1503 5 208 19 2 186 401999 4883 152 1922 350 33 300 1634 6 236 18 1 178 522000 4875 155 1882 351 35 318 1682 7 217 19 3 148 572001 4501 140 1721 289 27 294 1392 8 425 18 5 118 64

H-122
Annual Average Daily Traffic For Different Truck Types ( Station 081_POSITAS)
0
1000
2000
3000
4000
5000
6000
1997.5 1998 1998.5 1999 1999.5 2000 2000.5 2001 2001.5
Year
AA
DTT
All_TypeType4Type5Type6Type7Type8Type9Type10Type11Type12Type13Type14Type15

H-123
STATIONS 82&83 GLENDORA
Load Spectra for Different Axles ( Station082083 Glendora)
0
0.05
0.1
0.15
0.2
0.25
0 50 100 150 200 250 300 350
Load, kN
Nor
mal
ized
Fre
quen
cy
SteeringSingleTandemTridem
Average Annual Daily Traffic for Different Truck TypesTruck TypeYearAll 4 5 6 7 8 9 10 11 12 13 14 15
1999 11042 137 2806 503 22 636 5355 48 1052 87 18 233 1452000 11693 167 2765 554 25 652 5964 51 1014 101 18 230 1532001 5340 71 1232 258 10 292 2853 29 371 52 7 93 72

H-124
Annual Average Daily Traffic For Different Truck Types ( Station 082083_GLENDORA)
0
2000
4000
6000
8000
10000
12000
14000
1998.5 1999 1999.5 2000 2000.5 2001 2001.5
Year
AA
DTT
All_TypeType4Type5Type6Type7Type8Type9Type10Type11Type12Type13Type14Type15

H-125
STATIONS 84&85 LEUCADIA
Load Spectra for Different Axles ( Station084085 Leucadia)
0
0.05
0.1
0.15
0.2
0.25
0 50 100 150 200 250 300 350
Load, kN
Nor
mal
ized
Fre
quen
cy
SteeringSingleTandemTridem
Average Annual Daily Traffic for Different Truck TypesTruck TypeYearAll 4 5 6 7 8 9 10 11 12 13 14 15
1998 8627 265 3174 468 28 635 3427 20 301 36 24 174 761999 8888 316 3238 465 29 601 3561 25 315 33 21 199 862000 9259 332 3240 442 37 582 3986 28 285 29 17 186 952001 8332 298 2886 396 25 531 3592 28 273 40 14 162 86

H-126
Annual Average Daily Traffic For Different Truck Types ( Station 084085_LEUCADIA)
0
1000
2000
3000
4000
5000
6000
7000
8000
9000
10000
1997.5 1998 1998.5 1999 1999.5 2000 2000.5 2001 2001.5
Year
AA
DTT
All_TypeType4Type5Type6Type7Type8Type9Type10Type11Type12Type13Type14Type15

H-127
STATION 86 UKIAH
Load Spectra for Different Axles ( Station086 Ukiah)
0
0.02
0.04
0.06
0.08
0.1
0.12
0.14
0.16
0.18
0.2
0 50 100 150 200 250 300 350
Load, kN
Nor
mal
ized
Fre
quen
cy
SteeringSingleTandemTridem
Average Annual Daily Traffic for Different Truck TypesTruck TypeYearAll 4 5 6 7 8 9 10 11 12 13 14 15
1999 1564 19 520 66 3 227 400 2 99 4 1 89 1332000 2057 24 806 133 3 257 523 3 139 5 3 98 622001 1842 20 842 71 2 152 475 3 101 3 2 74 97

H-128
Annual Average Daily Traffic For Different Truck Types ( Station 086_UKIAH)
0
500
1000
1500
2000
2500
1998.5 1999 1999.5 2000 2000.5 2001 2001.5
Year
AA
DTT
All_TypeType4Type5Type6Type7Type8Type9Type10Type11Type12Type13Type14Type15

H-129
STATIONS 87&88 BALBOA
Load Spectra for Different Axles ( Station087088 Balboa)
0
0.05
0.1
0.15
0.2
0.25
0 50 100 150 200 250 300 350
Load, kN
Nor
mal
ized
Fre
quen
cy
SteeringSingleTandemTridem
Average Annual Daily Traffic for Different Truck TypesTruck TypeYearAll 4 5 6 7 8 9 10 11 12 13 14 15
1999 4690 41 2479 294 26 253 1099 8 253 9 5 178 452000 6802 57 3697 435 34 384 1601 11 271 14 5 225 692001 8053 60 4808 451 36 404 1773 14 177 17 5 213 93

H-130
Annual Average Daily Traffic For Different Truck Types ( Station 087088_BALBOA)
0
1000
2000
3000
4000
5000
6000
7000
8000
9000
1998.5 1999 1999.5 2000 2000.5 2001 2001.5
Year
AA
DTT
All_TypeType4Type5Type6Type7Type8Type9Type10Type11Type12Type13Type14Type15

H-131
STATIONS 89&90 DEKEMA
Load Spectra for Different Axles ( Station089090 Dekema)
0
0.02
0.04
0.06
0.08
0.1
0.12
0.14
0.16
0.18
0.2
0 50 100 150 200 250 300 350
Load, kN
Nor
mal
ized
Fre
quen
cy
SteeringSingleTandemTridem
Average Annual Daily Traffic for Different Truck TypesTruck TypeYearAll 4 5 6 7 8 9 10 11 12 13 14 15
1999 8591 134 3697 662 98 689 2644 14 331 27 18 214 622000 9347 149 4231 673 107 680 2832 21 293 17 18 249 762001 9358 141 4686 582 79 678 2585 21 257 17 16 217 79

H-132
Annual Average Daily Traffic For Different Truck Types ( Station 089090_DEKEMA)
0
1000
2000
3000
4000
5000
6000
7000
8000
9000
10000
1998.5 1999 1999.5 2000 2000.5 2001 2001.5
Year
AA
DTT
All_TypeType4Type5Type6Type7Type8Type9Type10Type11Type12Type13Type14Type15

H-133
STATIONS 91&92 POGGI
Load Spectra for Different Axles ( Station091092 Poggi)
0
0.02
0.04
0.06
0.08
0.1
0.12
0.14
0.16
0.18
0.2
0 50 100 150 200 250 300 350
Load, kN
Nor
mal
ized
Fre
quen
cy
SteeringSingleTandemTridem
Average Annual Daily Traffic for Different Truck TypesTruck TypeYearAll 4 5 6 7 8 9 10 11 12 13 14 15
1999 3286 68 1323 322 31 163 1240 4 57 10 3 28 342000 6992 137 2736 627 64 359 2762 11 147 8 7 79 572001 6695 139 2940 489 41 327 2537 12 73 4 8 63 62

H-134
Annual Average Daily Traffic For Different Truck Types ( Station 091092_POGGI)
0
1000
2000
3000
4000
5000
6000
7000
8000
1998.5 1999 1999.5 2000 2000.5 2001 2001.5
Year
AA
DTT
All_TypeType4Type5Type6Type7Type8Type9Type10Type11Type12Type13Type14Type15

H-135
STATION 93 LAKEPORT
Load Spectra for Different Axles ( Station093 Lakeport)
0
0.05
0.1
0.15
0.2
0.25
0 50 100 150 200 250 300 350
Load, kN
Nor
mal
ized
Fre
quen
cy
SteeringSingleTandemTridem
Average Annual Daily Traffic for Different Truck TypesTruck TypeYearAll 4 5 6 7 8 9 10 11 12 13 14 15
2000 561 3 316 40 3 38 89 2 37 2 1 21 102001 489 3 304 33 3 38 73 2 9 0 0 19 5

H-136
Annual Average Daily Traffic For Different Truck Types ( Station 093_LAKEPORT)
0
100
200
300
400
500
600
1999.8 2000 2000.2 2000.4 2000.6 2000.8 2001 2001.2
Year
AA
DTT
All_TypeType4Type5Type6Type7Type8Type9Type10Type11Type12Type13Type14Type15

H-137
STATION 94 GREENFIELD
Load Spectra for Different Axles ( Station094 Greenfield)
0
0.05
0.1
0.15
0.2
0.25
0.3
0 50 100 150 200 250 300 350
Load, kN
Nor
mal
ized
Fre
quen
cy
SteeringSingleTandemTridem
Average Annual Daily Traffic for Different Truck TypesTruck TypeYearAll 4 5 6 7 8 9 10 11 12 13 14 15
2000 3123 43 762 60 7 147 1584 24 316 32 17 75 562001 1966 33 609 48 5 98 865 8 177 17 2 77 26

H-138
Annual Average Daily Traffic For Different Truck Types ( Station 094_GREENFIELD)
0
500
1000
1500
2000
2500
3000
3500
1999.8 2000 2000.2 2000.4 2000.6 2000.8 2001 2001.2
Year
AA
DTT
All_TypeType4Type5Type6Type7Type8Type9Type10Type11Type12Type13Type14Type15

H-139
STATIONS 95&96 ONTARIO
Load Spectra for Different Axles ( Station095096 Ontario)
0
0.05
0.1
0.15
0.2
0.25
0.3
0 50 100 150 200 250 300 350
Load, kN
Nor
mal
ized
Fre
quen
cy
SteeringSingleTandemTridem
Average Annual Daily Traffic for Different Truck TypesTruck TypeYearAll 4 5 6 7 8 9 10 11 12 13 14 15
2000 27279 194 5704 1833 61 1996 14609 211 1510 185 64 455 4562001 25615 190 5359 1773 61 1716 13565 338 1337 150 100 368 659

H-140
Annual Average Daily Traffic For Different Truck Types ( Station 095096_ONTARIO)
0
5000
10000
15000
20000
25000
30000
1999.8 2000 2000.2 2000.4 2000.6 2000.8 2001 2001.2
Year
AA
DTT
All_TypeType4Type5Type6Type7Type8Type9Type10Type11Type12Type13Type14Type15

H-141
STATION 97 CHINO
Load Spectra for Different Axles ( Station097 Chino)
0
0.05
0.1
0.15
0.2
0.25
0 50 100 150 200 250 300 350
Load, kN
Nor
mal
ized
Fre
quen
cy
SteeringSingleTandemTridem
Average Annual Daily Traffic for Different Truck TypesTruck TypeYearAll 4 5 6 7 8 9 10 11 12 13 14 15
2000 2495 12 781 285 17 171 903 6 217 4 2 74 222001 2373 12 740 288 46 165 856 6 191 4 2 41 21

H-142
Annual Average Daily Traffic For Different Truck Types ( Station 097_CHINO)
0
500
1000
1500
2000
2500
3000
1999.8 2000 2000.2 2000.4 2000.6 2000.8 2001 2001.2
Year
AA
DTT
All_TypeType4Type5Type6Type7Type8Type9Type10Type11Type12Type13Type14Type15

H-143
STATION 98 PRADO
Load Spectra for Different Axles ( Station098 Prado)
0
0.02
0.04
0.06
0.08
0.1
0.12
0.14
0.16
0.18
0.2
0 50 100 150 200 250 300 350
Load, kN
Nor
mal
ized
Fre
quen
cy
SteeringSingleTandemTridem
Average Annual Daily Traffic for Different Truck TypesTruck TypeYearAll 4 5 6 7 8 9 10 11 12 13 14 15
2000 3472 34 1600 197 22 223 1026 5 229 7 3 94 332001 2811 28 1381 164 6 191 886 5 67 4 2 59 19

H-144
Annual Average Daily Traffic For Different Truck Types ( Station 098_PRADO)
0
500
1000
1500
2000
2500
3000
3500
4000
1999.8 2000 2000.2 2000.4 2000.6 2000.8 2001 2001.2
Year
AA
DTT
All_TypeType4Type5Type6Type7Type8Type9Type10Type11Type12Type13Type14Type15

H-145
STATION 99 TULLOCH
Load Spectra for Different Axles ( Station099 Tulloch)
0
0.05
0.1
0.15
0.2
0.25
0.3
0 50 100 150 200 250 300 350
Load, kN
Nor
mal
ized
Fre
quen
cy
SteeringSingleTandemTridem
Average Annual Daily Traffic for Different Truck TypesTruck TypeYearAll 4 5 6 7 8 9 10 11 12 13 14 15
2000 1080 12 561 25 1 46 222 0 118 10 1 73 122001 909 12 475 22 0 46 190 0 88 6 1 61 9

H-146
Annual Average Daily Traffic For Different Truck Types ( Station 099_TULLOCH)
0
200
400
600
800
1000
1200
1999.8 2000 2000.2 2000.4 2000.6 2000.8 2001 2001.2
Year
AA
DTT
All_TypeType4Type5Type6Type7Type8Type9Type10Type11Type12Type13Type14Type15

H-147
STATIONS 100&101 MIRAMAR
Load Spectra for Different Axles ( Station100101 Miramar)
0
0.02
0.04
0.06
0.08
0.1
0.12
0.14
0.16
0.18
0.2
0 50 100 150 200 250 300 350
Load, kN
Nor
mal
ized
Fre
quen
cy
SteeringSingleTandemTridem
Average Annual Daily Traffic for Different Truck TypesTruck TypeYearAll 4 5 6 7 8 9 10 11 12 13 14 15
2001 3653 119 1775 293 20 530 718 5 81 6 13 42 51

H-148
Annual Average Daily Traffic For Different Truck Types ( Station 100101_MIRAMAR)
0
500
1000
1500
2000
2500
3000
3500
4000
0 500 1000 1500 2000 2500
Year
AA
DTT
All_TypeType4Type5Type6Type7Type8Type9Type10Type11Type12Type13Type14Type15

I-1
APPENDIX I:
TRUCK LANEWISE DISTRIBUTION FACTOR AND
ESALs PER TRUCK TYPE FOR ALL STATIONS
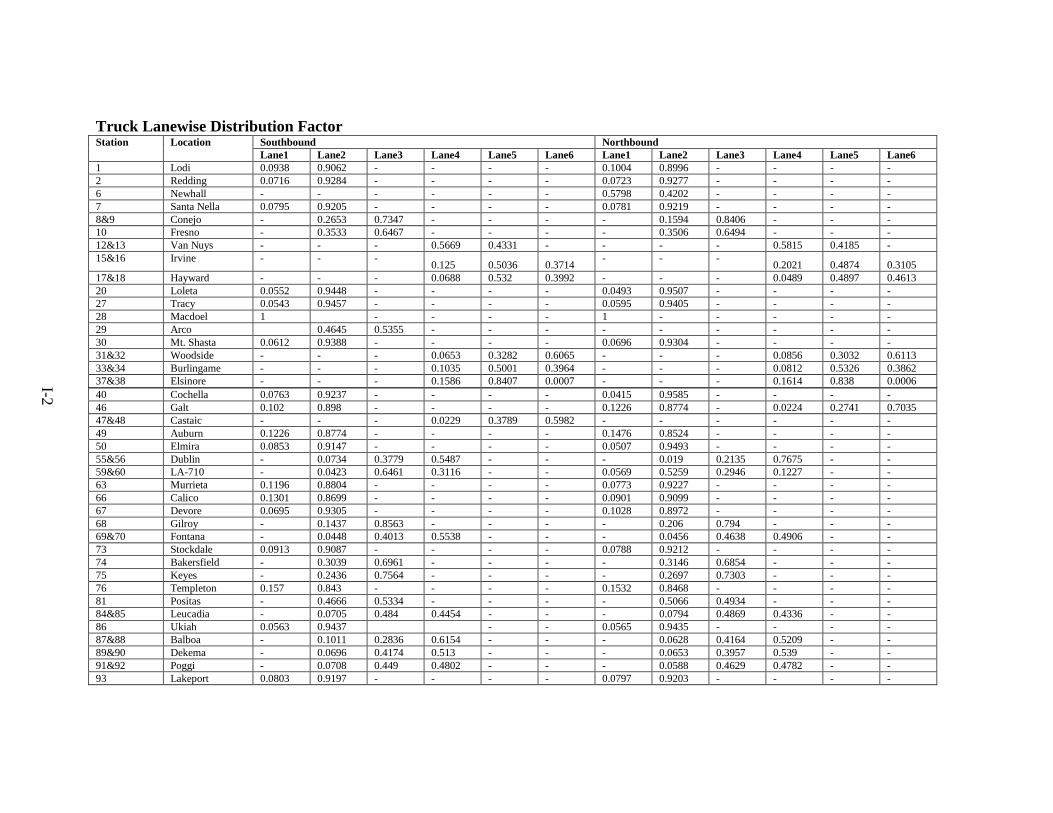
Truck Lanewise Distribution FactorSouthbound NorthboundStation LocationLane1 Lane2 Lane3 Lane4 Lane5 Lane6 Lane1 Lane2 Lane3 Lane4 Lane5 Lane6
1 Lodi 0.0938 0.9062 - - - - 0.1004 0.8996 - - - -2 Redding 0.0716 0.9284 - - - - 0.0723 0.9277 - - - -6 Newhall - - - - - - 0.5798 0.4202 - - - -7 Santa Nella 0.0795 0.9205 - - - - 0.0781 0.9219 - - - -8&9 Conejo - 0.2653 0.7347 - - - - 0.1594 0.8406 - - -10 Fresno - 0.3533 0.6467 - - - - 0.3506 0.6494 - - -12&13 Van Nuys - - - 0.5669 0.4331 - - - - 0.5815 0.4185 -15&16 Irvine - - - 0.125 0.5036 0.3714 - - - 0.2021 0.4874 0.310517&18 Hayward - - - 0.0688 0.532 0.3992 - - - 0.0489 0.4897 0.461320 Loleta 0.0552 0.9448 - - - - 0.0493 0.9507 - - - -27 Tracy 0.0543 0.9457 - - - - 0.0595 0.9405 - - - -28 Macdoel 1 - - - - 1 - - - - -29 Arco 0.4645 0.5355 - - - - - - - - -30 Mt. Shasta 0.0612 0.9388 - - - - 0.0696 0.9304 - - - -31&32 Woodside - - - 0.0653 0.3282 0.6065 - - - 0.0856 0.3032 0.611333&34 Burlingame - - - 0.1035 0.5001 0.3964 - - - 0.0812 0.5326 0.386237&38 Elsinore - - - 0.1586 0.8407 0.0007 - - - 0.1614 0.838 0.000640 Cochella 0.0763 0.9237 - - - - 0.0415 0.9585 - - - -46 Galt 0.102 0.898 - - - - 0.1226 0.8774 - 0.0224 0.2741 0.703547&48 Castaic - - - 0.0229 0.3789 0.5982 - - - - - -49 Auburn 0.1226 0.8774 - - - - 0.1476 0.8524 - - - -50 Elmira 0.0853 0.9147 - - - - 0.0507 0.9493 - - - -55&56 Dublin - 0.0734 0.3779 0.5487 - - - 0.019 0.2135 0.7675 - -59&60 LA-710 - 0.0423 0.6461 0.3116 - - 0.0569 0.5259 0.2946 0.1227 - -63 Murrieta 0.1196 0.8804 - - - - 0.0773 0.9227 - - - -66 Calico 0.1301 0.8699 - - - - 0.0901 0.9099 - - - -67 Devore 0.0695 0.9305 - - - - 0.1028 0.8972 - - - -68 Gilroy - 0.1437 0.8563 - - - - 0.206 0.794 - - -69&70 Fontana - 0.0448 0.4013 0.5538 - - - 0.0456 0.4638 0.4906 - -73 Stockdale 0.0913 0.9087 - - - - 0.0788 0.9212 - - - -74 Bakersfield - 0.3039 0.6961 - - - - 0.3146 0.6854 - - -75 Keyes - 0.2436 0.7564 - - - - 0.2697 0.7303 - - -76 Templeton 0.157 0.843 - - - - 0.1532 0.8468 - - - -81 Positas - 0.4666 0.5334 - - - - 0.5066 0.4934 - - -84&85 Leucadia - 0.0705 0.484 0.4454 - - - 0.0794 0.4869 0.4336 - -86 Ukiah 0.0563 0.9437 - - 0.0565 0.9435 - - - -87&88 Balboa - 0.1011 0.2836 0.6154 - - - 0.0628 0.4164 0.5209 - -89&90 Dekema - 0.0696 0.4174 0.513 - - - 0.0653 0.3957 0.539 - -91&92 Poggi - 0.0708 0.449 0.4802 - - - 0.0588 0.4629 0.4782 - -93 Lakeport 0.0803 0.9197 - - - - 0.0797 0.9203 - - - -
I-2

94 Greenfield 0.0663 0.9337 - - - - 0.0694 0.9306 - - - -97 Chino 0.1927 0.8073 - - - - 0.1736 0.8264 - - - -98 Prado - 0.1201 0.8799 - - - - 0.1328 0.8672 - - -100&101 Miramar - - 0.2316 0.518 0.2504 - - 0.0513 0.2985 0.6503 - -
Westbound EastboundStation LocationLane1 Lane2 Lane3 Lane4 Lane5 Lane6 Lane1 Lane2 Lane3 Lane4 Lane5 Lane6
3&4 Antelope - - 0.4843 0.5157 - - - - 0.3265 0.6735 - -5 Indio 0.085 0.915 - - - - 0.107 0.893 - - - -11 Sonoma 0.077 0.923 - - - - 0.15 0.85 - - - -14 San Marcos - 0.3068 0.6932 - - - - 0.3264 0.6736 - - -21 Mojave 0.0659 0.9341 - - - - 0.0708 0.9292 - - - -22 Jeffrey 0.0305 0.9695 - - - - 0.0297 0.9703 - - - -23 El Centro 0.1075 0.8925 - - - - 0.0765 0.9235 - - - -24 Napa 1 - - - - - 1 - - - - -25 Newberry 0.0709 0.9291 - - - - 0.0946 0.9054 - - - -26 Cameron 0.0454 0.9546 - - - - 0.0739 0.9261 - - - -35 Pacheco 0.0522 0.9478 - - - - 0.0631 0.9369 - - - -36 Los Banos 0.0623 0.9377 - - - - 0.1289 0.8711 - - - -39 Redlands 0.1154 0.8846 - - - - 0.1824 0.8176 - - - -41&42 Vacaville 0.047 0.213 0.5176 0.2224 - - 0.04 0.2537 0.7001 0.0062 - -43 Cholame 1 - - - - - 1 - - - - -44 Banta 0.0956 0.9044 - - - - 0.103 0.897 - - - -45 Carbona 0.0654 0.9346 - - - - 0.0638 0.9362 - - - -51&52 WestSac - 0.1117 0.5587 0.3296 - - - 0.1049 0.5212 0.3739 - -57&58 Pinole - - - 0.0322 0.3566 0.6113 - - - 0.0551 0.4816 0.463461&62 Peralta - 0.0628 0.3644 0.5728 - - - 0.0354 0.3284 0.6362 - -64 Foster City - 0.3195 0.6805 - - - - 0.4889 0.5111 - - -65 Piru 0.0732 0.9268 - - - - 0.0858 0.9142 - - - -71 Hinkley 0.0726 0.9274 - - - - 0.0599 0.9401 - - - -72 Bowman - 0.2373 0.7627 - - - - 0.2492 0.7508 - - -77&78 Colton - 0.036 0.3807 0.5833 - - - 0.0426 0.3666 0.5909 - -79&80 Artesia - 0.0388 0.3631 0.5981 - - - 0.0356 0.3637 0.6007 - -82&83 Glendora - 0.0354 0.3683 0.5963 - - - 0.0273 0.3366 0.6361 - -95&96 Ontario 0.0542 0.5047 0.4411 - - - 0.0608 0.5249 0.4143 - - -99 Tulloch 0.1097 0.8903 - - - - 0.0912 0.9088 - - - -
I-3I-3

ESAL/1000 TrucksTruck TypeStation LocationAll 4 5 6 7 8 9 10 11 12 13 14 15
1 Lodi 1238.4 611.9 150.4 388.6 999.5 423.7 1520.1 920.4 1672.1 701.8 6032 1691.7 648.92 Redding 1374 745 128.8 410.6 2066 354.4 1750.6 956.3 1501.8 712 2383.1 1704.7 641.83&4 Antelope 778.7 611.1 110.4 381.7 2313.3 336 1100.7 769.1 1194.9 612.7 3569.2 1143.7 654.35 Indio 1229.6 821.4 148.9 460.2 1384.2 331.7 1408.3 940.8 1495.7 612.4 6920.4 1838.3 486.36 Newhall 983.2 472.4 240.5 597.4 2363.1 482.6 1186.2 770.8 1469.9 860.9 2360.2 1751.8 643.77 Santa Nella 1339.3 924.5 217.3 1179.9 1981.7 526.4 1573 933.9 1412.9 563.3 8973.1 1749.5 729.98&9 Conejo 497.4 356.2 154.1 433.2 2731.9 310.9 721.1 572.5 938.3 513.8 3799 1367 610.910 Fresno 1061.2 1239.7 210.6 1194.4 3074 723.2 1282.9 782 1539.5 759.8 2276.7 1620.1 983.611 Sonoma 920.6 637.7 192.5 550.2 2435 309.7 1234.5 887.1 1841.1 653.4 6629.4 1798.9 50612&13 Van Nuys 665.7 774.5 192.5 846.9 1915.4 391.4 1008.3 720.2 1445.8 610.4 1992.2 1513.6 684.114 San Marcos 545.6 949.7 161 730.1 2433.7 437.3 751.3 543.8 1384.3 697.6 1775.7 1354.8 586.215&16 Irvine 648.7 955 181.6 883.4 3266.3 583.3 941.3 702.3 1040 519.3 2460.9 1757.8 57717&18 Hayward 506.5 581.5 182.6 451.7 2029.6 412.6 766.3 612.8 971.2 453.6 3746.7 1418 615.420 Loleta 1171.8 851.5 191.8 454.2 2888.7 461.2 2087.7 897.3 1731.3 669.1 6077.9 2354.2 389.421 Mojave 1197 413.7 139 444.2 705 297 1385.8 876.2 1414.3 544.9 5423.4 1266.2 443.122 Jeffrey 725.7 428.8 111.9 347.8 2119.6 301.8 933.5 835.9 1273 495.8 4894 1326.2 482.123 El Centro 787.3 370.1 164 321.8 2422 322.5 994.7 920 1295.2 685.6 4497.3 1607.1 355.724 Napa 584.5 627.1 145.5 529.8 2965 375.6 958.5 699.5 1410.6 449.4 2217.6 1359.7 324.625 Newberry 1464.4 675 112.4 641.9 1553.9 275.3 1632.4 1114.4 1940.8 1068.5 4503.5 1492.8 479.426 Cameron 656.8 460.1 174.8 641.7 1189.3 343.8 906.9 896.5 1061.2 480.3 5157.5 1215.7 305.727 Tracy 942.3 461.4 113.7 401 1111.4 271.1 1084.4 662.6 1069.9 504.4 5527 1191.3 497.628 Macdoel 1447 495.3 162.2 401.6 577.5 604.9 1688.9 909.2 1754 926.8 2559.6 1710.2 1045.229 Arco 1189.9 694.2 145.7 424.9 2492.3 428.3 1449.8 808.1 2090.6 839.4 4571.2 1281.8 992.730 Mt. Shasta 1374.4 552.4 174.4 338.5 699.3 435.9 1694.6 950.4 1290.7 722.4 2754.2 1608.7 882.131&32 Woodside 335.4 631.7 111.4 597.5 1815.6 292.5 676.4 683.1 974.1 450.8 8024.6 1129.3 300.433&34 Burlingame 456.9 696 171.6 603 3373.3 500.3 866.2 793.8 1097.3 469.8 4019.5 1509.7 629.935 Pacheco 907 557.9 152.5 777.3 302.6 418.1 1048.7 791.7 1240.1 545.9 3869.2 1222.9 53736 Los Banos 726.2 549.1 200 818.5 1992.6 418.4 936.7 668.2 1214.2 437 6919.2 1288.4 354.737&38 Elsinore 683.6 521.5 178.3 466.8 2721.4 362.9 858.3 623.7 1338.9 602.3 4605.1 1414.6 521.539 Redlands 887.4 690.9 210.9 662.8 2917.8 633.4 1336.5 1462.6 1978.2 1093.5 5859.7 1665.3 600.840 Cochella 991.2 399 171.5 382 2510.8 375.3 1027.7 791.5 1488.3 840.4 3142.7 1391.2 372.841&42 Vacaville 650.1 729.2 125.1 459.2 2438.4 454.9 941.2 639.1 1227.8 590.5 3156.5 1251.5 959.443 Cholame 998 559 118.7 449.2 942.6 423.3 1227.5 806.1 1396.1 630.7 8526.6 1488.4 40044 Banta 651.6 660.3 173.8 433.4 1491.7 412.7 822.3 652.2 1046.5 488.8 3267.8 1073.1 441.345 Carbona 836.4 575.4 147.9 531.1 1251.1 395.4 1041.1 793 934 426.9 8743.7 1211.3 707.146 Galt 838.9 566.7 145.1 468.5 1726.4 475.9 1132.6 726.3 1271.8 732.2 1266.3 1327.7 69547&48 Castaic 924.9 389.1 158.8 503.5 2111.2 417.4 1092.2 707.5 1116.2 501.6 4210.6 1375 625.549 Auburn 358.4 317.8 128.8 485.1 2945.3 284.5 734 916.3 836.9 416.3 3280.4 1243.7 349.550 Elmira 1118 771.3 120.8 474.3 2445 458.7 1394.9 975.9 1702.9 734.7 3872.1 1669.9 1211.251&52 WestSac 581.4 601.1 135.1 340.6 2082.5 375.5 770.5 551.9 1196.3 498.1 5203.6 1024 1640.9
I-4

55&56 Dublin 678.8 712.4 163.6 616.3 2838.7 557.6 977.6 765.9 1616.3 556.8 7862.2 1528.6 918.157&58 Pinole 633.9 933.6 194.3 677 1777.3 435.9 931.1 738.9 897.2 453.7 3257.1 1391 505.859&60 LA-710 713.8 649 153 212.8 2754.8 482.7 902.1 792.2 1789.8 716.8 2433.4 1559.1 920.661&62 Peralta 664.9 510.2 127.9 317.5 2677.3 419.5 762.2 524.7 1456.3 742.3 1508.1 1290.7 669.563 Murrieta 569.4 469.2 155.2 630.8 2566 332.6 843.5 609 1435 687.9 5125.7 1436.4 296.664 Foster City 506.6 718.3 138.6 685 2955.4 468.2 977.4 994.8 1586.2 534.1 1009.1 1589 1619.965 Piru 760 562.8 112 425.6 1136.6 422.8 942.4 882.8 1321.2 794 1798.2 1131.1 605.366 Calico 1136 770 117.9 567 1216.4 724.3 1400.8 921.4 1803.1 684.3 6406.2 1528 615.567 Devore 848.6 514.1 104.2 387.6 2068.3 417.7 1113 919.6 1504.7 699.7 2397.9 1383.8 479.968 Gilroy 668 614 135.7 409.7 2615.6 567.5 860.9 716.8 1257.1 542.9 5694.5 1435.1 973.669&70 Fontana 973 664 122.3 472.5 2799.4 438.3 1154 774.4 1572.2 715.8 3505.5 1360.5 622.571 Hinkley 1467 740.8 100.7 469.2 1441.4 444.8 1698.2 1018.8 1779.5 695.9 6223.1 1612.4 532.672 Bowman 1111.4 1037.3 110.5 650 2543.8 485.3 1484.9 1042.3 1427.5 669.7 3332.4 1468 94973 Stockdale 1099.1 739.4 143.7 388.3 2564.5 543.3 1250.2 808.1 1422.7 636.8 7032.9 1766.8 704.274 Bakersfield 843.5 564.4 168.8 378.4 2608.9 662.9 948.3 541 1398.5 613.8 3282 1180 849.475 Keyes 992.3 617.9 164.7 345.6 2437 494.5 1207.2 685.8 1605.1 694.5 1954.4 1443.5 677.976 Templeton 671 1000.6 110.3 600.8 2649.2 508.1 1059.7 1038.8 1653.4 704.6 2749.2 1635.6 62277&78 Colton 774.2 656.9 189.6 280.9 2662.6 497.1 1010.4 824.9 1374 650.4 6066.8 1503.1 56779&80 Artesia 529.8 615.5 187.2 361.9 2353.4 451.3 768.5 660.8 1482.4 595 4048.1 1431.1 724.881 Positas 579.2 644.4 229.1 563.5 1907.1 351 823.5 535.9 1167.3 556.9 3147.4 1459.9 447.582&83 Glendora 745.1 549.9 149.6 443.2 2128.2 404.6 979.2 683.3 1299.2 526.6 6572 1171.7 45184&85 Leucadia 501.2 529.5 152.4 445.8 2427.6 399 695.1 546.9 1091.1 530 3008.4 1439.6 588.786 Ukiah 936 1170 130.4 789 3201.5 487.5 1763.9 1233.2 1797.3 887.6 3719.1 1974.5 2498.987&88 Balboa 546 690.5 103 755.3 2820.1 498.2 1068 872.9 1807.5 626 9987 1618.6 944.789&90 Dekema 702.5 830.4 179.6 758.4 3591.5 614.5 1123.6 888.8 1590.5 1004.6 5825.6 1930.6 1526.591&92 Poggi 635.5 709.6 158.3 539.9 3075 528.9 1005.8 758.3 1330.1 1014.5 9908 1750.4 566.393 Lakeport 459.4 744 129.2 524 1870.7 410 1052.8 973.3 1293.1 785.2 4268.1 1335.1 506.994 Greenfield 810.6 725.9 108.7 417.3 2266.7 617.7 1148.1 1137.9 1060.5 511.9 1027.1 1219.3 556.195&96 Ontario 735.2 541.3 165 325.5 1906.6 569.1 931.1 1051.4 1337.4 686.2 1770.5 1488.4 871.597 Chino 615.9 480.1 130.7 403.7 2896.4 398.3 846.1 595.9 1330.1 599.2 8281.1 1308.6 374.298 Prado 572.1 787.1 133.3 526.4 2456.8 394.2 1023.4 816.7 1573.9 536.1 5330.2 1480.4 730.199 Tulloch 666.2 1124 81.8 584.8 2176.4 395.8 1224.9 425.7 1958 1222.8 3359.8 1459.3 1034.8100&101 Miramar 438.7 655.5 150.4 727.5 2299.3 394.4 803.2 565.7 1059.3 347 4122.6 1086.7 459.7
I-5